Embed Size (px)
Citation preview

CPB Discussion Paper
No 89
Globalisation and the Dutch Economy
A case study to the influence of the emergence of China and
Eastern Europe on Dutch international trade
Jessie Bakens and Henri L.F. de Groot
The responsibility for the contents of this CPB Discussion Paper remains with the author(s)

2
CPB Netherlands Bureau for Economic Policy Analysis
Van Stolkweg 14
P.O. Box 80510
2508 GM The Hague, the Netherlands
Telephone +31 70 338 33 80
Telefax +31 70 338 33 50
Internet www.cpb.nl
ISBN 978-90-5833-333-9

3
Abstract in English
This paper investigates the impact of the emergence of China and Eastern Europe as
increasingly important players on the world market for a small open economy such as the
Netherlands. We describe and compare in detail revealed comparative advantages across the
different country groups. This allows us to characterize the sectors in the Dutch economy that
are most likely to experience enhanced competition in the face of globalization. This analysis is
complemented with a gravity analysis that adds a second dimension to the competitive impact,
viz. the extent to which markets are localized as opposed to global. We conclude that the
overlap in revealed comparative advantages between China and the Netherlands is limited. The
major impact of the emergence of China for Dutch trade is that it is likely to foster the position
of the Netherlands as a gateway to Europe. Furthermore, we show that the overlap in
comparative advantage between China and Eastern Europe is relatively large, implying that
competition from Eastern Europe are likely to be stronger than from China.
Key words: revealed comparative advantage, gravity analysis, China, Eastern Europe,
globalization
JEL code: F01, F10, N70, O57
Abstract in Dutch
In dit artikel onderzoeken we de betekenis van het toenemende belang van China en Oost-
Europa op de wereldmarkt voor een kleine open economie als de Nederlandse. Ten eerste
beschrijven we het gebleken comparatieve voordeel van verschillende landengroepen. Dit stelt
ons in staat om de sectoren te identificeren die aan relatief sterke concurrentie bloot staan ten
gevolge van de tendens tot verdergaande globalisering. Vervolgens breiden we de analyse uit
door op basis van een graviteitsanalyse markten te karakteriseren als locaal versus globaal. Op
basis van deze analyse komen we tot de conclusie dat de overlap in comparatieve voordelen
tussen Nederland en China zeer beperkt is. De belangrijkste betekenis van de opkomst van
China is gelegen in de mogelijke versterking van de positie van Nederland als ‘gateway to
Europe’. Vervolgens laten we zien dat de overlap tussen de gebleken comparatieve voordelen
van China en de opkomende Oost-Europese landen relatief sterk is, wat betekent dat de
betekenis van de opkomst van China voor Oost-Europese landen veel sterker is.
Steekwoorden: comparatieve voordelen, graviteitsanalyse, China, Oost Europa, globalisering

4

5
Contents
Summary 7
1 Introduction 9
2 Background and theory 11
2.1 Revealed comparative advantage 12
2.2 Geographical distribution of exports 13
3 Data and operationalisation 15
3.1 Data 15
3.2 Operationalization 15
4 Results 17
4.1 Specialization 17
4.2 Absolute comparative advantages and trends: The Netherlands 18
4.3 Absolute comparative advantages and trends: China and the EUnmc 21
4.4 Relative comparative advantage 30
4.5 Geographical distribution of Dutch and Chinese exports 34
5 Conclusion 39
Annex A SITC product groups classification 45
Annex B Dutch RCA change between 1962-2000 and 1990-2000 47
Annex C Absolute changes in RCA at the 4-digit level for the Netherlands 49
Annex D Results Gravity analysis at the 2-digit level for the Netherlands and China 51
Annex E Geographical destination of Dutch and Chinese strong export sectors 55


7
Summary
In recent years, the fear for globalisation has intensified in the Netherlands, partly driven by the
emergence of countries like China and India and the recent and upcoming enlargements of the
European Union towards the East. In this paper we take a stand on the influence of globalisation
on the Dutch competitive position in world trade, with a special focus on the emergence of
China and Eastern Europe. This is done by focusing on two distinct concepts that explain
separate dimensions of trade patterns, namely comparative advantage and geographical
distribution of exports. The concept of comparative advantage sheds light on the driving forces
behind Dutch international trade and specialization patterns. By comparing the Chinese and
Eastern European comparative advantages with those of the Netherlands, we can identify the
potential threat of these countries’ exports for the position of Dutch sectors on international
markets. The geographical distribution of export patterns essentially characterizes markets in
terms of the extent to which these markets are global (as opposed to localized). This dimension
is relevant since the likely impact of globalisation on the Netherlands evidently also depends on
the extent to which exports of, for example, China and Eastern Europe, are destined for the
same markets as Dutch exports.
We have identified three important clusters in the Dutch export patterns, namely the flowers
and bulbs cluster, the agriculture and food cluster and the chemical cluster. The strength of
these clusters is rather persistent over time (viz. over the period 1980-2000). The underlying
factors explaining the success of these clusters are primary products and technology. It is
interesting to note that these products are distinctive for the Dutch comparative advantage in
world trade and that the Netherlands is an important contributor to the world exports in these
products. The products that add most value to the total Dutch export magnitude though, do not
belong to these three clusters. These are products like electrical machinery and office machines.
The fact that the important products out of the Dutch national export- basket are different than
the products with which the Netherlands distinguishes itself in terms of comparative advantage
in world trade is explained by the role of the Netherlands as a transit port for Europe.
Both China and the Eastern European countries are economies in transition and are
characterized by export patterns that substantially differ from those of the Netherlands. China
mostly exports goods that are unskilled labour-intensive such as clothes, footwear and travel
goods, but also goods out of the consumer electronics cluster like electrical machinery, office
machines and photo, video and audio apparatus. So the underlying factors of China’s export-
basket are unskilled labour and technology. At the world level, China is a major exporter of
unskilled labour intensive products, while for the Chinese export-basket, more technologically
sophisticated products add most value. The somewhat surprising combination of unskilled
labour intensive production and technologically intensive production in China reflects the

8
strong position of China in assembling consumer electronics (instead of really producing these
products). All Chinese export products are destined for a global market and especially the
consumer electronics since the relatively distant developed countries buy these products most
intensively.
Like the Chinese export pattern, also the export pattern of the Eastern European countries
shows little overlap with the Dutch export pattern. The Eastern European countries export
goods that are classified by materials like cork, wood and rubber and machinery and transport
equipment. The factors underlying Eastern European exports are thus natural resource-based
products and technology. Eastern Europe exports goods from the agriculture and food cluster,
but the strength of that cluster in Eastern Europe is not nearly as great as that in the
Netherlands. We found no sound evidence that the Eastern European countries are more natural
trading partners for the Netherlands than China, at least not for products in which both Eastern
Europe and China have a relatively strong comparative advantage. From those products, the
Netherlands imports the more easily shipped products like clothes, footwear and travel goods
from China, while goods like wood, cork and coal are imported from Eastern Europe.
In this research, we have thus found that globalisation does not threaten the strength of the
Dutch export position in the traditionally strong agriculture and food cluster, the flower and
bulb cluster and the chemical cluster. Furthermore, due to globalisation and the re-allocation of
production, the Dutch position as a transit port for Europe is likely to intensify. So both the
position of the Netherlands as a producer and as a trading nation has not been negatively
influenced by globalisation over the past twenty years. This is of course not to say that
globalization has not substantially affected the Dutch economy, although not in a negative way.
The example of consumer electronics may be useful to illustrate this. Consumer electronics are
now mostly produced outside of the Netherlands and are re-exported by the Netherlands. The
fact that the Netherlands is loosing its position in the production of consumer electronics is to
an important but not exclusive extent due to the emergence of China and Eastern Europe.
Slicing up of the value chain results to an increasing extent in the production of different parts
of those goods located in different countries. For these products, it is increasingly the case that
the technological development is located in a different country than the manufacturing and
assembling of the parts. Sectors or firms that are not tied to one place and to local clusters can
easily re-allocate production to low labour cost countries and are therefore not likely to provide
a long lasting comparative advantage even for the low labour cost country. For the Netherlands,
loosing the production in these sectors to low labour cost countries requires some adjustment on
the micro level, but is not something to seriously worry about on a macro level.

9
1 Introduction
In recent years, the fear for globalisation has intensified in the Netherlands with the emergence
of countries like China and India and with the recent enlargements of the European Union
towards Eastern Europe. In this paper we take a stand on the influence of globalisation on the
position of the Dutch economy on world markets, with a special focus on the emergence of
China and Eastern Europe. The emergence of China is of particular interest in this context,
given the scale and scope of China as well as its unprecedented rapid transition and persistently
high growth rates over the past two decades. This is probably the major reason why China is
often seen as such a threat in the popular press. The Eastern European countries are interesting
for slightly different reasons. First, the proximity of a large group of emerging economies with
low labour costs and with an improving institutional quality based on the European Union
model, makes trade with these countries and reallocation of activities to these countries a
potentially attractive investment for Dutch firms. Furthermore, the developments in those
countries and their integration in the global economy is also likely to intensify their trade
relationships with countries outside Europe with potentially important implications for the
Netherlands given its geographically unique location and its potential role as ‘gateway to
Europe’, but also as a European gateway to the rest of the world.
In order to investigate the impact of the emergence of China and Eastern Europe on the
evolution of Dutch trade patterns, we empirically characterize and compare sectoral and
geographical features of the Dutch, Chinese and EUnmc international trade patterns over twenty
years from 1980 to 2000.1 We have done this by focusing on two distinct concepts that explain
separate dimensions of trade patterns, namely comparative advantage and geographical
distribution of exports. The concept of comparative advantage sheds light on the driving forces
behind Dutch international trade and specialization patterns. The geographical distribution of
export patterns characterizes markets in terms of the extent to which these markets are truly
global (as opposed to localized). This dimension is relevant since the likely impact of
globalisation on the Netherlands evidently also depends on the extent to which exports of, for
example, China and the EUnmc, are destined for the same markets as the Dutch exports. Our
analysis reveals that the impact of the emergence of China and Eastern Europe on Dutch trade
relationships over the past two decades has been modest. Comparative advantages are fairly
persistent over time and show little overlap with China and Eastern Europe.
This paper proceeds as follows. Section 2 briefly discusses the theoretical background for this
study, focusing on the concept of comparative advantage and the gravity model. Section 3 1 This period is partly chosen since 1980 marks an important turning point in China with the start of economic reforms (see
Suyker and de Groot, 2006, for a brief summary of the economic history of China and the key reforms that have lead to the
transformation of China into an increasingly recognized player on the global markets). The choice for the final year is largely
driven by data availability.

10
contains a description of the data used for the analysis and the operationalisation of the concepts
used in our research. Section 4 describes the results. These are presented by first focusing on the
absolute comparative advantages of the Netherlands and secondly on the relative comparative
advantages of the Netherlands (viz. relative to China and the new member countries). We aim
to explicitly distinguish between a comparative advantage in production and a comparative
advantage in trade. This distinction is relevant given the huge share of re-exports in total Dutch
exports. Section 5 concludes.

11
2 Background and theory
The concept of comparative advantage – which goes back to the seminal work of David Ricardo
– is central in any discussion of a country’s specialization pattern and trade relationships.
According to economic theory, a country will export the good for which it has a comparative
advantage, even if that country has an absolute disadvantage in producing the good. According
to the concept of comparative advantage a country produces a good if the opportunity cost of
producing that good in terms of other goods is lower in that country than it is in other countries
(Feenstra, 2004, pp. 1-3). This leads to the important insight that trade patterns are determined
by comparative advantages, while wages across countries are determined by absolute
advantages (Feenstra, 2004, p. 4). In other words, under free trade, less productivity should be
reflected in lower wages. Low wages lie at the heart of the comparative advantage of most
emerging economies.
In China’s case, low wages are important, but other than that, China has achieved a stellar and
rapid economic growth in a rather unorthodox way. It is interesting to briefly discuss this
unorthodox Chinese economic growth because it sheds light on the processes that take place in
that country. Rodrik (2006) concludes from his research on China’s exports, that China
established an export-basket that is significantly more sophisticated than would normally be
expected for a country at its income level. In general, countries need to generate investments in
higher-productivity tradables2 in order to establish rapid economic growth (Rodrik, 2006). But
even for these standards China has performed outstandingly well. Rodrik provides various
explanations for this achievement such as the possibility that the large size of the Chinese
economy provides scope for policy experimentation and the concomitant Chinese experimental
gradualism of economic development. Additionally, the Chinese government was very focused
on facilitating the accumulation of foreign direct investment by providing special economic
zones and simultaneously on letting foreign firms cooperate with domestic ones. Gaulier et al.
(2005, 2006) provide a different explanation for China’s anomalous export-basket. They argue
that China is able to export sophisticated products because of international processing activities,
based on inputs imported from Asian countries. To be more specific, companies and firms
located in the industrialised countries of Asia (Japan, South Korea, Taiwan, Singapore and
Hong Kong) have moved the unskilled labour-intensive parts of their production processes of
rather technologically intensive products and their concomitant trade networks. This has made it
possible for China to upgrade its industrial capacity and develop a comparative advantage in
manufacturing. We turn to this issue in Section 4.
The Eastern European countries are characterized by less extreme growth rates in the period
following the abolishment of the communist regimes in the early 1990s. Most of the EUnmc 2 See also theory on export-led growth in for example McCann (2001).

12
have struggled to (re)gain economic prosperity and have worked hard to reform the economy to
meet the European Union criteria for accession. But like China, one of the most important
factors underlying the comparative advantages of the EUnmc is low labour costs. Their
proximity to Western Europe might leverage this factor.
In the remainder of this section, we will discuss two empirical concepts that will be used in the
remainder of this study to shed light on the impact of developments in China and Eastern
Europe on Dutch trade relationships.
2.1 Revealed comparative advantage
Comparative advantage starts from intercountry differences in the efficiency of individual
industries and takes labour productivity as a proxy for efficiency (Balassa, 1965, p. 102). In a
practical sense, calculating a country’s comparative advantages gives rise to some
methodological problems because comparative advantages “appear to be the outcome of a
number of factors, some measurable, others not, some easily pinned down, others less so”
(Balassa, 1965, p. 116). One of the most popular3 indices of comparative advantage is the
revealed comparative advantage (RCA) index by Balassa (1965) that is focused on products of
manufacturing industries. The Balassa index takes the observed pattern of trade as a starting
point (Balassa, 1965, pp. 116-117) and is based on the notion that comparative advantages
reflect relative costs as well as differences in non-price factors (Balassa, 1965, p. 102). The
Balassa index gives the exports of a certain product/sector (indexed j) by a country (indexed i)
as a share of the total export of that country divided by the share of the export of that sector in
the total export of a reference group (indexed w). The revealed comparative advantage given by
the Balassa index (BI) is as follows:
JjIi
XX
XX
XX
XX
BI
tw
t
jtw
jti
tw
jtw
ti
jti
jti ∈∈== ,,
,
,
,
,
,
,
,
,
(2.1)
Where jtiX , is country i’s exports in sector j in period t and j
twX , is the export in sector j in
period t of a relevant reference group, I is the number of countries considered, J captures the set
of products/sectors considered, ∑≡j
jtiti XX ,, and ∑≡
jj
twtw XX ,, . An RCA value
between zero and one indicates that a country does not export large amounts of a certain
product relative to what all other countries of the reference group export of that product. If the
index for a product is above one, a country is said to have a comparative advantage in the
production of that product because that country exports large amounts of that product relative to
3 Its popularity clearly stems from the fact that empirical research has pointed out that it is one of the best performing
indicators of RCAs of countries (Hinloopen and Van Marrewijk, 2005; Vollrath, 1991; Yeats, 1985).

13
the reference group. The numerator of the Balassa index gives a ratio of the export share of the
sector in the total national exports of a country. This ratio thus captures the size of a sector in its
country’s export basket. It is possible that a country has an RCA in a sector exceeding one, but
that the sector has a relatively small share in the total national economy. Since the Balassa
index shows the importance of a country’s export of a particular sector for the world exports of
that particular sector, national and international importance of a sector can diverge. A different
way of writing the index (used by Jacobs and Lankhuizen, 2006), is by taking the ratio of a
country’s export of a product in the world export of that product. This clearly also shows how
large that country’s export share is in world exports of that product.
Care is required in interpreting the specific value of an RCA, since its interpretation is strictly
limited to comparison within the same sectors among countries used in the analysis (Yeats,
1985, p. 62). A Dutch RCA of 8 for flowers is, for example, clearly indicative for the Dutch
position in the world (viz. reference group) exports of flowers and shows how specialised the
Netherlands is in exporting flowers. It is to be kept in mind, however, that the value of the RCA
depends on the concentration of the sector in the group of reference countries. For sectors that
are concentrated in a few countries in the reference group, the RCA tends to be very high
(Yeats, 1985:pp. 62-63) and the group of reference countries chosen in the research is thus a
determinative factor in the outcomes of a RCA analysis.4
The next step in our analysis focuses on the importance of identifying the geographical scope of
export markets for the sectors in which the Netherlands has a comparative advantage and
whether this has changed or not due to globalisation. Therefore, we describe the theory behind
the concept of the geographical location of trading partners in the next subsection.
2.2 Geographical distribution of exports
For an adequate interpretation and comparison of trade data, geographical factors matter
(Anderson, 1979; Anderson and Van Wincoop, 2004; Eichengreen et al., 2004; Feenstra,
2004:144). For example, China’s trade in intermediate goods is heavily concentrated on Asia,
indicating that product sharing is above all a regional process (Gaulier et al., 2005). Therefore
as for now, the most radical economic change due to the emergence of China has taken place in
Eastern Asia and not (yet) in the Western world. As far as the Netherlands is concerned, its
single most important trade partner (both for imports and exports) is Europe (the other 14
members of the European Union) (Gorter et al., 2005).
There are many different ways to measure the geographical distribution of exports. One can
look at the export-weighted average distance per product to characterize a sectoral group as 4 See for example the paper by Richardson and Zhang (1999) on the RCAs of the United States.

14
being either locally exported or globally. This measure is simple, but a drawback of this method
is that it does not reveal the destination markets of the products. If, for example, half of the
exports are shipped far away and half of the exports to the neighbouring country, this measure
suggests that the exports are (on average) shipped to a location somewhere in between the
destination markets. One can also look at the fraction of products that are exported within a
certain distance from the exporting country. This measure reveals very accurately how much of
the exports are exported within certain kilometres from the exporting country, and is therefore
very informative. A drawback, however, is that the fewer distance cut-off points one takes, the
less informative this measures becomes. Ideally, one would like to have a single measure that
indicates the sensitivity of exports to distance. The distance decay effect is such a measure and
is the estimated distance coefficient of the gravity equation by Jan Tinbergen, inspired by the
gravity equation known from physics.
The gravity equation relates the size of international trade flows to the GDP (mass) of (two)
countries and their physical distances (Brakman et al., 2001, p. 267). Underlying the equation is
the assumption of complete specialization in different product varieties across countries
(Feenstra, 2004, p. 145). If the gravity equation is used in this basic form, the assumption of
free trade, identical and homothetic demand across countries is made. This means that all
countries have identical prices. The equation in its basic form is:
ijijjiij distGDPrealGDPrealsitc εβββα ++++= )log()_log()_log()exp_log( 321 (2.2)
where 3β captures the distance decay effect. More proximate countries are more likely to trade
with each other and countries with higher GDPs are more likely to trade with each other.
Distance is not only proxies for transportation costs, but also for similar languages, institutions
and so on, and so forth, that facilitate bilateral trade. GDP is a proxy for the demand for goods.
One can imagine that for certain goods the purchasing power or the elasticity of demand is
much more important for determining trade flows than overall GDP. For example, luxury goods
will be shipped mostly to countries with a high GDP per capita and for a country like China;
these countries are far away rather than close. Including GDP per capita into the equation can
therefore be very informative.
The gravity equation is applicable in the analysis of many different specifications of trade
theories. Some scholars find this a drawback of the gravity equation. Deardorff (1995) on the
other hand, stresses that the applicability of the gravity equation to many different trade theories
provides the theory with its exceptional strength in explaining observed trade patterns. It is
therefore a good addition to our research.
15
3 Data and operationalisation
3.1 Data
The trade data that we used for our analyses are based on an extensive database of bilateral
trade data with detailed information on different commodities covering the period from 1962 to
2000 (Feenstra and Lipsey, 2005).5 To construct the trade data for all countries in the world
between 1962 and 2000, Feenstra and Lipsey (2005) relied on import and export data (Feenstra
et al., 2005). They used reported import data to construct the data on exports. Information
collected by the importer is usually viewed as more accurate than that collected by the exporter,
because the importer is often collecting tariff revenues and therefore has an incentive to record
imports accurately (Feenstra et al., 1999, p. 338). If the import data were missing, they used
export data. Data based on imports are c.f.i. and data based on exports are f.o.b.6 Feenstra and
Lipsey (2005) constructed the data on a 4-digit standard international trade classification (SITC)
revision 2 mode. The table of the SITC 2-digit classification is given in Annex A. For the
calculation of the gravity equation, we combined the trade data used for the RCA analysis with
data about geography and distance from the CEPII7 (Centre d’Études Prospectives et
d’Informations Internationales, Gaulier et al., 2005), data about GDP, GDP per capita, GDP per
worker and population from both the Penn World table 6.1 (Heston et al., 2002)8 and from the
World Development Indicators (2006) from the World Bank.
3.2 Operationalization
For the RCA analysis of this research, we have considered China as an aggregate of China,
Hong Kong, Macau, China FTZ, China SC and China NES. We have chosen to take the world
as a reference group since this is the most objective benchmark for comparing the strength of
the Netherlands in international trade.9 We have analysed the comparative advantage by first
looking at RCAs at a 2-digit level. At the 2-digit level, the RCA changes of 2000 with respect to
1980 were considered for the Netherlands, China and Eastern Europe as EUnmc.10 To see if the
Netherlands has a comparative advantage in the same products as relevant other countries, we
5 Data to be found at: http://cid.econ.ucdavis.edu/data/undata/undata.html. 6 c.f.i. means that the value of the product includes the costs of exporting that good, namely cost, freight and insurance
included. This is a higher value than the free on board, f.o.b., value which is only the value of the product. 7 Data to be found at: http://www.cepii.fr/anglaisgraph/bdd/distances.htm. 8 Data to be found at: http://pwt.econ.upenn.edu/php_site/pwt_index.php. 9 The dataset gives data for individual countries and for the world as an aggregate. Since the sum of all the exports and
imports of individual countries does not match the given world total, we performed the analysis by summing over all
individual countries to get the world total. 10 EU new member countries are: Czech Republic, Hungary, Poland, Slovakia, Malta, Estonia, Latvia, Lithuania, Slovenia
and Cyprus. From 1962 to 1992, data for the former Czechoslovakia is used.

16
extended the analysis with a 4-digit analysis.11 We have also looked at the factor intensity of
exports by using the factor intensity classification at the 3-digit SITC revision 2 level by
Hinloopen and Van Marrewijk (2006).12 Hinloopen and Van Marrewijk use five categories, viz.
primary products, natural-resource intensive products, unskilled-labour intensive products,
technology intensive products and human-capital intensive products.
For the analysis of the geographical destination markets of the exports, we have characterized
the SITC sectors for the Netherlands separately as either being global or local. In order to
characterize export sectors as either being global or local, we performed a ranking analysis
based on the results of the gravity analysis, the export-weighted average distance per product
and the fraction of products with destination markets within a predefined distance from the
Netherlands. The gravity analysis is performed with the SITC 2-digit data for GDP, GDP per
capita and geographical distance. For the Netherlands a distance decay coefficient of smaller
than –0.9 is considered to be indicative for a ‘global’ market, whereas for China13 markets a
distance decay parameter smaller than –1 are considered being ‘global’. If Dutch exports have
an export-weighted average distance per product of smaller than 1,350 kilometres, the market
for this product is considered to be ‘local’, whereas for China local markets are those for which
the export-weighted average distance is less than 5,000 kilometres. For the fractions of products
that are exported within a predefined distance from the Netherlands (or China), we have
classified the destination of exports and origin of imports per sector into six categories. These
categories are less than 2,500 kilometres, between 2,500 and 5,000 kilometres, between 5,000
and 7,500 kilometres, between 7,500 and 10,000 kilometres, between 10,000 and 12,500
kilometres and farther than 12,500 kilometres. An export fraction of 89% with destination
market within 2,500 kilometres from the Netherlands is considered local for the Netherlands
and an export fraction of 50% with destination market within 2,500 kilometres from China is
considered local for China. The exact boundaries for global and local exports are chosen
somewhat arbitrarily, but in choosing the boundaries we aim to do justice to the small scale of
the Netherlands and Europe and the large scale of China and Eastern Asia in our attempt to
ultimately identify the economic dependency of China and the Netherlands on, respectively,
Eastern Asia and Europe, as their local markets.
11 Since the number of products at the 4-digit level is close to 1,000, it is of no use to construct graphs that depict all
products. 12 Based on a classification of UNCTAD/ WTO by Hinloopen and Van Marrewijk. To be found at:
http://people.few.eur.nl/vanmarrewijk/eta/intensity.htm. 13 China is considered without Hong Kong, Macau, FTZ etc.

17
4 Results
We begin the discussion of the results with different interpretations of the RCA analysis. With
the RCA analysis we can identify a country’s specialisation pattern and the trends and absolute
levels of the comparative advantages of the sectors underlying the specialisation pattern. These
patterns describe which sectors determine the Dutch export-basket. By comparing the Dutch
export-basket with those of China and the EUnmc, we shed light on the probable substitutability
of the Chinese, EUnmc and Dutch exports. We also look at the impact of the emergence of
China on Asian countries by looking at Japan and Thailand and the position of the Dutch
exports in European Union (the 15 members minus the Netherlands). We present the relative
comparative advantage by giving a comparison of the export-baskets of all these countries in
combination with identifying the geographical export markets of the Netherlands.
4.1 Specialization
The specialization of the Dutch export basket is rather close to the average specialization in the
world. Figure 4.1 illustrates this by a Lorenz curve with the cumulative world export shares and
the Dutch (or Chinese or EUnmc) cumulative export shares in 1980 and 2000, sorted for the
values of the RCAs of tradable at the SITC 2-digit level. The slope of each line segment of the
Lorenz curve equals the RCA of the sector under consideration, starting with the sector with the
highest RCA at the left-bottom end in the graph and ending with the lowest RCA at the right-
top end in the graph. The Dutch export specialization can be explained by the fact that the
Netherlands is a small country that does not have a balanced resource endowment and does not
produce most industrial goods itself (Balassa, 1965).
China has a specialised economy that deviates much from the world average specialization. A
likely explanation for this sector specialization is that, since the lions’ share of world trade is
between the most developed countries, the world export average, (viz. the reference group used)
is biased towards the export-baskets of the developed countries and is thus likely to be quite
technologically sophisticated. In this sense, the deviation of China is not surprising. The
convergence of the Chinese Lorenz curves towards the world average shows that China became
less specialized between 1980 and 2000 caused by the fact that the highest RCAs have
decreased. Hinloopen and Van Marrewijk (2004) reach the same conclusion for China based on
more disaggregate data. The Netherlands has had a far smaller decrease in sectoral
specialization, although the Dutch economy already was less specialized than the Chinese and
EUnmc economies in 1980.
It is remarkable to see that the EUnmc are not all that specialized and that their specialization
pattern looks much more like the world’s specialization pattern than China’s specialization

18
pattern. A likely explanation is that a cluster of countries taken together (viz. a large country)
always is far less specialised than a single (i.e. small) country. If one compares the EUnmc
block with China, China is still the larger country though, indicating that the EUnmc indeed as a
block is far more technologically developed than China. In combination with relatively low
wage costs and the proximity of the EUnmc, this suggests that the EUnmc is more interesting
for Dutch investments than, for example, China.
The Lorenz curves that we have discussed so far show the levels of the specialization in
combination with the size of the sector in the export of a country. As a next step, it is interesting
to know which exact sectors determine the specialization pattern of the Netherlands and
whether these sectors are the same for China and the EUnmc. In the next step of the analysis,
we identify these sectors by focusing on the trend in RCAs between 1980 and 2000 and the
levels of the RCAs per sector in 2000.
4.2 Absolute comparative advantages and trends: The Netherlands
The sectors and trends underlying the specialisation pattern of the Netherlands are depicted in
Figure 4.2 where the RCA changes at the 2-digit SITC level between 1980 and 2000 are
depicted.14 This figure shows a fairly high degree of persistence in the comparative advantages
for the Netherlands, because the RCAs are distributed close to the 45˚ line.15 The axes are log-
transformed so as to make the relative deviation from unity equal for positive and negative
deviations. The figures for 1990-2000 and 1962-2000 in Annex B subscribe to the Dutch
persistence in comparative advantages. This is consistent with other research that concludes that
RCAs tend to be fairly persistent over time (Balassa, 1965; Hinloopen and Van Marrewijk,
2005).
14 We have applied a logarithmic transformation of the axes, since a linear representation of RCA values complicates the
interpretation of the results. For example, an RCA of 0.1 deviates equally much from 1 in relative terms as an RCA of 10. On
a linear scale, this is not visualized and the deviation on the positive side seems much larger than equally strong (relative)
deviations on the negative side. A logartithmic transformation of the axes avoids this problem (see Laursen, 1998; Vollrath,
1991; and Yeats, 1985 for a more extensive discussion of this problem and possible solutions). 15 The axes of this graph do not have the same numerical distribution as the other ones, for reasons of clarity for reading the
classification. Considering this, the Dutch RCA is much more persistent than the Chinese and EUnmc RCAs.

19
Figure 4.1 Sectoral specialization in 1980 and 2000 for the Netherlands, China and the EUnmc
Netherlands China
0.0
0.2
0.4
0.6
0.8
1.0
0.0 0.1 0.2 0.3 0.4 0.5 0.6 0.7 0.8 0.9 1.0
Cumulative share world
Cumulative share
Netherlands
1980 2000
45˚
0.0
0.2
0.4
0.6
0.8
1.0
0.0 0.1 0.2 0.3 0.4 0.5 0.6 0.7 0.8 0.9 1.0
Cumulative share world
Cumulative share China
1980 2000
45˚
EUnmc
0.0
0.2
0.4
0.6
0.8
1.0
0.0 0.1 0.2 0.3 0.4 0.5 0.6 0.7 0.8 0.9 1.0
Cumulative share world
Cumulative share
EUnmc
1980 2000
45˚
Source: Own calculations based on Feenstra and Lipsey, 2005, SITC rev.2 2-digit.
The six different planes (indexed from I to VI) in Figure 4.2 depict the direction of the change
in comparative advantage during the twenty years considered. Plane I depicts the sectors that
changed their comparative advantage from weak to strong during these years. Plane II
represents the RCA of sectors that were already strong and had an increase in RCA. Plane III
depicts the RCAs of sectors that were strong but decreased in RCA. Plane IV depicts the sectors
that decreased in RCA from strong to weak. Plane VI depicts the weak product groups with an
increase in RCA and plane V depicts the weak product groups that declined even further in
RCA.
The RCA trend between 1980 and 2000 reflects the Dutch sustained strength over 20 years in
products in the agriculture and food cluster (SITC00 to SITC09), the animal and vegetable oils
(SITC41, SITC42, SITC43), the chemical cluster (SITC50 to SITC59) and in flowers and bulbs
(SITC29). The RCA of flowers and bulbs has increased from 5.95 in 1980 to 8.08 in 2000. At
the 4-digit level, the RCA of bulbs was 13.98 in 1980 and 16.46 in 2000. The RCA of cut

20
flowers increased from 13.64 in 1980 to 15.17 in 2000. Annex C gives an overview of the
largest and smallest absolute changes in RCA values at the 4-digit level between 1990 and
2000, 1980 and 2000 and 1962 and 2000.
Other Dutch sectors that appear to be rather strong and that have had an increasing RCA
between 1980 and 2000 are beverages (SITC11), tobacco (SITC12), hides and skins (SITC21),
crude fertilizers (SITC27), photo apparatus (SITC88) and office machines (SITC75). The
increase in the RCA of office machines (SITC75) is due to the increase in the RCA of digital
office machines at the 4-digit level since 1990. The comparative advantage in beverages
(SITC11) is due to beer made from malt with a RCA of 8.21 in 2000, which is the second
highest RCA for this product group in the world.
Figure 4.2 RCA in 1980 and 2000 for the Netherlands
0
1
2
34
5
6
7
8
9
11
12
21
22
23
25
26
27
28
29
32
3334
35
41
42
43
51
52
5354
55
56
57
58
59
61
62
63
64
65
66
6768
69
71
72
73
74
75
76
77
78
79
81
82
83
84
85
87
88
89
93
94
95
0.1
1
10
0.1 1 10
RCA Netherlands 1980
RC
A N
ethe
rland
s 20
00
III
III
IV
V
VI
One product at the lowest end of the RCA distribution has been left out for ease of presentation.
Source: Own calculations based on Feenstra and Lipsey (2005), SITC rev.2 2-digit.
Annex A gives an overview of the meaning of the sector numbers used as labels in the Figure.
Of the sectors that experience a declining RCA between 1980 and 2000, some examples are
telecommunication, audio and video apparatus (SITC76), electrical machinery (SITC77), gas
(SITC34), prefabricated buildings (SITC81), textile yarn (SITC65) and nonferrous metals
(SITC68). The reason for the decline in the comparative advantage of electrical machinery at
the 2-digit level for the Netherlands becomes strikingly clear by looking at the 4-digit SITC
level (see also Annex C). The decline in the RCA in electrical machinery is due to an enormous
decline in the RCA of shavers & hair clippers with motor from an RCA of 22.72 in 1980 to a
RCA of 10.65 in 2000. An RCA of 10.65 in shavers & hair clippers with motor is still the
21
highest RCA for this product group in the world. The other 4-digit SITC group that is
responsible for the decline in electrical machinery is electrical filament lamps and discharge
lamps, which declined from a RCA of 6.77 in 1980 to a RCA of 2.41 in 2000.
This analysis shows that the Dutch export pattern has been rather stable over the past 20 year
and that the strong sectors, mainly in the agriculture and food, chemical and flower and bulb
cluster, are persistent. Some sectors in decline are connected to some Dutch internationally
well-known firms that have most probably reallocated their production of these goods in other
parts of the world that have lower labour costs.
Since the Dutch competitive position in world trade has not changed much on a macro-level, we
will, as a first step, discuss the export patterns of China and the EUnmc in order to indicate the
most important sectors of their export baskets and to see if these products have threatened the
Dutch export position in the past or might potentially threaten the Dutch export position in any
way in the future. The next step will be to identify the factors underlying the comparative
advantages of the identified sectors. In order to identify these factors we have re-classified the
exports according to factor intensity and looked at Dutch re-exports.
4.3 Absolute comparative advantages and trends: China and the EUnmc
The change in RCA between 1980 and 2000 for China shows that China witnessed a moderate
change in comparative advantages within these years and became somewhat less specialized in
2000. The deviation of the sectors from the 45˚ line shows that the Chinese RCAs are not very
persistent. For China, the unskilled-labour intensive manufacturing cluster (SITC80 to SITC85
and SITC89), with products like furniture, travel goods, apparel and footwear, is strong but has
both increasing and decreasing RCA values. The RCA in prefabricated buildings (SITC81) and
footwear (SITC85) increased. The RCAs in miscellaneous manufactured articles (SITC89),
travel goods (SITC83), textile fabrics (SITC65) and apparel and clothing (SITC84) have
decreased enormously, but are still quite strong and important for China’s exports.

22
Figure 4.3 RCA in 1980 and 2000 for China
1
2
3
45
6 78
9
11
12
21
22
23
24
25
26
27
28
2932
33
41
4243
51
52
53
54 55
57
58
59
61
62
63
64
65
66
6768
69
71
72 73
74
75 76
77
7879
81
82
83
84
85
87
88
89
93
94
95
96
0.01
0.1
1
10
100
0.01 0.1 1 10 100
RCA China 1980
RC
A C
hina
200
0
III
III
IV
V
VI
Source: Own calculations based on Feenstra and Lipsey (2005), SITC rev.2 2-digit.
Three products at the lowest end of the RCA distribution have been left out for presentation.
Annex A gives an overview of the meaning of the sector numbers used as labels in the figure.
China experienced an increase in comparative advantage in sectors of higher technological
sophistication like office machines (SITC75) and electrical machinery (SITC77), and a
decreasing RCA in telecommunication, audio and video apparatus (SITC76) and photo
apparatus (SITC88), although still exceeding 1. The growth in these sectors is especially rapid
between 1990 and 2000. Of the sectors with an increasingly strong RCA, coal (SITC32),
inorganic chemicals (SITC52), and cork and wood manufactures (SITC63) are examples. Of the
group of strong but declining RCAs, the RCA in plastics in primary forms (SITC57) was 6.47
in 1980 and 5.57 in 2000, which is the third highest RCA in the world. The most important
product group at the 4-digit level is pyrotechnic articles. This group had the highest RCA (equal
to 14.14) of China in 2000. China’s declining but still strong comparative advantage in crude
animal and vegetable materials (SITC29) is based on plants and seeds used for pharmacy and
plaiting.
The EUnmc also became less specialized between 1980 and 2000 and is typically good in the
production of goods that are classified by materials (SITC60 to SITC69) like rubber, cork and
wood, and non-metallic mineral manufactures. The EUnmc also has high RCAs in furniture
(SITC82) and prefabricated buildings (SITC81). Between 1980 and 2000 the RCAs of plastics
in primary forms (SITC57), power generating machines (SITC71), general industrial machinery
(SITC74), electrical machinery (SITC77) and road vehicles (SITC78) have increased. So in the
SITC70 group, that of machinery and transport equipment, the EUnmc has increased its

23
comparative advantage. The RCAs in cheap labour manufactures like footwear (SITC 85) and
articles of apparel and clothing (SITC84) have decreased and the EUnmc does no longer have a
revealed comparative advantage in these goods, as like for travel goods (SITC83), organic
chemicals (SITC51) and beverages (SITC11).
Figure 4.4 RCA in 1980 and 2000 for the EUnmc
0
12
34
56
78 9
11
12
2122
23
24
25
26
2728
29
32
33
34
35
41
42
435152
535455
56
57
58
59
6162
63
64 656667
68
6971
72
737475
76 77
78
79
81
82
83
84
85
87
88
89
93
94
95
96
0.01
0.1
1
10
100
0.01 0.1 1 10 100
RCA EUnmc 1980
RC
A E
Unm
c 20
00
I II
III
IV
V
VI
Source: Own calculations based on Feenstra and Lipsey (2005), SITC rev.2 2-digit.
Annex A gives an overview of the meaning of the sector numbers used as labels in the figure.
The trend analyses of the RCAs for China and the EUnmc clearly reveal that both countries
have become somewhat less specialized. Both countries have developed strength in other
groups than the cheap labour manufactures. For China this pattern is very evident because on
top of its strength in the unskilled-labour intensive manufacturing cluster (SITC80 to SITC85
and SITC89), it also became strong in the production of some more technologically intensive
products like office machines, electrical machinery and telecommunication, audio and video
apparatus. The group of technologically sophisticated goods (electrical machinery, office
machines and telecommunication, audio and video apparatus) that we identified in this analysis,
corresponds with what many scholars call China’s strength in exporting consumer electronics16
(Adams et al., 2004; Gaulier et al., 2005, 2006; Hinloopen and Van Marrewijk, 2004; Rodrik,
2006; Schott, 2006).
16 Scholars also point at the possibility that the Chinese exports of consumer electronics is of the lower quality segment.
Based on the analyses of this paper, this claim cannot be affirmed nor rejected.

24
What remarkable is that all the countries that were considered to have a comparative advantage
in the more technologically sophisticated products like electrical machinery,
telecommunication, audio and video apparatus and office machines. This indicates that these
products are produced by many countries and that exporting these products is not as unique as,
for example, the export of flowers.
4.3.1 Factor intensity of exports
A comparison of the factor intensity of the Dutch exports for products at the SITC 4-digit level
for 1980 and 2000 with China and the EUnmc is provided in Figure 4.5. It reconfirms that
China has increased its production in more technologically intensive products,17 mostly at the
expense of primary products. In 2000, 51% of the Chinese exports were technology and human
capital intensive as compared to only 27% in 1980. China thus has made a big (and somewhat
surprising) leap in technologically intensive exports between 1980 and 2000. For the EUnmc, a
similar shift in factor intensity has taken place between 1980 and 2000. In 2000, 63% of the
EUnmc exports were human capital and technology intensive, as compared to only 36% in
1980. The share of unskilled labour intensive exports has remained roughly constant at 17% of
total exports. The growth in technology and human capital intensive exports has been at the
expense of exports of primary products. As far as the Netherlands is concerned, approximately
60% of the Dutch exports are technology and human capital intensive in 2000 as compared to
43% in 1980. The largest change has been in primary products from 46% in 1980 to 31% in
2000. In 2000, the Dutch export-basket was thus characterized by a combination of primary
products and technologically and human-capital intensive products.
17 See also Adams et al. (2004), Chen (2005), Gaulier et al. (2005 and 2006), Hinloopen and Van Marrewijk (2004), Rodrik
(2006), Schott (2006) and Yue and Hua (2002) for similar findings on the rapidly growing importance of the Chinese exports
of a group of technologically sophisticated goods.

25
Figure 4.5 Exports by factor intensity for the Netherlands, China and the EUnmc
Netherlands 1980 Netherlands 2000
Natural-resource intensive
4%
Primary products46%
Technology intensive 30%
Human-capital intensive
13%
Not classified1%
Unskilled-labour intensive
6%
Technology intensive 45%
Primary products31%
Human-capital intensive
15%
Not classified1%
Unskilled-labour intensive
5%
Natural-resource intensive
3%
China 1980 China 2000
Primary products26%Human-capital
intensive16%
Technology intensive 11%
Not classified2%
Natural-resource intensive
3%
Unskilled-labour intensive
42%
Not classified1%
Human-capital intensive
15%
Technology intensive 36%
Natural-resource intensive
3% Primary products7%
Unskilled-labour intensive
38%
EUnmc 1980 EUnmc 2000
Natural-resource intensive
6%
Primary products41%
Unskilled-labour intensive
17%
Not classified1%
Human-capital intensive
17%
Technology intensive 18%
Natural-resource intensive
6% Primary products14%
Unskilled-labour intensive
17%
Not classified0%
Human-capital intensive
27%
Technology intensive 36%
Source: Own calculations based on Feenstra and Lipsey (2005) SITC rev.2 4-digit. Classification based on Hinloopen and
van Marrewijk (2006).

26
4.3.2 Re-exports or production
In interpreting the previously described results, it is important to keep in mind that China’s
exports are to an important extent based on assemblage activities and that the Netherlands re-
exports a fair amount of its exports. To investigate the relevance and implication of this, Table
4.1, shows the top 10 strongest (based on RCA) and largest (based on export share) export
products. It is striking to see that the products for which the Netherlands has a strong
comparative advantage, like the agriculture and food cluster (SITC00 to SITC09), flowers and
bulbs (out of SITC29), animal and vegetable oils and fats (SITC40 to 49) and the chemical
cluster (SITC50 to SITC59), are those products that also contribute significantly to the world
exports in those products, but that these products do not have a particularly large contribution to
Dutch national exports.18 It is electrical machinery, office machines, telecommunicating
apparatus and chemical products that have the largest export shares. This implies that the
Netherlands do not have a unique position in exporting these products, since the RCAs for these
products are relatively small, although the amount the exports of these products are substantial.
Stated differently, this reveals the Dutch position in Europe as a transit port and underlines the
importance of re-exports for the Dutch economy. This notion is reconfirmed by data on re-
exports provided by the CBS.19 These data show that 94.2% of the total Dutch export of office
machines are re-exports, 67.8% of the total Dutch export of telecommunication, audio and
video apparatus, and 48% of the total Dutch export of electrical machinery. So the large export
shares and RCAs of the Netherlands in office machines and telecommunication and less so in
audio and video apparatus are likely to be based on re-exports.
18 Jacobs and Lankhuizen (2006) made a characterization of Dutch exports and found the same strong clusters, which are
the agriculture and food cluster, flowers and bulbs and the chemical cluster. They also identify the strength of the
Netherlands in photo apparatus. They did not look at re-exports, resulting in the identification of a relatively small, though
considerable, RCA for the Netherlands in clothing, textile and office machines. 19 Since the data are re-calculated to fit the SITC classification, the percentages are very rough estimates and are therefore
not used for calculations, but only indicative.

27
Table 4.1 Dutch tradables with strong revealed comparative advantage and large national export shares
Factor intensity
Percentage share of
SITC-2
(2-digit)
Product group
RCA Dutch
Total Dutch
exports
World export
in product
Import to
export ratio
Top 10 export products
33 Petroleum Primary products 1.0 10.2 3.3 0.8
77 Electrical machinery Technology 1.0 10.0 3.1 0.7
75 Office machines Technology 1.6 9.8 5.2 1.2
78 Road vehicles Human-capital 0.6 4.7 1.7 1.3
51 Organic chemicals Technology 1.9 4.4 5.9 0.6
58 Plastics in non-primary forms Technology 2.3 4.4 7.2 0.3
89
Manufactured articles
Technology /
human-capital /
unskilled-labour 1.0 3.9 3.1 0.9
76
Telecommunication, audio,
video apparatus
Human-capital /
technology 0.7 3.1 2.1 1.5
05 Vegetables and fruit Primary products 2.5 2.9 8.0 0.6
29
Crude animal and vegetable
materials (flowers & bulbs) Primary products 8.1 2.4 25.5 0.2
Total 55.9
Top 10 RCA, 2000
29
Crude animal and vegetable
materials (flowers & bulbs) Primary products 8.1 2.4 25.5 0.2
02 Dairy and birds' eggs Primary products 4.5 1.9 14.4 0.5
12 Tobacco manufactures Primary products 4.4 1.3 13.9 0.3
43 Animal & vegetable fats/oils Primary products 3.7 0.2 11.8 0.6
01 Meat Primary products 3.2 2.2 10.2 0.3
08 Animals feeding Primary products 2.8 0.9 8.9 0.5
05 Vegetables and fruit Primary products 2.5 2.9 8.0 0.6
42 Vegetable fats & oils Primary products 2.4 0.5 7.5 0.6
00 Live animals Primary products 2.4 0.3 7.4 0.5
09 Edible products Primary products 2.4 0.6 7.4 0.4
Total 13.2
Sources: Own calculations based on Feenstra and Lipsey (2005), classification based on Hinloopen and Van Marrewijk (2006).
Based on large contributions to the total national exports, China’s largest export sectors are
clothing, footwear, miscellaneous manufactures and the more technologically sophisticated
products like electrical machinery and telecommunication apparatus (see Table 4.2). By looking
at high RCAs, the cheap labour cluster is more prominent and this shows that China is
responsible for almost 25% of the total world export of clothing and for 40% of the world
export of travel goods. In total, both the cheap labour and consumer electronics cluster account
for 73% of the total Chinese export (see Table 4.2). This corresponds to the pattern of trade that
many other scholars have found for the Chinese export (Adams et al., 2004; Rodrik, 2005).

28
Table 4.2 Chinaa tradables with strong revealed comparative advantage and large national export shares
Percentage share of
SITC-2
(2-digit)
Product group
Factor intensity
RCA China
Total Chinese
exports
World export in
product
Import to
export ratio
Top 10 export products 2000
84 Apparel and clothing Unskilled-labour 4.5 13.6 24.8 0.0
89
Manufactured articles
Technology /
human-capital /
unskilled-labour 3.3 13.4 18.3 0.1
77 Electrical machinery Technology 1.1 10.5 6.3 0.8
76
Telecommunication,
audio, video apparatus
Human-capital /
technology 1.6 8.9 9.0 0.3
75 Office machines Technology 1.5 8.6 8.2 0.3
85 Footwear Unskilled-labour 6.3 5.2 34.6 0.0
65 Textile yarn Unskilled-labour 1.6 4.6 9.0 0.6
69 Manufactured metals Human-capital 1.5 3.1 8.5 0.2
83 Travel goods Unskilled-labour 7.4 2.6 40.8 0.0
82 Furniture Unskilled-labour 2.3 2.4 12.8 0.0
Total 73.0
China top 10 RCA, 2000
83 Travel goods Unskilled-labour 7.4 2.6 40.8 0.0
85 Footwear Unskilled-labour 6.3 5.2 34.6 0.0
57 Plastics in primary forms Technology 5.6 0.1 30.6 0.0
81 Prefabricated buildings Unskilled-labour 4.7 1.5 25.8 0.0
84 Apparel and clothing Unskilled-labour 4.5 13.6 24.8 0.0
89
Manufactured articles
Technology /
human-capital /
unskilled-labour 3.3 13.4 18.3 0.1
82 Furniture Unskilled-labour 2.3 2.4 12.8 0.0
88
Photo apparatus
Technology /
human-capital 2.2 2.2 12.1 0.2
32 Coal Primary products 2.1 0.7 11.3 0.0
65 Textile yarn Unskilled-labour 1.6 4.6 9.0 0.6
Total 46.3
a China is an aggregate of China, Hong Kong and Macau special administrative regions, China free trade zones.
Sources: Own calculations based on Feenstra and Lipsey (2005); Factor intensity classification based on Hinloopen and Van Marrewijk
(2006).
As is discussed in previous sections, assembling parts and components of technologically
sophisticated products is one of the explanations why China can export these products (Chen,
2005, Gaulier et al., 2005, 2006). Therefore, we have done a somewhat rough calculation of
China’s value added activities based on a broad economic categories-classification of the
United Nations.20 The analysis shows that, although China does import a lot of parts and
components from other Asian countries and exports a great deal of final goods, the amount of
20 For this analysis, data from the WTO is used at the SITC 5-digit level for 2000 to 2004. See Gaulier et al. (2006) for more
information.

29
imports of parts and components is somewhat decreasing between 2000 and 2004. This might
indicate a shift from sole assembling to more production in China, supporting the findings of
Rodrik (2006), that domestic companies (start to) play a significant role in the economic growth
of China and become more and more able to produce products themselves. This does not rule
out the possibility that this might be done by foreign companies with R&D centres in China.
Table 4.3 Top 10 RCA and export value for the EUnmc, 2000
Percentage share of
SITC-2
(2-digit)
Product group
Factor intensity
RCA EUnmc
Total EUnmc
export
World export in
product
Top 10 exports products
78 Road vehicles (inc air-cushion vehicles) Human-capital 1.4 12.1 2.3
77
Electrical machinery, apparatus &
appliances, n.e.s.
Technology
1.0 10.2 1.7
84
Articles of apparel and clothing
accessories
Unskilled-labour
1.6 5.3 2.7
71
Power generating machinery and
equipment
Technology
2.0 5.1 3.4
75
Office machines and automatic data
processing machines
Technology
0.8 4.9 1.4
76
Telecommunication & sound record &
reproduce app & equip
Human-capital
1.0 4.7 1.7
82 Furniture & pts; bedding, mattresses, etc. Unskilled-labour 4.0 4.1 6.6
74
General industrial machinery &
equipment, n.e.s. & pts
Technology
1.1 3.8 1.8
69 Manufactures of metals, n.e.s. Human-capital 1.8 3.6 3.1
33
Petroleum, petroleum products & related
materials
Primary products
0.4 3.6 0.6
Total 57.4
EUnmc top 10 RCA, 2000
82 Furniture & pts; bedding, mattresses, etc. Unskilled-labour 4.0 4.1 6.6
63
Cork and wood manufactures other than
furniture
Natural-resource
4.0 1.9 6.6
32 Coal, coke and briquettes Primary products 3.3 1.2 5.4
24 Cork and wood Primary products 2.8 1.7 4.6
56 Fertilizers (except crude of group 272) Technology 2.5 0.6 4.1
62 Rubber manufactures, n.e.s. Human-capital 2.1 1.5 3.5
71
Power generating machinery and
equipment
Technology
2.0 5.1 3.4
81
Prefab buildings; sanitary, plumb etc
fix nes
Unskilled-labour
1.9 0.6 3.2
00
Live animals other than animals of
division 03
Primary products
1.9 0.3 3.1
69 Manufactures of metals, n.e.s. Human-capital 1.8 3.6 3.1
Total 20.7

30
As for the EUnmc, based on RCAs, these countries are strong in a bunch of different products
with different underlying factors like the unskilled labour intensive products of furniture and
prefabricated buildings and cork and wood and the manufactures thereof which are primary
products and natural-resource intensive (see Table 4.3). If the contribution of sectors to the total
national exports is considered, the most important EUnmc export products are human capital
and technology intensive like road vehicles, electrical machinery, office machines and power
generating machinery. These products account for 57.4% of the total national exports of the
EUnmc.
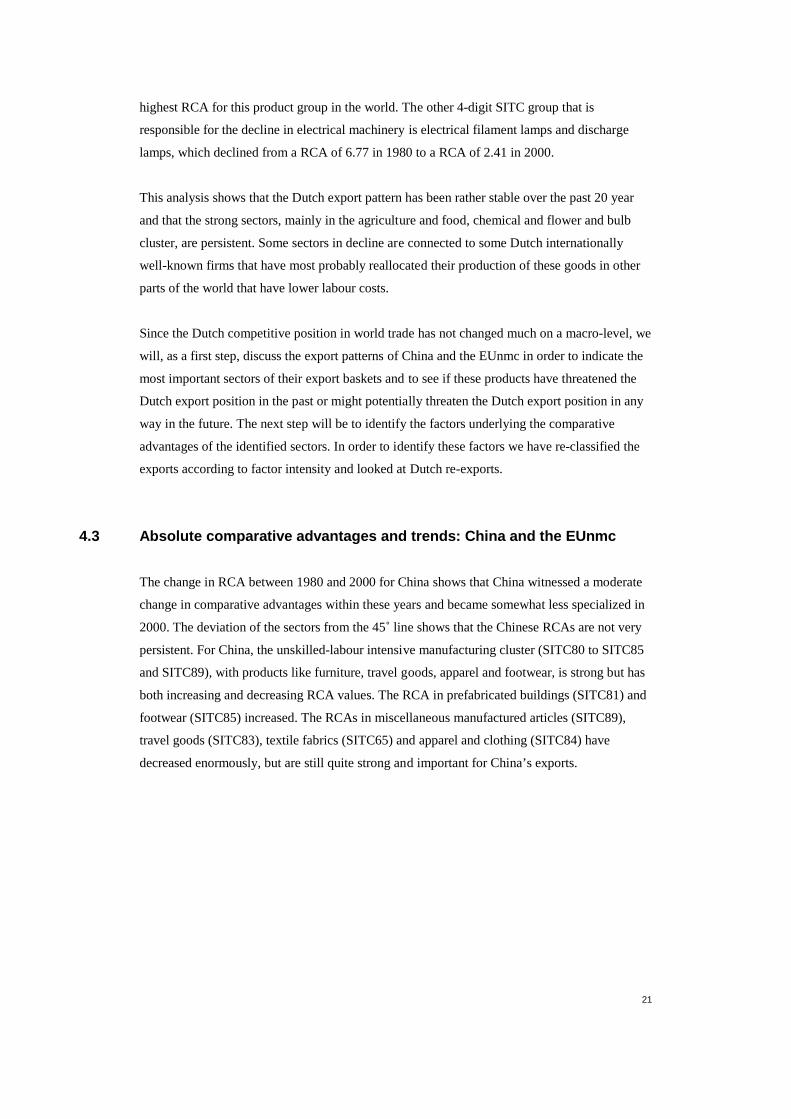
4.4 Relative comparative advantage
After having analyzed the strong export sectors and trends in the comparative advantage of the
Netherlands, we will now compare the Dutch export basket with the Chinese and EUnmc export
baskets to identify the sectors in which both countries have a comparative advantage. In this
section we also look at the export basket of the EU15. Figure 4.6 shows the comparison of the
RCAs by factor intensity in 2000 for China and the Netherlands and shows the potential
substitutability of products of high technology in planes II and III. Above the 45˚ line, the
Dutch RCA is stronger and below the 45˚ the Chinese RCA is stronger. The Dutch dominance
in the agriculture and food cluster and chemical cluster is depicted in plane I, while the Chinese
dominance in the unskilled-labour intensive production is depicted in plane IV. The planes V
and VI show the products for which neither the Netherlands nor China have a strong RCA.
China lost its competitive advantage in vegetables and fruits, edible products and essential oils,
while the Netherlands is still strong in producing these products. The Netherlands lost its
comparative advantage (of which some is based on re-exports) in textile yarn,
telecommunication, audio and video apparatus and prefabricated buildings, while China is still
strong in producing these products. The Netherlands and China both are strong in crude
fertilizers, but the Dutch RCA is presumed to be based on re-exports.
31
Figure 4.6 RCA according to factor intensity for the Netherlands and China, 2000
ht
pr
nc
ht/ hc
ht
u
u
u
u
u
hc
ht
hc/ ht
ht
ht
ht
ht
ht
hcnat.nat./ hc
nat./u
u
hc
nat.
hc
nat.
ht
ht
ht
ht
hcht hc
ht
ht
pr
pr
prpr
pr
pr
pr
pr
pr
pr
pr
prpr
pr
pr
prpr
pr
pr
pr
pr
pr pr
pr
pr
0.01
0.1
1
10
100
0.01 0.1 1 10 100
RCA China 2000
RC
A N
ethe
rland
s 20
00
Plastics in primary forms
Articles of Apparel & Clothes
Agriculture & Food cluster
Chemical cluster
I
II
III
IVV
VI
Source: Own calculations based on Feenstra and Lipsey (2005) SITC rev.2 2-digit. Classification based on Hinloopen and
Van Marrewijk (2006).
Some products at the lowest end of the RCA distribution have been left out for presentation.
pr = primary products; nat.= natural-resource intensive; u = unskilled-labour intensive; ht = technology intensive;
hc = human-capital intensive; nc = not specified
The Netherlands and China also both became strong in office machines, but again the Dutch
RCA is presumed to be based on re-exports. Both countries have a strong RCA in SITC29, but
at the 4-digit level, for the Netherlands this is due to flowers and bulbs and for China due to
plants and seeds used for pharmacy and plaiting. This leaves inorganic chemicals, photo
apparatus and electrical machinery as the only substitutable and thus potentially competing
SITC tradable. Both China and the Netherlands have a RCA of close to or larger than 1 for
these products and less than 50% of the exports are re-exports for the Netherlands.
The overlap between the RCAs of the Netherlands and the EUnmc in some products out of the
agriculture and food cluster like live animals, meat and diary products are depicted in plane II
of Figure 4.7 and in fertilizers and paper, depicted in plane III of Figure 4.7. The EUnmc have a
higher RCA in electrical machinery and office machines, depicted in plane IV. There is no
overlap in the Dutch chemical cluster (plane I) and the EUnmc production of cheap labour
manufactures, manufactures classified by materials and the machinery and transport equipment
(plane IV).

32
Figure 4.7 RCA according to factor intensity for the Netherlands and the EUnmc, 2000
ht
pr
nc
nc
ht/ hc/ u
ht/ hc
ht
u
u
u
u
u
hc/ ht/u
hc
ht
hc/ ht
ht
ht
ht
ht
ht
hcnat.
nat./ hc
nat./u
u
hc
nat.
hc
nat.
ht
ht
ht
ht
hc
ht hc
ht
ht
pr
pr
prpr
pr
pr
pr
pr
pr
pr
pr
pr
pr
pr
pr
pr
pr
pr
pr
pr
pr
prpr
pr
pr
pr
0.1
1
10
0.1 1 10
RCA EUnmc 2000
RC
A N
ethe
rland
s 20
00
Agricultural & food cluster
Chemical cluster
Flowers & bulbs
FertilizersPaper
I II
III
IVV
VI
Source: Own calculations based on Feenstra and Lipsey (2005) SITC rev.2 2-digit. Classification based on Hinloopen and
Van Marrewijk (2006).
Some products at the lowest end of the RCA distribution have been left out for presentation.
pr = primary products; nat.= natural-resource intensive; u = unskilled-labour intensive; ht = technology intensive;
hc = human-capital intensive; nc = not specified
The position of the Dutch economy in the EU1521 in terms of comparative advantage according
to factor intensity is rather scattered, as is shown in Figure 4.8. Plane I depicts the strong
position of the Netherlands in the agricultural and food cluster as well as in the animal and
vegetable oils. Plane IV depicts the strong position of Europe in a variety of technologically
intensive products and human-capital intensive products. Planes V and VI depict the sectors for
which neither the Netherlands nor Europe has a strong position. Planes II and III depict the
products for which both Europe and the Netherlands have a strong RCA. The Netherlands and
Europe both have a stronger position in the chemical cluster, in which Europe is somewhat
stronger than the Netherlands.
21 There are good reasons why large countries tend to have RCAs that are close to unity (see Section 2). For the EU15 this
is clearly true. For almost all products they have an RCA close to 1. Only beverages (SITC11), medicinal and
pharmaceutical products (SITC54) and coin including gold (SITC95) have a RCA of larger than 2. A concomitant problem of
aggregating over countries is the increasing occurrence of SITC groups ending in X, A or 0, which are rather inconsistent.
Therefore it is not very informative to extensively describe the RCAs of the EU15, but only to compare the Netherlands with
the European Union.

33
Figure 4.8 RCA according to factor intensity for the Netherlands and European Union, 2000
ht
pr
nc
ht/ hc
ht
u
u
u
u
u
hc
ht
hc/ ht
ht
ht
ht
ht
ht
hcnat.
nat./ hc
nat./u
u
hc
nat.
hc
nat.
ht
ht
ht
ht
hc
ht hc
ht
ht
pr
pr
pr
pr
prpr
pr
pr
pr
pr
pr
pr
pr
pr
pr
pr
pr
pr
pr
pr
pr
pr
prpr
pr
pr
pr
0.1
1
10
0.1 1 10
RCA EU15 2000
RC
A N
ethe
rland
s 20
00
Chemical cluster
Agriculture & Food cluster
Beverages
Flowers & BulbsInorganic chemicals
III
III
VI
IV
V
Source: Own calculations based on Feenstra and Lipsey (2005) SITC rev.2 2-digit. Classification based on Hinloopen and
Van Marrewijk (2006).
Some products at the lowest end of the RCA distribution have been left out for presentation.
pr = primary products; nat.= natural-resource intensive; u = unskilled-labour intensive; ht = technology intensive;
hc = human-capital intensive; nc = not specified.
As is seen in the previous analyses, China and the EUnmc have some overlapping RCAs.
Figure 4.9 depicts the RCAs according to factor intensity for China and the EUnmc. There is an
overlap in the cheap labour cluster of footwear, clothes and apparel and prefabricated buildings
(plane II and III), but also in the consumer electronics cluster, in which China has a somewhat
higher RCA (plane III). What is also interesting to observe, is that the EUnmc have more RCAs
in human capital and technology intensive products, depicted in plane I, which are the sectors of
machinery and transport equipment and manufactures classified by materials.
In the next subsection, we turn to the question whether the products out of the sectors for which
both China and the EUnmc and the Netherlands have a comparative advantage are exported to
the same geographical markets. If this is the case, the Dutch exports in these products might be
prone to competition from emerging economies.
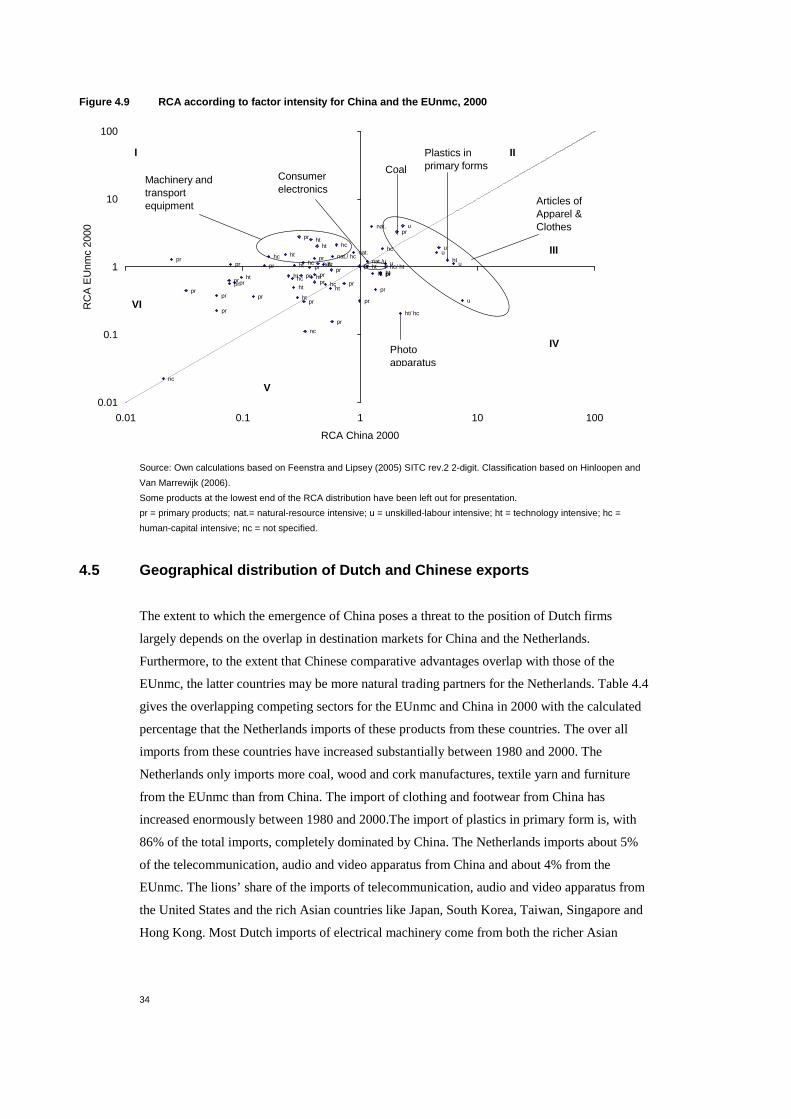
34
Figure 4.9 RCA according to factor intensity for China and the EUnmc, 2000
prpr
prpr
prpr
prpr pr
pr
pr
prpr
pr
pr
pr
pr
prpr
pr
pr
pr
pr
pr
prht ht
hcht
hc
ht
ht
ht
ht
nat.hc
nat.
hc unat./unat./ hc
nat.
hcht
ht
ht ht ht
hc/ htht
hc
u
u
u
u
u
ht
ht/ hc
nc
pr
ht
nc
0.01
0.1
1
10
100
0.01 0.1 1 10 100
RCA China 2000
RC
A E
Unm
c 20
00
Articles of Apparel & Clothes
Plastics in primary formsCoal
I II
III
IV
V
VI
Photo apparatus
Consumer electronics
Machinery and transport equipment
Source: Own calculations based on Feenstra and Lipsey (2005) SITC rev.2 2-digit. Classification based on Hinloopen and
Van Marrewijk (2006).
Some products at the lowest end of the RCA distribution have been left out for presentation.
pr = primary products; nat.= natural-resource intensive; u = unskilled-labour intensive; ht = technology intensive; hc =
human-capital intensive; nc = not specified.
4.5 Geographical distribution of Dutch and Chinese exports
The extent to which the emergence of China poses a threat to the position of Dutch firms
largely depends on the overlap in destination markets for China and the Netherlands.
Furthermore, to the extent that Chinese comparative advantages overlap with those of the
EUnmc, the latter countries may be more natural trading partners for the Netherlands. Table 4.4
gives the overlapping competing sectors for the EUnmc and China in 2000 with the calculated
percentage that the Netherlands imports of these products from these countries. The over all
imports from these countries have increased substantially between 1980 and 2000. The
Netherlands only imports more coal, wood and cork manufactures, textile yarn and furniture
from the EUnmc than from China. The import of clothing and footwear from China has
increased enormously between 1980 and 2000.The import of plastics in primary form is, with
86% of the total imports, completely dominated by China. The Netherlands imports about 5%
of the telecommunication, audio and video apparatus from China and about 4% from the
EUnmc. The lions’ share of the imports of telecommunication, audio and video apparatus from
the United States and the rich Asian countries like Japan, South Korea, Taiwan, Singapore and
Hong Kong. Most Dutch imports of electrical machinery come from both the richer Asian

35
countries and from the United States, the United Kingdom and Germany and less so from China
and the Eunmc.
Table 4.4 Competing sectors in 2000 for Eunmc and China by Dutch imports
From Eunmc China
1980 2000 1980 2000
SITC 2 (2-digit) Product group % Dutch imports
32 Coal, coke and briquettes 10.6 8.3 0.0 3.8
57 Plastics in primary forms 0.0 0.0 15.5 86.1
63
Cork and wood manufactures other than
furniture 0.5 7.3 0.2 6.0
65 Textile yarn, fabrics, made-up articles, n.e.s. 0.8 4.8 1.7 3.4
66 Nonmetallic mineral manufactures, n.e.s. 0.7 3.3 0.1 5.5
69 Manufactures of metals, n.e.s. 0.5 4.6 0.2 6.0
76
Telecommucation & sound record &
reproduce app & equip 0.1 3.9 0.0 4.8
77
Electrical machinery, apparatus &
appliances, n.e.s. 0.3 1.9 0.0 4.6
81
Prefab buildings; sanitary, plumb etc fix
n.e.s. 1.5 5.3 0.1 13.1
82 Furniture & pts; bedding, mattresses, etc. 1.2 7.8 0.1 4.9
84 Articles of apparel and clothing accessories 3.5 6.1 0.7 10.5
85 Footwear 1.5 2.5 0.4 13.3
When we consider the direction of the Dutch exports in general, we observe that most of the
products are destined for European countries. Of the products of which we assume, based on
CBS data, that a large share are re-exports, this is even truer. We take a closer look at the
destination of the Dutch and Chinese exports by considering the results of the gravity analyses
(given in Annex D).
For both the Netherlands and China the results of the gravity analysis reveal that the sectors for
which the countries have a comparative advantage are less sensitive to distance than the sectors
for which the countries do not have a comparative advantage. We have also found that the
sectors in which it is likely that the Netherlands re-exports much, the sensitivity to distance is
much stronger. The products that are most sensitive to GDP, are the technologically intensive
products. These products have the highest estimated GDP coefficients. Since most rich
countries are located further away from China, the gravity equations for China for these
products show a low sensitivity to distance and a high sensitivity to GDP. The gravity analysis
that we have performed at the 2-digit level for GDP per capita and distance subscribe to these
conclusion, but in a more extreme way. If GDP per capita is considered, the technologically
intensive products have a stronger GDP per capita sensitivity and a less strong sensitivity for
distance for China (vis-à-vis the GDP gravity analysis). Since the Netherlands are closer to the

36
rich countries in the world, GDP per capita is also stronger, but distance is not more sensitive
than under the GDP specification.
The results of the ranking analysis of the three different geographical distribution measures for
the strong export sectors of the exports of China and the Netherlands for 2000 are given in
Annex E. These results show that China has a global export market, while the Netherlands has a
much more localized export market, which is explained by the Dutch role as a transit port in
Europe. The great extent to which the Chinese exports are destined for the global market, is also
emphasised by in Hinloopen and Van Marrewijk (2004). The global pattern of Chinese trade is
also apparent in the potential substitutive products for the Netherlands and China. 73% of the
Dutch export of electrical machinery is exported to Europe and the rest is mostly exported to
Asia and America. China exports about 40% of the electrical machinery to Asia, while it
exports the rest to Europe and America. 82% of the Dutch export of inorganic chemicals goes to
Europe, while China exports about 40% of its inorganic chemicals to Asia and the rest to
Europe and America. The Netherlands export 40% of the photo apparatus to Europe and the rest
to America and Asia. Again China exports 60% of its photo apparatus to Europe and America.
Since both countries export these products to global markets, it is likely that their trade is
competitive, though both the Chinese local market and the Dutch local market seem more
natural trade partners. So only for the trade in inorganic chemicals, electrical machinery and
photo apparatus we have identified a possibility of intensified competition for Dutch trade due
to the emergence of China, especially because both countries export to the same markets.
Trade patterns of other Asian countries
Several scholars have pointed out that the emergence of China, and the role that foreign investment played in this
emergence, has influenced the allocation of production most heavily within Asia itself. In this box, we therefore take a
look at changes in trade patterns of other Asian countries as compared to China, namely Japan and Thailand. We will
show that even Japan’s RCAs did not suffer much from the emergence of China. Figure 4.10 shows the RCA trends and
levels for Japan and Thailand in 1980 and 2000. Japan is mostly good in producing machinery and transport equipment
(SITC70 to SITC79) and consumer electronics (SITC75, SITC76, SITC77 and SITC88) , as is depicted in planes II and
II. As is seen in planes I and IV, there are hardly any declining sectors in Japan, but also hardly any rising sectors,
showing that Japanese RCAs are persistent despite globalisation. Also Thailand shows many sectors with increasing
RCAs (plane I) like office machines (SITC75) and telecommunication, audio and video apparatus (SITC76), but also
more low cost labour products like footwear (SITC85). Planes II and III show that Thailand is good in producing
agricultural products (out of the SITC00 to SITC09 group) and manufactures classified by materials (out of the SITC60
to SITC61 group). A comparison between Japan and China in Figure 4.11 shows again that only the three consumer
electronics in plane II and III are potentially competitive. Japan has an economy that mostly relies on human capital and
technological intensive products out of the machinery and transport equipment and more scientific machinery (plane I),
which do not compete with China. A comparison between Thailand and Japan in Figure 4.11 gives a similar impression,
namely that Japan does not experience much threat for its strong competitive position in the world trade for machinery
and transport equipment from emerging economies.
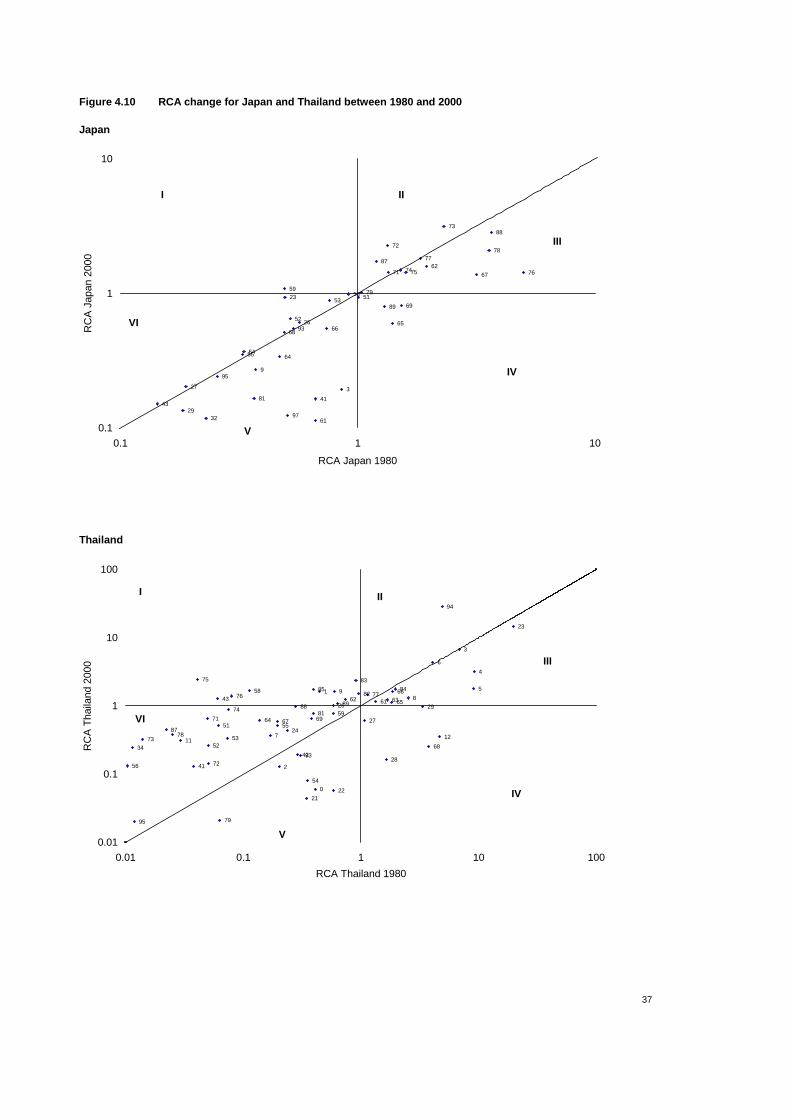
37
Figure 4.10 RCA change for Japan and Thailand between 1980 and 2000
Japan
97
95
93
89
88
87
81
79
7877
767574
73
72
71
69
68
67
6665
64
62
61
5958
5554
53
52
51
4341
3229
27
26
23
9
3
0.1
1
10
0.1 1 10
RCA Japan 1980
RC
A J
apan
200
0
I II
III
IV
V
VI
Thailand
0
1
2
3
4
5
6
7
89
1112
2122
23
24
26
27
28
29
34
41
42
43
51
5253
54
55
56
58
59
6162 63
64
65
66
67
68
6971
72
73
74
75
76 77
78
79
81
82
83
8485
87
88 89
93
94
95
0.01
0.1
1
10
100
0.01 0.1 1 10 100
RCA Thailand 1980
RC
A T
haila
nd 2
000
I II
III
IV
V
VI

38
Figure 4.11 RCA by factor intensity for Japan, China and Thailand in 2000
Japan and China
pr
pr
pr
pr
pr
pr
pr
pr
pr
pr
pr
pr
pr
prpr
pr
nc
pr
pr
pr
pr
pr
ht
ht
hc
ht hc
ht
ht
ht ht
nc
nat.
hc
nat.
hc
unat./u
nat./ hc
nat.
hc
nc
ht
ht
ht
ht ht hc/ htht
hc
hc/ ht/u
nc
u
u
uu
u
ht
ht/ hc
ht/ hc/ u
nc
ncnc
pr
ht
0.01
0.1
1
10
100
0.01 0.1 1 10 100
RCA China 2000
RC
A J
apan
200
0
Photo apparatus
Office machines & telecommunicationequipement
Electrical machinery
Specialized professional and scientific machinery/apparatus and transport equipment
Articles of apparel & clothes
Plastics in primary forms
III
III
IVV
VI
Japan and Thailand
pr
pr
pr
pr
pr
pr
prpr
pr pr
pr
pr
pr
pr
pr
pr
prpr
pr
pr
pr
pr
ht
ht hc
ht
hc
ht
ht
ht
ht
hc/ht
nat. hcnat.
hc
u
nat./u
nat./ hc
nat.
hc
nc
ht
ht
ht
ht
ht
hc/ htht
hc
hc/ ht/u
ncu
u
uuu
ht
ht/ hc ht/ hc/ u
nc
nc
nc
pr
ht
0.01
0.1
1
10
100
0.01 0.1 1 10 100
RCA Japan 2000
RC
A T
haila
nd 2
000
Office machines Electrical
machinery
Photo apparatus
Specialized professional and scientific machinery/apparatus and transport equipment
III
III
IV
V
VI

39
5 Conclusion
In this paper, we have focused on the influence of globalisation on the Dutch competitive
position in world trade. We have done this by looking at the emergence of China and the
EUnmc. On the one hand the emergence of China and the EUnmc can affect the
competitiveness of important Dutch export products and on the other hand it can influence the
Dutch position as a transit port for Europe. In both cases we have found that globalisation did
not have a negative influence over the past 20 years. In spite of (or due to) globalisation the
Dutch position as a transit port for Europe has intensified. With a further growth of production
in Asia, this position might become even more important in the future. Also, in spite of, or due
to, globalisation the three important Dutch export clusters, namely the chemical, flower and
bulbs and food and agriculture cluster are still as important now as 20 years ago, pointing at the
persistence of these comparative advantages. A remarkable result of our analysis is that the
emerging economies that we have considered ánd the developed economies we have considered
all have a RCA in electrical machinery, office machines and telecommunication, audio and
video apparatus. This might indicate that having a RCA in these products is not a very unique
feature of a country’s export-basket and thus is prone to influence by globalisation because the
production of these goods can easily be re-allocated to low wage countries. For these products
it might mean that the technology of these products is located in a different country than the
manufacturing and assembling of the parts of these products. One can argue that sectors that
produce completely domestic are those sectors that are persistent in their comparative advantage
because of existing networks and developed tacit knowledge. An example of such clusters is the
Dutch food and agriculture cluster and the flower industry, which not only consists of the
farmers and breeders, but also of technological development centres, universities, multinational
firms and infrastructure. Sectors or firms that are not tight to such local clusters can easily re-
allocate production to low labour cost countries and are not likely to stick in one place and are
therefore not likely to provide a long lasting comparative advantage for a country.
A remark about the future threat of emerging economies for the Dutch competitive position in
world trade is that for the industries in which the Netherlands has a comparative advantage and
those that are based on primary products, like the agriculture and food cluster, future
competition with China is not likely. This is based on the fact that China does not have a
comparative advantage in these products in general and in the factor primary products in
particular. The EUnmc do have a comparative advantage in some agricultural and food
products, but it is questionable whether these countries are able to build a very distinguishing
cluster that makes the comparative advantage of these products last in the future.
If China keeps developing its strength in technologically intensive products, competition
between China and the Netherlands in the chemical cluster might arise. The product out of the
chemical cluster for which China and the Netherlands already compete is inorganic chemicals

40
especially because both the Netherlands and China have a global export market for inorganic
chemicals.
In this paper, we have found no very sound evidence that the EUnmc are more natural trading
partners than China, at least not for the products in which both countries have a comparative
advantage. We can come up with some possible reasons why this is so, but the result is still
quite remarkable. In the future, when not only the physical barriers but the institutional barriers
in the EUnmc too have opened, trade might become more intense. The fact that the Netherlands
might lose its already declining position in the three consumer electronics sectors in the future,
might be due to the emergence of China and the EUnmc, but is most likely to be due to low
costs countries in general. We have just argued that low wage costs are a factor that does not
determine persistent strong export sectors. Loosing these sectors might need some adjustment
on the micro level, but is not something to worry about on a macro level.
41
References
Adams, F.G., B. Gangnes and Y. Shachmurove, 2004, Why is China so Competitive?
Measuring and Explaining China’s Competitiveness, Working Paper 04-6.
Anderson, J.E., 1979, A Theoretical Foundation for the Gravity Equation, American Economic
Review, vol. 69, no. 1, pp. 106–116.
Anderson, J.E. and E. van Wincoop, 2004, Trade Costs, National Bureau of Economic
Research Working Paper Series, April 30.
Balassa, B., 1965, Trade Liberalization and 'Revealed' Comparative Advantage, Manchester
School of Economic and Social Studies, vol. 33, pp. 99–123.
Bowen, H.P., 1983, On the Theoretical Interpretation of Trade Intensity and Revealed
Comparative Advantage, Weltwirtschaftliches Archiv, vol. 119, pp. 464–472.
Brakman, S., H. Garretsen and C. van Marrewijk, 2001, An Introduction to Geographical
Economics, Cambridge, Cambridge University Press.
Chen, M., 2005, Made in China, The China Business Review, vol. 32, no. 3, pp. 42–46.
Deardorff, A., 1995, Determinants of Bilateral Trade: Does the Gravity Work in a Neoclassical
World?, National Bureau of Economic Research Working Paper Series 5377.
Eichengreen, B., Y Rhee and H. Tong, 2004, The Impact of China on the Exports of other
Asian Countries, National Bureau of Economic Research Working Paper Series 10768.
Feenstra, R.C., 2004, Advanced International Trade: Theory and Evidence, Princeton,
Princeton University Press.
Feenstra, R.C., W. Hai, W.T. Woo and S. Yao, 1999, Discrepancies in International Data: An
Application to China-Hong Kong Entrepot Trade, American Economic Review, vol. 89, no. 2,
pp. 338–343.
Feenstra, R.C. and R.E. Lipsey, 2005, http://cid.econ.ucdavis.edu/data/undata/undata.html.
Feenstra, R.C., R.E. Lipsey, H. Deng, A.C. Ma and H. Mo, 2005, World Trade Flows: 1962-
2000, National Bureau of Economic Research Working Paper Series 11040.

42
Gaulier, G., F. Lemoine and D. Ünal-Kesenci, 2005, China’s Integration in East Asia:
Production Sharing, FDI & High-tech Trade, Centre d’Études Prospectives et d’Informations
Internationales Working Paper 2005-09.
Gaulier, G., F. Lemoine and D. Ünal-Kesenci, 2006, China’s Emergence and the
Reorganisation of Trade Flows in Asia, Centre d’Études Prospectives et d’Informations
Internationales Working Paper 2006-05.
Gorter, J., P. Tang and M. Toet, 2005, Verplaatsing vanuit Nederland: motieven, gevolgen en
beleid, CPB Document 76.
Heston, A., R. Summers and B. Aten, 2002, Penn World Table Version 6.1, Center for
International Comparisons at the University of Pennsylvania (CICUP).
Hinloopen, J. and C. van Marrewijk, 2004, Dynamics of Chinese Comparative Advantage,
Tinbergen Institute Discussion Paper TI2004-034/2.
Hinloopen, J. and C. van Marrewijk, 2005, Empirical Evidence of the Hillman Condition for
Revealed Comparative Advantage: 10 Stylized Facts, Tjalling C. Koopmans Research Institute
Discussion Paper Series 05-24.
Hinloopen, J. and C. van Marrewijk, 2006,
http://people.few.eur.nl/vanmarrewijk/eta/intensity.htm.
Jacobs, D and M. Lankhuizen, 2006, De Nederlandse exportsterkte geclusterd, Economisch
Statistische Berichten, June 2, 2006.
Laursen, K., 1998, Revealed Comparative Advantage and the Alternatives as Measures of
International Specialisation, Danish Research Unit for Industrial Dynamics Working Paper, 98-
30.
McCann, P., 2001, Urban and Regional Economics, Oxford, University Press.
Richardson, J.D. and C. Zhang, 1999, Revealing Comparative Advantage: Chaotic or Coherent
Patterns across Time and Sector and U.S. Trading Partner?, National Bureau of Economic
Research Working Paper Series 7212.
Rodrik, D., 2006, What’s So Special About China’s Exports?, Centre for Economic Policy
Research Discussion Paper Series 5484.

43
Schott, P.K., 2006, The Relative Sophistication of Chinese Exports, National Bureau of
Economic Research Working Paper Series 12173.
Vollrath, T.L., 1991, A Theoretical Evaluation of Alternative Trade Intensity Measures of
Revealed Comparative Advantage, Weltwirtschaftliches Archiv, vol. 127, pp. 265–280.
Yeats, A.J., 1985, On the Appropriate Interpretation of the Revealed Comparative Advantage
Index: Implications of a Methodology Based on Industry Sector Analysis, Weltwirtschaftliches
Archiv, vol. 121, pp. 61–73.
Yue, C. and P. Hua, 2002, Does Comparative Advantage explains Export Patterns in China?,
China Economic Review, vol. 13, pp. 276–296.

44

45
Annex A SITC product groups classification
The SITC- Rev.2, 2-digit product groups classification has been applied.
00 food and live animals
01 meat and meat preparations
02 dairy products and birds' eggs
03 fish (except marine mammal) crustaceans, etc, preps
04 cereals and cereal preparations
05 vegetables and fruit
06 sugars, sugar preparations and honey
07 coffee, tea, cocoa, spices and manufactures thereof
08 feeding stuff for animals not including unmilled cereal
09 miscellaneous edible products and preparations
10 beverages and tobacco
11 beverages
12 tobacco and tobacco manufactures
20 crude materials, inedible, except fuels
21 hides, skins and fur skins, raw
22 oil seeds and oleaginous fruits
23 crude rubber (including synthetic and reclaimed)
24 cork and wood
25 pulp and waste paper
26 textile fibbers and their wastes (excluding wool tops, etc.)
27 crude fertilisers (not of div 56) and crude minerals
28 metalliferous ores and metal scrap
29 crude animal and vegetable materials, not elsewhere specified
30 mineral fuels, lubricants and related materials
32 coal, coke and briquettes
33 petroleum, petroleum products and related materials
34 gas, natural and manufactured
35 electric current
40 animal and vegetable oils, fats and waxes
41 animal oils and fats
42 fixed veg. fats and oils crude, refined, fractionate
43 anml/veg fats/oils process/waxes/inedible prep, not elsewhere specified
50 chemicals and related products, not elsewhere specified
51 organic chemicals
52 inorganic chemicals
53 dyeing, tanning and colouring materials
54 medicinal and pharmaceutical products
55 essential oils, etc; toilet, polishing etc prep
56 fertilisers (except crude of group 272)
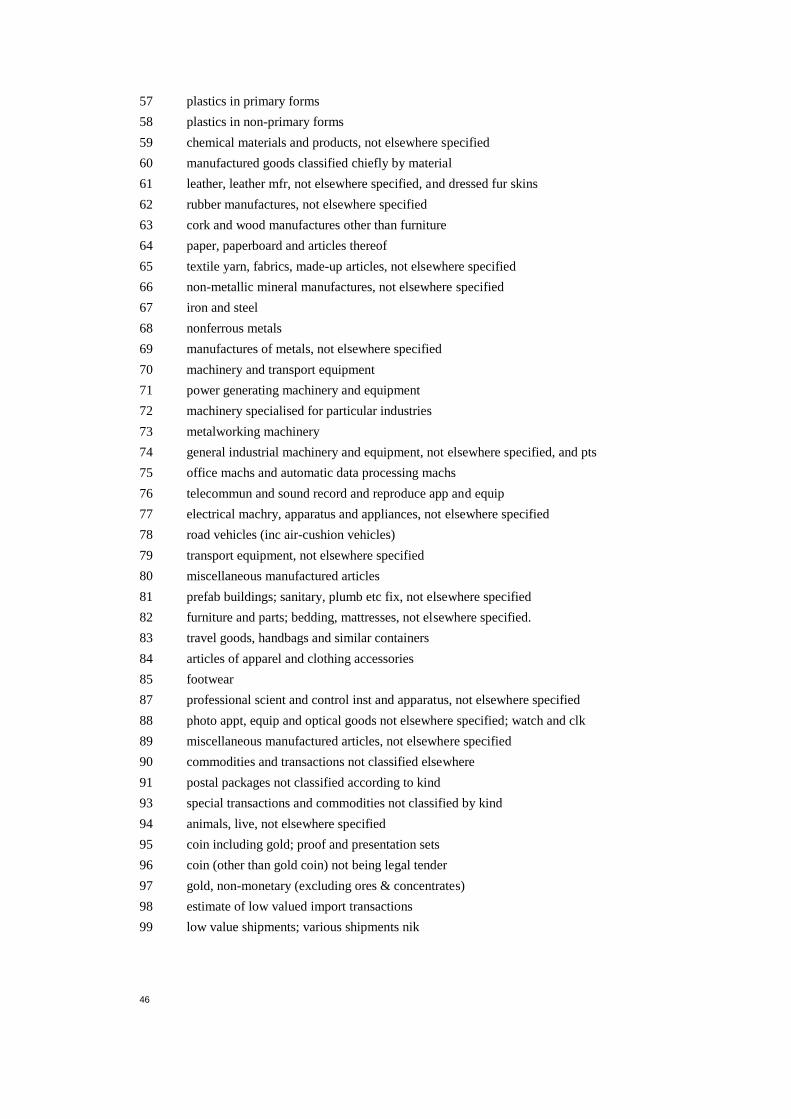
46
57 plastics in primary forms
58 plastics in non-primary forms
59 chemical materials and products, not elsewhere specified
60 manufactured goods classified chiefly by material
61 leather, leather mfr, not elsewhere specified, and dressed fur skins
62 rubber manufactures, not elsewhere specified
63 cork and wood manufactures other than furniture
64 paper, paperboard and articles thereof
65 textile yarn, fabrics, made-up articles, not elsewhere specified
66 non-metallic mineral manufactures, not elsewhere specified
67 iron and steel
68 nonferrous metals
69 manufactures of metals, not elsewhere specified
70 machinery and transport equipment
71 power generating machinery and equipment
72 machinery specialised for particular industries
73 metalworking machinery
74 general industrial machinery and equipment, not elsewhere specified, and pts
75 office machs and automatic data processing machs
76 telecommun and sound record and reproduce app and equip
77 electrical machry, apparatus and appliances, not elsewhere specified
78 road vehicles (inc air-cushion vehicles)
79 transport equipment, not elsewhere specified
80 miscellaneous manufactured articles
81 prefab buildings; sanitary, plumb etc fix, not elsewhere specified
82 furniture and parts; bedding, mattresses, not elsewhere specified.
83 travel goods, handbags and similar containers
84 articles of apparel and clothing accessories
85 footwear
87 professional scient and control inst and apparatus, not elsewhere specified
88 photo appt, equip and optical goods not elsewhere specified; watch and clk
89 miscellaneous manufactured articles, not elsewhere specified
90 commodities and transactions not classified elsewhere
91 postal packages not classified according to kind
93 special transactions and commodities not classified by kind
94 animals, live, not elsewhere specified
95 coin including gold; proof and presentation sets
96 coin (other than gold coin) not being legal tender
97 gold, non-monetary (excluding ores & concentrates)
98 estimate of low valued import transactions
99 low value shipments; various shipments nik
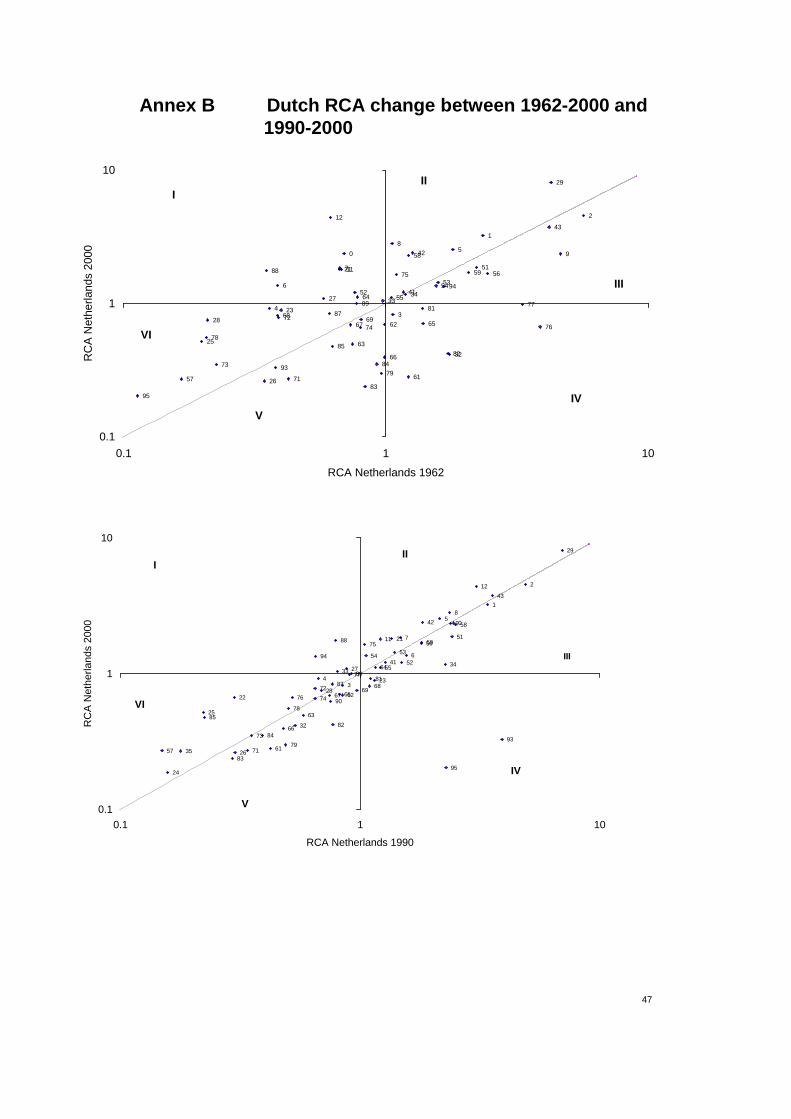
47
Annex B Dutch RCA change between 1962-2000 and 1990-2000
95
94
93
89
88
87
85
84
83
82
81
79
78
77
76
75
74
73
72
71
6968
67
66
65
64
63
62
61
59
58
57
56
55
5453
52
51
43
42
413433
32
29
28
27
26
25
23
21
12
11
9
8
7
6
5
43
2
1
0
0.1
1
10
0.1 1 10
RCA Netherlands 1962
RC
A N
ethe
rland
s 20
00
III
III
IV
V
VI
95
94
93
90
89
88
87
85
84
83
82
81
79
78
77
76
75
74
73
72
71
6968
67
66
65
64
63
62
61
59
58
57
56
55
5453
52
51
43
42
41
35
3433
32
29
28
27
26
25
24
23
22
21
12
11
9
8
7
6
5
43
2
1
0
0.1
1
10
0.1 1 10
RCA Netherlands 1990
RC
A N
ethe
rland
s 20
00
III
III
IV
V
VI

48

49
Annex C Absolute changes in RCA at the 4-digit level for the Netherlands
-16.71
-11.81
-8.17
-8.04
-7.80
-7.11
-6.91
-6.80
-6.28
-6.09
3.07
3.12
3.46
3.82
3.96
5.06
5.84
7.57
14.11
23.75
-20 -15 -10 -5 0 5 10 15 20 25 30
tobacco manufactured
animal & vegetable oils and fats
regenerated cellulose
vegetables
sanitary, plumbing, heating, lighting fixtures
other non-electrical machinery tools
aluminium
thermionic, cold & photo-cathode valves, tubes, parts
agricultural machinery and parts
dyeing & tanning extracts
machinery & equipment specialized for particular industries
bulbs
cocoa butter and cocoa paste
linseed oil
special transactions & commodities, not classified to kind
flours, meals & flakes
photographic & cinematographic apparatus n.e.s
aircraft & associated equipment and parts
nickel
fixed vegetable oils
RCA 2000- RCA 1990
-15 -10 -5 0 5 10
shavers & hair clippers with motor and parts
coal gas, water gas,producer gas & similar gases
fabrics woven of wool
tin and tin alloys
electrical filament lamps and discharge lamps
meat of swine
swine, live
margarine
typewritters; cheque-writting machines
other artificial plastic materials, n.e.s.
fish fillets
parts of and accessories suitable for office machines
iron pyrites, unroasted
other soft fixed vegetable oils
converted paper and paperboard, n.e.s.
photographic & cinematographic apparatus n.e.s
linseed oil
bacon, ham & other meat of swine
starches, inulin and wheat gluten
flours, meals & flakes
RCA 2000- RCA 1980

50
-8.00
-6.47
-5.55
-5.39
-4.76
-4.68
-4.56
-4.52
-4.33
-4.26
3.60
4.01
4.01
4.14
5.45
5.90
6.75
6.96
7.01
10.40
-20 -15 -10 -5 0 5 10 15 20 25 30
electrical filament lamps and discharge lamps
margarine
glass, n.e.s.
tugs, special purpose vessels, floating structures
palm kernel oil
vegetables
fertilizers, n.e.s.
hormones, natural or reproduced by synthesis
sands, natural, of all kinds
fatty acids
potatoes
coal gas, water gas,producer gas & similar gases
meat & edible offals
road tractors and semi-trailers
cigarettes
photographic & cinematographic apparatus n.e.s
swine, live
cut flowers
bacon, ham & other dried meat of swine
flours, meals & flakes
RCA 2000- RCA 1962

51
Annex D Results Gravity analysis at the 2-digit level for the Netherlands and China
Results Gravity analysis at the 2-digit level for the Netherlands
SITC 2 Log (distance) Log (gdp_wb) # obs. R2
Coefficient t-value Coefficient t-value
00 − 0.70 − 4.95 0.56 7.06 71 0.57
01 − 0.75 − 4.11 0.50 6.11 73 0.52
02 − 0.30 − 1.91 0.39 6.10 123 0.31
03 − 0.59 − 3.24 0.59 7.05 65 0.55
04 − 0.57 − 4.51 0.51 8.99 114 0.54
05 − 1.20 − 9.01 0.56 9.20 109 0.67
06 − 0.60 − 4.93 0.59 9.02 74 0.62
07 − 0.82 − 7.86 0.69 13.08 88 0.76
08 − 1.04 − 8.81 0.55 8.52 87 0.68
09 − 0.45 − 4.23 0.53 10.73 108 0.60
11 − 0.56 − 3.87 0.51 8.06 97 0.52
12 − 0.56 − 2.78 0.58 5.04 62 0.41
21 − 0.10 − 0.37 0.59 2.86 29 0.24
22 − 0.90 − 4.76 0.33 3.05 36 0.52
23 − 0.76 − 6.45 0.79 8.45 50 0.70
24 − 0.64 − 3.58 0.48 4.34 38 0.50
25 − 0.32 − 1.10 0.34 1.25 28 0.11
26 − 0.45 − 3.60 0.18 3.59 76 0.34
27 − 0.95 − 7.64 0.55 7.10 55 0.70
28 − 0.54 − 2.32 0.90 4.95 42 0.44
29 − 1.07 − 10.89 0.85 15.50 93 0.83
32 − 0.96 − 7.51 0.52 5.68 32 0.79
33 − 1.07 − 6.24 0.72 8.53 92 0.60
34 − 1.25 − 4.10 0.89 4.78 21 0.78
41 − 0.79 − 6.04 0.26 3.44 29 0.67
42 − 0.94 − 5.94 0.27 3.96 85 0.47
43 − 0.65 − 5.67 0.47 7.11 63 0.61
51 − 0.53 − 5.34 1.21 22.59 99 0.87
52 − 0.65 − 5.60 0.90 12.05 69 0.75
53 − 0.52 − 5.39 0.73 14.90 98 0.77
54 − 0.52 − 5.35 0.85 19.23 128 0.80
55 − 0.73 − 7.05 0.65 12.42 95 0.72
56 − 0.52 − 3.44 0.49 5.81 69 0.50
58 − 0.88 − 8.22 0.94 17.60 103 0.82
59 − 0.42 − 5.18 0.87 22.52 111 0.85

52
Results Gravity analysis at the 2-digit level for the Netherlands (continued)
SITC 2 Log (distance) Log (gdp_wb) # obs. R2
Coefficient t-value Coefficient t-value
61 − 0.45 − 2.85 0.43 4.62 46 0.41
62 − 0.73 − 7.01 0.53 10.75 99 0.70
63 − 0.83 − 7.21 0.49 7.58 63 0.70
64 − 0.83 − 8.75 0.75 15.93 105 0.80
65 − 0.96 − 7.79 0.61 10.23 96 0.69
66 − 0.81 − 7.65 0.72 11.64 72 0.77
67 − 0.88 − 6.77 0.66 9.88 89 0.67
68 − 0.70 − 5.61 0.87 11.97 73 0.73
69 − 0.87 − 8.49 0.70 13.80 102 0.77
71 − 0.40 − 3.61 0.61 11.81 104 0.65
72 − 0.44 − 4.61 0.77 17.62 113 0.78
73 − 0.50 − 3.41 0.59 6.39 54 0.52
74 − 0.61 − 6.66 0.86 19.34 113 0.83
75 − 1.33 − 10.14 0.79 13.10 105 0.77
76 − 1.03 − 7.07 0.87 10.38 83 0.69
77 − 0.72 − 5.46 1.07 15.03 100 0.76
78 − 1.04 − 7.89 0.65 11.06 110 0.69
79 − 0.42 − 2.37 0.42 4.67 77 0.33
81 − 0.96 − 8.47 0.56 8.25 64 0.72
82 − 0.91 − 7.22 0.58 8.80 69 0.68
83 − 1.03 − 8.90 0.43 6.09 40 0.75
84 − 1.37 − 8.54 0.49 6.04 56 0.70
85 − 1.24 − 6.44 0.42 4.19 40 0.63
87 − 0.52 − 4.73 0.79 14.42 101 0.74
88 − 0.47 − 4.08 1.08 15.89 71 0.80
89 − 0.96 − 8.34 0.85 14.51 102 0.78
90 − 0.19 − 0.71 0.91 3.12 28 0.31
93 − 0.34 − 1.18 0.44 3.68 51 0.24

53
Results Gravity analysis at the 2-digit level for China
SITC 2 Log (distance) Log (gdp_wb) # obs. R2
Coefficient t-value Coefficient t-value
01 − 1.76 − 3.74 0.37 3.86 40 0.47
02 − 0.56 − 0.94 0.06 0.31 16 0.06
03 − 1.25 − 3.42 1.00 9.50 47 0.70
04 − 1.60 − 4.13 0.24 2.40 68 0.27
05 − 0.98 − 4.85 0.81 13.58 90 0.71
06 − 1.32 − 4.16 0.52 4.27 49 0.40
07 − 0.17 − 0.50 0.31 3.45 76 0.15
08 − 1.46 − 5.80 0.66 7.33 37 0.69
09 − 0.97 − 3.99 0.52 7.03 61 0.52
11 − 1.84 − 4.36 0.54 3.94 27 0.49
12 − 1.41 − 3.86 0.36 3.44 50 0.34
21 − 1.79 − 2.90 − 0.09 − 0.33 11 0.51
22 − 0.72 − 2.15 0.61 6.28 53 0.47
23 − 1.39 − 4.93 0.35 2.66 26 0.57
24 − 1.84 − 4.41 0.94 5.23 31 0.59
25 − 1.02 − 1.79 0.19 0.78 11 0.29
26 − 1.37 − 3.70 0.54 4.53 57 0.39
27 − 1.17 − 5.40 0.90 11.81 68 0.70
28 − 0.84 − 3.41 0.91 9.72 48 0.71
29 − 1.15 − 4.50 1.04 11.46 59 0.72
32 − 0.89 − 2.32 0.83 5.09 46 0.41
33 − 1.24 − 3.41 0.47 4.17 73 0.31
42 − 1.40 − 2.73 0.33 1.20 20 0.32
43 − 0.27 − 0.97 0.17 1.30 14 0.22
51 − 0.45 − 2.40 0.92 16.73 106 0.74
52 − 1.19 − 5.98 0.82 14.70 100 0.73
53 − 0.73 − 3.09 0.69 10.12 87 0.58
54 − 0.50 − 2.63 0.70 13.95 107 0.69
55 − 0.49 − 2.16 0.52 8.03 80 0.48
56 − 1.35 − 2.77 0.19 1.12 24 0.32
57 0.08 0.30 0.53 6.58 62 0.42
58 − 1.00 − 4.12 0.74 9.17 74 0.57
59 − 0.56 − 2.70 0.65 10.78 96 0.59

54
Results Gravity analysis at the 2-digit level for China (continued)
SITC 2 Log (distance) Log (gdp_wb) # obs. R2
Coefficient t-value Coefficient t-value
61 − 1.36 − 4.15 0.75 6.21 61 0.49
62 0.06 0.28 0.64 11.31 117 0.53
63 − 0.59 − 2.35 0.84 11.55 70 0.69
64 − 1.12 − 4.93 0.80 11.57 82 0.66
65 − 0.65 − 2.41 0.63 9.25 138 0.43
66 − 0.62 − 3.37 0.84 17.69 119 0.75
67 − 1.37 − 6.86 0.78 13.83 99 0.72
68 − 1.19 − 4.94 0.84 12.46 77 0.71
69 − 0.28 − 1.56 0.83 18.12 129 0.74
71 − 1.05 − 3.92 0.76 10.98 95 0.63
72 − 0.97 − 4.59 0.57 10.25 119 0.55
73 − 0.82 − 4.11 0.72 11.95 78 0.70
74 − 0.69 − 3.70 0.86 17.25 124 0.74
75 − 0.20 − 0.82 1.33 18.04 97 0.78
76 − 0.61 − 2.61 1.17 17.41 111 0.75
77 − 0.50 − 2.21 1.04 17.49 126 0.73
78 − 0.42 − 2.06 0.68 13.50 125 0.62
79 − 0.78 − 1.95 0.23 1.93 67 0.11
81 − 0.16 − 0.86 0.91 18.14 111 0.76
82 − 0.28 − 1.09 1.05 13.41 80 0.70
83 0.20 0.85 1.02 17.57 110 0.75
84 − 0.69 − 2.37 0.97 12.62 123 0.60
85 0.07 0.27 0.81 12.81 132 0.57
87 − 0.84 − 4.33 0.89 15.92 94 0.76
88 − 0.51 − 2.32 1.13 16.64 85 0.78
89 − 0.03 − 0.15 1.16 22.10 132 0.80
90 − 0.61 − 0.96 0.05 0.16 24 0.05
93 − 0.28 − 0.32 0.79 3.40 20 0.41

55
Annex E Geographical destination of Dutch and Chinese strong export sectors
Chinese exports of strong sectors by destination, 2000
Average distance Distance East-Asia EU USA Rest
SITC 2 km decay RCA <2500 <10000 <12500
%
03 4050 − 1.25 1.35 72.10 8.89 15.59 3.42
27 5146 − 1.17 1.50 51.20 16.62 18.75 13.43
29 5648 − 1.15 1.50 47.11 20.72 22.34 9.84
32 4168 − 0.89 2.06 67.87 13.10 7.29 11.73
52 5583 − 1.19 1.28 40.77 15.20 16.57 27.47
57 8632 0.08 5.57 9.62 36.62 34.85 18.90
63 6471 − 0.59 1.26 41.71 17.50 34.56 6.24
65 4981 − 0.65 1.64 52.47 13.06 14.61 19.85
66 7092 − 0.62 1.15 32.91 19.28 36.91 10.90
69 7394 − 0.28 1.54 28.32 22.30 36.92 12.46
75 6977 − 0.20 1.50 31.84 20.47 35.66 12.03
76 6342 − 0.61 1.63 41.83 14.89 31.96 11.32
77 5972 − 0.50 1.15 44.63 16.31 27.23 11.84
81 8288 − 0.16 4.69 21.50 18.31 52.36 7.83
82 8275 − 0.28 2.32 25.02 13.12 58.62 3.24
83 6274 0.20 7.43 43.69 23.66 26.14 6.51
84 5270 − 0.69 4.51 56.31 15.95 18.61 9.13
85 7531 0.07 6.29 33.71 10.04 49.35 6.90
88 6036 − 0.51 2.20 45.89 19.82 26.50 7.78
89 7456 − 0.03 3.33 32.10 18.53 43.35 6.03
Source: Own calculations based on Feenstra and Lipsey (2005), CEPII (2005).

56
Dutch exports of strong sectors by destination, 2000
Average distance Distance EU USA CHN Rest
SITC 2 km decay RCA <2500 <7500 <10000
%
00 1351 – 0.70 2.36 86.48 9.97 1.23 2.31
01 1307 – 0.75 3.22 91.35 1.66 5.14 1.85
02 2097 – 0.30 4.55 74.50 9.00 7.14 9.36
05 1037 – 1.20 2.53 91.65 4.31 1.54 2.50
06 2072 – 0.60 1.36 79.08 7.56 9.11 4.24
07 1874 – 0.82 1.84 80.98 9.17 5.21 4.64
08 985 – 1.04 2.81 94.07 0.81 3.20 1.92
09 2288 – 0.45 2.35 78.46 4.17 7.84 9.53
11 4158 – 0.56 1.80 38.63 49.37 9.34 2.66
12 1088 – 0.56 4.41 97.24 0.85 0.91 0.99
21 3379 – 0.10 1.81 68.79 2.90 27.03 1.27
27 858 – 0.95 1.08 92.76 3.81 1.59 1.85
29 1589 – 1.07 8.08 85.31 7.25 5.57 1.87
33 566 – 1.07 1.04 95.24 3.16 0.46 1.15
34 308 – 1.25 1.17 98.93 1.07 0.00 0.00
41 751 – 0.79 1.22 96.68 0.61 1.13 1.59
42 1327 – 0.94 2.39 88.57 4.83 4.27 2.32
43 1501 – 0.65 3.74 86.45 4.15 4.57 4.83
51 2007 – 0.53 1.87 80.09 7.31 8.80 3.80
52 1695 – 0.65 1.21 82.84 9.70 4.21 3.24
53 2215 – 0.52 1.44 78.89 5.70 8.57 6.83
54 2455 – 0.52 1.35 75.40 9.10 6.61 8.88
55 1689 – 0.73 1.10 86.03 3.48 5.46 5.04
56 1666 – 0.52 1.67 85.75 4.35 5.94 3.96
58 1518 – 0.88 2.29 87.44 3.23 5.56 3.77
59 2665 – 0.42 1.70 72.98 7.73 12.20 7.09
64 1438 – 0.83 1.11 87.83 4.44 4.13 3.60
75 1021 – 1.33 1.64 92.81 3.04 1.08 3.07
77 2617 – 0.72 0.99 73.46 6.41 14.56 5.57
88 4720 – 0.47 1.76 43.38 23.15 31.31 2.16
94 5144 0.02 1.34 20.61 64.82 11.30 3.26
Source: Own calculations based on Feenstra and Lipsey (2005), CEPII (2005).