Embed Size (px)
Citation preview
Summary
A few words about MAKE
▪ MAKE is one of the global wind industry's
premier strategic consulting and research
firms, serving the world’s leading wind
companies from all parts of the value chain
from raw material suppliers to IPPs and
utilities.
▪ MAKE is based in Aarhus (DK) and has offices
in Hamburg (D), Chicago, Boston (U.S.) &
Shanghai (China).
▪ Publish industry leading wind energy research
reports, analysis and databases
▪ Consult on wind farm investments, market
assessment, supply chain dynamics, technology,
operations & maintenance, M&A advisory,
business & market modelling and offshore wind
▪ Due-diligence partner for European and
international PE and industrial investors
Introduction
Andy Li
Business Analyst
▪ Leads the execution of MAKE’s China advisory projects
▪ Solid background in the Chinese wind industry including
product development at Envision Energy
▪ Extensive knowledge of wind turbine, wind farm
solutions, and big data platform development
▪ B.Eng – Mechanical Engineering
▪ M.Eng – Industrial and Financial Engineering
2Japan offshore wind market overview
March 2017
3
Introduction
A sample of our industrial clients
Japan offshore wind market overview
March 2017
4
Introduction
A sample of our financial clients
Japan offshore wind market overview
March 2017
Contents
5
▪ Executive summary
▪ Global wind turbine technology trends
▪ Sources of innovation and ‘breakthrough’ technology
Delivering renewableenergy insight
TM
6
Executive summary
24 April 2017
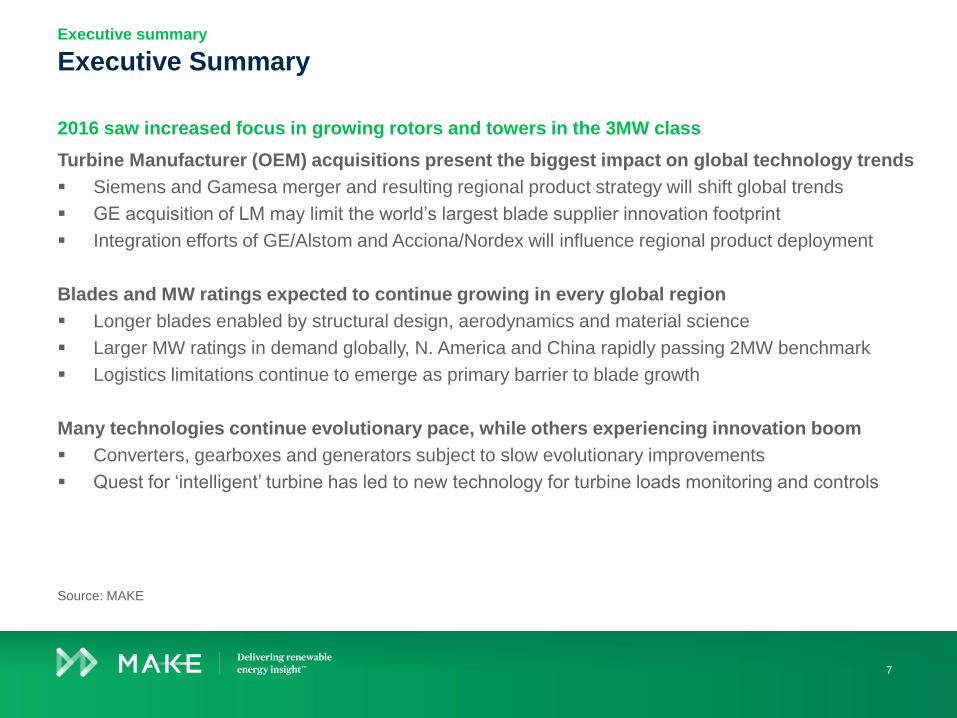
2016 saw increased focus in growing rotors and towers in the 3MW class
Executive Summary
Source: MAKE
Turbine Manufacturer (OEM) acquisitions present the biggest impact on global technology trends
▪ Siemens and Gamesa merger and resulting regional product strategy will shift global trends
▪ GE acquisition of LM may limit the world’s largest blade supplier innovation footprint
▪ Integration efforts of GE/Alstom and Acciona/Nordex will influence regional product deployment
Blades and MW ratings expected to continue growing in every global region
▪ Longer blades enabled by structural design, aerodynamics and material science
▪ Larger MW ratings in demand globally, N. America and China rapidly passing 2MW benchmark
▪ Logistics limitations continue to emerge as primary barrier to blade growth
Many technologies continue evolutionary pace, while others experiencing innovation boom
▪ Converters, gearboxes and generators subject to slow evolutionary improvements
▪ Quest for ‘intelligent’ turbine has led to new technology for turbine loads monitoring and controls
Executive summary
7
Delivering renewableenergy insight
TM
8
Global wind turbine
technology trends
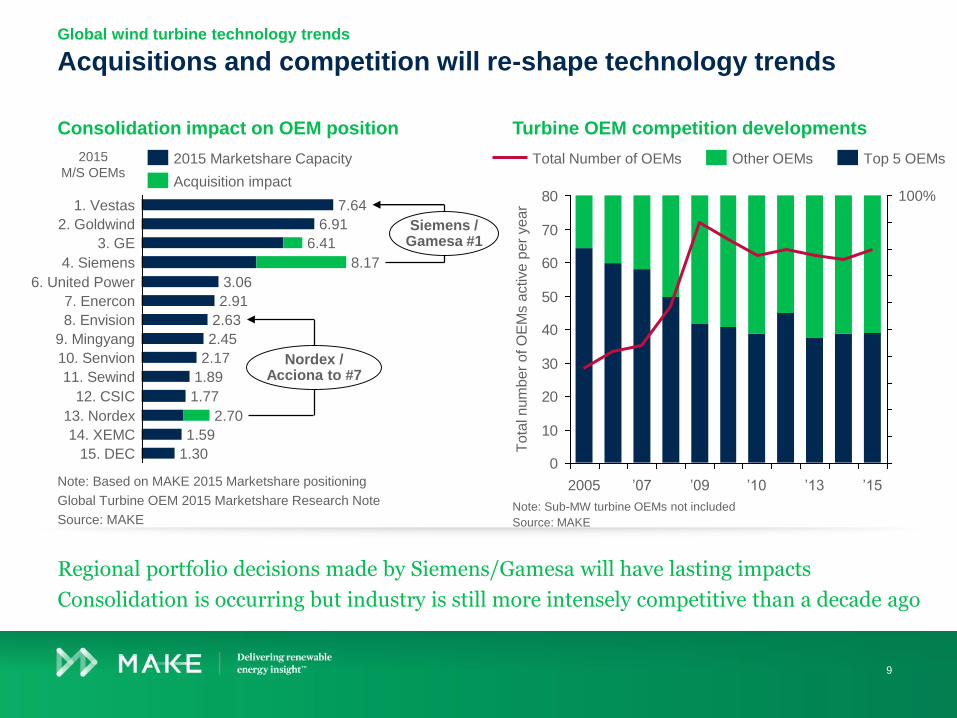
Consolidation impact on OEM position
Acquisitions and competition will re-shape technology trends
Turbine OEM competition developments
Global wind turbine technology trends
Note: Based on MAKE 2015 Marketshare positioning
Global Turbine OEM 2015 Marketshare Research Note
Source: MAKENote: Sub-MW turbine OEMs not included
Source: MAKE
Regional portfolio decisions made by Siemens/Gamesa will have lasting impacts
Consolidation is occurring but industry is still more intensely competitive than a decade ago
9
4. Siemens
2. Goldwind
8.17
3. GE
3.06
7.64
6.41
6.91
1. Vestas
9. Mingyang
12. CSIC
Siemens /Gamesa #1
13. Nordex
15. DEC 1.30
Nordex /Acciona to #7
14. XEMC
2.70
11. Sewind
1.59
1.89
1.77
10. Senvion 2.17
2.45
8. Envision 2.63
7. Enercon 2.91
6. United Power
Acquisition impact
2015 Marketshare Capacity2015
M/S OEMs
0
10
20
30
40
50
60
70
80 100%
’152005 ’10’09
To
tal n
um
ber
of O
EM
s a
ctive
per
ye
ar
’13’07
Top 5 OEMsOther OEMsTotal Number of OEMs
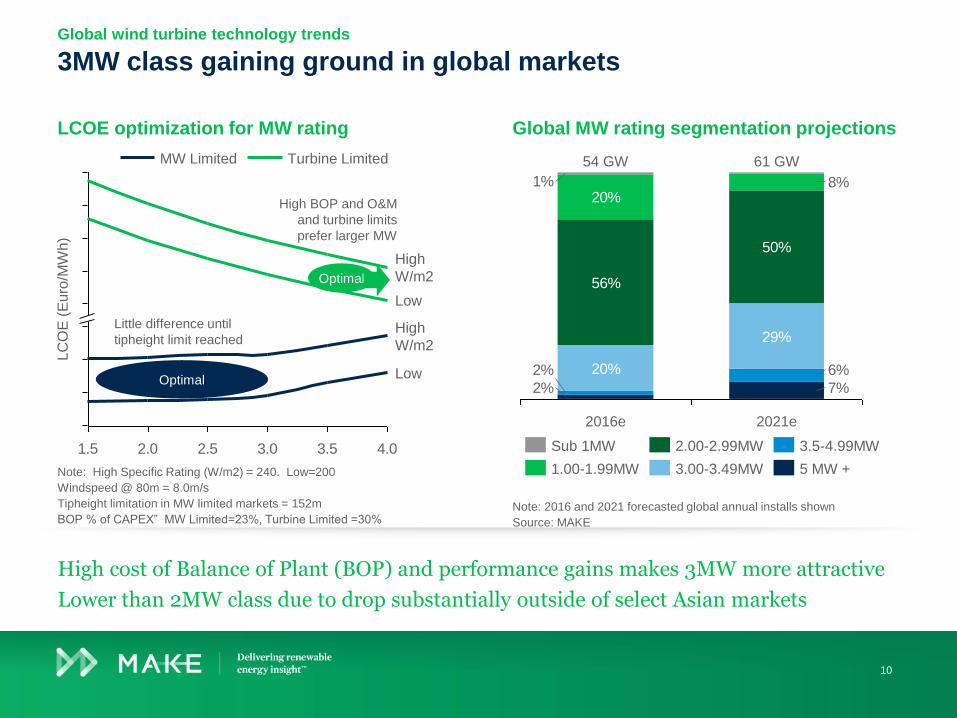
LCOE optimization for MW rating
3MW class gaining ground in global markets
Global MW rating segmentation projections
Global wind turbine technology trends
Note: High Specific Rating (W/m2) = 240. Low=200
Windspeed @ 80m = 8.0m/s
Tipheight limitation in MW limited markets = 152m
BOP % of CAPEX” MW Limited=23%, Turbine Limited =30%Note: 2016 and 2021 forecasted global annual installs shown
Source: MAKE
High cost of Balance of Plant (BOP) and performance gains makes 3MW more attractive
Lower than 2MW class due to drop substantially outside of select Asian markets
10
Optimal
Optimal
1.5 2.0 2.5 3.0 3.5 4.0
LC
OE
(E
uro
/MW
h)
High
W/m2
Low
High
W/m2
Low
Turbine LimitedMW Limited
Little difference until
tipheight limit reached
High BOP and O&M
and turbine limits
prefer larger MW
20%
29%
56%
50%
7%2%
6%2%
8%20%
1%
2021e
61 GW
2016e
54 GW
5 MW +
3.5-4.99MW
3.00-3.49MW
2.00-2.99MW
1.00-1.99MW
Sub 1MW
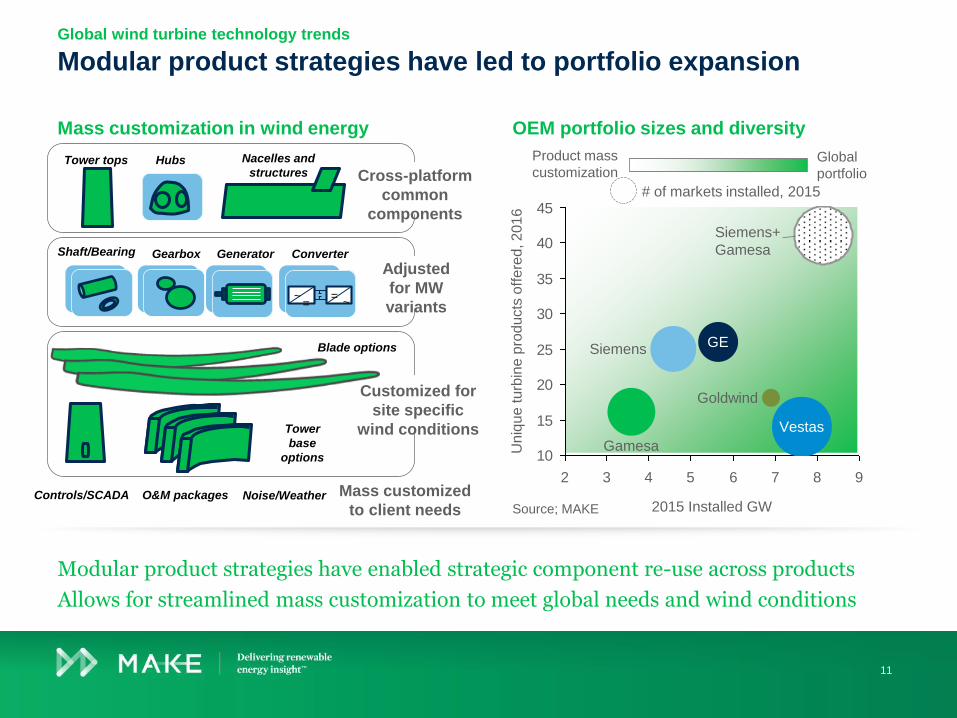
Mass customization in wind energy
Modular product strategies have led to portfolio expansion
OEM portfolio sizes and diversity
Global wind turbine technology trends
Source; MAKE
Modular product strategies have enabled strategic component re-use across products
Allows for streamlined mass customization to meet global needs and wind conditions
11
Adjusted
for MW
variants
Gearbox Generator ConverterShaft/Bearing
==~
~
Blade options
Tower
base
options
HubsTower tops Nacelles and
structures Cross-platform
common
components
Customized for
site specific
wind conditions
Mass customized
to client needsControls/SCADA O&M packages Noise/Weather
10
15
20
25
30
35
40
45
976 853 42
Un
iqu
e t
urb
ine p
rod
ucts
off
ere
d, 2016
2015 Installed GW
GESiemens
Vestas
Gamesa
Siemens+
Gamesa
Goldwind
# of markets installed, 2015
Global
portfolio
Product mass
customization
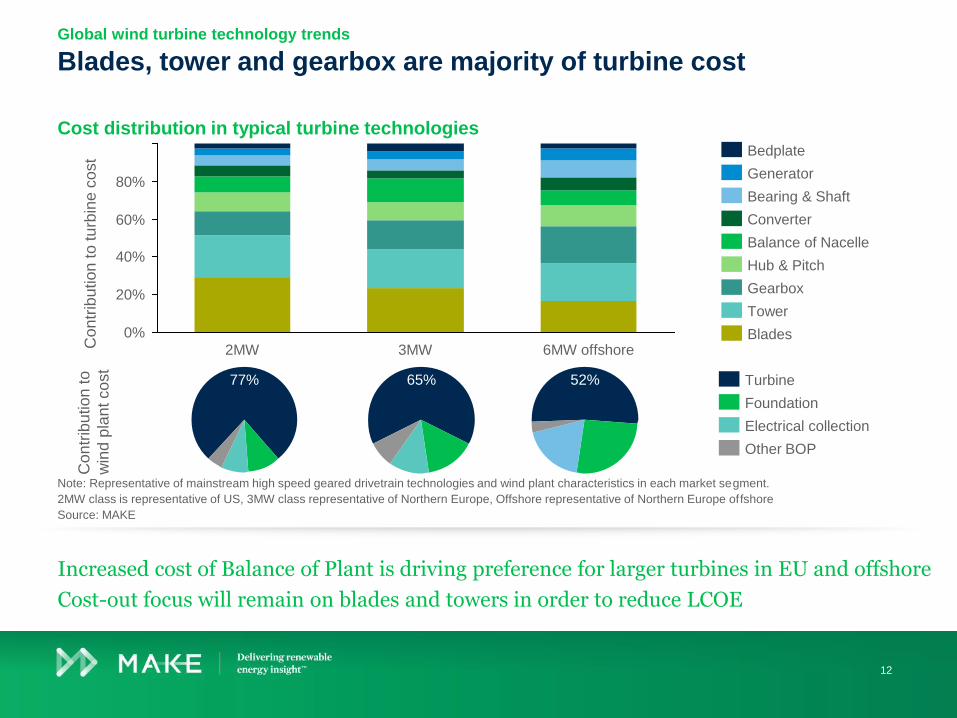
Cost distribution in typical turbine technologies
Blades, tower and gearbox are majority of turbine costGlobal wind turbine technology trends
Note: Representative of mainstream high speed geared drivetrain technologies and wind plant characteristics in each market segment.
2MW class is representative of US, 3MW class representative of Northern Europe, Offshore representative of Northern Europe offshore
Source: MAKE
Increased cost of Balance of Plant is driving preference for larger turbines in EU and offshore
Cost-out focus will remain on blades and towers in order to reduce LCOE
12
0%
60%
80%
40%
20%
2MW 3MW 6MW offshoreBlades
Tower
Gearbox
Hub & Pitch
Balance of Nacelle
Bearing & Shaft
Converter
Generator
Bedplate
77% 65% 52%
Other BOP
Electrical collection
Foundation
Turbine
Con
trib
ution t
o tu
rbin
e c
ost
Con
trib
ution t
o
win
d p
lan
t co
st
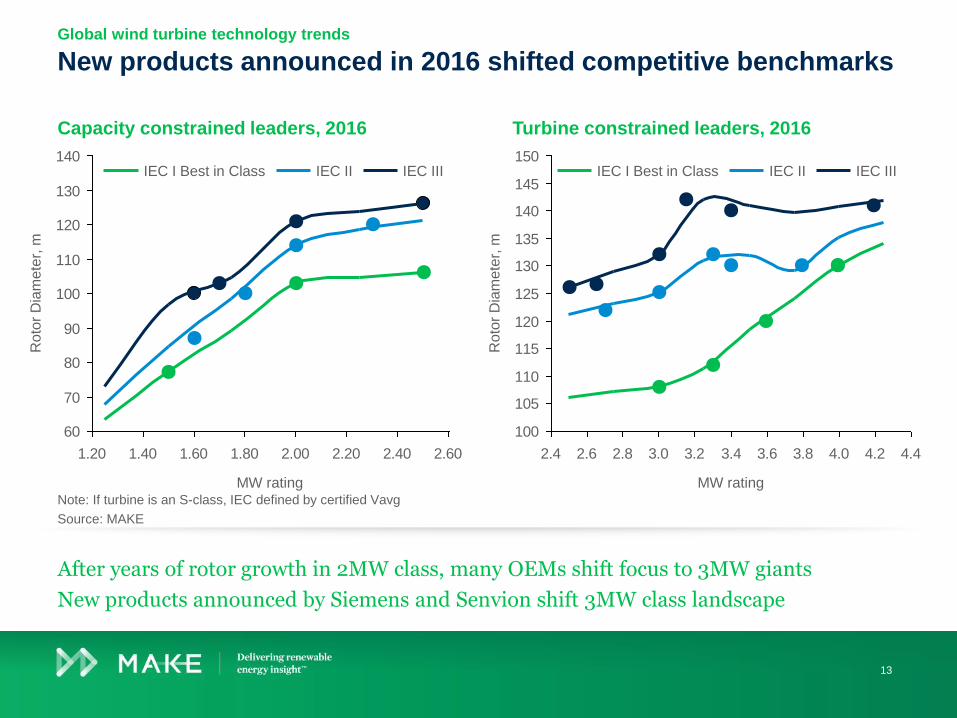
Capacity constrained leaders, 2016
New products announced in 2016 shifted competitive benchmarks
Turbine constrained leaders, 2016
Global wind turbine technology trends
Note: If turbine is an S-class, IEC defined by certified Vavg
Source: MAKE
After years of rotor growth in 2MW class, many OEMs shift focus to 3MW giants
New products announced by Siemens and Senvion shift 3MW class landscape
13
60
70
80
90
100
110
120
130
140
1.20 1.40 1.60 1.80 2.00 2.20 2.40 2.60
MW rating
Ro
tor
Dia
me
ter,
m
IEC IIIIEC IIIEC I Best in Class
100
105
110
115
120
125
130
135
140
145
150
2.4 2.6 2.8 3.0 3.2 3.4 3.6 3.8 4.0 4.2 4.4
Ro
tor
Dia
me
ter,
mMW rating
IEC I Best in Class IEC II IEC III
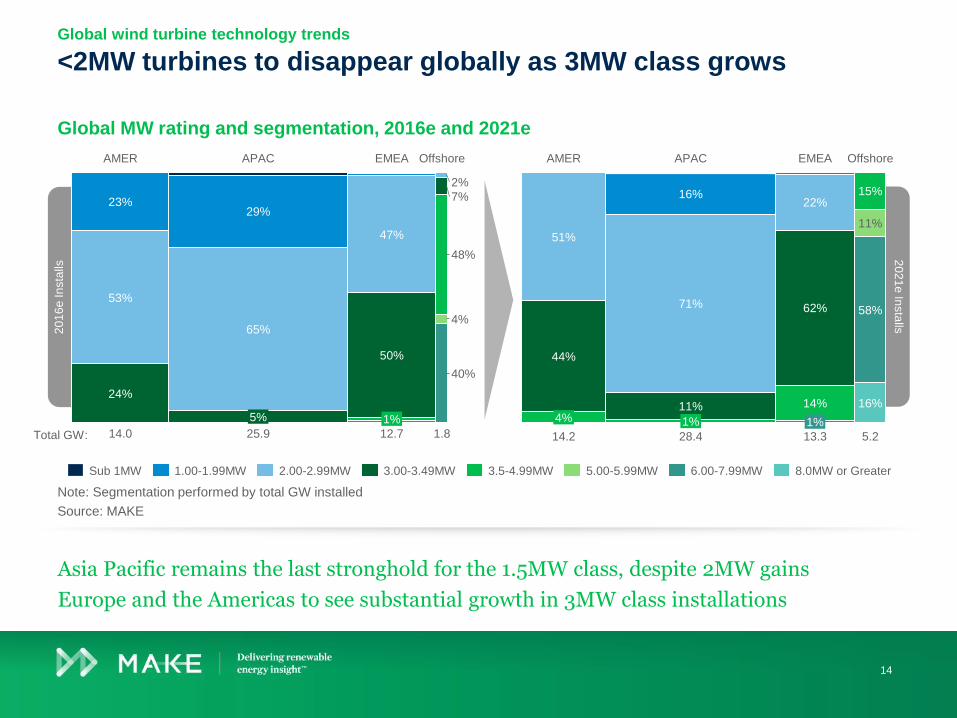
Global MW rating and segmentation, 2016e and 2021e
<2MW turbines to disappear globally as 3MW class growsGlobal wind turbine technology trends
Note: Segmentation performed by total GW installed
Source: MAKE
Asia Pacific remains the last stronghold for the 1.5MW class, despite 2MW gains
Europe and the Americas to see substantial growth in 3MW class installations
14
20
21
e In
sta
lls2
01
6e
In
sta
lls
48%
7%
65%
23%
AMER
47%
50%
12.7
40%
5%
APAC
4%
OffshoreEMEA
25.9
24%
29%
14.0 1.8
53%
1%
2%
Total GW:
44%
51%
4%
15%
14%
22%
16%
11%
11%
71% 62%
28.4
1%
16%
AMER
14.2
APAC Offshore
5.2
58%
EMEA
13.3
1%
8.0MW or GreaterSub 1MW 3.5-4.99MW2.00-2.99MW 3.00-3.49MW 6.00-7.99MW5.00-5.99MW1.00-1.99MW
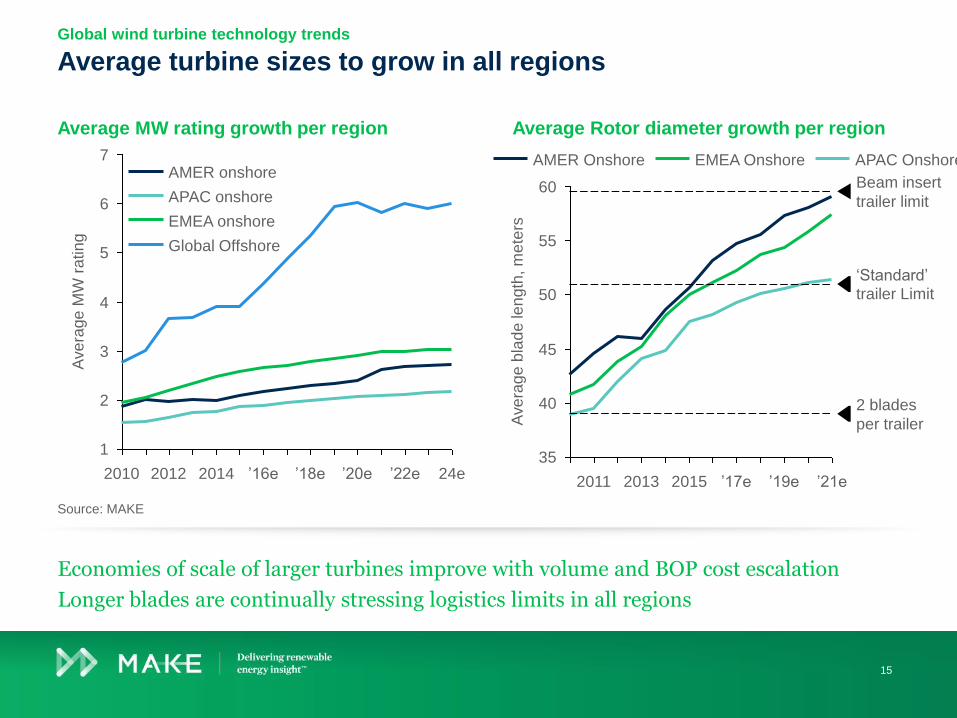
Average MW rating growth per region
Average turbine sizes to grow in all regions
Average Rotor diameter growth per region
Global wind turbine technology trends
Source: MAKE
Economies of scale of larger turbines improve with volume and BOP cost escalation
Longer blades are continually stressing logistics limits in all regions
15
1
2
3
4
5
6
7
24e’22e
Ave
rage
MW
ratin
g
’18e ’20e2010 2012 2014 ’16e
Global Offshore
APAC onshore
AMER onshore
EMEA onshore
35
40
45
50
55
60
’21e2011 ’19e’17e20152013
Beam insert
trailer limit
Ave
rage
bla
de
le
ngth
, m
ete
rs
2 blades
per trailer
‘Standard’trailer Limit
EMEA Onshore APAC OnshoreAMER Onshore
Delivering renewableenergy insight
TM
16
Sources of innovation
and ‘breakthrough’
technology
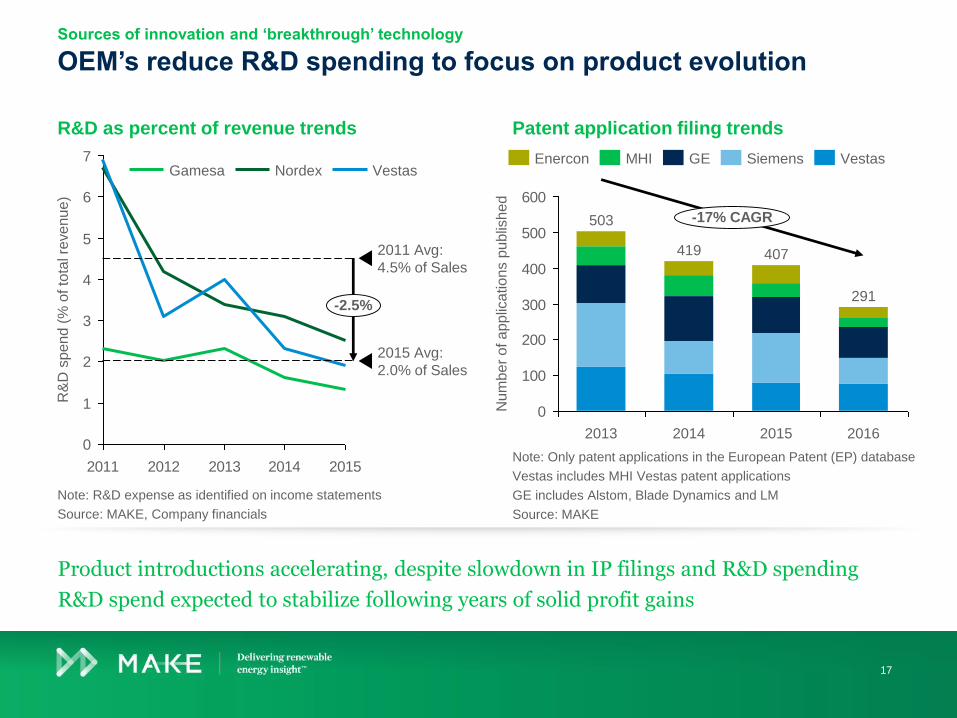
R&D as percent of revenue trends
OEM’s reduce R&D spending to focus on product evolution
Patent application filing trends
Sources of innovation and ‘breakthrough’ technology
Note: R&D expense as identified on income statements
Source: MAKE, Company financials
Note: Only patent applications in the European Patent (EP) database
Vestas includes MHI Vestas patent applications
GE includes Alstom, Blade Dynamics and LM
Source: MAKE
Product introductions accelerating, despite slowdown in IP filings and R&D spending
R&D spend expected to stabilize following years of solid profit gains
17
0
1
2
3
4
5
6
7
2011 2012 2013 2014 2015
2015 Avg:
2.0% of Sales
2011 Avg:
4.5% of Sales
-2.5%
R&
D s
pen
d (
% o
f to
tal re
ve
nu
e)
VestasGamesa Nordex
0
100
200
300
400
500
600
2013
-17% CAGR
2014
419 407
2015
503
Nu
mb
er
of a
pp
lica
tion
s p
ub
lish
ed
291
2016
VestasSiemensGEEnercon MHI
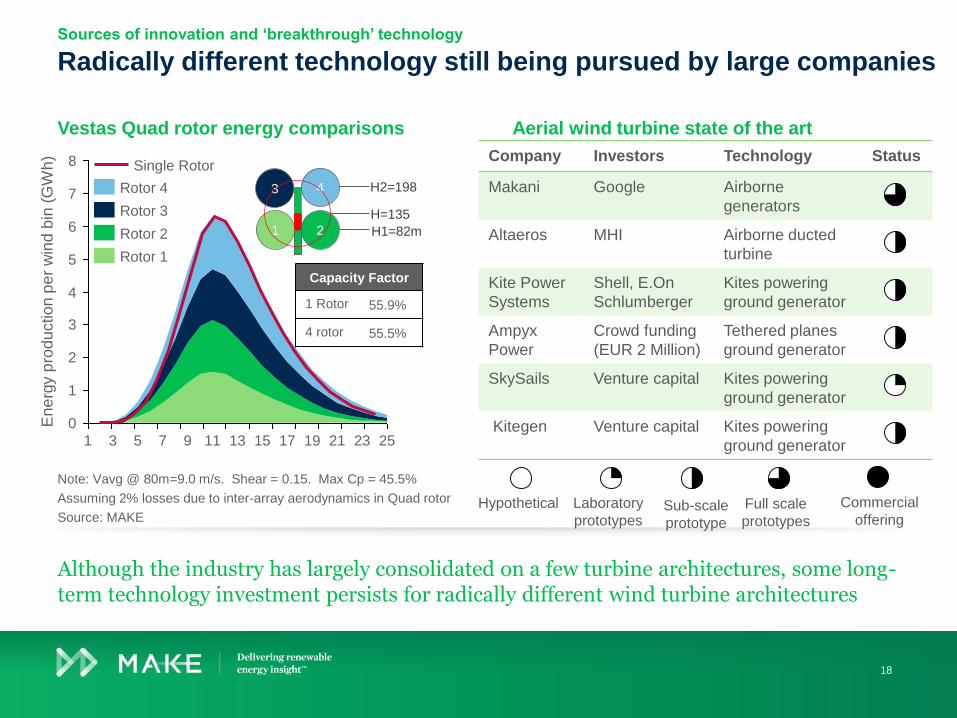
Vestas Quad rotor energy comparisons
Radically different technology still being pursued by large companies
Aerial wind turbine state of the art
Sources of innovation and ‘breakthrough’ technology
Note: Vavg @ 80m=9.0 m/s. Shear = 0.15. Max Cp = 45.5%
Assuming 2% losses due to inter-array aerodynamics in Quad rotor
Source: MAKE
Although the industry has largely consolidated on a few turbine architectures, some long-term technology investment persists for radically different wind turbine architectures
18
2
1
3
0
8
7
4
6
5
13111 19 23 255 1773 21
En
erg
y p
rod
uction p
er
win
d b
in (
GW
h)
159
Capacity Factor
1 Rotor 55.9%
4 rotor 55.5%
3 4
1 2
Single Rotor
Rotor 3
Rotor 4
Rotor 1
Rotor 2 H1=82m
H2=198
H=135
Company Investors Technology Status
Makani Google Airborne
generators
Altaeros MHI Airborne ducted
turbine
Kite Power
Systems
Shell, E.On
Schlumberger
Kites powering
ground generator
Ampyx
Power
Crowd funding
(EUR 2 Million)
Tethered planes
ground generator
SkySails Venture capital Kites powering
ground generator
Kitegen Venture capital Kites powering
ground generator
Hypothetical Laboratory
prototypesSub-scale
prototype
Full scale
prototypes
Commercial
offering
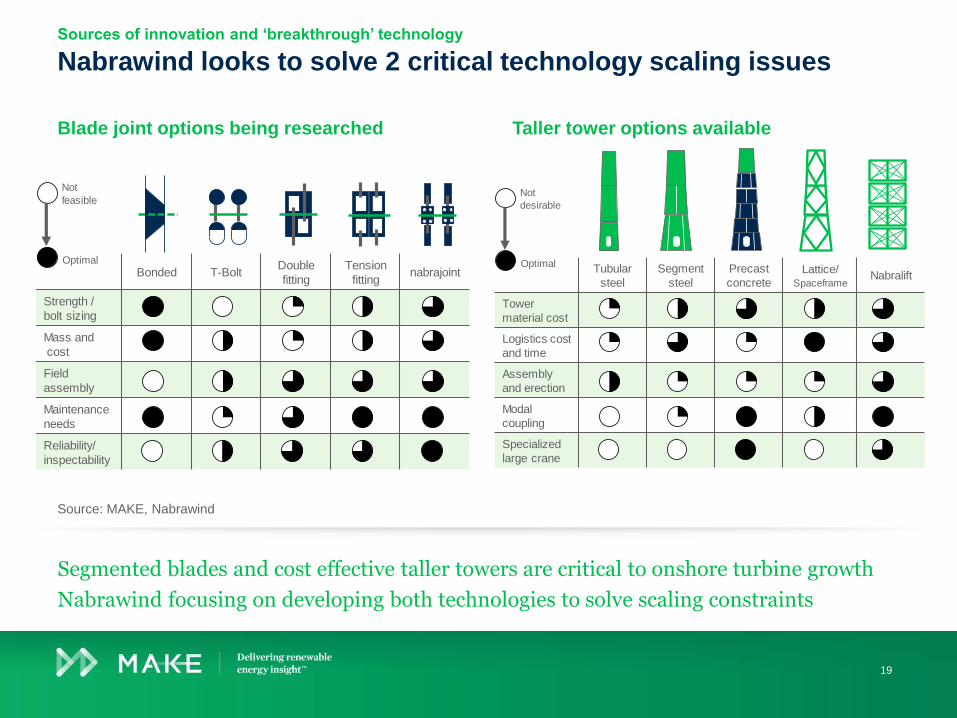
Blade joint options being researched
Nabrawind looks to solve 2 critical technology scaling issues
Taller tower options available
Sources of innovation and ‘breakthrough’ technology
Source: MAKE, Nabrawind
Segmented blades and cost effective taller towers are critical to onshore turbine growth
Nabrawind focusing on developing both technologies to solve scaling constraints
19
Tubular
steel
Segment
steel
Precast
concreteLattice/
SpaceframeNabralift
Tower
material cost
Logistics cost
and time
Assembly
and erection
Modal
coupling
Specialized
large crane
Optimal
Not
desirable
Bonded T-BoltDouble
fitting
Tension
fittingnabrajoint
Strength /
bolt sizing
Mass and
cost
Field
assembly
Maintenance
needs
Reliability/
inspectability
Optimal
Not
feasible
Contact
consultmake.com
© 2017 MAKE Consulting A/S. All rights reserved. Reproduction or distribution of this report in any form without prior written permission is strictly forbidden.
Violation of the above restrictions will be subjects to legal action under the Danish Arbitration Act. The information herein is taken from sources considered
reliable, but its accuracy and completeness are not warranted, nor are the opinions, analyses and forecasts on which they are based. MAKE Consulting A/S
cannot be held liable for any errors in this report, neither can MAKE Consulting A/S be liable for any financial loss or damage caused by the use of the
information presented in this report.
Denmark
Sønder Allé 9
DK-8000
Aarhus
T +45 7026 6628
U.S.
117 N. Jefferson Street
Suite 400
Chicago, IL 60661
T +1 312 441 9590
U.S.
33 Bradford St
Concord
MA 02110
T +1 978 448 3186
China
Level 26, Shanghai
Times Sq. Office Tower,
Shanghai 200021
T +86 21 5286 0152
Germany
Neuer Wall 10
20354
Hamburg
T +49 40 822 15 3111
Andy Li
20