Embed Size (px)
Citation preview
Analyst PRESENTATION
Global Wind Power Growing Opportunities for
Japanese Companies MAKE-IDK Japan Wind Power Roadshow
Feb 2017
Shane Sun

Summary
A few words about MAKE
MAKE is one of the global wind industry's
premier strategic consulting and research
firms, serving the world’s leading wind
companies from all parts of the value chain
from raw material suppliers to IPPs and
utilities.
MAKE is based in Aarhus (DK) and has offices in
Hamburg (D), Chicago, Boston (U.S.) & Shanghai
(China).
Publish industry leading wind energy research
reports, analysis and databases
Consult on wind farm investments, market
assessment, supply chain dynamics, technology,
operations & maintenance, M&A advisory,
business & market modelling and offshore wind
Due-diligence partner for European and
international PE and industrial investors
Introduction
Shane Sun – Head of APAC at MAKE
Heads MAKE’s operations in Asia-Pacific and
leads the execution of custom consulting
projects.
Solid background in the Chinese wind industry
including from Goldwind Science & Technology
Extensive investor relations, market research,
financial analysis consulting and senior
management experience in the wind industry.
BSc Honours in Management
2MAKE-IDK Japan Wind Power Roadshow
February 2017

Introduction
Global footprint and key milestones
MAKE’s strategically
placed global offices
Top 15 wind power
markets
2005
MAKE is founded in
Aarhus, Denmark,
with a focus on
offering high-quality
research products
for the wind power
industry.
2007
The first overseas
office is opened in
Shanghai, China.
2008
MAKE broadens its
global presence
through the
establishment of
another branch
office in Chicago,
U.S.
2010
Yet another office is
opened in the U.S.,
in Boston.
MAKE starts to
build its technology
team.
2011
The technology
team is fully formed
and launched for
both intelligence
and advisory
services.
2013
MAKE launches
new and improved
research product
portfolio.
2014
MAKE opens an
office in Hamburg,
Germany
3MAKE-IDK Japan Wind Power Roadshow
February 2017

Introduction
A sample of our clients
4MAKE-IDK Japan Wind Power Roadshow
February 2017

Our team that is always ready to serve you
5MAKE-IDK Japan Wind Power Roadshow
February 2017
Introduction

Renewable energy intelligence at your fingertips
Launching the MAKE appIntroduction
6MAKE-IDK Japan Wind Power Roadshow
February 2017

Delivering renewableenergy insightTM
Global Wind PowerGrowing Opportunities for
Japanese Companies

Outlook for electricity generation 1990-2035e (TWh)
Global electricity generation increases by ~64% to 2040
Source: MAKE, IEA
Growth in global installed electricity generation capacity from 2014 to 2040 from 6,117 GW to 11,168 GW, corresponding to 83% increase. 63% of global investments in new power plants are in renewables mainly wind, hydro and solar, while 1,500 GW conventional power plant is expected to retire
Global Market Trends
0
5.000
10.000
15.000
20.000
25.000
30.000
35.000
40.000
TWh
2025e2014
+1,9%
2030e2020e 2035e1990 2040e
OECD AmericasOECD Europe
Eastern Europe/Eurasia Middle-East
AfricaOECD & Non-OECD APAC
Latin America
8MAKE-IDK Japan Wind Power Roadshow
February 2017
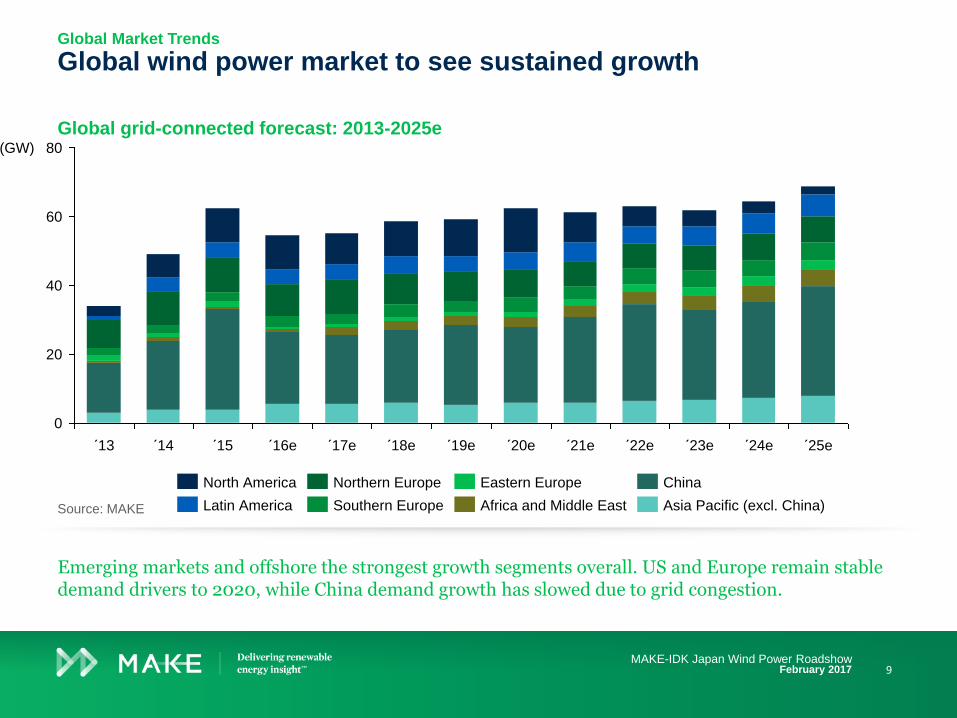
Global grid-connected forecast: 2013-2025e
Global wind power market to see sustained growth
Source: MAKE
Emerging markets and offshore the strongest growth segments overall. US and Europe remain stable demand drivers to 2020, while China demand growth has slowed due to grid congestion.
80
60
0
40
20
´24e´23e´14 ´20e´15 ´16e ´18e´17e´13 ´21e´19e ´22e
(GW)
´25e
Latin America
Eastern EuropeNorth America Northern Europe
Southern Europe Asia Pacific (excl. China)
China
Africa and Middle East
Global Market Trends
9MAKE-IDK Japan Wind Power Roadshow
February 2017

Global grid-connected forecast: 2013-2025e
Offshore wind segment to triple in share of global market
Source: MAKE
Offshore growth largely to be European until 2020 after which Chinese offshore is expected to be a key driver for global demand
40
20
60
80
0
´24e
6%
5%
5%
3%
14%
8%
3%
9% 9% 13%12%6%
´18e´13 ´20e ´21e´19e´16e ´17e ´23e´14 ´22e´15
(GW)
10%
´25e
Offshore markets Onshore markets
Global Market Trends
10MAKE-IDK Japan Wind Power Roadshow
February 2017

Global offshore wind grid-connected forecast: 2013-2025e
Europe key market for offshore in the medium termGlobal Market Trends
Source: MAKE
European near term offshore wind growth, technology development and scaling and industrialisation of supply chain is key for reducing offshore wind LCOE
10
12
6
3
0
9
2
4
1
8
5
7
11
8.3
5.2
’19e
5.7
4.9
’23e
3.53.23.4
’21e’17e’16e
6.4
’22e
1.8
9.3
’14
7.5
1.7
’18e’15 ’20e
7.1
’25e’24e’13
AMER EMEAAPAC
11MAKE-IDK Japan Wind Power Roadshow
February 2017

European offshore wind growth
European wind industry reliant on offshore wind for future growthEuropean offshore wind power demand
Source: MAKE
More than 70% of new offshore wind farms in Europe will be commissioned in the UK, Germany, and the Netherlands. France will also become a key market from 2020.
1228 February 2017
3.0
2.5
2.0
1.5
1.0
0.5
0.0
4.0
3.5
2025e
3.4
2024e
3.3
2023e
3.6
2022e
3.5
2021e
2.9
(GW)+12%
2020e
3.9
2019e
3.6
2018e
2.7
2017e
2.7
2016e
1.2
2015
3.0
Portugal Belgium
Denmark
Sweden
Poland
Ireland
Finland
UK
Germany
Netherlands
France

Asia Pacific offshore wind growth
Asia Pacific market to add 23.5GW through 2025Asia Pacific offshore wind power demand
Source: MAKE
Transition to large-scale nearshore projects helps China maintain its market leader position. Port projects will boost Japan’s share from 2020 onwards.
1328 February 2017
1
0
2
3
5
6
4
0.7
’20e
1.8
’19e
1.2
’18eCum.
2015
’22e
3.5
5.5
2.8
0.9
’21e ’25e’16e
2.3
0.50.6
’17e ’24e
4.3
’23e
0.3
(GW)
2015
+32%
ChinaJapanTaiwan S.Korea

US offshore wind outlook, 2016e to 2025e
US offshore wind outlook: 1.6GW expected by 2025
Outlook by state, 2016e to 2025e
American offshore wind power demand
Source: MAKE
Four states in the Northeast – MA, RI, NY, and MD – comprise 98% of the 10-year offshore outlook. Demand in NY and MA drives most of the capacity built offshore of RI.
1428 February 2017
121890
250
1,200
1,100
1,000
900
800
700
600
500
400
300
200
100
0
(MW)
MEOHNYRIMA
1,200
3 states comprise
98% of the 10-
year outlook
1,600
1,400
1,200
1,000
800
600
400
200
0
(MW)
400
650
400
90
181230
0
100
200
300
400
500
600
700
‘17e‘16e‘15 ‘25e‘24e‘23e‘22e‘21e‘20e‘19e‘18e
(MW)
33%
Annual grid-connected offshore wind capacity
Cumulative grid-connected offshore wind capacity

Top 10 offshore wind asset ownership,
YE2016e
Two Chinese companies to make it to top 10 asset ownership
Equity investments in European offshore
wind
Asset ownership and financing trends
Source: MAKE
Thanks to its maturity as an asset class, offshore wind increasingly attracts financial investors such as banks, pension funds and infrastructure funds.
1528 February 2017
Vattenfall
RWE
E.ON
DONG
5.5%
China Three
Gorges
6.8%Stadtwerke
München
7.7%
UniCredit Bank
12.9%
Green Investment Bank
13.0%
SSE
14.0%
27.1%
Longyuan
3.4%
4.2%
5.3%
7.5GW
IPPs4%
Financial investors
21%
Utilities
74%
Strategic investors2%10.1GW
Note: Based on FIDs for projects between 2014 to 2016.
Source: MAKE

Utilities’ power generation in 2015 European utilities are
restructuring
• Low power prices have deteriorated
conventional power generation
business
• Utilities such as DONG Energy,
E.ON and RWE are transitioning
from fossil fuel to renewable
generation assets
• Asset owners’ strategies involve
strengthening of balance sheets,
lower dependence on fluctuating
commodity prices and focus on
regulated activities to secure stable
European utilities are under significant pressureAsset ownership and financing trends
Note: Renewables include wind, solar and biomass. *) Share of renewables based on power and heat generation.
Source: MAKE
Subdued power prices are threatening conventional power generation assets as utilities sell or decommission their fossil fuel assets to increase renewable generation.
1628 February 2017
0 20 40 60 80 100 120 140 160 180 200 220
TWh
DONG Energy* 55%
SSE 17%
Statkraft 5%
Iberdrola 24%
Vattenfall 4%
E.ON 6%
RWE 5%
RenewablesOther

O&M market opportunity varies by region
Global O&M revenue to exceed USD 22 Billion by 2025
Global O&M revenue to grow by 10%
Americas near-term O&M boom from repowering
- Aging US fleet being retrofitted with longer blades for 10
years of additional PTC
- ISP acquisition and new O&M business models have
changed competitive landscape in US
- Brazil O&M remains in OEM control in near-term
Europe O&M is largest market segment in 2015
- High cost of service due to age of fleet and wind plant
demographics
- Regionally distributed and technically diverse fleets
prohibits building O&M economies of scale
Asian market to grow rapidly, will be largest market by 2025
- Many Chinese asset owners establishing in-house
teams to provide service to growing fleets
- Services pricing lower than other regions, but expected
to escalate over time
Offshore O&M presents unique challenges
- Full analysis of Offshore O&M market reserved for
separate MAKE Research Note (Q4/2015)
Global Market Trends
Source: MAKE
Note: Revenue opportunity from all onshore O&M sectors
Growth based on 3Q 2016 Market Outlook Update (MOU)
Source: MAKE
Market opportunity defined by scale and age of installed base, in addition to price sensitivity of regional markets
20
10
0
15
5
25
2025e2023e20152013 2017e 2019e 2021e
+10%CAGR
O&
M R
evenue
Opport
unity (
US
D B
illio
n)
AMER
EMEA
APAC
17MAKE-IDK Japan Wind Power Roadshow
February 2017

Wind energy LCOE by country - 2016 (€/MWh)
Wind energy LCOE leaders have established scale
Sensitivity of LCOE to input factors
Global Market Trends
Note: All LCOE shown in Nominal 2016 EUR/MWh
FX: (EUR/-) USD:0.88, BRL:0.25, GBP:1.25, ZAR:0.058, kINR:13, RMB:0.14
Source: MAKE
Note: Germany onshore 2016 baseline scenario
Source: MAKE
Americas have LCOE leadership, due to growing installs and high winds
High production, turbine pricing and low cost of capital are critical to LCOE leadership
-15
-10
-5
0
5
10
15
Chan
ge in
LC
OE
(E
uro
/MW
h)
% change in input variable
+20%+10%0-10%-20%
WACC
ENERGY OPEX
CAPEX
78
75
64
59
57
56
56
55
52
48
47
China
US
Mexico
UK
South Africa
India
Brazil
France
Canada
Turkey
Germany
EMEA
AMER
APAC
18MAKE-IDK Japan Wind Power Roadshow
February 2017

Onshore wind energy LCOE reduction and impact from technology development
LCOE improvements will be enabled by technical innovationGlobal Market Trends
Improving cost position and higher turbine performance are largely due to technical shifts in blades, towers and drivetrains.
10,0008,000 9,0007,000
NET PER TURBINE AEP (GWh)
1.51.41.3 1.6
CAPEX/MW (MMUSD/MW)
Technology group and potential future impact
RotorLonger blades, lightweight structures and efficient
manufacturing processes. Load-reducing pitch.
TowersTaller towers, wider base diameters enabled by
longitudinal steel segmented and concrete hybrid.
DrivetrainImproved reliability geared drivetrains with capacity to
upgrade MW. Select markets move to direct drive.
Electrical
and controls
Reduced cost converters. MW rating upgrades to take
advantage of site conditions and turbine loading
2025
entitlement
Low CAPEX wind plants with self-tuning turbines to
maximize energy production while managing OPEX
2016 LCOE59
202546
CAPEX OPEXAEP
19MAKE-IDK Japan Wind Power Roadshow
February 2017

Note: LCOE level at FID.
Source: MAKE
Record low offshore subsidy prices increase confidence in sector
Recently awarded subsidies
Source: MAKE
Global Market Trends
Race to the bottom expected through tenders in Denmark, the Netherlands and the UK. China reduce costs later due to short-term move from inter-tidal to nearshore projects.
LCOE development, 2016-2025e
0
50
100
150
200
Kriegers Flak
EUR/MWh
Industry’s
2025 target
Year
’20e ’25e’16
Industry’s
2020 targetBorssele 1 & 2
MAKE base case scenarios
MAKE - low
Estimated project costs
0
50
100
150
200
20162015 2017
Borssele III & IV
Str
ike p
rice
(EU
R/M
Wh)
Time of award of subsidy
Kriegers Flak
Danish Nearshore
Borselle I & II
Horns Rev 3
Neart na Gaoithe
East Anglia
Subsidy capStrike price
20MAKE-IDK Japan Wind Power Roadshow
February 2017

Turbines & plant
Source: Siemens, MHI-Vestas, MAKE
Substructures O&M
Larger turbines and
wind farms
Increased reliability
Scale effects and
industrialisation
Standardised and optimised offshore foundation design and design criteria
Industrialisedmanufacturing
Low OPEX drivetrains
Turbine and component quality
Condition monitoring, diagnostics, preventivemaintenance
Offshore wind has cost reduction opportunities in multiple areas
including scale
Offshore wind LCOE
Transmission
eBoP optimisation of substation and transmission capex
Innovative transmission solutions
Improved grid access
2128 February 2017
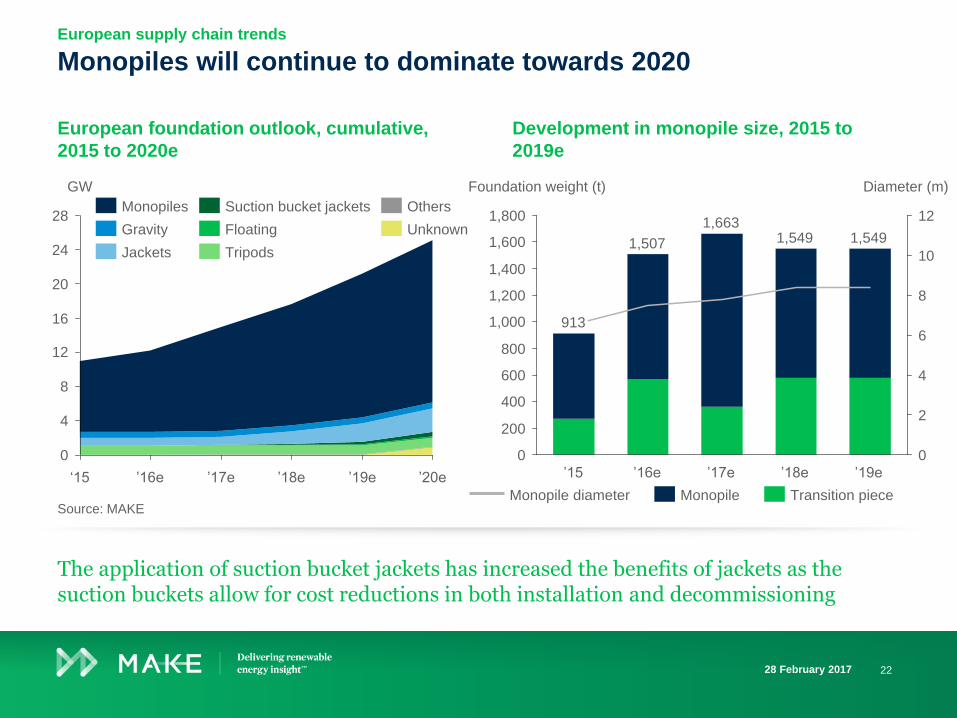
European foundation outlook, cumulative,
2015 to 2020e
Monopiles will continue to dominate towards 2020
Development in monopile size, 2015 to
2019e
European supply chain trends
Source: MAKE
The application of suction bucket jackets has increased the benefits of jackets as the suction buckets allow for cost reductions in both installation and decommissioning
2228 February 2017
12
16
24
28
4
8
0
20
’20e’19e’18e’17e’16e‘15
GW
Floating Unknown
Others
Tripods
Suction bucket jackets
Jackets
Gravity
Monopiles
0
2
4
6
8
10
12
1,000
800
600
1,600
1,400
1,200
1,800
0
200
400
Diameter (m)
1,549
’19e’18e
1,663
’16e
1,507
’15
913
Foundation weight (t)
’17e
1,549
Transition pieceMonopile diameter Monopile

EMEA grid-connected forecast: 2013-2025e
EMEA with above average growth from offshore and EMs
Source: MAKE
Northern Europe account for 86% of EMEA offshore demand from 2017 to 2025 and today the entire offshore wind supply chain and know-how is centered in Northern Europe
2
4
18
8
16
14
12
22
20
10
0
6
´24e ´25e´19e´17e ´18e´16e´15´14´13
(GW)
´23e´21e´20e ´22e
+4.8%
Northern Europe onshore
Offshore Eastern Europe onshore Africa and Middle East onshore
Southern Europe onshore
European opportunities for Japanese companies
23MAKE-IDK Japan Wind Power Roadshow
February 2017

Projected regional nacelle sourcing origins, 2014e-2016e
Europe remain a central supply hub for regional and global marketsEuropean opportunities for Japanese companies
Source: MAKE
Global supply chain adjusts procurement strategies in face of stagnant markets and emerging opportunities. Supply chain footprint continue to be heavily influenced by policy incl. local contentrequirements and incentives
Global
Asia/Europe
Europe
S. Europe
N. Europe
Brazil
China
India
MEA region is the
primary battleground
between European and
Chinese turbine OEMs
Americas-based
nacelle plants primarily
confined to intra-
regional procurement
Facilities in Western
Europe continue to
dominate Europe and
Northern Africa
24MAKE-IDK Japan Wind Power Roadshow
February 2017
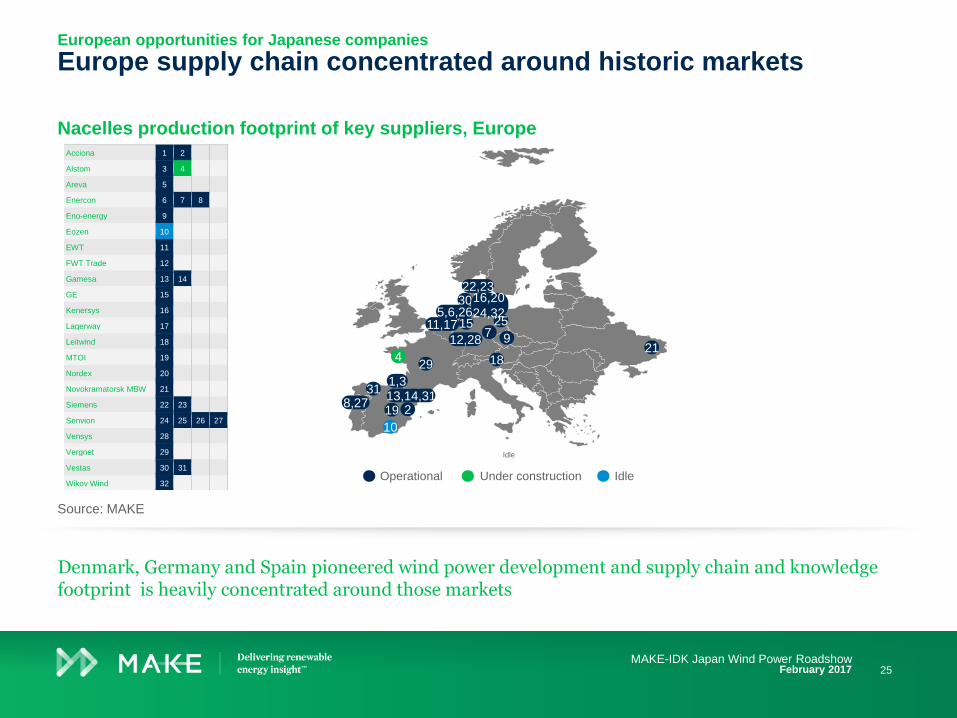
Nacelles production footprint of key suppliers, Europe
Europe supply chain concentrated around historic marketsEuropean opportunities for Japanese companies
Source: MAKE
Denmark, Germany and Spain pioneered wind power development and supply chain and knowledgefootprint is heavily concentrated around those markets
Idle
31
10
19 2
429 18
972515
30
21
1,313,14,31
8,27
22,23
12,28
11,175,6,26
16,20
24,32
Operational Under construction Idle
25MAKE-IDK Japan Wind Power Roadshow
February 2017
Acciona 1 2
Alstom 3 4
Areva 5
Enercon 6 7 8
Eno-energy 9
Eozen 10
EWT 11
FWT Trade 12
Gamesa 13 14
GE 15
Kenersys 16
Lagerway 17
Leitwind 18
MTOI 19
Nordex 20
Novokramatorsk MBW 21
Siemens 22 23
Senvion 24 25 26 27
Vensys 28
Vergnet 29
Vestas 30 31
Wikov Wind 32

Opportunity for M&A activities across selected segments
European opportunities for Japanese companies
Analysis of M&A opportunities for market entry or expansion
Partnerships
Buyer segment
Componentsegment
Asset owners
Non-wind industrial
conglomerates
Conglomerate competitor
Pure-play competitor
Private equityfunds
Opportunity forM&A activity in
short/medium term
Generation assets
Onshore turbines
Offshore turbines
Blades
Generators
Gearboxes
Bearings
Towers
Foundations
Offshore vessels
O&M/ISPs
Controls/Tech
Source: MAKE M&A
26MAKE-IDK Japan Wind Power Roadshow
February 2017
Get industry leading research and advise on wind power M&A
Favourable global wind power demand
dynamics despite recent pricing
plunge in energy commodities
EMEA with solid demand and
attractive technology and supply chain
opportunities for market entry or
international expansion and business
development
Denmark and Europe offers excellent
M&A opportunities for market entry or
expansion by Japanese companies
European opportunities for Japanese companies
“Successful M&A action requires
in-depth research and industry
experience.
MAKE is the independent, unbiased
partner you need to prepare a sale or
refinancing, screen investment
opportunities, conduct target
analysis, perform commercial and
technical due diligence, allowing your
organization to draw well-informed
conclusions and prepare successful
investment and exit strategies.”
27MAKE-IDK Japan Wind Power Roadshow
February 2017
Delivering renewableenergy insight
TM
About MAKE

29
An introduction to MAKE
Local knowledge Global advantage
The renewable energy industry is evolving
constantly. New markets are developing and
market conditions are changing.
Technological advances and global supply
chain transformation are lowering the cost of
energy day by day. For true and timely
insight, you have to be where the action is.
That’s why we have experts in key renewable
energy markets, providing a global advantage
to our clients.

30
An introduction to MAKE
Powerful Data Accurate Predictions
In today’s environment of intensifying
competition and shifting demand, staying
ahead of the curve is the key to success.
MAKE supports businesses across the globe
to achieve this by providing in-depth data and
forecasts – which have proved to be
industry’s most accurate, year after year.

31
An introduction to MAKE
Through years of working with companies
across the renewables value chain, MAKE
has developed a global network of
professional experts and decision makers.
Our close relationship and interaction with
leading investors, utilities, OEMs, suppliers,
service providers, government institutions
and NGOs provides a multifaceted view of
the industry. It keeps us abreast of the
newest developments and produces powerful
insights.
Extensive network Leading insights

32
An introduction to MAKE
Our global team of analysts and consultants
offers deep knowledge of renewables, gained
during years of working at leading companies
in the business. Our team has been carefully
assembled to offer the right blend of
expertise about markets, the supply chain,
technology and finance to accelerate results
for our clients.
Industry experience Accelerated results

33
The MAKE knowledge model
Markets
Value Chain
Technology
Finance
To fully understand the current status and development of the global wind power industry – it is essential to have multi-
faceted insights into burning issues that will impact the industry’s future. MAKE’s team of experts constantly analyzes
global and regional data to provide a full spectrum of analytics that cuts across the 4 key drivers / barriers for growth:
markets, value chain, technology and finance.

34
The MAKE knowledge model
Markets
MAKE’s global team of analysts closely monitor macro-economic, policy and project developments, order placements and installations in over 140 key and emerging onshore and offshore wind power markets worldwide.
Tier I Markets:
China
U.S.
India
Germany
United Kingdom
Brazil
Canada
Tier III Markets:
Italy
Poland
Ireland
Japan
South Africa
Chile
Denmark
Belgium
Finland
Greece
Russia
Romania
Ukraine
Norway
Egypt
Argentina
Austria
Morocco
Pakistan
South Korea
Ethiopia
Spain
Peru
Venezuela
Saudi Arabia
Uruguay
+ 100 more markets
Tier II Markets:
Mexico
France
Turkey
Australia
Sweden
Netherlands

35
The MAKE knowledge model
Value Chain
The ever-evolving dynamics of supply and demand impact companies across the wind power value chain. MAKE constantly monitors all value chain segments for interesting developments, such as supply-demand imbalances, sourcing strategies, key company positions, M&A activity and much more.
Wind plant development
Raw material supply
Component supply
Wind turbine manufacturing
Logistics
Engineering, procurement and construction
Asset ownership
Operations & maintainance

36
The MAKE knowledge model
Technology
MAKE’s technology team closely monitors individual partners in the supply chain and their technical innovation and product development and forecasts technological trends in key areas, including:
Wind Turbine
Rotor
Nacelle
Tower
Control systems
Components
Offshore
Installation vessels
Cable-laying vessels
Foundations
Substations
Transmission cables
Balance of Plant
Foundations
Substations
Electrical work
Installation equipment

37
The MAKE knowledge model
Finance
As the demand for wind power ultimately depends on economic viability and cost-competitiveness, understanding the financial and cost developments is key. Our team studies various financial aspects of the industry:
Renewable power generation
portfolio strategies of global
asset owners
Regional financing
mechanisms and structures
for both onshore and offshore
Capital markets and finance
availability
Competitiveness of wind versus
other sources of energy, power
pricing and levelised cost of
energy by region and
technology
Understanding the key drivers
of cost including technology,
logistics and raw materials

38
Wind Power
Research ProductsTo make the right decisions for your wind business and
investments in today’s environment of intensifying competition and
shifting demand, you need access to reliable and timely industry
insights. MAKE delivers research, forecasts, data and a multi-
faceted view of the global wind-power industry with unrivaled
depth and accuracy, offering you a competitive advantage in
accelerating business results.

MAKE now offers eight different subscription packages
Introducing SolarRenewable Energy Intelligence Suite

MAKE tiered subscription structureRenewable Energy Intelligence Suite

Subscription overviewRenewable Energy Intelligence Suite

Subscription overviewRenewable Energy Intelligence Suite

Subscription overviewRenewable Energy Intelligence Suite

Publishing scheduleRenewable Energy Intelligence Suite

Publishing scheduleRenewable Energy Intelligence Suite

46
Wind Power
Consulting Services
As wind experts, we understand the industry’s dynamic nature and
your need for timely and objective advice. We rely on our team’s
proven track record in the international wind industry, our first-
hand industry contacts and our collective specialist skills to
analyze challenges from every angle and provide a wide range of
consulting services.

47
MAKE’s Consulting services
Market Assessment
Our clients demand detailed information and analysis of specific markets or segments in order
to make qualified strategic decisions. We constantly monitor the global wind market to provide
our clients with accurate market forecasts and analysis of the legal and political frameworks in
the various markets, including assessment of opportunities and risks involved. We conduct
Voice of Customer surveys to map buying criteria and buyer preferences and we analyse the
competitive dynamics and landscape.
Supply Chain Dynamics
Smart supply chain management is a source of competitive advantage that enables our clients
to meet multiple strategic objectives. Decisions to buy or make and on how to set up a global
supply chain are complicated by a vast array of market factors. MAKE can facilitate such
decisions by providing relevant data and advice concerning production footprints, procurement
strategies, value chain positioning, supplier screening, assessment and business modeling. Our
extensive knowledge base allows for a wide range of services including capacity forecasts,
identification of sourcing opportunities, supply chain mapping, analysis of the competitive
landscape, benchmark analysis and conducting make/buy analyses.
Technology
The product and technology landscape of the wind industry is evolving constantly. Today,
winning technology cannot be developed in isolation but must be understood in the context of
market and supply chain dynamics. We monitor technology trends continuously and advise
clients on strategic product and technology positioning. To help them make informed decisions
on systems design, we assist our clients in developing successful product and technology
roadmaps, tapping our understanding of the entire turbine to achieve the optimum solution.

48
MAKE’s Consulting services
Operations & Maintenance
Globally, the installed wind power base is increasing rapidly. Optimising wind farm operations
and maintenance represents a value enhancement opportunity for asset owners and a strategic
business opportunity of growing importance for equipment manufacturers and service providers.
MAKE advises utilities, IPP’s and other asset owners on O&M strategy and advanced OPEX
modelling, benchmarking both service and product offerings. MAKE also advises equipment
manufacturers and service providers on business development strategies, including market
assessment, competitive analysis, positioning and design of business models and offerings for
the O&M markets. Our services provide your organization with a competitive edge, enabling you
to achieve your strategic targets and business objectives while guaranteeing the availability of
your wind assets.
M&A Advisory
Successful M&A action requires in-depth research and industry experience. MAKE is the
independent, unbiased partner you need to prepare a sale or refinancing, screen investment
opportunities, conduct target analysis, perform due diligence studies, allowing your organisation
to draw well-informed conclusions and prepare successful investment and exit strategies.
Offshore Wind
Offshore wind power is one of the fastest growing market segments globally with a large and
untapped potential for renewable power generation. The industry is focused on reducing the
cost of energy from offshore wind. This requires stable long-term policy framework, continued
innovation and development of new technology and investments in scaling and industrialising
the supply chain. MAKE advises policy makers, investors, utilities, OEMs and suppliers on
market dynamics, technology and supply chain. We support our clients in developing market
entry, business development or supply chain strategies, as well as technology roadmaps. Our
services can help you grow your offshore wind business successfully.

49
MAKE’s Consulting services
Business & Market Modeling
Our proprietary approach provides powerful tools to support our clients' business development
decisions. Our suite of business and market models include onshore and offshore wind farm
investment tools, wind turbine CAPEX and OPEX tools and detailed market and supply chain
models able to estimate demand on the segment and component level.
Wind Farm Investments
Making profitable wind farm investments and accurately assessing opportunities and risks
require in-depth understanding of the market and legal environments, wind turbine performance
and costs, and project finance. At MAKE, we possess the right skills and experience for
successful wind farm portfolio screening and project valuation and to advise clients on their
investment strategies.
Management Consulting
Whether you are developing a strategy, planning an acquisition, considering an investment
project, improving your cost structure, or mapping new technologies that affect your business,
MAKE has the proven track record to drive your project to a quick and successful closure. We
aim to improve your business prospects by employing the right mix of experience and out-of-
the-box thinking to apply an unbiased viewpoint based on a clear analytical framework and a
solid working process. We provide management consulting services at both the strategic and
operational level.

50
A sample of MAKE’s recent wind industry due diligence engagements
Commercial due diligence on a global top-5 wind turbine OEM (Client: PE)
Commercial and technical due diligence on a global fleet of wind power assets (Client: Industrial conglomerate)
Commercial due diligence on a leading gearbox manufacturer (Client: PE)
Vendor due diligence on a globally leading blade manufacturer (Client: Owner)
Vendor due diligence on a globally leading tower internals suppliers (Client: Owner)
Technical due diligence on leading wind turbine OEM (Client: Owner)
Commercial due diligence on an offshore project pipeline (Client: PE)
Commercial and technical due diligence on a European wind turbine OEM (Client: Industrial conglomerate)
Commercial due diligence on a leading sub-sea services provider (Client: PE)
Commercial and technical due diligence on a leading offshore cable protection system supplier (Client: PE)
Commercial due diligence on a leading blade core material supplier (Client: PE)
Commercial and technical due diligence on a Chinese wind turbine OEM (Client: PE)

51
Business principles and code of conduct
We are a reliable and professional company
Our material is fact based, peer reviewed and of the highest quality
Our material is based upon our own extensive databases, and supported by structured analysis and
research processes
Our sources are well-known and reliable industry experts with proven success in the wind industry
We only take on tasks that we are capable of completing to the expectations of our clients
We operate with honesty and integrity
We are committed to conduct our business with the highest degree of integrity and ethics and in compliance
with all applicable laws and regulations
We protect the intellectual property of all of our clients in all of our business activities
We maintain complete confidentiality of all data sourced from our global network of industry experts
We require our employees to act lawfully, honestly and with integrity
We do not tolerate bribery, corruption, improper payments, facilitation payments or fraudulent practices of
any kind
We do not tolerate any anti-competitive practices
We do not allow our employees to engage in any act that might result in a conflict of interest between their
own interests and those of the company. For example, our employees cannot undertake board work in other
companies within the industry and cannot hold shares in any company within the industry
We are committed to provide a healthy and safe workplace and to operate in an environmentally and
socially responsible manner
We are committed to protect the health and safety of all employees within MAKE
We expect our employees to comply with applicable local laws, standards and instructions relating to health
and safety in their workplace
We strive to provide authoritative opinion with the purpose of guiding and enhancing renewable
development

Contact
consultmake.com
© 2017 MAKE Consulting A/S. All rights reserved. Reproduction or distribution of this report in any form without prior written permission is strictly forbidden. Violation of the above restrictions will be subjects to legal action under the Danish Arbitration Act. The information herein is taken from sources considered reliable, but its accuracy and completeness are not warranted, nor are the opinions, analyses and forecasts on which they are based. MAKE Consulting A/S cannot be held liable for any errors in this report, neither can MAKE Consulting A/S be liable for any financial loss or damage caused by the use of the information presented in this report.
Denmark
Sønder Allé9
DK-8000
Aarhus
T +45 7026 6628
U.S.
117 N. Jefferson Street
Suite 400
Chicago, IL 60661
T +1 312 441 9590
U.S.
225 Franklin Street
26th floor
Boston, MA 02110
T +1 978 448 3186
China No. 19, 470 Shaanxi BeiRoad, Jing’an District Shanghai 200041T +86 21 5130 1819
Germany Neuer Wall 1020354 HamburgT +49 40 822 15 3111
Shane Sun
52