Embed Size (px)
Citation preview

Global Webinar:Inverted & Negative Yield Curves, Trade Tensions & More
Jim O’Sullivan & Carl WeinbergHigh Frequency Economics www.hifreqecon.com/WebinarSep2019
U.S. Expansion Don’t Die Of Old Age ...Or From Trade Tensions?
Jim O’SullivanChief Economist www.hifreqecon.com/WebinarSep2019
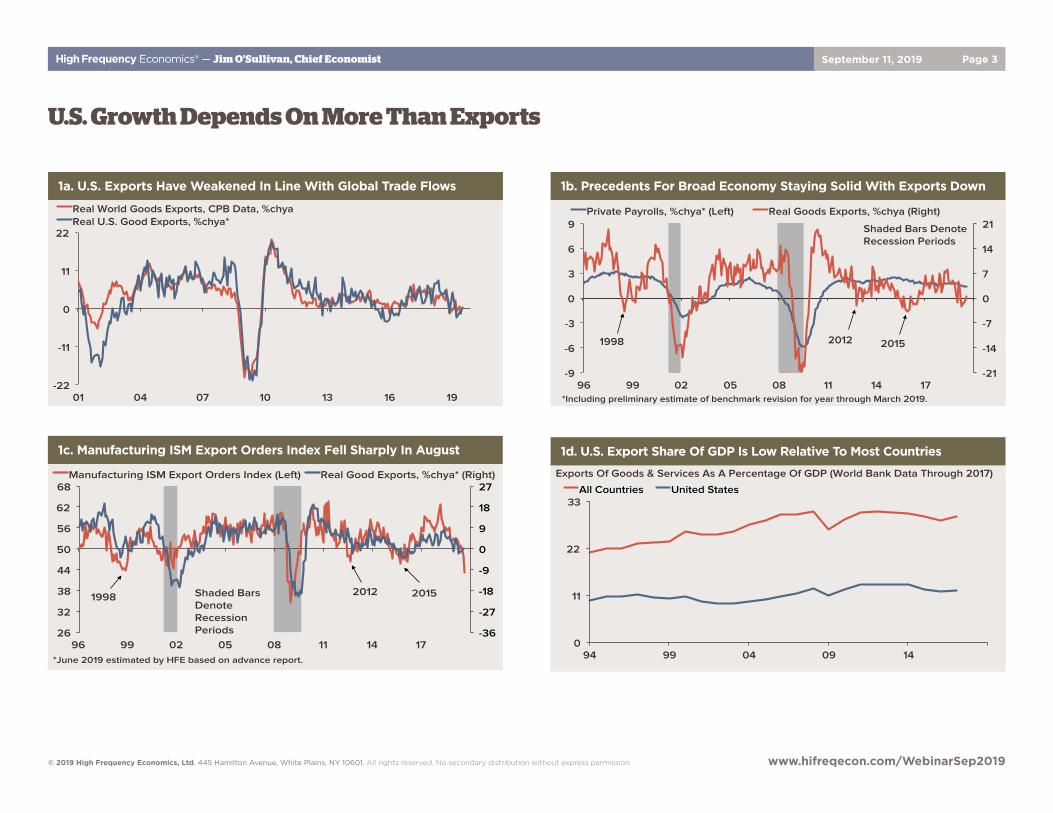
High Frequency Economics® — Jim O’Sullivan, Chief Economist September 11, 2019 Page 3
© 2019 High Frequency Economics, Ltd. 445 Hamilton Avenue, White Plains, NY 10601. All rights reserved. No secondary distribution without express permission. www.hifreqecon.com/WebinarSep2019
U.S. Growth Depends On More Than Exports
0
11
22
33
94 99 04 09 14
All Countries United States
Exports Of Goods & Services As A Percentage Of GDP (World Bank Data Through 2017)
1d. U.S. Export Share Of GDP Is Low Relative To Most Countries
-22
-11
0
11
22
01 04 07 10 13 16 19
Real World Goods Exports, CPB Data, %chya Real U.S. Good Exports, %chya*
1a. U.S. Exports Have Weakened In Line With Global Trade Flows
-36
-27
-18
-9
0
9
18
27
26
32
38
44
50
56
62
68
96 99 02 05 08 11 14 17
Manufacturing ISM Export Orders Index (Left) Real Good Exports, %chya* (Right)
Shaded Bars Denote Recession Periods
2015 2012 1998
*June 2019 estimated by HFE based on advance report.
1c. Manufacturing ISM Export Orders Index Fell Sharply In August
-21
-14
-7
0
7
14
21
-9
-6
-3
0
3
6
9
96 99 02 05 08 11 14 17
Private Payrolls, %chya* (Left) Real Goods Exports, %chya (Right)
Shaded Bars Denote Recession Periods
1998 2015 2012
*Including preliminary estimate of benchmark revision for year through March 2019.
1b. Precedents For Broad Economy Staying Solid With Exports Down
High Frequency Economics® — Jim O’Sullivan, Chief Economist September 11, 2019 Page 4
© 2019 High Frequency Economics, Ltd. 445 Hamilton Avenue, White Plains, NY 10601. All rights reserved. No secondary distribution without express permission. www.hifreqecon.com/WebinarSep2019
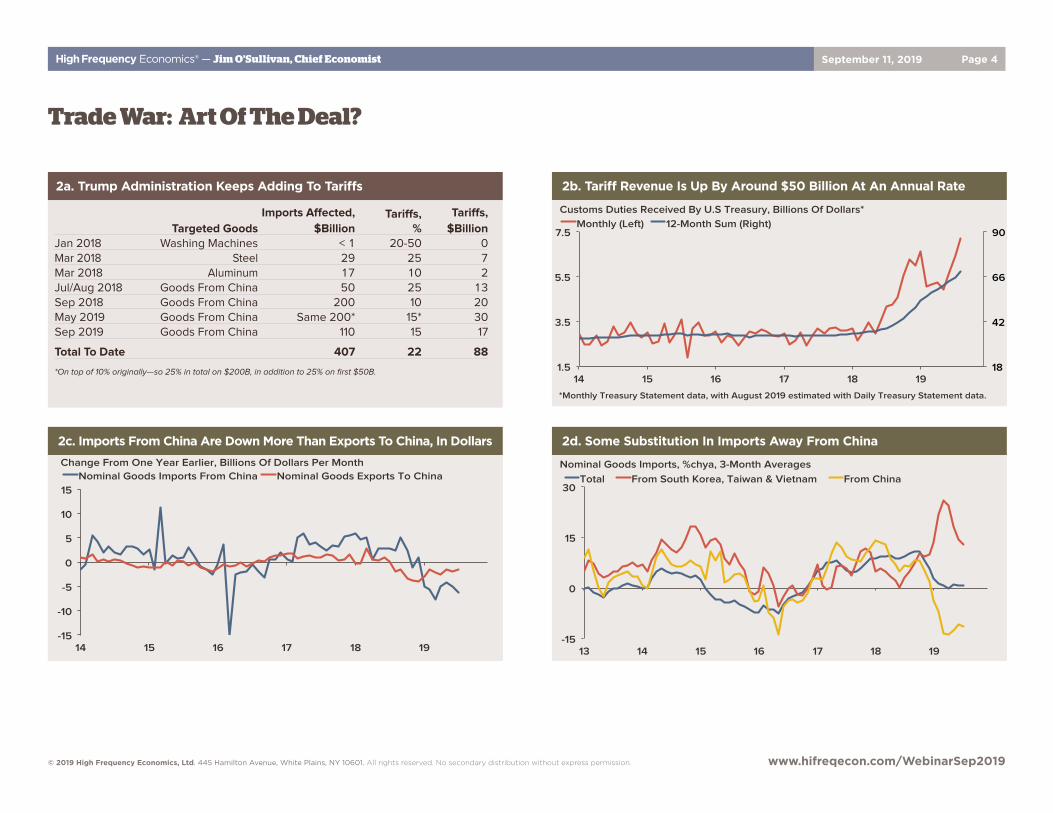
Trade War: Art Of The Deal?
-15
0
15
30
13 14 15 16 17 18 19
Total From South Korea, Taiwan & Vietnam From China Nominal Goods Imports, %chya, 3-Month Averages
2d. Some Substitution In Imports Away From China
-15
-10
-5
0
5
10
15
14 15 16 17 18 19
Nominal Goods Imports From China Nominal Goods Exports To China Change From One Year Earlier, Billions Of Dollars Per Month
2c. Imports From China Are Down More Than Exports To China, In Dollars
2a. Trump Administration Keeps Adding To Tariffs
Targeted GoodsImports Affected,
$BillionTariffs,
%Tariffs,
$BillionJan 2018 Washing Machines < 1 20-50 0Mar 2018 Steel 29 25 7Mar 2018 Aluminum 17 10 2Jul/Aug 2018 Goods From China 50 25 13Sep 2018 Goods From China 200 10 20May 2019 Goods From China Same 200* 15* 30Sep 2019 Goods From China 110 15 17
Total To Date 407 22 88
*On top of 10% originally—so 25% in total on $200B, in addition to 25% on first $50B. 18
42
66
90
1.5
3.5
5.5
7.5
14 15 16 17 18 19
Monthly (Left) 12-Month Sum (Right) Customs Duties Received By U.S Treasury, Billions Of Dollars*
*Monthly Treasury Statement data, with August 2019 estimated with Daily Treasury Statement data.
2b. Tariff Revenue Is Up By Around $50 Billion At An Annual Rate
High Frequency Economics® — Jim O’Sullivan, Chief Economist September 11, 2019 Page 5
© 2019 High Frequency Economics, Ltd. 445 Hamilton Avenue, White Plains, NY 10601. All rights reserved. No secondary distribution without express permission. www.hifreqecon.com/WebinarSep2019
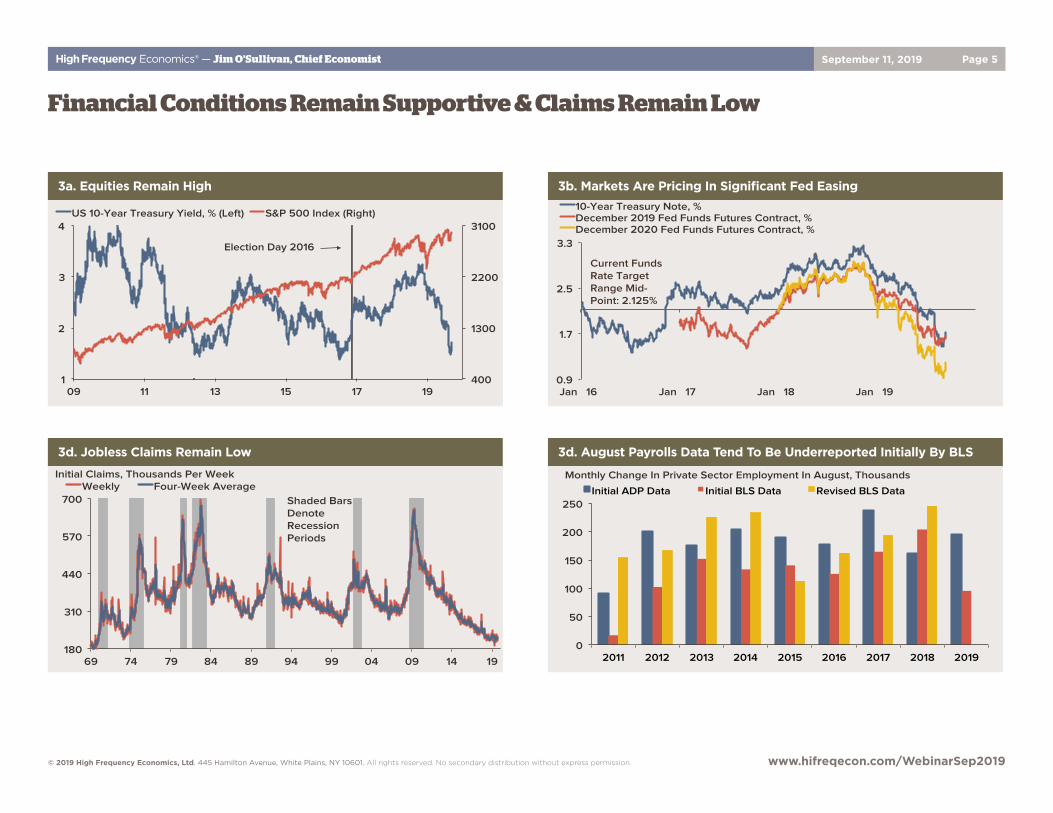
Financial Conditions Remain Supportive & Claims Remain Low
400
1300
2200
3100
1
2
3
4
09 11 13 15 17 19
US 10-Year Treasury Yield, % (Left) S&P 500 Index (Right)
Election Day 2016
3a. Equities Remain High
0.9
1.7
2.5
3.3
Jan 16 Jan 17 Jan 18 Jan 19
10-Year Treasury Note, % December 2019 Fed Funds Futures Contract, % December 2020 Fed Funds Futures Contract, %
Current Funds Rate Target Range Mid-Point: 2.125%
3b. Markets Are Pricing In Significant Fed Easing
180
310
440
570
700
69 74 79 84 89 94 99 04 09 14 19
Weekly Four-Week Average Shaded Bars Denote Recession Periods
Initial Claims, Thousands Per Week
3d. Jobless Claims Remain Low
2011 2012 2013 2014 2015 2016 2017 2018 2019 0
50
100
150
200
250 Initial ADP Data Initial BLS Data Revised BLS Data
Monthly Change In Private Sector Employment In August, Thousands
3d. August Payrolls Data Tend To Be Underreported Initially By BLS
High Frequency Economics® — Jim O’Sullivan, Chief Economist September 11, 2019 Page 6
© 2019 High Frequency Economics, Ltd. 445 Hamilton Avenue, White Plains, NY 10601. All rights reserved. No secondary distribution without express permission. www.hifreqecon.com/WebinarSep2019
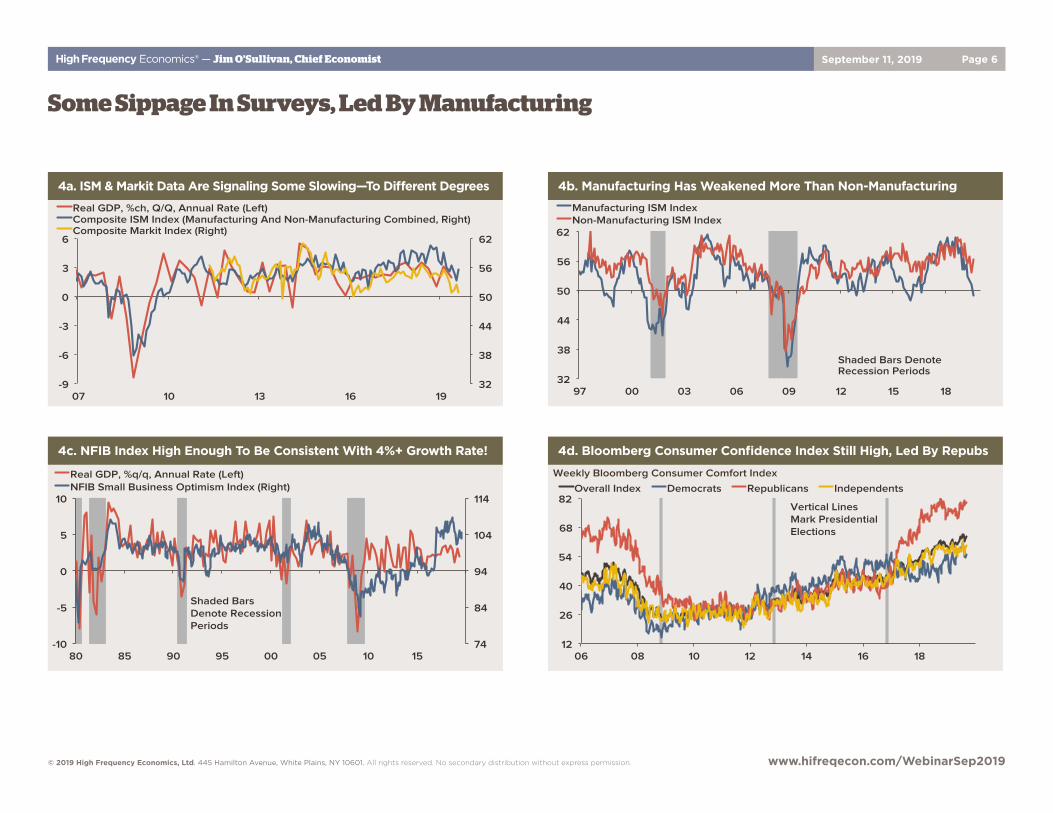
Some Sippage In Surveys, Led By Manufacturing
74
84
94
104
114
-10
-5
0
5
10
80 85 90 95 00 05 10 15
Real GDP, %q/q, Annual Rate (Left) NFIB Small Business Optimism Index (Right)
Shaded Bars Denote Recession Periods
4c. NFIB Index High Enough To Be Consistent With 4%+ Growth Rate!
32
38
44
50
56
62
-9
-6
-3
0
3
6
07 10 13 16 19
Real GDP, %ch, Q/Q, Annual Rate (Left) Composite ISM Index (Manufacturing And Non-Manufacturing Combined, Right) Composite Markit Index (Right)
4a. ISM & Markit Data Are Signaling Some Slowing—To Different Degrees
32
38
44
50
56
62
97 00 03 06 09 12 15 18
Manufacturing ISM Index Non-Manufacturing ISM Index
Shaded Bars Denote Recession Periods
4b. Manufacturing Has Weakened More Than Non-Manufacturing
12
26
40
54
68
82
06 08 10 12 14 16 18
Overall Index Democrats Republicans Independents
Vertical Lines Mark Presidential Elections
Weekly Bloomberg Consumer Comfort Index
4d. Bloomberg Consumer Confidence Index Still High, Led By Repubs
High Frequency Economics® — Jim O’Sullivan, Chief Economist September 11, 2019 Page 7
© 2019 High Frequency Economics, Ltd. 445 Hamilton Avenue, White Plains, NY 10601. All rights reserved. No secondary distribution without express permission. www.hifreqecon.com/WebinarSep2019
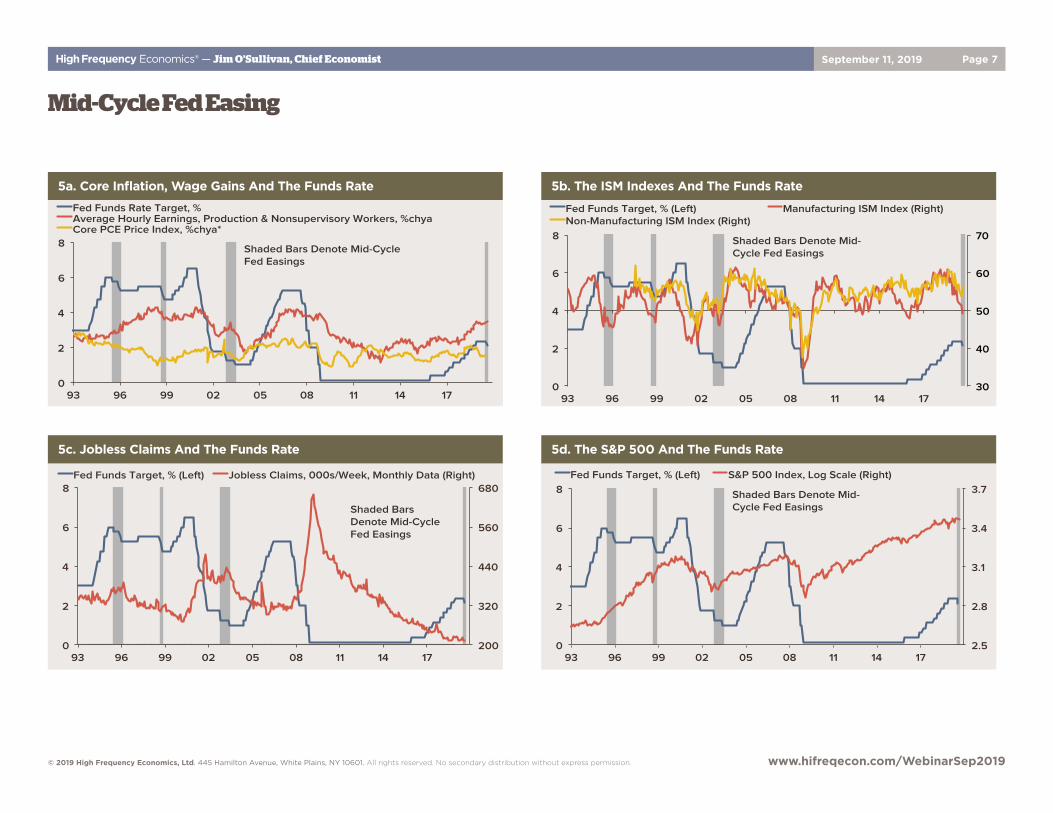
Mid-Cycle Fed Easing
2.5
2.8
3.1
3.4
3.7
0
2
4
6
8
93 96 99 02 05 08 11 14 17
Fed Funds Target, % (Left) S&P 500 Index, Log Scale (Right)
Shaded Bars Denote Mid-Cycle Fed Easings
5d. The S&P 500 And The Funds Rate
200
320
440
560
680
0
2
4
6
8
93 96 99 02 05 08 11 14 17
Fed Funds Target, % (Left) Jobless Claims, 000s/Week, Monthly Data (Right)
Shaded Bars Denote Mid-Cycle Fed Easings
5c. Jobless Claims And The Funds Rate
30
40
50
60
70
0
2
4
6
8
93 96 99 02 05 08 11 14 17
Fed Funds Target, % (Left) Manufacturing ISM Index (Right) Non-Manufacturing ISM Index (Right)
Shaded Bars Denote Mid-Cycle Fed Easings
5b. The ISM Indexes And The Funds Rate
0
2
4
6
8
93 96 99 02 05 08 11 14 17
Fed Funds Rate Target, % Average Hourly Earnings, Production & Nonsupervisory Workers, %chya Core PCE Price Index, %chya*
Shaded Bars Denote Mid-Cycle Fed Easings
5a. Core Inflation, Wage Gains And The Funds Rate
High Frequency Economics® — Jim O’Sullivan, Chief Economist September 11, 2019 Page 8
© 2019 High Frequency Economics, Ltd. 445 Hamilton Avenue, White Plains, NY 10601. All rights reserved. No secondary distribution without express permission. www.hifreqecon.com/WebinarSep2019
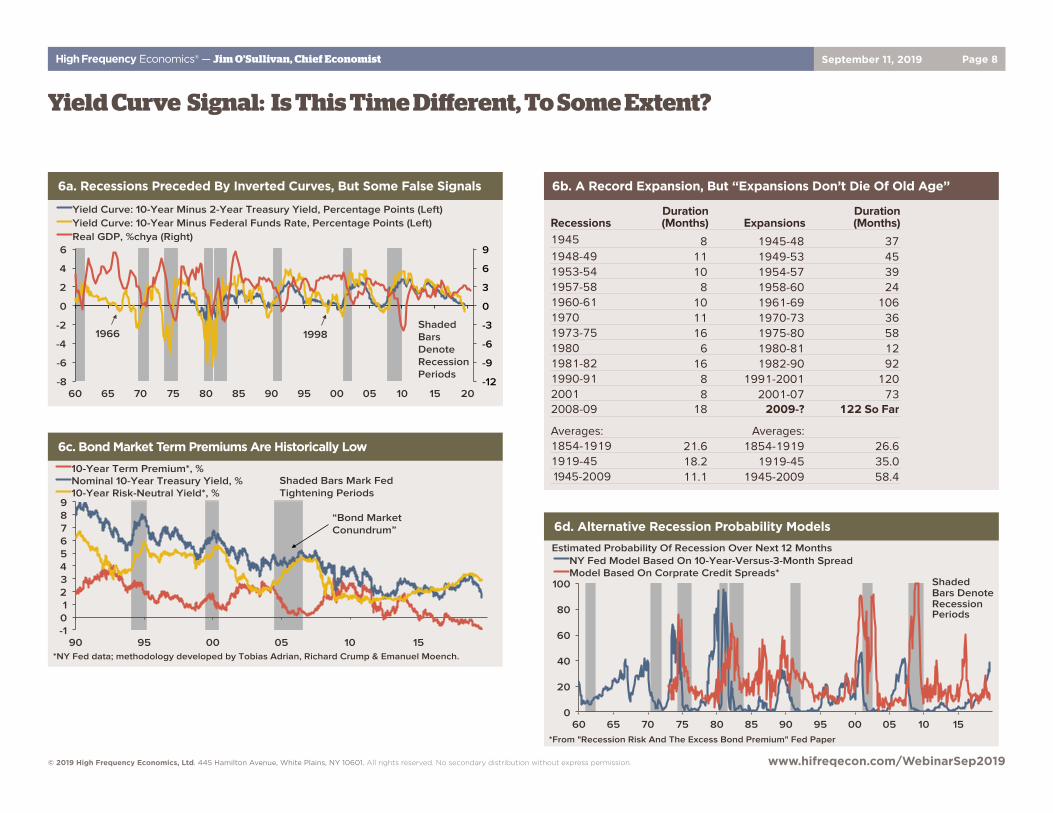
-12
-9
-6
-3
0
3
6
9
-8
-6
-4
-2
0
2
4
6
60 65 70 75 80 85 90 95 00 05 10 15 20
Yield Curve: 10-Year Minus 2-Year Treasury Yield, Percentage Points (Left) Yield Curve: 10-Year Minus Federal Funds Rate, Percentage Points (Left) Real GDP, %chya (Right)
Shaded Bars Denote Recession Periods
1966 1998
6a. Recessions Preceded By Inverted Curves, But Some False Signals
0
20
40
60
80
100
60 65 70 75 80 85 90 95 00 05 10 15
NY Fed Model Based On 10-Year-Versus-3-Month Spread Model Based On Corprate Credit Spreads*
Shaded Bars Denote Recession Periods
*From "Recession Risk And The Excess Bond Premium" Fed Paper
Estimated Probability Of Recession Over Next 12 Months
6d. Alternative Recession Probability Models
Yield Curve Signal: Is This Time Different, To Some Extent?
6b. A Record Expansion, But “Expansions Don’t Die Of Old Age”
RecessionsDuration (Months) Expansions
Duration (Months)
1945 8 1945-48 371948-49 11 1949-53 451953-54 10 1954-57 391957-58 8 1958-60 241960-61 10 1961-69 1061970 11 1970-73 361973-75 16 1975-80 581980 6 1980-81 121981-82 16 1982-90 921990-91 8 1991-2001 1202001 8 2001-07 732008-09 18 2009-? 122 So Far
Averages: Averages:1854-1919 21.6 1854-1919 26.61919-45 18.2 1919-45 35.0 1945-2009 11.1 1945-2009 58.4
-1 0 1 2 3 4 5 6 7 8 9
90 95 00 05 10 15
10-Year Term Premium*, % Nominal 10-Year Treasury Yield, % 10-Year Risk-Neutral Yield*, %
*NY Fed data; methodology developed by Tobias Adrian, Richard Crump & Emanuel Moench.
“Bond Market Conundrum”
Shaded Bars Mark Fed Tightening Periods
6c. Bond Market Term Premiums Are Historically Low
High Frequency Economics® — Jim O’Sullivan, Chief Economist September 11, 2019 Page 9
© 2019 High Frequency Economics, Ltd. 445 Hamilton Avenue, White Plains, NY 10601. All rights reserved. No secondary distribution without express permission. www.hifreqecon.com/WebinarSep2019
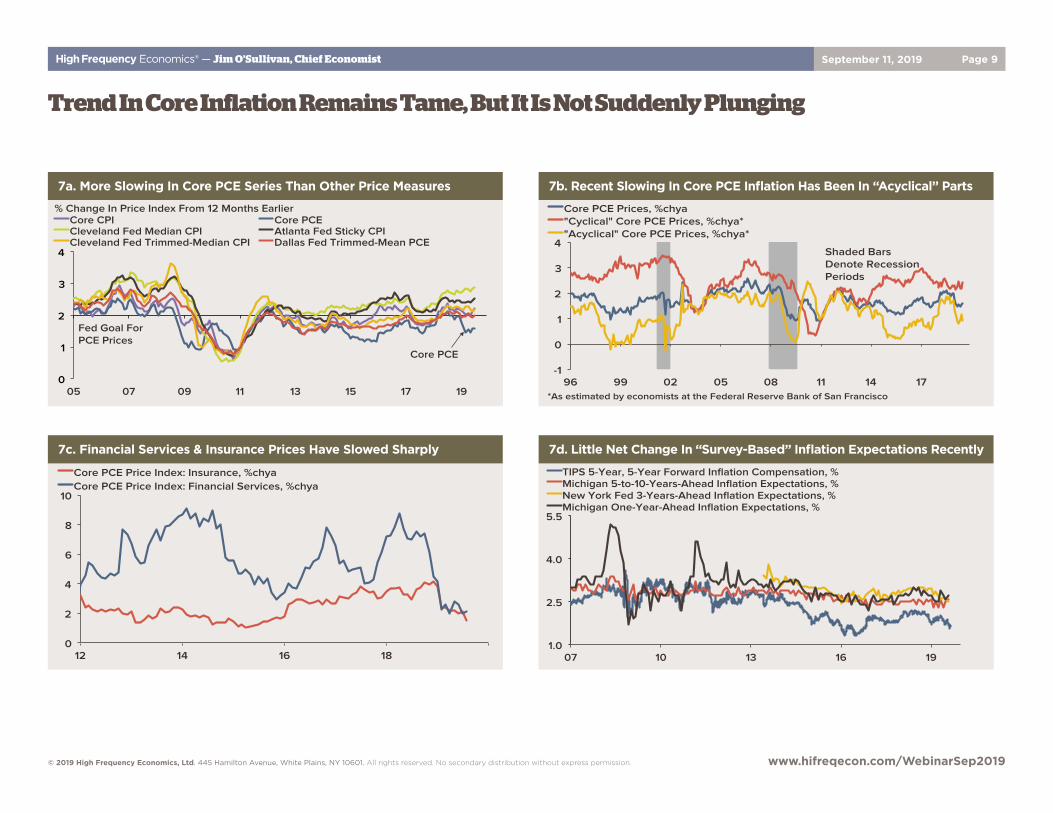
Trend In Core Inflation Remains Tame, But It Is Not Suddenly Plunging
0
2
4
6
8
10
12 14 16 18
Core PCE Price Index: Insurance, %chya Core PCE Price Index: Financial Services, %chya
7c. Financial Services & Insurance Prices Have Slowed Sharply
1.0
2.5
4.0
5.5
07 10 13 16 19
TIPS 5-Year, 5-Year Forward Inflation Compensation, % Michigan 5-to-10-Years-Ahead Inflation Expectations, % New York Fed 3-Years-Ahead Inflation Expectations, % Michigan One-Year-Ahead Inflation Expectations, %
7d. Little Net Change In “Survey-Based” Inflation Expectations Recently
0
1
2
3
4
05 07 09 11 13 15 17 19
Core CPI Core PCE Cleveland Fed Median CPI Atlanta Fed Sticky CPI Cleveland Fed Trimmed-Median CPI Dallas Fed Trimmed-Mean PCE
% Change In Price Index From 12 Months Earlier
Fed Goal For PCE Prices
Core PCE
7a. More Slowing In Core PCE Series Than Other Price Measures
-1
0
1
2
3
4
96 99 02 05 08 11 14 17
Core PCE Prices, %chya "Cyclical" Core PCE Prices, %chya* "Acyclical" Core PCE Prices, %chya*
Shaded Bars Denote Recession Periods
*As estimated by economists at the Federal Reserve Bank of San Francisco
7b. Recent Slowing In Core PCE Inflation Has Been In “Acyclical” Parts
High Frequency Economics® — Jim O’Sullivan, Chief Economist September 11, 2019 Page 10
© 2019 High Frequency Economics, Ltd. 445 Hamilton Avenue, White Plains, NY 10601. All rights reserved. No secondary distribution without express permission. www.hifreqecon.com/WebinarSep2019
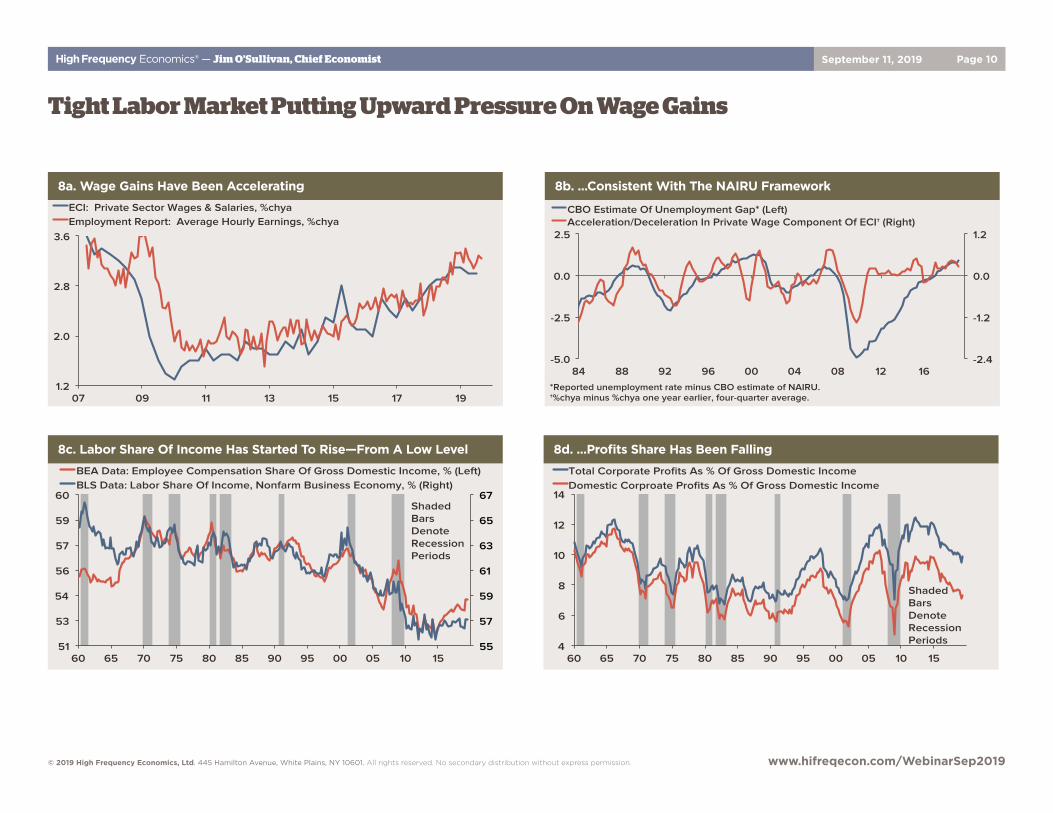
Tight Labor Market Putting Upward Pressure On Wage Gains
55
57
59
61
63
65
67
51
53
54
56
57
59
60
60 65 70 75 80 85 90 95 00 05 10 15
BEA Data: Employee Compensation Share Of Gross Domestic Income, % (Left) BLS Data: Labor Share Of Income, Nonfarm Business Economy, % (Right)
Shaded Bars Denote Recession Periods
8c. Labor Share Of Income Has Started To Rise—From A Low Level
4
6
8
10
12
14
60 65 70 75 80 85 90 95 00 05 10 15
Total Corporate Profits As % Of Gross Domestic Income Domestic Corproate Profits As % Of Gross Domestic Income
Shaded Bars Denote Recession Periods
8d. ...Profits Share Has Been Falling
-2.4
-1.2
0.0
1.2
-5.0
-2.5
0.0
2.5
84 88 92 96 00 04 08 12 16
CBO Estimate Of Unemployment Gap* (Left) Acceleration/Deceleration In Private Wage Component Of ECI† (Right)
*Reported unemployment rate minus CBO estimate of NAIRU. †%chya minus %chya one year earlier, four-quarter average.
8b. ...Consistent With The NAIRU Framework
1.2
2.0
2.8
3.6
07 09 11 13 15 17 19
ECI: Private Sector Wages & Salaries, %chya Employment Report: Average Hourly Earnings, %chya
8a. Wage Gains Have Been Accelerating
High Frequency Economics® — Jim O’Sullivan, Chief Economist September 11, 2019 Page 11
© 2019 High Frequency Economics, Ltd. 445 Hamilton Avenue, White Plains, NY 10601. All rights reserved. No secondary distribution without express permission. www.hifreqecon.com/WebinarSep2019
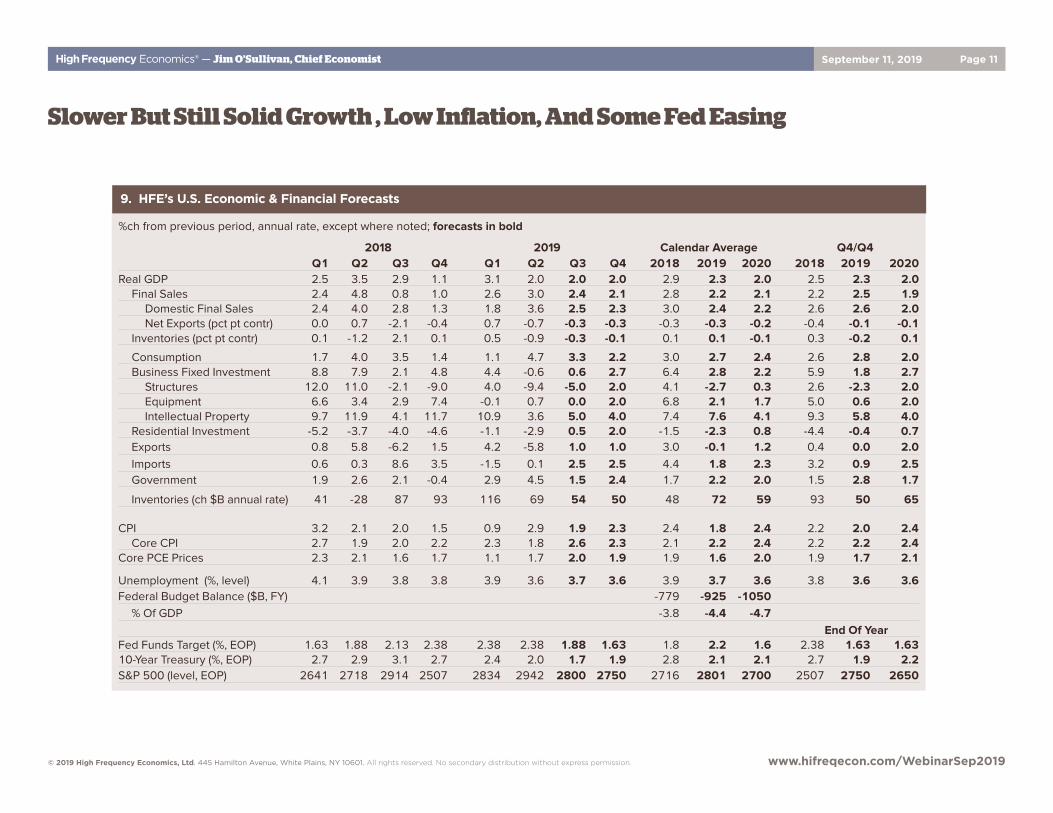
%ch from previous period, annual rate, except where noted; forecasts in bold
2018 2019 Calendar Average Q4/Q4Q1 Q2 Q3 Q4 Q1 Q2 Q3 Q4 2018 2019 2020 2018 2019 2020
Real GDP 2.5 3.5 2.9 1.1 3.1 2.0 2.0 2.0 2.9 2.3 2.0 2.5 2.3 2.0Final Sales 2.4 4.8 0.8 1.0 2.6 3.0 2.4 2.1 2.8 2.2 2.1 2.2 2.5 1.9
Domestic Final Sales 2.4 4.0 2.8 1.3 1.8 3.6 2.5 2.3 3.0 2.4 2.2 2.6 2.6 2.0Net Exports (pct pt contr) 0.0 0.7 -2.1 -0.4 0.7 -0.7 -0.3 -0.3 -0.3 -0.3 -0.2 -0.4 -0.1 -0.1
Inventories (pct pt contr) 0.1 -1.2 2.1 0.1 0.5 -0.9 -0.3 -0.1 0.1 0.1 -0.1 0.3 -0.2 0.1
Consumption 1.7 4.0 3.5 1.4 1.1 4.7 3.3 2.2 3.0 2.7 2.4 2.6 2.8 2.0Business Fixed Investment 8.8 7.9 2.1 4.8 4.4 -0.6 0.6 2.7 6.4 2.8 2.2 5.9 1.8 2.7
Structures 12.0 11.0 -2.1 -9.0 4.0 -9.4 -5.0 2.0 4.1 -2.7 0.3 2.6 -2.3 2.0Equipment 6.6 3.4 2.9 7.4 -0.1 0.7 0.0 2.0 6.8 2.1 1.7 5.0 0.6 2.0Intellectual Property 9.7 11.9 4.1 11.7 10.9 3.6 5.0 4.0 7.4 7.6 4.1 9.3 5.8 4.0
Residential Investment -5.2 -3.7 -4.0 -4.6 -1.1 -2.9 0.5 2.0 -1.5 -2.3 0.8 -4.4 -0.4 0.7Exports 0.8 5.8 -6.2 1.5 4.2 -5.8 1.0 1.0 3.0 -0.1 1.2 0.4 0.0 2.0Imports 0.6 0.3 8.6 3.5 -1.5 0.1 2.5 2.5 4.4 1.8 2.3 3.2 0.9 2.5Government 1.9 2.6 2.1 -0.4 2.9 4.5 1.5 2.4 1.7 2.2 2.0 1.5 2.8 1.7
Inventories (ch $B annual rate) 41 -28 87 93 116 69 54 50 48 72 59 93 50 65
CPI 3.2 2.1 2.0 1.5 0.9 2.9 1.9 2.3 2.4 1.8 2.4 2.2 2.0 2.4Core CPI 2.7 1.9 2.0 2.2 2.3 1.8 2.6 2.3 2.1 2.2 2.4 2.2 2.2 2.4
Core PCE Prices 2.3 2.1 1.6 1.7 1.1 1.7 2.0 1.9 1.9 1.6 2.0 1.9 1.7 2.1
Unemployment (%, level) 4.1 3.9 3.8 3.8 3.9 3.6 3.7 3.6 3.9 3.7 3.6 3.8 3.6 3.6Federal Budget Balance ($B, FY) -779 -925 -1050
% Of GDP -3.8 -4.4 -4.7End Of Year
Fed Funds Target (%, EOP) 1.63 1.88 2.13 2.38 2.38 2.38 1.88 1.63 1.8 2.2 1.6 2.38 1.63 1.6310-Year Treasury (%, EOP) 2.7 2.9 3.1 2.7 2.4 2.0 1.7 1.9 2.8 2.1 2.1 2.7 1.9 2.2S&P 500 (level, EOP) 2641 2718 2914 2507 2834 2942 2800 2750 2716 2801 2700 2507 2750 2650
9. HFE’s U.S. Economic & Financial Forecasts
Slower But Still Solid Growth , Low Inflation, And Some Fed Easing
When Dirt Pays More Than Bonds: Negative & Inverted Yield Curves, Inflation Risks & Industrial Recessions
Carl B. WeinbergChief International Economist www.hifreqecon.com/WebinarSep2019
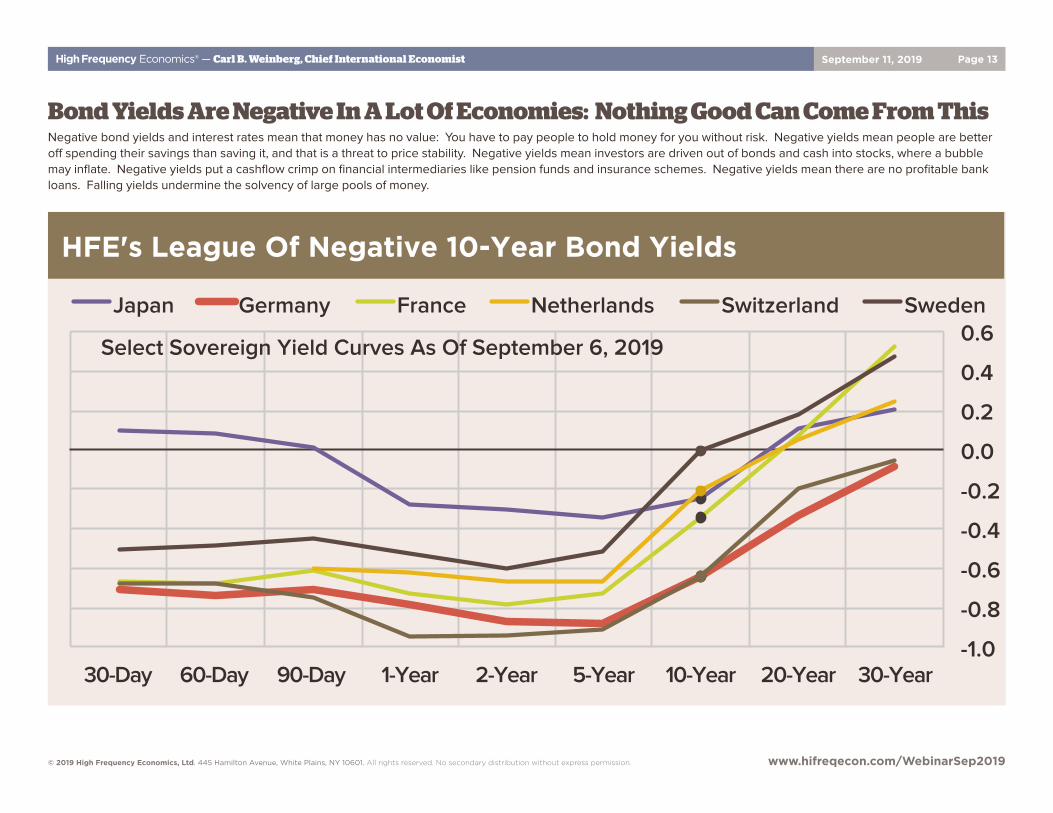
High Frequency Economics® — Carl B. Weinberg, Chief International Economist September 11, 2019 Page 13
© 2019 High Frequency Economics, Ltd. 445 Hamilton Avenue, White Plains, NY 10601. All rights reserved. No secondary distribution without express permission. www.hifreqecon.com/WebinarSep2019
-1.0
-0.8
-0.6
-0.4
-0.2
0.0
0.2
0.4
0.6
30-Day 60-Day 90-Day 1-Year 2-Year 5-Year 10-Year 20-Year 30-Year
Japan Germany France Netherlands Switzerland Sweden
HFE's League Of Negative 10-Year Bond Yields
Select Sovereign Yield Curves As Of September 6, 2019
Bond Yields Are Negative In A Lot Of Economies: Nothing Good Can Come From ThisNegative bond yields and interest rates mean that money has no value: You have to pay people to hold money for you without risk. Negative yields mean people are better off spending their savings than saving it, and that is a threat to price stability. Negative yields mean investors are driven out of bonds and cash into stocks, where a bubble may inflate. Negative yields put a cashflow crimp on financial intermediaries like pension funds and insurance schemes. Negative yields mean there are no profitable bank loans. Falling yields undermine the solvency of large pools of money.
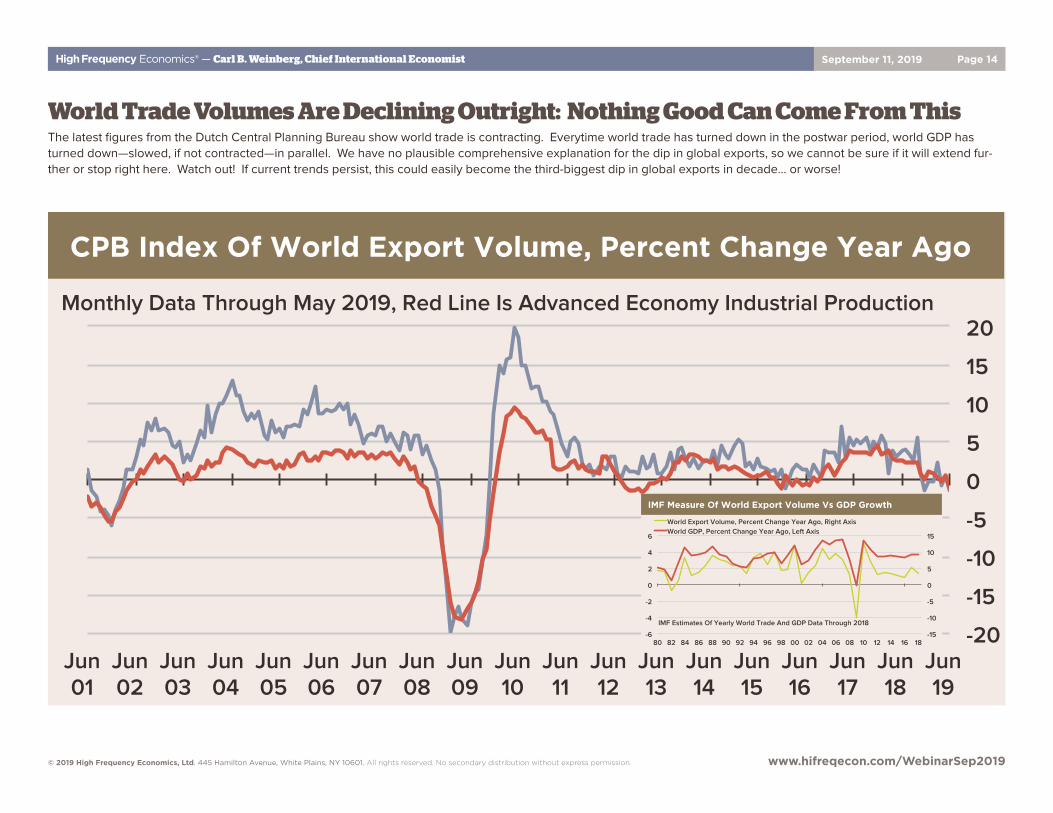
High Frequency Economics® — Carl B. Weinberg, Chief International Economist September 11, 2019 Page 14
© 2019 High Frequency Economics, Ltd. 445 Hamilton Avenue, White Plains, NY 10601. All rights reserved. No secondary distribution without express permission. www.hifreqecon.com/WebinarSep2019
World Trade Volumes Are Declining Outright: Nothing Good Can Come From ThisThe latest figures from the Dutch Central Planning Bureau show world trade is contracting. Everytime world trade has turned down in the postwar period, world GDP has turned down—slowed, if not contracted—in parallel. We have no plausible comprehensive explanation for the dip in global exports, so we cannot be sure if it will extend fur-ther or stop right here. Watch out! If current trends persist, this could easily become the third-biggest dip in global exports in decade… or worse!
-20
-15
-10
-5
0
5
10
15
20
Jun 01
Jun 02
Jun 03
Jun 04
Jun 05
Jun 06
Jun 07
Jun 08
Jun 09
Jun 10
Jun 11
Jun 12
Jun 13
Jun 14
Jun 15
Jun 16
Jun 17
Jun 18
Jun 19
Monthly Data Through May 2019, Red Line Is Advanced Economy Industrial Production
CPB Index Of World Export Volume, Percent Change Year Ago
-6
-4
-2
0
2
4
6
-15
-10
-5
0
5
10
15
80 82 84 86 88 90 92 94 96 98 00 02 04 06 08 10 12 14 16 18
World Export Volume, Percent Change Year Ago, Right Axis World GDP, Percent Change Year Ago, Left Axis
IMF Estimates Of Yearly World Trade And GDP Data Through 2018
IMF Measure Of World Export Volume Vs GDP Growth
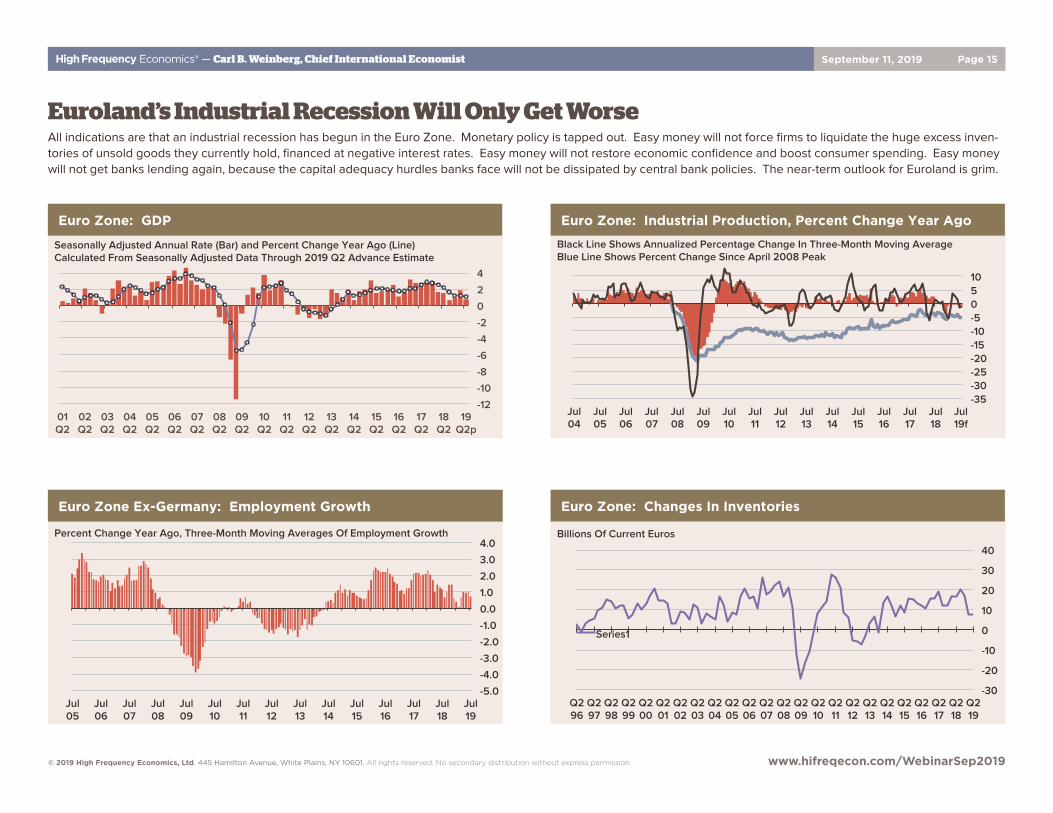
High Frequency Economics® — Carl B. Weinberg, Chief International Economist September 11, 2019 Page 15
© 2019 High Frequency Economics, Ltd. 445 Hamilton Avenue, White Plains, NY 10601. All rights reserved. No secondary distribution without express permission. www.hifreqecon.com/WebinarSep2019
-12
-10
-8
-6
-4
-2
0
2
4
01 Q2
02 Q2
03 Q2
04 Q2
05 Q2
06 Q2
07 Q2
08 Q2
09 Q2
10 Q2
11 Q2
12 Q2
13 Q2
14 Q2
15 Q2
16 Q2
17 Q2
18 Q2
19 Q2p
Euro Zone: GDP
Seasonally Adjusted Annual Rate (Bar) and Percent Change Year Ago (Line) Calculated From Seasonally Adjusted Data Through 2019 Q2 Advance Estimate
-35 -30 -25 -20 -15 -10 -5 0 5 10
Jul 04
Jul 05
Jul 06
Jul 07
Jul 08
Jul 09
Jul 10
Jul 11
Jul 12
Jul 13
Jul 14
Jul 15
Jul 16
Jul 17
Jul 18
Jul 19f
Black Line Shows Annualized Percentage Change In Three-Month Moving Average Blue Line Shows Percent Change Since April 2008 Peak
Euro Zone: Industrial Production, Percent Change Year Ago
-5.0
-4.0
-3.0
-2.0
-1.0
0.0
1.0
2.0
3.0
4.0
Jul 05
Jul 06
Jul 07
Jul 08
Jul 09
Jul 10
Jul 11
Jul 12
Jul 13
Jul 14
Jul 15
Jul 16
Jul 17
Jul 18
Jul 19
Euro Zone Ex-Germany: Employment Growth
Percent Change Year Ago, Three-Month Moving Averages Of Employment Growth
-30
-20
-10
0
10
20
30
40
Q2 96
Q2 97
Q2 98
Q2 99
Q2 00
Q2 01
Q2 02
Q2 03
Q2 04
Q2 05
Q2 06
Q2 07
Q2 08
Q2 09
Q2 10
Q2 11
Q2 12
Q2 13
Q2 14
Q2 15
Q2 16
Q2 17
Q2 18
Q2 19
Series1
Billions Of Current Euros
Euro Zone: Changes In Inventories
Euroland’s Industrial Recession Will Only Get WorseAll indications are that an industrial recession has begun in the Euro Zone. Monetary policy is tapped out. Easy money will not force firms to liquidate the huge excess inven-tories of unsold goods they currently hold, financed at negative interest rates. Easy money will not restore economic confidence and boost consumer spending. Easy money will not get banks lending again, because the capital adequacy hurdles banks face will not be dissipated by central bank policies. The near-term outlook for Euroland is grim.
High Frequency Economics® — Carl B. Weinberg, Chief International Economist September 11, 2019 Page 16
© 2019 High Frequency Economics, Ltd. 445 Hamilton Avenue, White Plains, NY 10601. All rights reserved. No secondary distribution without express permission. www.hifreqecon.com/WebinarSep2019
-1.0 -0.5 0.0 0.5 1.0 1.5 2.0 2.5 3.0 3.5 4.0
Aug 05
Aug 06
Aug 07
Aug 08
Aug 09
Aug 10
Aug 11
Aug 12
Aug 13
Aug 14
Aug 15
Aug 16
Aug 17
Aug 18
Aug 19p
Aug 20f
Euro Zone: CPI, Percent Change Year Ago
Blue Bars Are CPI, Green Line Is Core CPI, Black Line Is ECB Inflation Target Sep 19 Onward Is HFE Forecast Assuming Brent Oil Prices Hold Steady At $61.00
HFE Projection
-6
-3
0
3
6
9
12
15
Jul 01
Jul 02
Jul 03
Jul 04
Jul 05
Jul 06
Jul 07
Jul 08
Jul 09
Jul 10
Jul 11
Jul 12
Jul 13
Jul 14
Jul 15
Jul 16
Jul 17
Jul 18
Jul 19
Total MFI Lending Lending To SMEs Ex-Mortgages Mortgages
Euro Zone: Bank Lending, Percent Change Year Ago
-50
-40
-30
-20
-10
0
10
60
70
80
90
100
110
120
Aug 99
Nov 00
Feb 02
May 03
Aug 04
Nov 05
Feb 07
May 08
Aug 09
Nov 10
Feb 12
May 13
Aug 14
Nov 15
Feb 17
May 18
Aug 19
Economic Confidence, Right Axis
Consumer Confidence, Left Axis
Industrial Confidence, Left Axis
Data To August 2019
Euro Zone: Economic Confidence Indexes
-10 -5 0 5 10 15 20 25 30 35 40 45
Aug 00
Aug 01
Aug 02
Aug 03
Aug 04
Aug 05
Aug 06
Aug 07
Aug 08
Aug 09
Aug 10
Aug 11
Aug 12
Aug 13
Aug 14
Aug 15
Aug 16
Aug 17
Aug 18
Aug 19
Germany: IFO Inventory Index Germany: IFO Inventory Index
Diffusion Index Of Inventory Adequacy
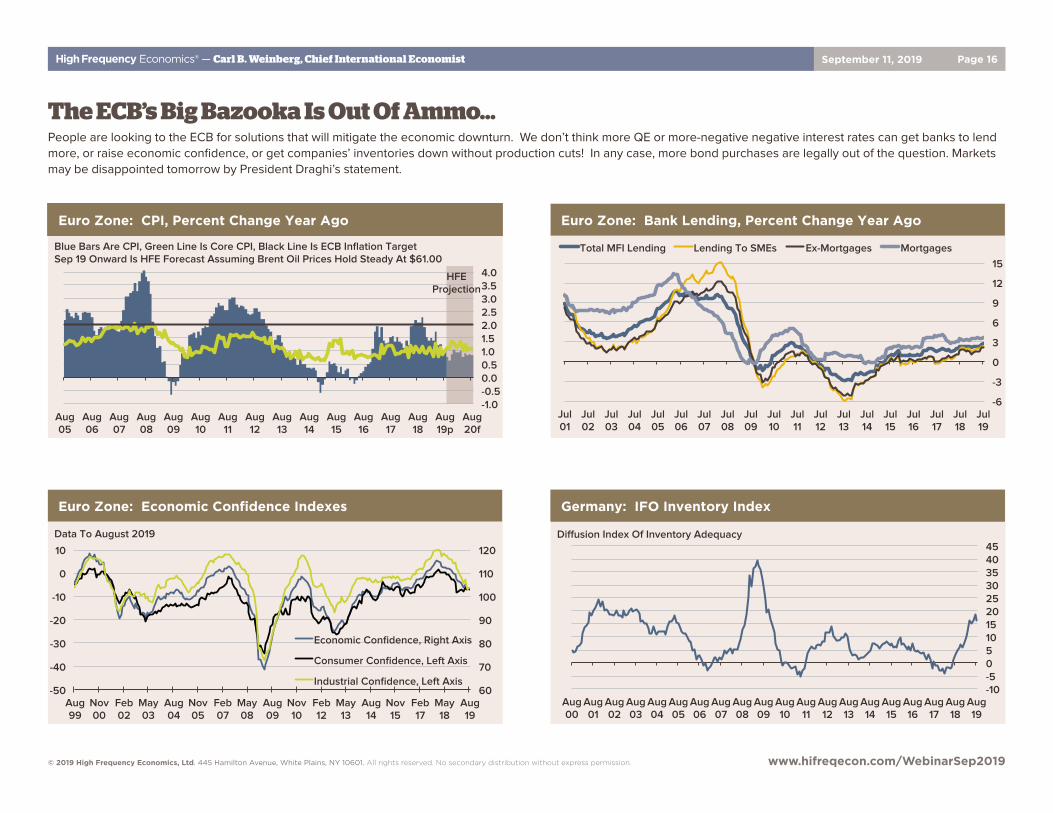
The ECB’s Big Bazooka Is Out Of Ammo…People are looking to the ECB for solutions that will mitigate the economic downturn. We don’t think more QE or more-negative negative interest rates can get banks to lend more, or raise economic confidence, or get companies’ inventories down without production cuts! In any case, more bond purchases are legally out of the question. Markets may be disappointed tomorrow by President Draghi’s statement.
High Frequency Economics® — Carl B. Weinberg, Chief International Economist September 11, 2019 Page 17
© 2019 High Frequency Economics, Ltd. 445 Hamilton Avenue, White Plains, NY 10601. All rights reserved. No secondary distribution without express permission. www.hifreqecon.com/WebinarSep2019
80
90
100
110
120
130
Sep 97
Sep 98
Sep 99
Sep 00
Sep 01
Sep 02
Sep 03
Sep 04
Sep 05
Sep 06
Sep 07
Sep 08
Sep 09
Sep 10
Sep 11
Sep 12
Sep 13
Sep 14
Sep 15
Sep 16
Sep 17
Sep 18
Sep 19
Westpac Trade-Weighted Yuan Index, 2000=100
Monthly Data, Final Datapoint Is September 6, 2019 Trend-Based Trading Channel Since 2015 Reform Shown
Westpac Trade-Weighted Yuan Index
0
50
100
150
200
250
300
350
400
450
Aug 03
Aug 04
Aug 05
Aug 06
Aug 07
Aug 08
Aug 09
Aug 10
Aug 11
Aug 12
Aug 13
Aug 14
Aug 15
Aug 16
Aug 17
Aug 18
Aug 19
Trade With The World
Trade With The United States
Exports Plus Imports Per Month, Billion Of U.S. Dollars, 12-Month Moving Averages Shown
China: Gross Trade China: Gross Trade (Exports + Imports)
-50 -40 -30 -20 -10 0 10 20 30 40 50 60 70 80 90 100
Aug 02
Aug 03
Aug 04
Aug 05
Aug 06
Aug 07
Aug 08
Aug 09
Aug 10
Aug 11
Aug 12
Aug 13
Aug 14
Aug 15
Aug 16
Aug 17
Aug 18
Aug 19
China: Monthly Imports From The United States
Percent Change Year Ago, Yellow Line Shows 5-Month Moving Average, In U.S. Dollars
China: Monthly Imports From The United States
-30
-20
-10
0
10
20
30
40
50
Aug 02
Aug 03
Aug 04
Aug 05
Aug 06
Aug 07
Aug 08
Aug 09
Aug 10
Aug 11
Aug 12
Aug 13
Aug 14
Aug 15
Aug 16
Aug 17
Aug 18
Aug 19
Percent Change Year Ago, Yellow Line Shows 5-Month Moving Average, In U.S. Dollars
China: Monthly Exports To The United States China: Monthly Exports To The United States
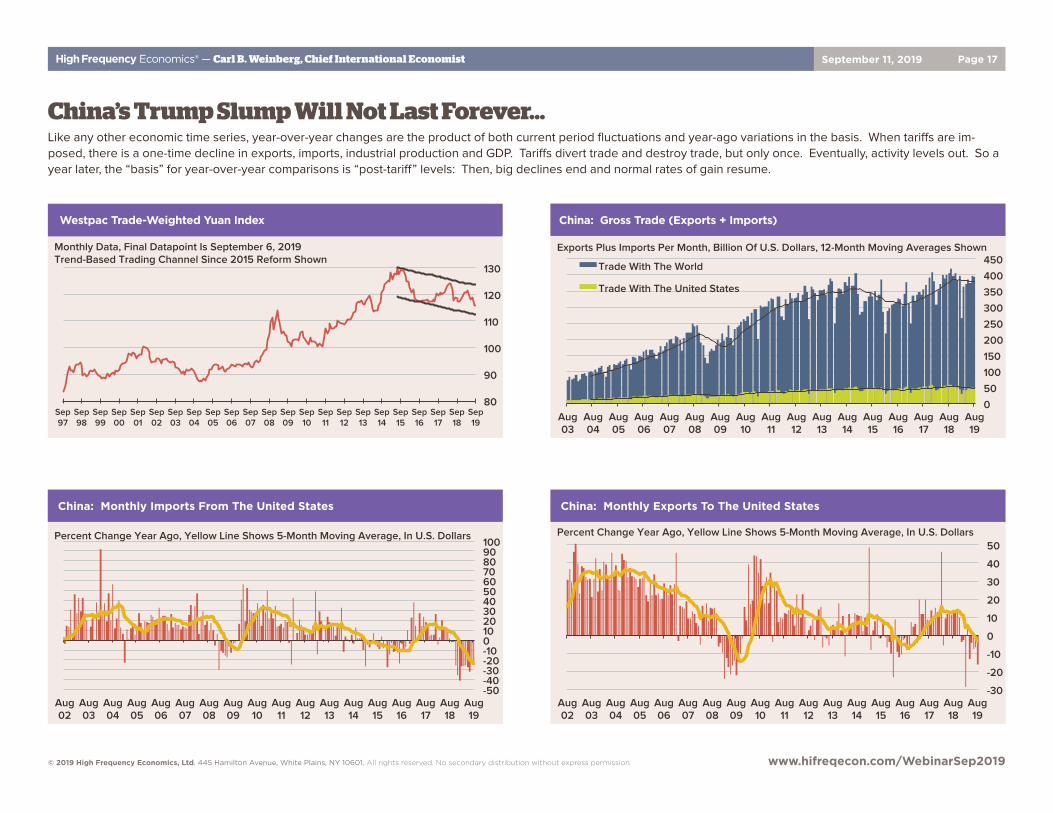
China’s Trump Slump Will Not Last Forever…Like any other economic time series, year-over-year changes are the product of both current period fluctuations and year-ago variations in the basis. When tariffs are im-posed, there is a one-time decline in exports, imports, industrial production and GDP. Tariffs divert trade and destroy trade, but only once. Eventually, activity levels out. So a year later, the “basis” for year-over-year comparisons is “post-tariff” levels: Then, big declines end and normal rates of gain resume.
High Frequency Economics® — Carl B. Weinberg, Chief International Economist September 11, 2019 Page 18
© 2019 High Frequency Economics, Ltd. 445 Hamilton Avenue, White Plains, NY 10601. All rights reserved. No secondary distribution without express permission. www.hifreqecon.com/WebinarSep2019
0
5
10
15
20
Sep 99
Sep 00
Sep 01
Sep 02
Sep 03
Sep 04
Sep 05
Sep 06
Sep 07
Sep 08
Sep 09
Sep 10
Sep 11
Sep 12
Sep 13
Sep 14
Sep 15
Sep 16
Sep 17
Sep 18
Sep 19
China: Required Reserve Ratio At Major Banks, Percent China: Required Reserve Ratio At Major Banks, Percent
0
5
10
15
20
25
30
Aug 03
Aug 04
Aug 05
Aug 06
Aug 07
Aug 08
Aug 09
Aug 10
Aug 11
Aug 12
Aug 13
Aug 14
Aug 15
Aug 16
Aug 17
Aug 18
Aug 19f
Stock Of Quasi-Money
Stock Of Quasi-Money
China: Growth Of Domestic Credit, Percent Change Year Ago China: Growth Of Domestic Credit, Percent Change Year Ago
0
5
10
15
20
Aug 04
Aug 05
Aug 06
Aug 07
Aug 08
Aug 09
Aug 10
Aug 11
Aug 12
Aug 13
Aug 14
Aug 15
Aug 16
Aug 17
Aug 18
Aug 19f
China: Industrial Production, Percent Change Year Ago
Yellow Line Is Three-Month Production Trend
China: Industrial Production, Percent Change Year Ago
-25
0
25
50
75
100
Aug 03
Aug 04
Aug 05
Aug 06
Aug 07
Aug 08
Aug 09
Aug 10
Aug 11
Aug 12
Aug 13
Aug 14
Aug 15
Aug 16
Aug 17
Aug 18
Aug 19f
M2 M1 Aggregate Financing
China: Money And Credit, Percent Change Year Ago China: Money And Credit, Percent Change Year Ago
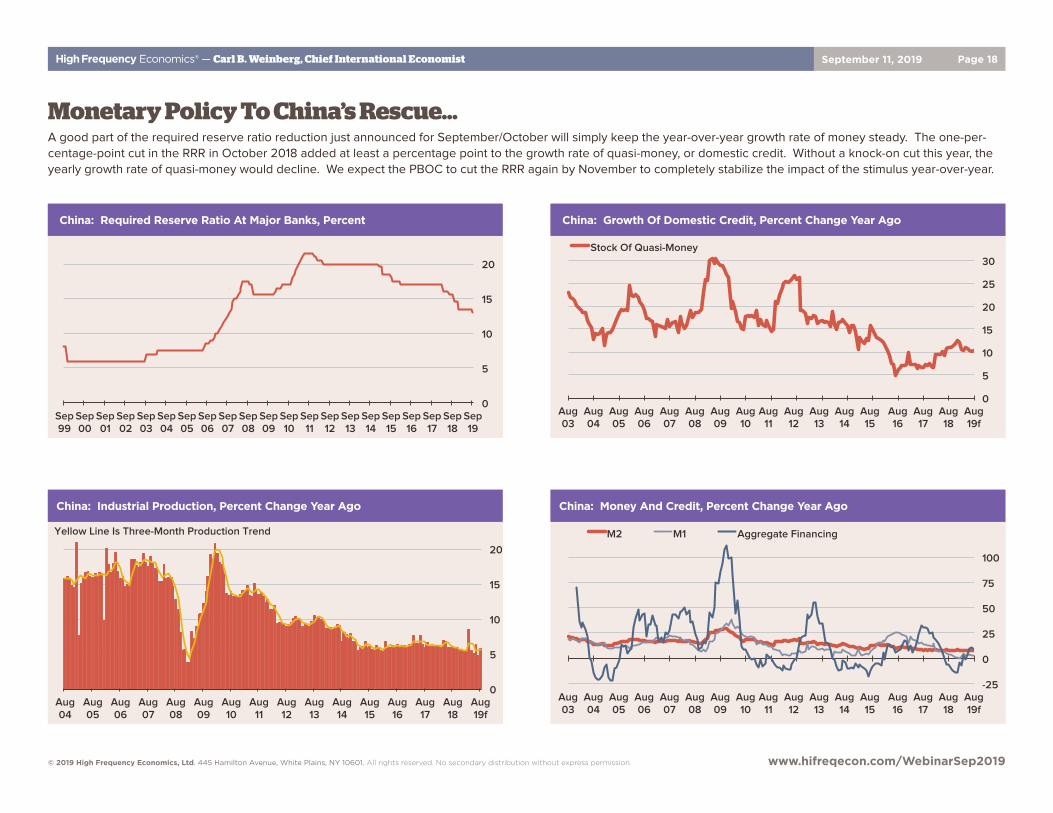
Monetary Policy To China’s Rescue…A good part of the required reserve ratio reduction just announced for September/October will simply keep the year-over-year growth rate of money steady. The one-per-centage-point cut in the RRR in October 2018 added at least a percentage point to the growth rate of quasi-money, or domestic credit. Without a knock-on cut this year, the yearly growth rate of quasi-money would decline. We expect the PBOC to cut the RRR again by November to completely stabilize the impact of the stimulus year-over-year.
High Frequency Economics® — Carl B. Weinberg, Chief International Economist September 11, 2019 Page 19
© 2019 High Frequency Economics, Ltd. 445 Hamilton Avenue, White Plains, NY 10601. All rights reserved. No secondary distribution without express permission. www.hifreqecon.com/WebinarSep2019
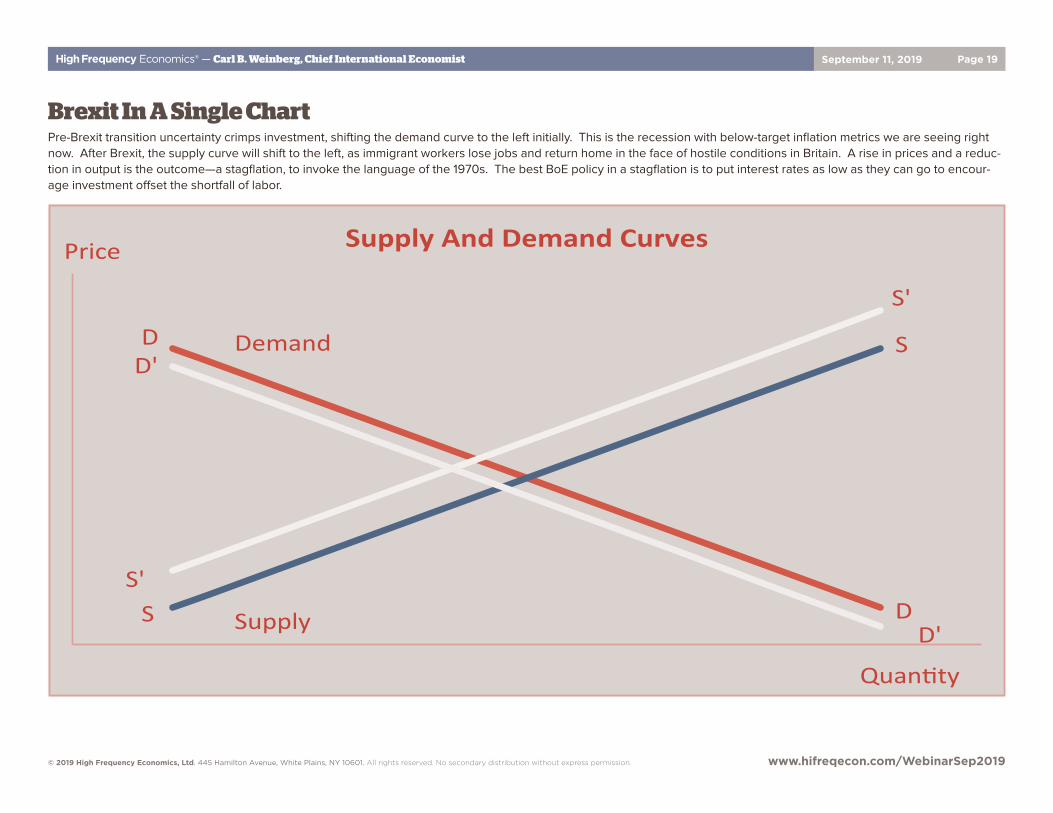
Brexit In A Single ChartPre-Brexit transition uncertainty crimps investment, shifting the demand curve to the left initially. This is the recession with below-target inflation metrics we are seeing right now. After Brexit, the supply curve will shift to the left, as immigrant workers lose jobs and return home in the face of hostile conditions in Britain. A rise in prices and a reduc-tion in output is the outcome—a stagflation, to invoke the language of the 1970s. The best BoE policy in a stagflation is to put interest rates as low as they can go to encour-age investment offset the shortfall of labor.
SupplyAndDemandCurves
Demand
Price
Quan.ty
D
D
D'
D'Supply
S'
S'
S
S
Global Webinar:Inverted & Negative Yield Curves, Trade Tensions & More
Jim O’Sullivan & Carl WeinbergHigh Frequency Economics www.hifreqecon.com/WebinarSep2019


![NFIB 2-2015 Committee Presentation [Compatibility Mode]](https://img.pdfslide.us/doc/110x75/55cf9264550346f57b9603a0/nfib-2-2015-committee-presentation-compatibility-mode.jpg)