Embed Size (px)
Citation preview

Global warming threatens the persistence ofMediterranean brown troutANA ALMODOVAR * , GRAC IELA G . N ICOLA † , DAN IEL AYLL ON * and BENIGNO ELVIRA*
*Department of Zoology, Faculty of Biology, Complutense University of Madrid, Jose Antonio Novais 2, E-28040 Madrid, Spain,
†Department of Environmental Sciences, University of Castilla-La Mancha, Avda. Carlos III s/n, E-45071 Toledo, Spain
Abstract
Current climate change exacerbates the environmental restrictions on temperate species inhabiting low latitude edges
of their geographical ranges. We examined how temperature variations due to current and future climate change are
likely to affect populations’ persistence of stream-dwelling brown trout Salmo trutta at the vulnerable southern
periphery of its range. Analysis of 33 years of air temperature data (1975–2007) by time-series models indicated a sig-
nificant upward trend and a pronounced shift in air temperature around 1986-1987. This warming is associated with
an ongoing population decline of brown trout, most likely caused by a loss of suitable thermal habitat in lower lati-
tudes since the 1980s. Population decrease may not be attributed to physical habitat modification or angler pressure,
as carrying capacity remained stable and populations were not overexploited. We developed regional temperature
models, which predicted that unsuitable thermal habitat for brown trout increased by 93% when comparing climate
conditions between 1975–1986 and 1993–2004. Predictions from climate envelope models showed that current climate
change may be rendering unsuitable 12% of suitable thermal habitat each decade, resulting in an overall population
decrease in the lower reaches of around 6% per year. Furthermore, brown trout catches markedly decreased 20% per
year. Projections of thermal habitat loss under the ecologically friendly B2 SRES scenario showed that brown trout
may lose half of their current suitable habitat within the study area by 2040 and become almost extinct by 2100. In
parallel to the upstream movement of brown trout thermal habitat, warm water species are increasing their relative
abundance in salmonid waters. Empirical evidence was provided of how current climate change threatens some of
the most healthy native brown trout populations in Southern Europe and how forthcoming climate change is
expected to further decrease the conservation status of the species.
Keywords: carrying capacity, climate change, marginal populations, regional temperature models, salmonids, suitable habitat
Received 14 October 2011 and accepted 4 November 2011
Introduction
Global warming is changing the current distribution
and abundance of many thermally sensitive species (e.
g. Root et al., 2003; Thomas et al., 2004; Lenoir et al.,
2008). In particular, one threatened fish family is Sal-
monidae, which comprises oxygen demanding species
that require cold and clean water (Jonsson & Jonsson,
2011). As Elliott & Elliott (2010) emphasize, tempera-
ture is often regarded simply as a factor that alters the
physiology and behaviour of salmonids, yet it is also a
crucial feature of their habitat, being one axis of their
multidimensional niche. There are already examples of
stock declines due to climate change in many valuable
commercial and recreational fisheries from North
America (Condron et al., 2005) and Europe (Jonsson &
Jonsson, 2004; Hari et al., 2006; Todd et al., 2008). Fur-
thermore, climate change aggravates environmental
constraints especially for populations of salmonid spe-
cies persisting at low-latitude margins. This fact is illus-
trated by wild brown trout Salmo trutta populations,
which are expected to face the greatest risk from
climate change at the southern edge of their distribu-
tion range (Jonsson & Jonsson, 2009, 2011; Lassalle &
Rochard, 2009).
In Southern European rivers, stream-dwelling salmo-
nids are restricted to headwaters, where local environ-
mental conditions mitigate the adverse effects of
regional warm climate. Current climate change is pro-
jected to worsen freshwater conditions (higher temper-
atures and longer droughts) in the Mediterranean
region, an area already vulnerable to climate variations
and decreased water availability (Giorgi & Lionello,
2008). Interannual variations are expected to be more
noticeable in summertime and this, together with a
gradual warming, would result in more frequent extre-
mely high temperature events. Wild brown trout occursCorrespondence: Ana Almodovar, tel. + 34 913 945 135,
fax + 34 913 944 947, e-mail: [email protected]
© 2011 Blackwell Publishing Ltd 1549
Global Change Biology (2012) 18, 1549–1560, doi: 10.1111/j.1365-2486.2011.02608.x

within a limited range of environmental temperatures,
with lower tolerance to high temperatures than other
salmonid species (Elliott & Elliott, 2010). In this context,
it is a species whose populations, a priori, will experi-
ence severe climate change-induced impacts, including
shifts in the species distribution range as a consequence
of a considerable reduction in their suitable thermal
habitat.
Moreover, the Iberian Peninsula shows a strong
genetic differentiation among brown trout populations
and due to its important role as a glacial refuge is con-
sidered a hotspot for the species diversity (Machordom
et al., 2000; Suarez et al., 2001; Almodovar et al., 2006a).
These peripheral populations, which naturally occur at
low densities, are more prone to local extinctions due
to increasingly detrimental human impact and the
effects of current climate change (Hampe & Petit, 2005;
Nicola et al., 2008, 2009). Furthermore, projected
changes in populations will negatively affect sport fish-
ing in a species with a high socioeconomic value.
Although Jonsson & Jonsson (2009) reviewed the
eventual impact of climate change on European anad-
romous populations of brown trout, as far as we are
aware studies on stream-dwelling Mediterranean trout
populations are still scarce (Lassalle & Rochard, 2009).
A thorough study was conducted in a southern Pyre-
nean basin (River Aragon, Ebro River basin) during a
12-year-period (1993–2004) to assess the conservation
status of brown trout. After analysing the influence of a
wide range of both environmental and human degrada-
tion factors on the deviation of density from carrying
capacity (i.e. potential maximum density), we found
that the main determinants of the marked decrease of
trout abundance and shifts in species distribution were
maximum water temperature and stream connectivity
(D. Ayllon et al., submitted paper). Furthermore, pro-
jections of air temperature and precipitation in this area
under A2 and B2 SRES scenarios (Special Report on Emis-
sion Scenarios, Nakicenovic et al., 2000) have been made
by Brunet et al. (2009). The A2 scenarios focus on a
regionally oriented economic development where the
global population is expected to increase at a high rate;
therefore energy consumption and changes in land use
are high and resources become scarce. The B2 scenarios
emphasize environmental preservation and social
equity, with local solutions to economic, social and
environmental sustainability, where the global popula-
tion is expected to increase continuously, yet more
slowly than in A2. Both families of scenarios predict an
increase of maximum and minimum air temperatures
for 2010–2100, although with no significant changes in
precipitation. Therefore, in this study our aim is to
examine how current and potential temperature varia-
tions due to climate change affect populations’ persis-
tence of brown trout within the warmer boundaries of
its distribution. We expected that the increased water
temperature would change the distribution and abun-
dance of brown trout due to a reduction of suitable
thermal habitat.
Material and methods
Study area
We analysed 19 sites from 12 rivers of the Aragon River basin
(Fig. 1), a Mediterranean Pyrenean drainage system. Sampling
sites were selected to characterize the full range of environ-
mental and geo-morphological conditions existing within the
area. Sampling sites corresponded to second to fourth-order
streams and were situated between latitudes 42°30′ and 43°03′Nand longitudes 0°43′ and 1°32′W, at an altitude ranging from
540 to 870 m. Brown trout is the prevailing species throughout
the study area and its populations consist of exclusively resi-
dent individuals. The rivers are not currently stocked and are
open to recreational angling except for some reaches, which
are preserved sections. The rivers are not impaired by anthro-
pogenic land uses or pollution. The scattered dispersal of
power stations and dams on the lower reaches are the main
anthropogenic pressures in the study area.
Fish assessment
Brown trout populations were sampled by electrofishing
every summer from 1993 to 2004 using a 2200-W generator.
Prior to sampling, each site was blocked upstream and down-
stream with nets. The sampling sites were 71–152 m long,
4–14 m wide and encompassed an area of 356–1909 m2. Indi-
viduals were anaesthetised with tricaine methane-sulphonate
(MS-222), measured (fork length, to the nearest mm) and
weighed (to the nearest g). Scales were taken for age determi-
nation. Fish density (individuals ha�1) with variance was esti-
mated separately for each sampling site by applying the
maximum likelihood method (Zippin, 1956) and the corre-
sponding solution proposed by Seber (1982) for three remo-
vals assuming constant-capture effort. Population estimates
were carried out separately for each year class. A qualitative
assessment of the abundance of fish species other than brown
trout was simultaneously performed at each site. During every
brown trout sampling, abundance of nontrout fish species was
categorized and ranked as nonpresent (0), rare (1), frequent
(2), abundant (3) and very abundant (4). An abundance index
was estimated then for every site and year as the average of
the individual qualitative abundance index of every species
caught in the study area. The total abundance index of non-
trout species of a given year was calculated as the average of
all sites.
The recreational fishery in the study area is focused on
brown trout, which is the only target species. During the fish-
ing seasons (March–August) from 1991 to 2004 creel-surveys
were conducted in 52 reaches from 17 streams, where all sam-
pling localities are included (Fig. 1). Monitoring surveys were
© 2011 Blackwell Publishing Ltd, Global Change Biology, 18, 1549–1560
1550 A. ALMODOVAR et al.

carefully planned and included any information relevant to
the fishery (see full description in Almodovar et al., 2002).
Fishing pressure was estimated by the number of anglers per
hectare per day (angler ha�1 day�1). Harvest rate was calcu-
lated as the mean number of legal-sized trout kept per hectare
per year (individuals ha�1 year�1).
Temporal trends in total brown trout density, abundance of
nontrout species, fishing pressure and harvest rate were
tested by regressing population parameters against year of
observation. Data were log-transformed before the analysis.
Significances were obtained by randomization tests and esti-
mates for intercept and slope were obtained by a bootstrap-
ping procedure with 1000 bootstrap samples. Statistical
analyses were performed using STATISTICA 6.1 (StatSoft Inc.,
Tulsa, OK, USA) and SPSS version 18.0 (SPSS, Chicago, IL,
USA).
Carrying capacity
Carrying capacity was defined as the potential maximum den-
sity of fish a river can naturally support during the period of
minimum available habitat (Milner et al., 2003). Physical habi-
tat dynamics were modelled using the Physical Habitat Simu-
lation system (PHABSIM; Milhous et al., 1989). PHABSIM
simulations determine the potentially available habitat for an
aquatic species and its life stages as a function of discharge by
coupling a hydraulic simulation model with a model describ-
ing the habitat selection patterns of the target species (the hab-
itat suitability criteria, HSC). The standard output of
PHABSIM simulations is the curve that relates the Weighted
Usable Area (WUA; m2 WUA ha�1, an index of the quality
and quantity of available habitat) with stream flow (m3 s�1).
We conducted habitat surveys at every sampling site during
the summer of 2004 to collect the topographical, hydraulic and
channel structure data necessary to perform PHABSIM simu-
lations, following the procedures described in Ayllon et al.
(2010a, 2011). We assessed an average (± SD) length of
99.5 ± 22.9 m and average (± SD) area of 850.9 ± 424.2 m2 per
site. To model brown trout habitat selection, reach-type spe-
cific HSC for young-of-the-year (YOY, 0+), juvenile (1+) andadult (>1+) life stages were developed (see Ayllon et al.,
2010b).
Fig. 1 Map of the study area showing the 19 monitoring localities (red circles; River Salazar, SA; River Eska, ES; River Areta, AR; River
Irati, IR; River Urrobi, UR; River Erro, ER), 52 fishery monitoring sites (yellow circles), 48 meteorological stations (black triangles) and
seven water temperature data-loggers (black squares). The Digital Elevation Model represents the salmonid waters (area presenting an
average maximum water temperature below 21.5 °C) of the Aragon River basin.
© 2011 Blackwell Publishing Ltd, Global Change Biology, 18, 1549–1560
EFFECTS OF CLIMATE CHANGE ON TROUT SURVIVAL 1551

Hydraulic data were calibrated in PHABSIM following
procedures set out in Waddle (2001). Habitat competition
analyses were performed using the HABEF program
within PHABSIM to model habitat partitioning among life
stages in the stream areas where physical habitat is suit-
able for more than one life stage (see Ayllon et al., 2010a
and Parra et al., 2011 for further details on competition
analyses). Summer habitat time series for the 12-year study
period (1993–2004) for each age class were obtained by
combining WUA curves as a function of stream flow with
historical flow time series provided by the nearest gauging
stations.
The area required and so defended (i.e. territory size) by
individuals of different life stages provides the link between
amount of available habitat and number of individuals of
each life stage that can be supported by the habitat associ-
ated with a given flow, i.e. carrying capacity. Spatial require-
ments of individuals were determined by means of an
allometric territory size relationship specifically developed
for brown trout (Ayllon et al., 2010a). Consequently, to calcu-
late territory size, length at age i was determined for every
age class, year, and site. Finally, carrying capacity was esti-
mated for every age class (0+, 1+ and > 1+), year and site
through the following ratio, Ki = WUAi/Ti, where Ki is the
carrying capacity of age-class i (trout ha�1), WUAi is
the mean summer WUA of age-class i (m2 ha�1) and Ti is
the area of the territory used by an individual of average
body size of age-class i (m2 trout�1).
Temporal trends in carrying capacity and the ratio between
density and carrying capacity (D/K ratio) were tested by
regressing population parameters against year of observation,
following the procedure detailed for fish population assess-
ment.
Air and water temperature modelling
Air temperature data series (1975–2007) were analysed by
time-series models to determine their autocorrelation struc-
ture. Data came from two meteorological stations close to
fish sampling points located at high (Abaurrea, 1050 m)
and low (Eparoz, 608 m) altitudes, which were representa-
tive of upper and lower reaches. Model identification tech-
niques were used to distinguish which time-series model
adequately characterized the autocorrelations among the
observations. The goal was to identify a model that ade-
quately explained the patterns in the observations and their
interdependence. Time-series models were classified as
autoregressive, moving average, or autoregressive integrated
moving average (ARIMA) (Box & Jenkins, 1976). An inter-
rupted time-series design (i.e., a time-series analysis in
which the series is divided, or interrupted, by the interven-
tion into two periods, preintervention and postintervention,
which will be compared), based on the models developed
by McDowall et al. (1980), was used to examine the tempo-
ral trend in air temperature data. The Expert Modeller fea-
tures in SPSS version 18.0 were used to automatically
determine the best-fitting ARIMA model to analyse temper-
ature data.
We developed two different spatial models to predict
water temperatures in the study basin during the study per-
iod (1993–2004). We developed a model describing maxi-
mum water temperature (MAXTw) and a model describing
maximum mean water temperature during seven consecu-
tive days (MAX7d-Tw), averaged for the length of the study
period. As water temperature data were not available, they
were estimated from air temperature data. At a first step, we
built a regional model of maximum air temperature (MAX-
Ta) by regressing maximum air temperature to latitude and
altitude for 48 stations ranging in altitude from 38 to 1344 m
above mean sea level (a.s.l.; Fig. 1). At a second step, we
developed a regression model relating average maximum
water temperature to average maximum air temperature. To
do this, water temperature was recorded daily at seven sites
(Fig. 1) by means of data-loggers installed from June of 2004
to November of 2005. A linear and the nonlinear regression
model described by Mohseni et al. (1998) were fitted to data
and compared by means of the Akaike’s Information Crite-
rion adjusted for small samples (AICc; Burnham & Ander-
son, 2002). The model with the lowest AICc was considered
the best fit. The same procedure was used to develop a
regional model for maximum mean water temperature dur-
ing seven consecutive days (MAX7d-Tw) as a function of
maximum mean air temperature during seven consecutive
days (MAX7d-Ta). We employed MAX7d-Ta as the indepen-
dent variable as previous studies have shown that weekly
and monthly averages of stream temperature and air tem-
peratures are better correlated with each other than are daily
values (e.g., Stefan & Preud’homme, 1993; Morrill et al.,
2005).
Based on the calculated predictive water temperature regio-
nal models, we constructed maps of MAXTw and MAX7d-Tw
for the average climate conditions during the study period
using ArcGis 9.2 software (ESRI Inc., Redlands, CA, USA).
Based on MAX7d-Tw, we represented the spatial distribution
of the thermal limit beyond which water temperature becomes
stressful for brown trout populations. According to Elliott
et al. (1995) and Elliott & Elliott (2010), the upper temperature
limits for feeding and growth are above 19.4 °C in brown
trout. Therefore, the 19.4 °C isotherm was used to split study
sites up into upper and lower localities. Afterwards, we esti-
mated the amount of suitable habitat with MAX7d-Tw at or
below the 19.4 °C thermal limit for present air temperatures
and for warming scenarios of 0.1–3.5 °C higher than present
to quantify projected loss of thermal habitat.
Finally, we calculated the projected loss of salmonid waters
on the study area under warming scenarios of 0.1–5 °C air
temperature increases. European Water Framework Directive
(Council Directive 2006/44/CE) set a maximum water tem-
perature of 21.5 °C as the thermal limit to separate salmonid
from warm water fish courses. We followed the same method-
ology described before, setting MAXTw equalled to 21.5 °C as
the thermal limit. The warming scenarios used to calculate the
loss of thermal habitat and salmonid waters were selected to
include the whole range of air temperature regional projec-
tions under the A2 and B2 SRES scenarios presented by Brunet
et al. (2009).
© 2011 Blackwell Publishing Ltd, Global Change Biology, 18, 1549–1560
1552 A. ALMODOVAR et al.

Results
Air temperature time series
The analysis of 33 years of air temperature data (1975–2007) showed a gradual increase during the study
period, which was more apparent in minimum temper-
atures. The data series fit significant first order vector
autoregressive ARIMA models (1,0,0) in both stations
(Table 1), thus indicating a significant increasing trend
in temperature. The residuals of ARIMA models were
not autocorrelated and were normally distributed.
The yearly plot for the study region suggested a pro-
nounced shift in air temperature in 1986–1987 followed
by a levelling off until 2007 (Fig. 2). Thus, the inter-
rupted time-series analysis was done between 1975–1986 and 1987–2007 periods. The analyses showed that
the intervention parameter (Φ) was statistically signifi-
cant in both models (Table 1). We obtained abrupt-
permanent functions where the intervention parameter
indicated the rate of change in air temperature. That is,
air temperature significantly increased by about 1.2 °Cin Abaurrea and 1.7 °C in Eparoz from 1986–1987.
Mean minimum annual temperature in the preinterven-
tion period (1975–1986) was 3.5 ± 1.1 °C in Abaurrea
and 4.6 ± 0.9 °C in Eparoz, whereas in the postinter-
vention period (1986–2007) annual temperature aver-
aged 4.9 ± 0.5 and 6.3 ± 0.4 °C in Abaurrea and
Eparoz, respectively.
Air temperature modelling
Regarding the 1993–2004 time period (48 meteorologi-
cal stations), MAXTa and MAX7d-Ta were significantly
related to altitude and latitude, following the regression
models shown in Table 2. We developed regional mod-
els of MAXTa and MAX7d-Ta for the 1975–1986 period,
when the significant shift in air temperature was
detected. These models were developed from the 23
stations where data from that period were available.
The obtained models for the 1975–1986 period were
also highly significant (Table 2).
Water temperature modelling
When regressing either MAXTw or MAX7d-Tw, linear
regression models were better fitted to data (N = 2682)
than nonlinear models. Based on the linear models gov-
erning the relationship between air and water tempera-
tures (Table 3), air temperature regional models were
converted into regional water temperature models.
Study sites were then divided in two groups: the upper
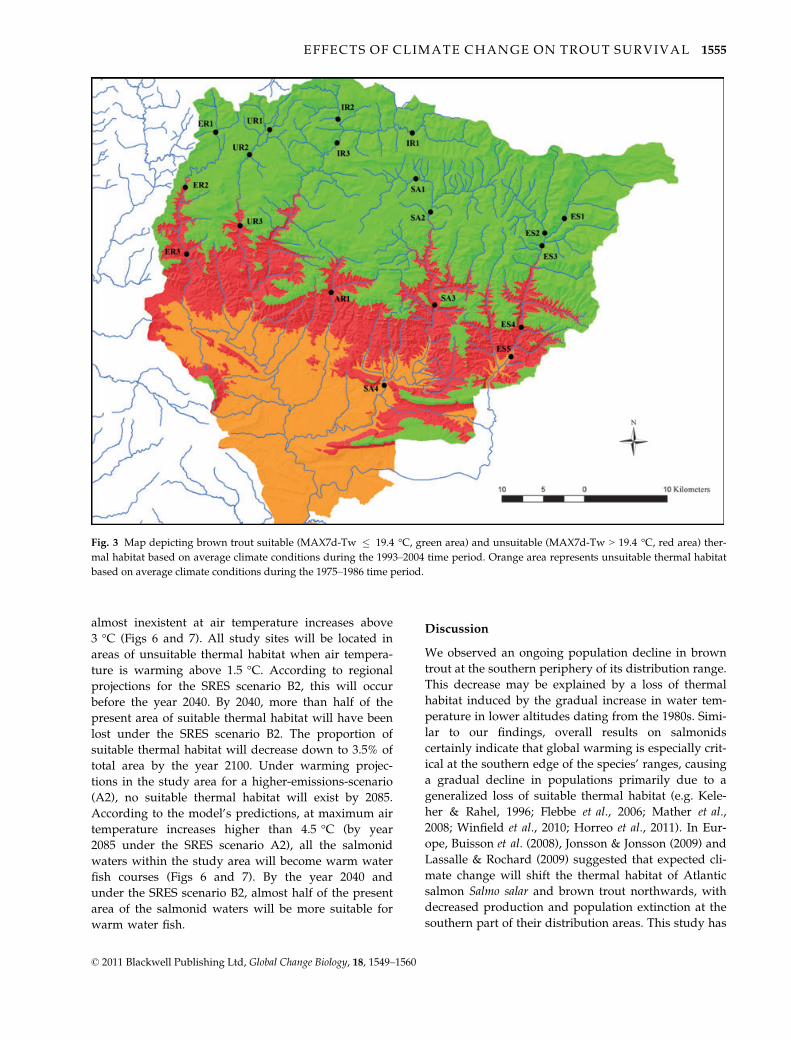
localities, presenting MAX7d-Tw lower than 19.4 °C(ES1, ES2, ES3, SA1, SA2, IR1, IR2, IR3, UR1, UR2 and
ER1), and the lower localities withMAX7d-Tw above the
thermal limit (ES4, ES5, SA3, SA4, AR1, UR3, ER2 and
ER3) (Fig. 3). Unsuitable habitat (MAX7d-Tw > 19.4 °C)increased by 92.6% when comparing climate conditions
for the 1975–1986 period (49 649 ha of unsuitable habitat,
23.6% of total area) vs. the 1993–2004 period (95 637 ha of
unsuitable habitat, 45.4% of total area) (Fig. 3).
Fish abundance and carrying capacity
For brown trout, the observed warming is associated
with an overall population decrease in the lower
reaches. Total mean density gradually declined in the
lower localities during the study period at a rate close
to 6.0% per year (Log Density = 128.04 (± 42.33) – 0.06
(± 0.02) Year; F1,10 = 8.12, P = 0.0173, R2 = 0.45;
Fig. 4a), from a mean 2073.3 trout ha�1 in 1993 to
1339.2 trout ha�1 in 2004. However, in upper reaches
populations remained stable, showing no significant
Table 1 Values of parameters in ARIMA (1,0,0) models
(AR1, constant, intervention parameter Φ), standard errors
(SE) and t-tests for time-series analyses of air temperature data
from 1975 to 2007 in low (Eparoz) and high (Abaurrea) alti-
tude monitoring stations
SE t-ratio P
Eparoz AR1 0.9583 0.0761 12.6001 < 0.0001
Constant 3.4386 1.0631 3.2346 0.0029
Φ 1.6522 0.3323 4.9725 < 0.0001
Abaurrea AR1 0.4154 0.1670 2.4872 0.0185
Constant 4.4154 0.2785 15.8350 < 0.0001
Φ 1.1780 0.3621 3.2537 0.0028
Fig. 2 Minimum annual air temperature (Tmin, °C) in the study
area measured at 608 m (Eparoz meteorological station) and
1050 m (Abaurrea station). The vertical line indicates the abrupt
1986/1987 shift in air temperatures mentioned in the text.
© 2011 Blackwell Publishing Ltd, Global Change Biology, 18, 1549–1560
EFFECTS OF CLIMATE CHANGE ON TROUT SURVIVAL 1553
population decline (R2 = 0.002, P = 0.8999, mean
5565.1 trout ha�1, range 4171.9–7723.6 trout ha�1).
In many cases, climate change would exacerbate
declining suitable physical habitat; however, total carry-
ing capacity did not decrease during themonitoring per-
iod in either upper or lower reaches (upper, R2 = 0.004,
P = 0.8446, mean 5546.7 trout ha�1, range 4835.2–6353.1trout ha�1; lower, R2 = 0.16, P = 0.2036, mean 2579.0 trout
ha�1, range 2051.6–2992.0 trout ha�1). Conversely, the
density/carrying capacity (D/K) ratio significantly
decreased in populations at lower altitudes at a rate
about 8% per year (Log D/K = 157.38 (± 45.69) – 0.08
(± 0.02) Year; F1,10 = 11.25, P = 0.0073, R2 = 0.53; Fig. 4b),
from amean 95.5% in 1993 to 41% in 2004. The D/K ratio
averaged 98.5% in the upper reaches and was nearly
constant during the study period (R2 = 0.02, P = 0.6860).
Fishery data showed that anglers are homogeneously
disseminated throughout the study area, so that the
fishing effort is uniformly distributed both geographi-
cally and with respect to site altitude (Fig. 1). During
the study period average fishing pressure (angler
ha�1 day�1) was significantly higher (ANOVA, F1,174 =47.52, P < 0.0001) in upper localities (mean 0.81 angler
ha�1 day�1, range 0.03–3.82) than in lower ones (mean
0.21 angler ha�1 day�1, range 0.01–1.26). Moreover, a
significant decrease of fishing pressure was observed in
the whole area during the study period, both in lower
(Log Fishing pressure = 318.26 (± 64.99) – 0.16 (± 0.03)
Year; F1,9 = 24.22, P = 0.0008, R2= 0.73) and upper local-
ities (Log Fishing pressure = 214.59 (± 40.21) – 0.11
(± 0.02) Year; F1,10 = 28.54, P = 0.0003, R2 = 0.74). From
1991 to 2003 a significant decline in the mean annual
catch of brown trout in the studied rivers occurred (Log
Harvest rate = 410.45 (± 65.43) – 0.20 (± 0.03) Year;
F1,10 = 38.63, P < 0.0001, R2 = 0.79; Fig. 5). Harvest rate
decreased at a rate of 20% per year, from an average
82.8 trout ha�1 year�1 in 1991 to 13.2 trout ha�1 year�1
in 2003.
The abundance index of nontrout fish species signifi-
cantly increased during the study period in both lower
(Abundance index = �73.87 (± 21.25) + 0.0375 (± 0.011)
Year; F1,9 = 12.42, P = 0.0065, R2 = 0.58) and upper
reaches (Abundance index = �33.97 (± 11.38) + 0.0172
(± 0.006) Year; F1,9 = 9.13, P = 0.0144, R2 = 0.50),
although the rate at which abundance of nontrout spe-
cies increased with time was significantly higher in the
lower reaches.
Thermal habitat loss projections
Projected brown trout suitable thermal habitat area
for different warming scenarios decreases until being
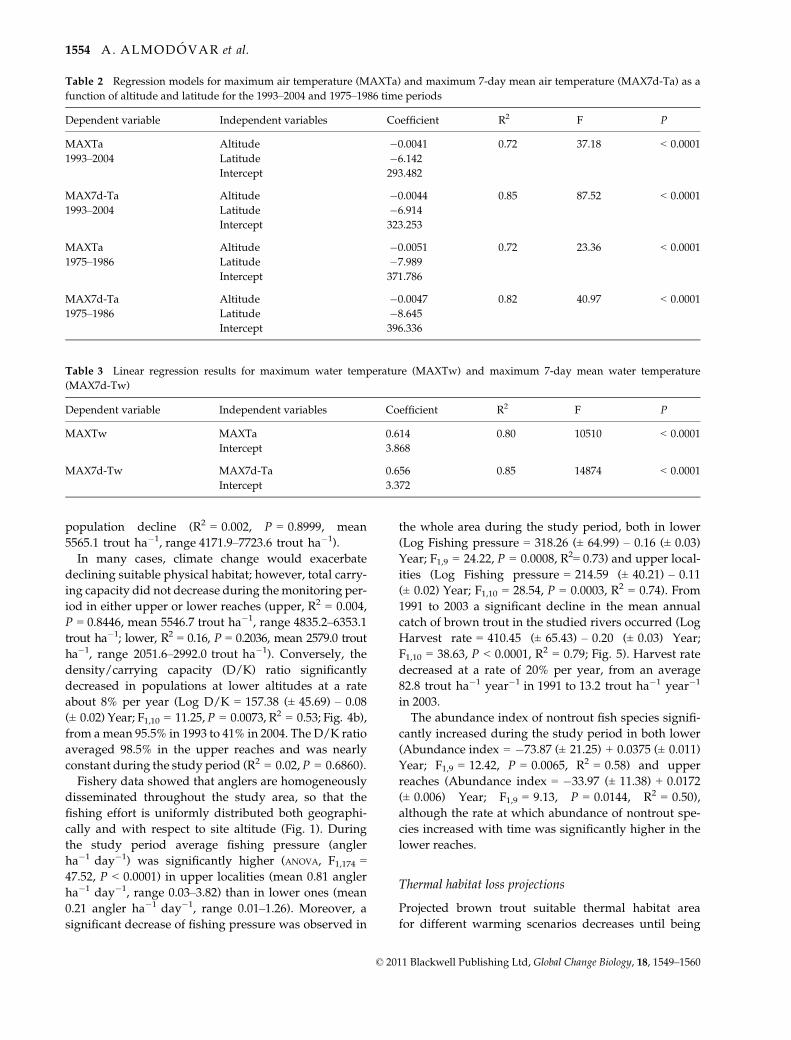
Table 2 Regression models for maximum air temperature (MAXTa) and maximum 7-day mean air temperature (MAX7d-Ta) as a
function of altitude and latitude for the 1993–2004 and 1975–1986 time periods
Dependent variable Independent variables Coefficient R2 F P
MAXTa Altitude �0.0041 0.72 37.18 < 0.0001
1993–2004 Latitude �6.142
Intercept 293.482
MAX7d-Ta Altitude �0.0044 0.85 87.52 < 0.0001
1993–2004 Latitude �6.914
Intercept 323.253
MAXTa Altitude �0.0051 0.72 23.36 < 0.0001
1975–1986 Latitude �7.989
Intercept 371.786
MAX7d-Ta Altitude �0.0047 0.82 40.97 < 0.0001
1975–1986 Latitude �8.645
Intercept 396.336
Table 3 Linear regression results for maximum water temperature (MAXTw) and maximum 7-day mean water temperature
(MAX7d-Tw)
Dependent variable Independent variables Coefficient R2 F P
MAXTw MAXTa 0.614 0.80 10510 < 0.0001
Intercept 3.868
MAX7d-Tw MAX7d-Ta 0.656 0.85 14874 < 0.0001
Intercept 3.372
© 2011 Blackwell Publishing Ltd, Global Change Biology, 18, 1549–1560
1554 A. ALMODOVAR et al.
almost inexistent at air temperature increases above
3 °C (Figs 6 and 7). All study sites will be located in
areas of unsuitable thermal habitat when air tempera-
ture is warming above 1.5 °C. According to regional
projections for the SRES scenario B2, this will occur
before the year 2040. By 2040, more than half of the
present area of suitable thermal habitat will have been
lost under the SRES scenario B2. The proportion of
suitable thermal habitat will decrease down to 3.5% of
total area by the year 2100. Under warming projec-
tions in the study area for a higher-emissions-scenario
(A2), no suitable thermal habitat will exist by 2085.
According to the model’s predictions, at maximum air
temperature increases higher than 4.5 °C (by year
2085 under the SRES scenario A2), all the salmonid
waters within the study area will become warm water
fish courses (Figs 6 and 7). By the year 2040 and
under the SRES scenario B2, almost half of the present
area of the salmonid waters will be more suitable for
warm water fish.
Discussion
We observed an ongoing population decline in brown
trout at the southern periphery of its distribution range.
This decrease may be explained by a loss of thermal
habitat induced by the gradual increase in water tem-
perature in lower altitudes dating from the 1980s. Simi-
lar to our findings, overall results on salmonids
certainly indicate that global warming is especially crit-
ical at the southern edge of the species’ ranges, causing
a gradual decline in populations primarily due to a
generalized loss of suitable thermal habitat (e.g. Kele-
her & Rahel, 1996; Flebbe et al., 2006; Mather et al.,
2008; Winfield et al., 2010; Horreo et al., 2011). In Eur-
ope, Buisson et al. (2008), Jonsson & Jonsson (2009) and
Lassalle & Rochard (2009) suggested that expected cli-
mate change will shift the thermal habitat of Atlantic
salmon Salmo salar and brown trout northwards, with
decreased production and population extinction at the
southern part of their distribution areas. This study has
Fig. 3 Map depicting brown trout suitable (MAX7d-Tw � 19.4 °C, green area) and unsuitable (MAX7d-Tw > 19.4 °C, red area) ther-
mal habitat based on average climate conditions during the 1993–2004 time period. Orange area represents unsuitable thermal habitat
based on average climate conditions during the 1975–1986 time period.
© 2011 Blackwell Publishing Ltd, Global Change Biology, 18, 1549–1560
EFFECTS OF CLIMATE CHANGE ON TROUT SURVIVAL 1555

provided empirical evidence for this prediction in the
southern limits of brown trout distribution, thus lend-
ing support to previous studies on the species.
The abrupt shift in air temperature observed in 1986–87 in the study area followed by a levelling off until the
present probably caused a stream warming which may
have led to an effective loss in potential thermal habitat
for brown trout below an altitude of 600 m. This excep-
tional warming in the 1980s, which peaked near 1990,
was global (Myneni et al., 1997), and its effects were
observed both in aquatic (Gerten & Adrian, 2000; Hari
et al., 2006) and terrestrial ecosystems (Lenoir et al.,
2008). Therefore current climate change may be render-
ing unsuitable 12% of suitable thermal habitat each dec-
ade within the study area, resulting in an overall
population decrease in lower altitudes of around 6%
per year. This trend may not be attributed to physical
habitat modification or angler pressure, as carrying
capacity remained stable during the study period and
the populations were not overexploited. Average
annual angler exploitation was around 20% in both
upper and lower reaches and fishing pressure actually
decreased significantly downstream.
Brown trout catches from Western European rivers
have been declining sharply since the 1990s, presum-
ably linked to an increase in Northern Hemisphere air
temperatures (EIFAC, 2002). Our study showed that
brown trout catches markedly decreased 20% per year
from 1991 to 2003. Furthermore, Clews et al. (2010)
observed a 67% reduction of brown trout populations
in the Wye River basin in Wales between 1985 and
2004, with climatic factors being the most plausible
explanation for the observed trend. Hari et al. (2006)
similarly found an upward shift in thermal habitat of
stream-dwelling brown trout in Alpine rivers, due to a
general warming which probably caused the decline of
66% of brown trout catches in Switzerland between
1978 and 2001.
The general technique mostly used to forecast
changes in distributions of salmonids to warming sce-
narios is the ‘climate envelope model’ (CEM), defined
as the ecological conditions a species needs for survival
based on its physiological tolerances (Thuiller, 2004;
Araujo & New, 2007). As climate change modifies the
‘envelope’, the species distribution shifts accordingly
(e.g. Scott & Poynter, 1991; Rahel et al., 1996; Jager et al.,
1999; Flebbe et al., 2006; Preston, 2006). Some authors
have suggested that there are sources of uncertainty in
CEM models which need consideration (Thuiller, 2004;
Araujo et al., 2005; Pearson et al., 2006). Firstly, the
models rely on the accuracy of climatic models and
climate change scenarios, which are subjected to a high
Fig. 4 (a) Mean annual density (trout ha�1; squares) and carry-
ing capacity (trout ha�1; triangles) of brown trout in upper
(white) and lower (black) localities within the study area. (b)
Mean ratio between density and estimated carrying capacity
(D/K,%; circles) in upper and lower localities. Significant linear
trends with 95% confidence limits are shown.
Fig. 5 Long-term (1991–2003) change in brown trout harvest
rate (black circles) and fishing pressure (open squares) in the
study area. Significant linear trends with 95% confidence limits
are shown.
© 2011 Blackwell Publishing Ltd, Global Change Biology, 18, 1549–1560
1556 A. ALMODOVAR et al.

level of uncertainty. Secondly, the models do not con-
sider biotic interactions, such as competition, predation
or parasitism, all of which may change the patterns of
species persistence (Berg et al., 2010). Notwithstanding
possible uncertainties, our findings and previous work
on salmonids are a useful approach to illustrate the
potential impact of climate change on species distribu-
tion. Specifically, the CEM method is best suited to
predict changes in the distribution of salmonids with
limited ranges, dispersal capabilities and narrow physi-
ological tolerances. For example, Kennedy et al. (2009)
demonstrated that under a scenario where atmospheric
CO2 reaches a concentration of about 710 ppm by the
end of the 21st century, regional climate warming may
cause a shift in the altitudinal distribution of endan-
gered Gila trout Oncorhynchus gilae, resulting in a 70%
Fig. 6 Map of projected brown trout suitable (MAX7d-Tw � 19.4 °C, green area) thermal habitat under maximum 7-day mean air
temperature increases of 0.5, 1.0, 1.5, 2.0, 2.5 and 3 °C.
© 2011 Blackwell Publishing Ltd, Global Change Biology, 18, 1549–1560
EFFECTS OF CLIMATE CHANGE ON TROUT SURVIVAL 1557

loss in suitable summer habitat. Likewise, in the
Columbia River basin, Rieman et al. (2007) found that
populations of threatened bull trout Salvelinus confluen-
tus may lose 18–92% of thermally suitable habitat over
the next 50 years as a result of a projected warming of 1
–5 °C. The CEM approach used in the present study
showed that if recent trends continue in the future, in
the regional and more ecologically friendly B2 SRES
scenario brown trout may lose half of their current hab-
itat within the study area by 2040 and become almost
extinct in the area by 2100.
The upstream movement of the thermal habitat of
brown trout may have caused a significant increase in
the relative abundance of nontrout fish species, at a
significantly higher rate in the lower reaches of the
salmonid waters. Less common species such as Pyre-
nean gudgeon Gobio lozanoi, Ebro nase Parachondros-
toma miegii, Pyrenean minnow Phoxinus bigerri,
Pyrenean stone loach Barbatula quignardi, Ebro barbel
Barbus graellsii and Iberian red fin barbel Barbus haasi,
which were limited in their altitudinal distribution by
temperature, are moving upwards. Furthermore, tem-
perature increases in lower habitats may allow alien
species, which are broadly established in downstream
areas, to invade upstream localities as observed else-
where (e.g. Rieman et al., 2007; Rahel & Olden, 2008).
In a similar way, Matulla et al. (2007) assessed the
impact of an IS92a emission scenario on the fish fauna
in an Alpine river, concluding that salmonid species
(brown trout and grayling Thymallus thymallus) are
becoming restricted to increasing higher elevations
due to a loss of thermal suitable habitat, while the
cyprinid zone is elongated.
Predicted water temperature increases will certainly
influence the physiological characteristics of brown
trout, such as rates of development and growth, and
associated life-history traits. There is no empirical evi-
dence of this species adapting to increasing tempera-
ture, even in geothermal rivers (Elliott & Elliott, 2010).
Furthermore, laboratory measures of thermal tolerance
to high temperatures are usually quantified without
other stressors which nearly always occur in the field
(e.g. toxins, diseases, lower food availability, higher
predation) that could decrease the extreme tempera-
tures fish can tolerate (Hari et al., 2006; Mather et al.,
2008). Although salmonids have varied life histories
and some plasticity in habitat use that confer resilience
to changing environments (Isaak et al., 2010), the capac-
ity for adaptation or migration in response to a chang-
ing climate is limited within our study area. Stream-
dwelling populations face more severe environmental
restrictions compared with their migratory relatives.
Our study populations live in landlocked linear aquatic
habitats where upward movement is impeded by dams
which severely limit their ability to seek refuge
upstream from adverse extreme temperatures
(Almodovar & Nicola, 1999). Hence, to improve the
resistance and resiliency of brown trout in light of cli-
mate change, mitigation and restoration measures
should focus on creating or facilitating access to ther-
mal refuges.
To sum up, our findings illustrate how current and
future climate change threatens some of the most
healthy native brown trout populations in Southern
Europe, which have considerable conservation value
given their peripheral location at the southern part of
the species’ range. Because of their isolation, marginal
populations of brown trout contain a large proportion
of the species’ genetic, life history and ecological diver-
sity (e.g. Suarez et al., 2001; Nicola & Almodovar, 2004;
Almodovar et al., 2006b), thus contributing to specia-
tion and evolutionary divergence. Reduction in popula-
tion size and loss of interpopulation connectivity as a
Fig. 7 Projected percent of brown trout suitable thermal habitat
(thick line) and thermal habitat loss (thin line) in the study area
caused by 0.1–3.5 °C increases in maximum 7-day mean air
temperature (upper figure); and projected percent of total (thick
line) and lost (thin line) area of salmonid waters in the study
area caused by 0.1–4.5 °C increases in maximum air tempera-
ture (lower figure). Dashed lines refer to regional projected
increases in air temperature from the present to years 2040, 2070
and 2100 for the SRES scenario B2.
© 2011 Blackwell Publishing Ltd, Global Change Biology, 18, 1549–1560
1558 A. ALMODOVAR et al.

consequence of potential climate change are expected
to increase the risk of local extinction, due to increasing
vulnerability to demographic and environmental sto-
chastic events. Therefore, the observed and projected
reduction in suitable thermal habitat in Mediterranean-
type streams may have relevant consequences for the
ecological and evolutionary species success.
Acknowledgements
This study was supported and funded by the project ‘Study ofbrown trout populations of Navarre’ in the framework of theagreement between Complutense University of Madrid and Na-varre Government.
References
Almodovar A, Nicola GG (1999) Effects of a small hydropower station upon brown
trout Salmo trutta L. in the River Hoz Seca (Tagus Basin, Spain) one year after regu-
lation. Regulated Rivers: Research & Management, 15, 477–484.
Almodovar A, Nicola GG, Suarez J (2002) Effects of fishery management on popula-
tions of brown trout Salmo trutta in central Spain. In: Conservation of Freshwater
Fishes: Options for the Future (eds Collares-Pereira MJ, Cowx IG, Coelho MM), pp.
337–345. Fishing News Books, Blackwell Science, Oxford.
Almodovar A, Nicola GG, Elvira B, Garcıa-Marın JL (2006a) Introgression variability
among Iberian brown trout Evolutionary Significant Units: the influence of local
management and environmental features. Freshwater Biology, 51, 1175–1187.
Almodovar A, Nicola GG, Elvira B (2006b) Spatial variation in brown trout produc-
tion: the role of environmental factors. Transactions of the American Fisheries Society,
135, 1348–1360.
Araujo MB, New M (2007) Ensemble forecasting of species distributions. Trends in
Ecology and Evolution, 22, 42–47.
Araujo MB, Pearson RG, Thuiller W, Erhard M (2005) Validation of species–climate
impact models under climate change. Global Change Biology, 11, 1504–1513.
Ayllon D, Almodovar A, Nicola GG, Elvira B (2010a) Modelling brown trout spatial
requirements through physical habitat simulations. River Research and Applications,
26, 1090–1102.
Ayllon D, Almodovar A, Nicola GG, Elvira B (2010b) Ontogenetic and spatial varia-
tions in brown trout habitat selection. Ecology of Freshwater Fish, 19, 420–432.
Ayllon D, Almodovar A, Nicola GG, Elvira B (2011) The influence of variability
around habitat suitability criteria on PHABSIM habitat index results. River
Research and Applications, in press, doi: 10.1002/rra.1496.
Berg MP, Kiers ET, Driessen G et al. (2010) Adapt or disperse: understanding species
persistence in a changing world. Global Change Biology, 16, 587–598.
Box GEP, Jenkins GM (1976) Time series analysis: forecasting and control. Holden-Day,
San Francisco.
Brunet M, Casado MJ, de Castro M et al. (2009) Regional climate change scenarios for
Spain (in Spanish). Spanish Meteorological Agency. Available at: http://www.
aemet.es/es/elclima/cambio_climat/escenarios (accessed 30 November 2011).
Buisson L, Thuiller W, Lek S, Lim P, Grenouillet G (2008) Climate change hastens the
turnover of stream fish assemblages. Global Change Biology, 14, 2232–2248.
Burnham KP, Anderson DR (2002) Model Selection and Multimodel Inference: A Practical
Information – Theoretic Approach (2nd edn). Springer-Verlag, New York.
Clews E, Durance I, Vaughan IP, Ormerod SJ (2010) Juvenile salmonid populations in
a temperate river system track synoptic trends in climate. Global Change Biology,
16, 3271–3283.
Condron A, DeConto R, Bradley RS, Juanes F (2005) Multidecadal North Atlantic cli-
mate variability and its effect on North American salmon abundance. Geophysical
Research Letter, 32, L23703, doi: 10.1029/2005GL024239.
Council Directive (2006) Directive 2006/44/EC of the European parliament and of
the council of 6 September 2006 on the quality of fresh waters needing protection
or improvement in order to support fish life (codified version). Official Journal L,
264, 20–31.
EIFAC (2002) Analysis of European catch and aquaculture statistics, 1990–2000. In:
European Inland Fisheries Advisory Commission, 22th session. EIFAC/XXII/2002/
Inf.4, FAO, Windermere, UK. Available at: http://www.fao.org/docrep/meet-
ing/004/y3759e/y3759e00.htm (accessed 30 November 2011).
Elliott JM, Elliott JA (2010) Temperature requirements of Atlantic salmon Salmo salar,
brown trout Salmo trutta and Arctic charr Salvelinus alpinus: predicting the effects
of climate change. Journal of Fish Biology, 77, 1793–1817.
Elliott JM, Hurley MA, Fryer RJ (1995) A new, improved growth model for brown
trout, Salmo trutta. Functional Ecology, 9, 290–298.
Flebbe PA, Roghair LD, Bruggink JL (2006) Spatial modeling to project southern
Appalachian trout distribution in a warmer climate. Transactions of the American
Fisheries Society, 135, 1371–1382.
Gerten D, Adrian R (2000) Climate-driven changes in spring plankton dynamics and
the sensitivity of shallow polymictic lakes to the North Atlantic Oscillation. Lim-
nology and Oceanography, 45, 1058–1066.
Giorgi F, Lionello P (2008) Climate change projections for the Mediterranean region.
Global and Planetary Change, 63, 90–104.
Hampe A., Petit RJ (2005) Conserving biodiversity under climate change: the rear
guard matters. Ecology Letters, 8, 461–467.
Hari RE, Livingstone DM, Siber R, Burkhardt-Holm P, Guttinger H (2006) Conse-
quences of climatic change for water temperature and brown trout populations in
Alpine rivers and streams. Global Change Biology, 12, 10–26.
Horreo JL, Machado-Schiaffino G, Ayllon F, Griffiths AM, Bright D, Stevens JR, Gar-
cıa-Vazquez E (2011) Impact of climate change and human-mediated introgression
on southern European Atlantic salmon populations. Global Change Biology, 17, 1778–
1787.
Isaak DJ, Luce CH, Rieman BE et al. (2010) Effects of climate change and wildfire on
stream temperatures and salmonid thermal habitat in a mountain river network.
Ecological Applications, 20, 1350–1371.
Jager HI, Van Winkle W, Holcomb BD (1999) Would hydrologic climate changes in
Sierra Nevada streams influence trout persistence? Transactions of the American
Fisheries Society, 128, 222–240.
Jonsson B, Jonsson N (2004) Factors affecting marine production of Atlantic salmon
(Salmo salar). Canadian Journal of Fisheries and Aquatic Sciences, 61, 2369–2383.
Jonsson B, Jonsson N (2009) A review of the likely effects of climate change on anad-
romous Atlantic salmon Salmo salar and brown trout Salmo trutta, with particular
reference to water temperature and flow. Journal of Fish Biology, 75, 2381–2447.
Jonsson B, Jonsson N (2011) Ecology of Atlantic Salmon and Brown Trout. Habitat as a
template for life histories. Fish & Fisheries Series 33. Springer, Dordrecht.
Keleher CJ, Rahel FJ (1996) Thermal limits to salmonid distributions in the Rocky
Mountain region and potential habitat loss due to global warming: a geographic
information system (GIS) approach. Transactions of the American Fisheries Society,
125, 1–13.
Kennedy TL, Gutzler DS, Leung RL (2009) Predicting future threats to the long-term
survival of Gila trout using a high-resolution simulation of climate change.
Climatic Change, 94, 503–515.
Lassalle G, Rochard E (2009) Impact of twenty-first century climate change on diadro-
mous fish spread over Europe, North Africa and the Middle East. Global Change
Biology, 15, 1072–1089.
Lenoir J, Gegout JC, Marquet PA, de Ruffray P, Brisse H (2008) A significant upward
shift in plant species optimum elevation during the 20th century. Science, 320, 1768–
1771.
Machordom A, Suarez J, Almodovar A, Bautista JM (2000) Mitochondrial haplotype
variation and phylogeography of Iberian brown trout populations. Molecular Ecol-
ogy, 9, 1325–1338.
Mather ME, Parrish DL, Campbell CA, McMenemy JR, Smith JM (2008) Summer tem-
perature variation and implications for juvenile Atlantic salmon. Hydrobiologia,
603, 183–196.
Matulla C, Schmutz S, Melcher A, Gerersdorfer T, Haas P (2007) Assessing the impact
of a downscaled climate change simulation on the fish fauna in an Inner-Alpine
River. International Journal of Biometeorology, 52, 127–137.
McDowall D, McCleary R, Meidinger EE, Hay RA (1980) Interrupted time series analy-
sis. Sage Publications, Thousand Oaks.
Milhous RT, Updike MA, Schneider DM (1989) Physical Habitat Simulation System Ref-
erence Manual-Version II. Instream Flow Information Paper 26. United States Fish and
Wildlife Service, Fort Collins, CO. Available at: http://www.fort.usgs.gov/Products/
Publications/3912/3912.pdf (accessed 30 November 2011).
Milner NJ, Elliott JM, Armstrong JD, Gardiner R, Welton JS, Ladle M (2003) The
natural control of salmon and trout populations in streams. Fisheries Research, 62,
111–125.
Mohseni O, Stefan HG, Erickson TR (1998) A nonlinear regression model for weekly
stream temperatures. Water Resources Research, 34, 2685–2692.
Morrill JC, Bales RC, Conklin MH (2005) Estimating stream temperature from air
temperature: implications for future water quality. Journal of Environmental Engi-
neering, 131, 139–146.
© 2011 Blackwell Publishing Ltd, Global Change Biology, 18, 1549–1560
EFFECTS OF CLIMATE CHANGE ON TROUT SURVIVAL 1559

Myneni RB, Keeling CD, Tucker CJ, Asrar G, Nemani RR (1997) Increased
plant growth in the northern high latitudes from 1981 to 1991. Nature, 386, 698–
702.
Nakicenovic N, Alcamo J, Davis G et al. (2000) Emissions Scenarios. A Special Report of
Working Group III of the IPCC. Cambridge University Press, Cambridge.
Nicola GG, Almodovar A (2004) Growth pattern of stream-dwelling brown trout
Salmo trutta under contrasting thermal conditions. Transactions of the American
Fisheries Society, 133, 66–78.
Nicola GG, Almodovar A, Jonsson B, Elvira B (2008) Recruitment variability of resi-
dent brown trout in peripheral populations from southern Europe. Freshwater Biol-
ogy, 53, 2364–2374.
Nicola GG, Almodovar A, Elvira B (2009) Influence of hydrologic attributes on
brown trout recruitment in low-latitude range margins. Oecologia, 160, 515–
524.
Parra I, Almodovar A, Ayllon D, Nicola GG, Elvira B (2011) Ontogenetic variation in
density-dependent growth of brown trout through habitat competition. Freshwater
Biology, 56, 530–540.
Pearson RG, Thuiller W, Araujo MB et al. (2006) Model-based uncertainty in species
range prediction. Journal of Biogeography, 33, 1704–1711.
Preston BL (2006) Risk-based reanalysis of the effects of climate change on US cold-
water habitat. Climatic Change, 76, 91–119.
Rahel FJ, Olden JD (2008) Assessing the effects of climate change on aquatic invasive
species. Conservation Biology, 22, 521–533.
Rahel FJ, Keleher CJ, Anderson JL (1996) Potential habitat loss and population frag-
mentation for cold water fish in the North Platte River drainage of the Rocky
Mountains: response to climate warming. Limnology and Oceanography, 41, 116–
1123.
Rieman BE, Isaak DJ, Adams S, Horan D, Nagel D, Luce C, Myers D (2007) Antici-
pated climate warming effects on bull trout habitats and populations across the
Interior Columbia River Basin. Transactions of the American Fisheries Society, 136,
1552–1565.
Root TL, Price JT, Hall KR, Schneider SH, Rosenzweig C, Pounds JA (2003) Finger-
prints of global warming on wild animals and plants. Nature, 421, 57–60.
Scott D, Poynter M (1991) Upper limits for trout in New Zealand and climate change.
Hydrobiology, 222, 147–151.
Seber GAF (1982) The Estimation of Animal Abundance and Related Parameters. Charles
Griffin Publications, London.
Stefan HG, Preud’homme EB (1993) Stream temperature estimation from air tempera-
ture. Water Resources Bulletin, 29, 27–45.
Suarez J, Bautista JM, Almodovar A, Machordom A (2001) Evolution of the mitochon-
drial control region in Palearctic brown trout (Salmo trutta) populations: the bio-
geographical role of the Iberian Peninsula. Heredity, 87, 198–206.
Thomas CD, Cameron A, Green RE et al. (2004) Extinction risk from climate change.
Nature, 427, 145–148.
Thuiller W (2004) Patterns and uncertainties of species’ range shifts under climate
change. Global Change Biology, 10, 2020–2027.
Todd CD, Hughes SL, Marshall T, MacLean JC, Lonergan ME, Biow EM (2008) Detri-
mental effects of recent ocean surface warming on growth condition of Atlantic
salmon. Global Change Biology, 14, 1–13.
Waddle TJ (ed) (2001) PHABSIM for Windows User’s Manual and Exercises. US
Geological Survey Open-File Report 2001-340. Fort Collins, Colorado. Available at:
http://www.fort.usgs.gov/Products/Publications/15000/15000.pdf (accessed 30
November 2011).
Winfield IJ, Hateley J, Fletcher JM, James JB, Bean CW, Clabburn P (2010) Population
trends of Arctic charr (Salvelinus alpinus) in the UK: assessing the evidence for a
widespread decline in response to climate change. Hydrobiologia, 650, 55–65.
Zippin C (1956) An evaluation of the removal method of estimating animal popula-
tions. Biometrics, 12, 163–189.
© 2011 Blackwell Publishing Ltd, Global Change Biology, 18, 1549–1560
1560 A. ALMODOVAR et al.