Embed Size (px)
DESCRIPTION
data visualization using legos
Citation preview
Little Pieces Cause
BIG PROBLEMS
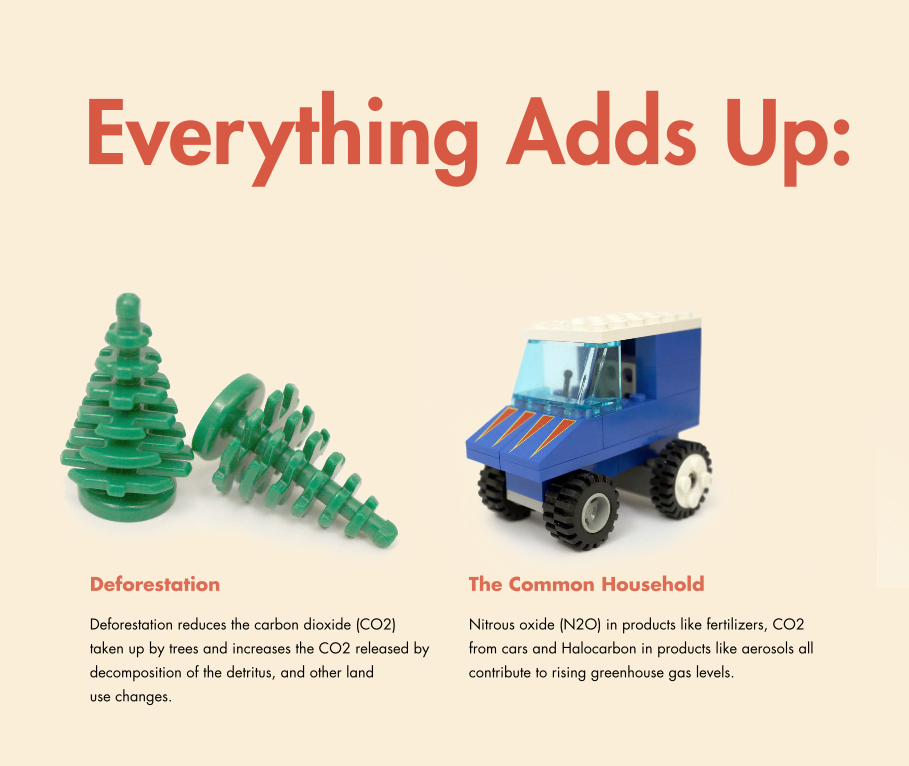
Deforestation
Deforestation reduces the carbon dioxide (CO2)
taken up by trees and increases the CO2 released by
decomposition of the detritus, and other land
use changes.
The Common Household
Nitrous oxide (N2O) in products like fertilizers, CO2
from cars and Halocarbon in products like aerosols all
contribute to rising greenhouse gas levels.
Everything Adds Up:
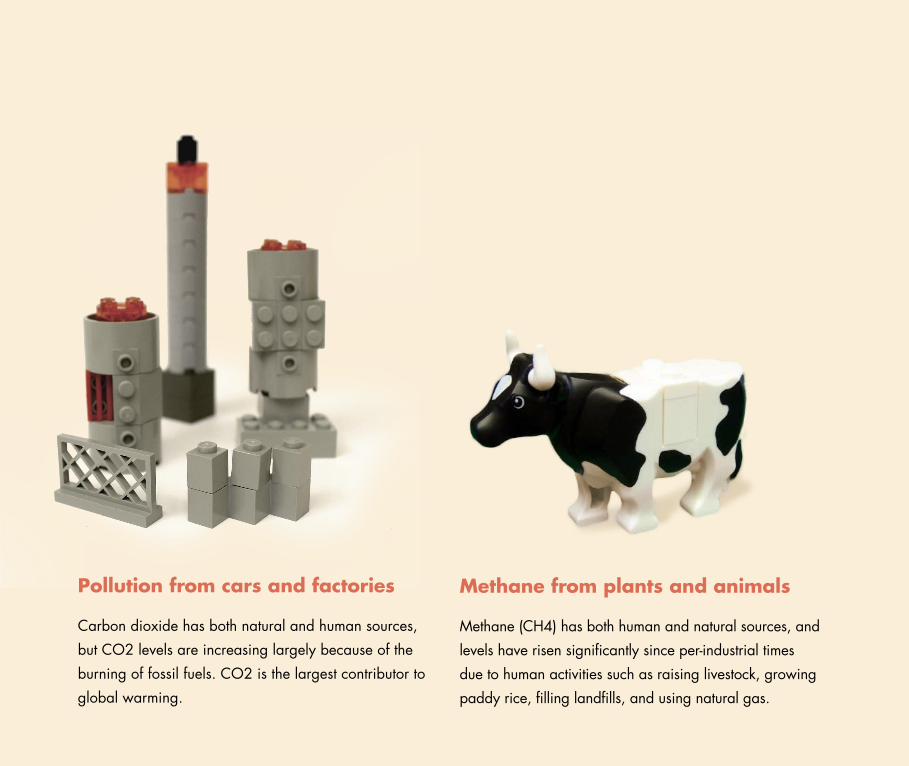
Pollution from cars and factories
Carbon dioxide has both natural and human sources,
but CO2 levels are increasing largely because of the
burning of fossil fuels. CO2 is the largest contributor to
global warming.
Methane from plants and animals
Methane (CH4) has both human and natural sources, and
levels have risen significantly since per-industrial times
due to human activities such as raising livestock, growing
paddy rice, filling landfills, and using natural gas.
Everything Adds Up:
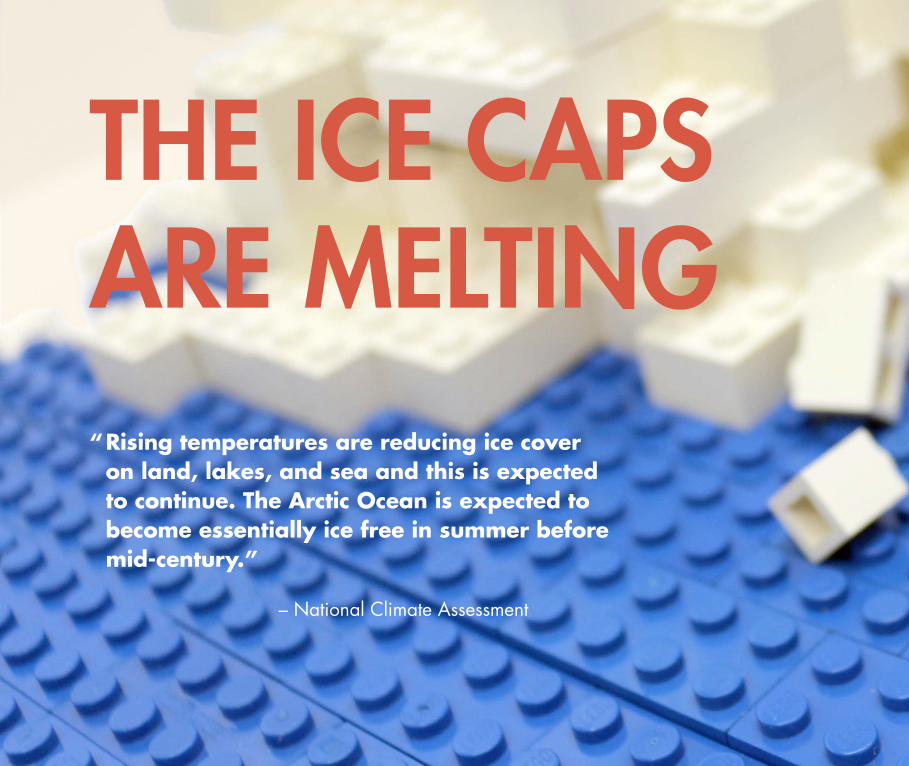
Rising temperatures are reducing ice cover on land, lakes, and sea and this is expected to continue. The Arctic Ocean is expected to become essentially ice free in summer before mid-century.”
THE ICE CAPS ARE MELTING
– National Climate Assessment
“
THE ICE CAPS ARE MELTING
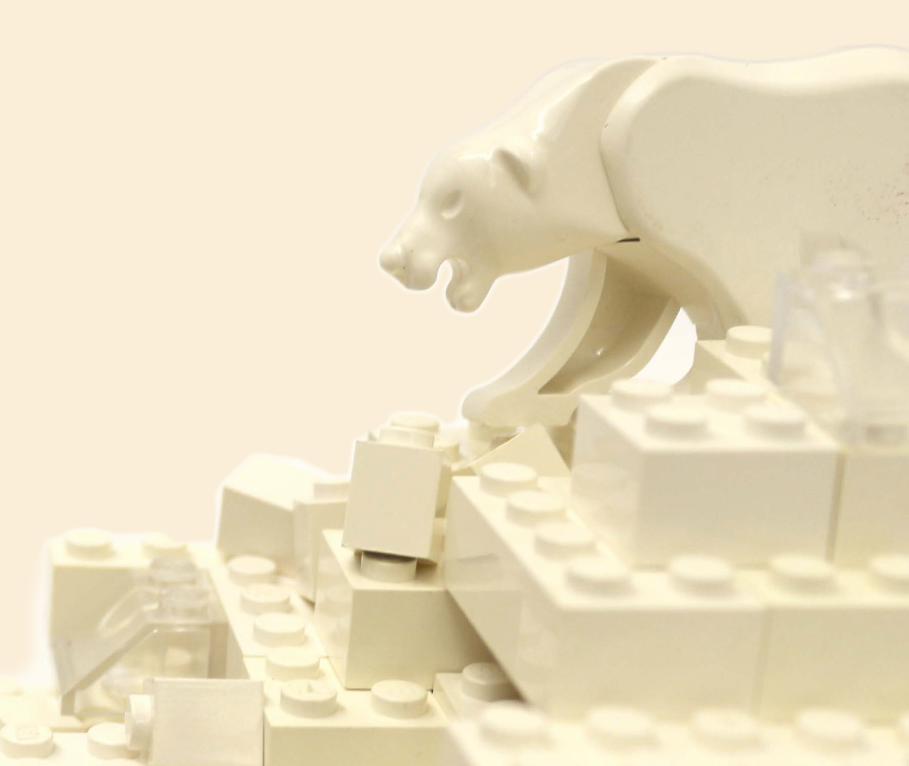
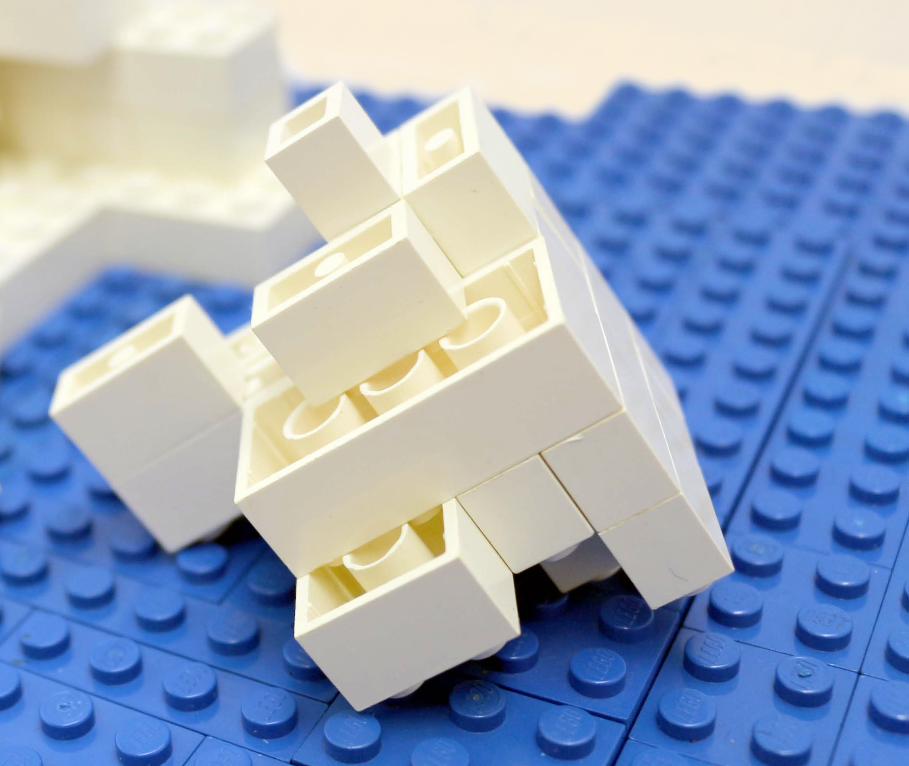
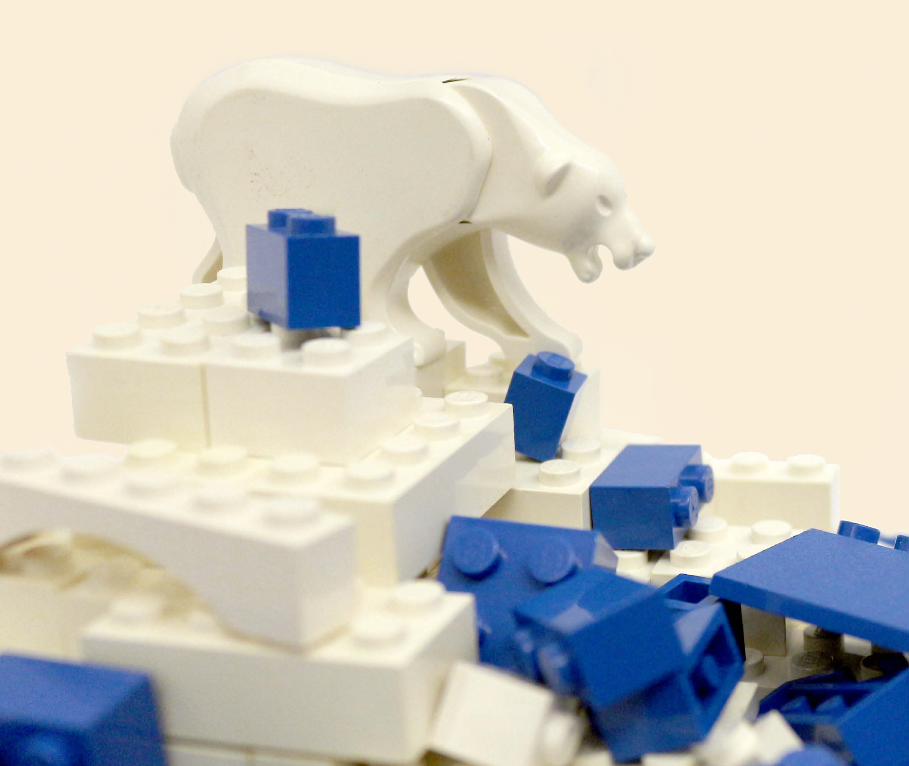
Ice mass is generally measured in gigatonnes (GT). Scientifically speaking, this means that 1 gigatonne is equal to 1 billion metric tonnes. To help visualize this enormous number, consider that 1 gigatonne equals roughly 2.2 billion polar bears:
On average, Greenland and the Antarctic loose 287 and 134 gigatonnes of ice land mass respectively.
How Much Are We Really Losing?
How Much Are We Really Losing?
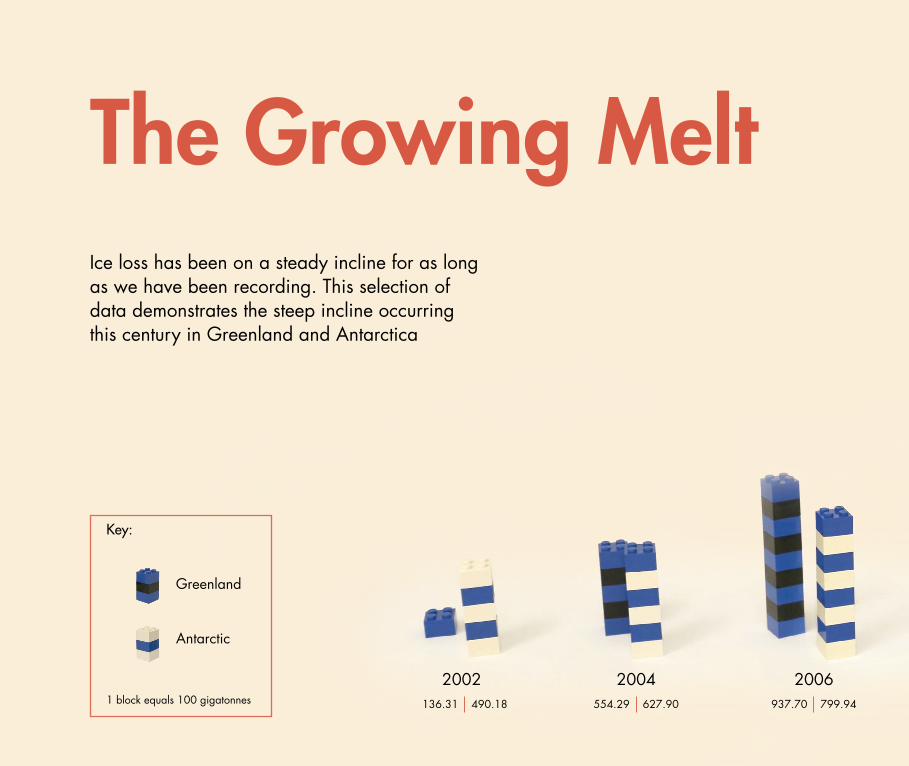
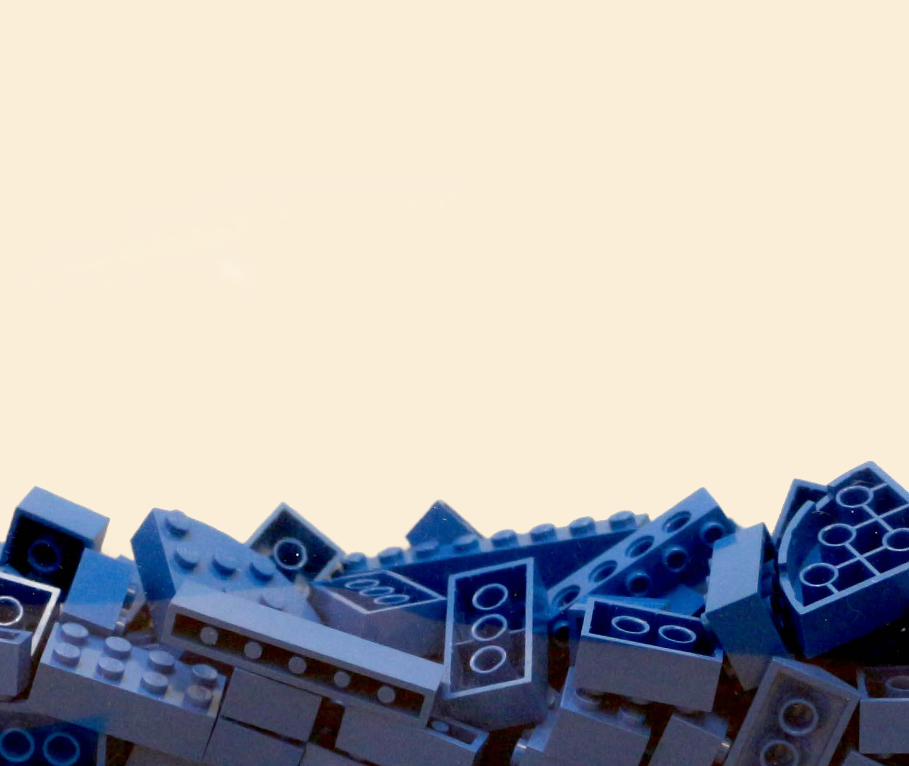
Key:
Greenland
Antarctic
1 block equals 100 gigatonnes
Ice loss has been on a steady incline for as long as we have been recording. This selection of data demonstrates the steep incline occurring this century in Greenland and Antarctica
2002136.31 490.18
2004554.29 627.90
2006937.70 799.94
The Growing Melt
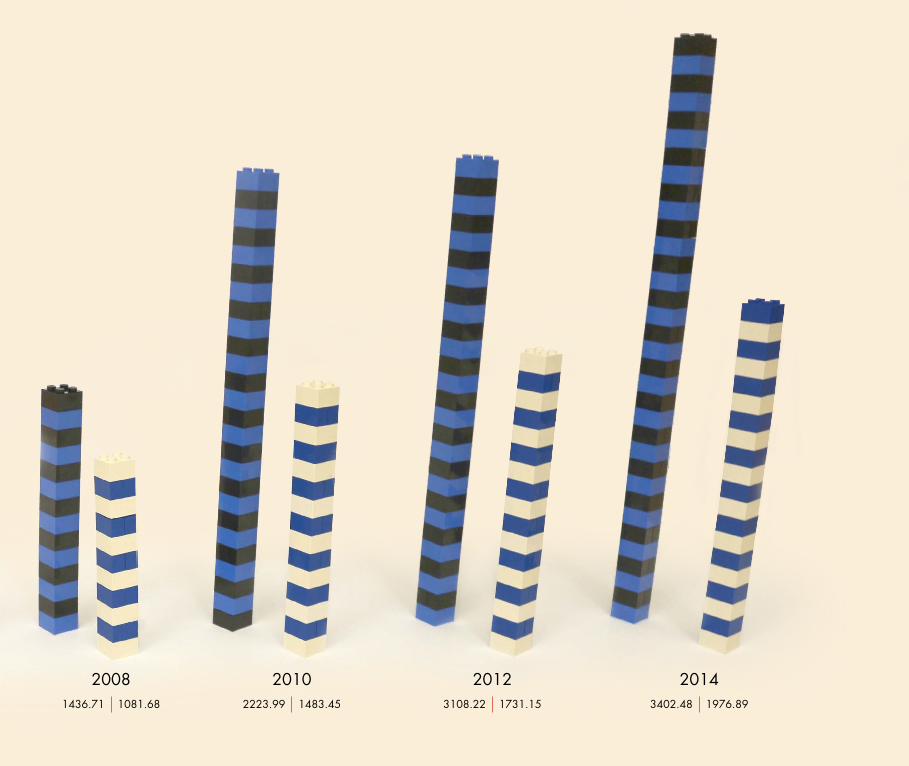
20081436.71 1081.68
20102223.99 1483.45
20123108.22 1731.15
20143402.48 1976.89
The Growing Melt
SMALL LAKES CAUSE HUGE MELTING
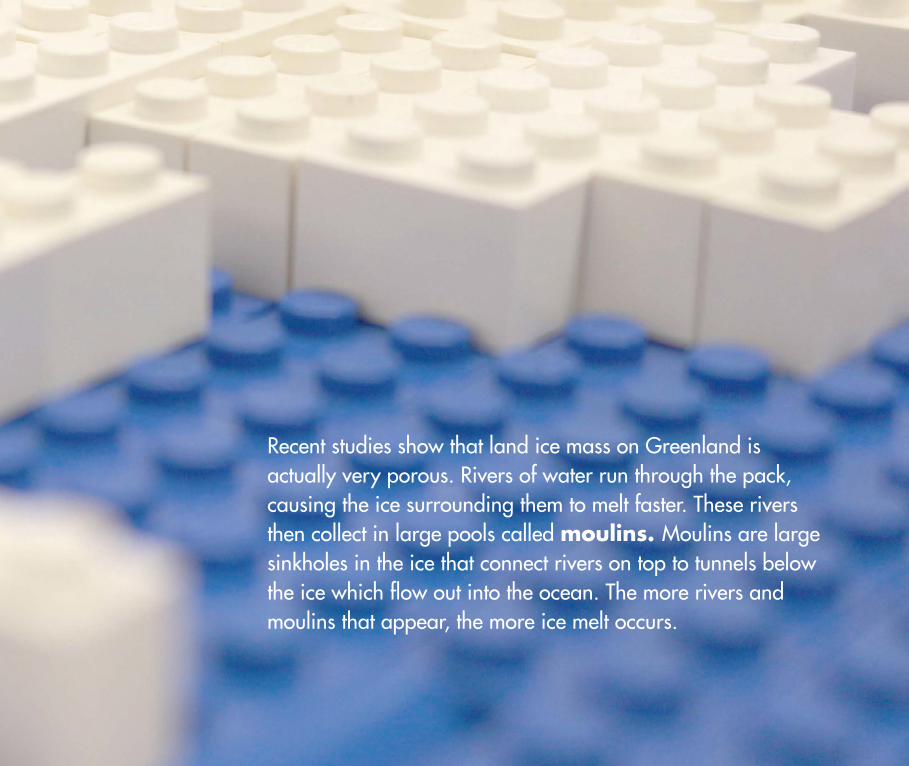
Recent studies show that land ice mass on Greenland is actually very porous. Rivers of water run through the pack, causing the ice surrounding them to melt faster. These rivers then collect in large pools called moulins. Moulins are large sinkholes in the ice that connect rivers on top to tunnels below the ice which flow out into the ocean. The more rivers and moulins that appear, the more ice melt occurs.
SMALL LAKES CAUSE HUGE MELTING
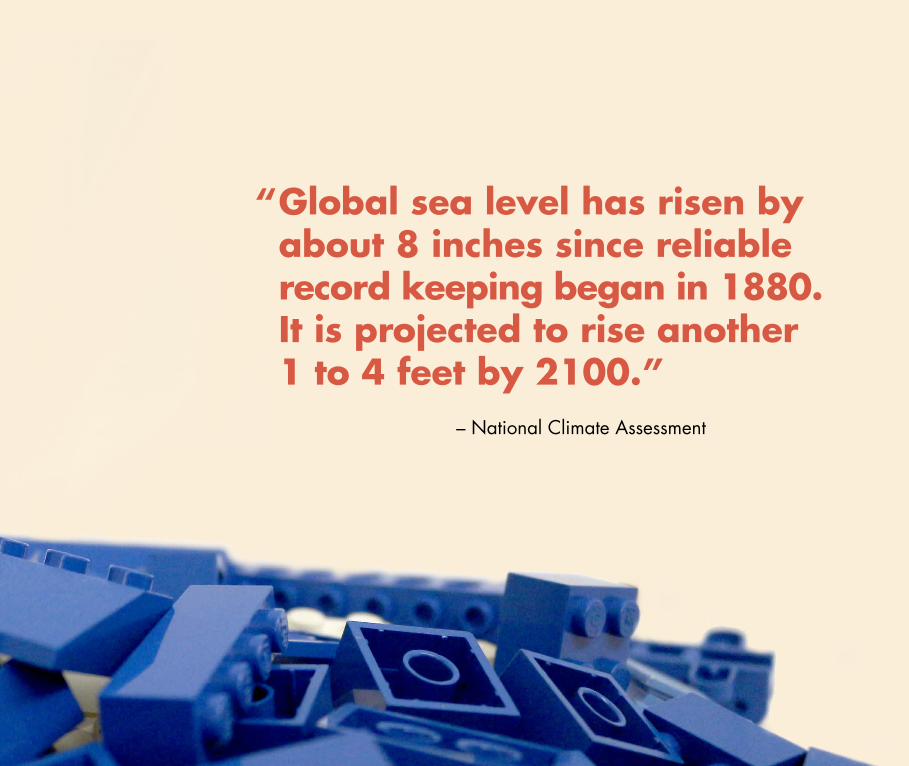
Global sea level has risen by about 8 inches since reliable record keeping began in 1880. It is projected to rise another 1 to 4 feet by 2100.”
– National Climate Assessment
“
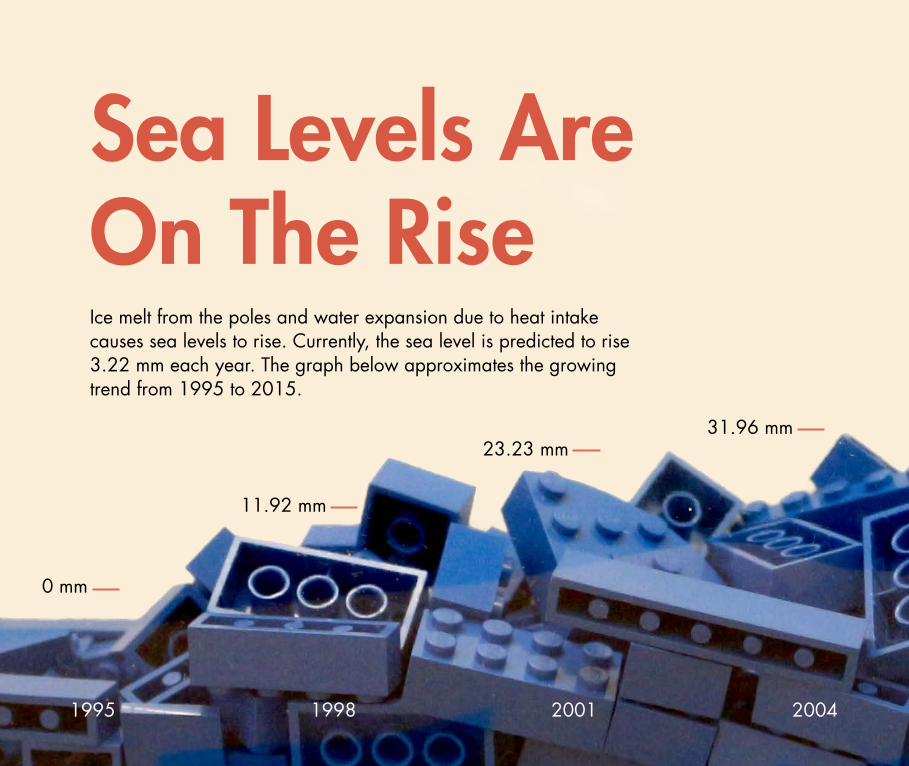
Ice melt from the poles and water expansion due to heat intake causes sea levels to rise. Currently, the sea level is predicted to rise 3.22 mm each year. The graph below approximates the growing trend from 1995 to 2015.
1995 1998 2001 2004
31.96 mm23.23 mm
11.92 mm
0 mm
Sea Levels Are On The Rise
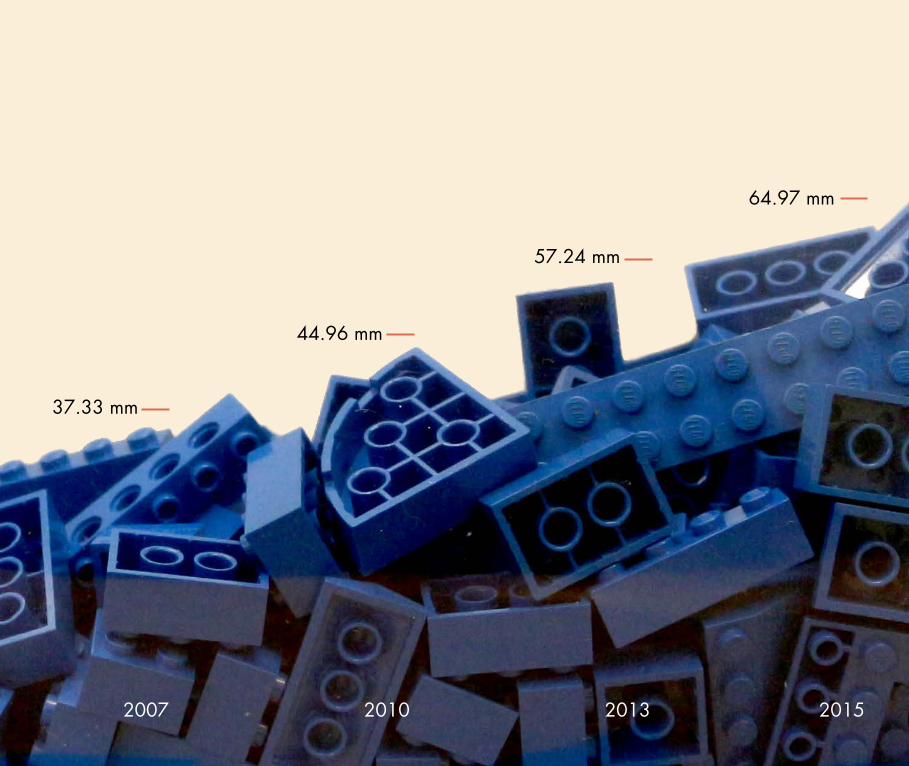
2007 2010 2013 2015
64.97 mm
57.24 mm
44.96 mm
37.33 mm
Sea Levels Are On The Rise

Take a stand, change the little things in your life. Together we can make big changes.
B. D. Beckley, N. P. Zelensky, S. A. Holmes, F. G. Lemoine, R. D. Ray, G. T. Mitchum, S. D. Desai & S. T. Brown, Assessment of the Jason-2 Extension to the TOPEX/Poseidon, Jason-1 Sea-Surface Height Time Series for Global Mean Sea Level Monitoring, Marine Geodesy, Vol 33, Suppl 1, 2010. DOI:10.1080/01490419.2010.491029
National Academies of Sciences, Engineering & Medicine. “Climate-Change-Basics.pdf.” Accessed November 3, 2015. http://dels.nas.edu/resources/static-assets/exec-office-other/climate-change-basics.pdf.
Coral Davenport, Josh Haner, Larry Buchanan, and Derek Watkins. “Greenland Is Melting Away - The New York Times.” Accessed November 3, 2015. http://www.nytimes.com/interactive/2015/10/27/world/greenland-is-melting-away.html?_r=1.
Parris, A., P. Bromirski, V. Burkett, D. Cayan, M. Culver, J. Hall, R. Horton, et al. “Global Sea Level Rise Scenarios for the United States National Climate Assessment. NOAA Tech Memo OAR CPO-1,” 2012.
Stroeve, J.C., V. Kattsov, A. Barrett, M. Serreze, T. Pavlova, M. Holland, and W. N. Meier. “Trends in Arctic Sea Ice Extent from CMIP5, CMIP3 and Observations.” Geophysical Research Letters 39 (2012): L16502. doi:10.1029/2012GL052676.
Tenenbaum, Laura. “Vital Signs: Sea Level.” Climate Change: Vital Signs of the Planet, October 21, 2015. http://climate.nasa.gov/vital-signs/sea-level.
Wiese, David. “Vital Signs: Land Ice.” Climate Change: Vital Signs of the Planet. Accessed November 3, 2015. http://climate.nasa.gov/vital-signs/land-ice.
Washington University in St. LouisSam Fox School of Art & Design
Bibliography
Book Design and photography by Lauren Blackburn