Embed Size (px)
Citation preview
Foreign Exchange Strategy Fixed Income Strategy Fixed Income Research Emerging Markets Strategy Contact Us Economics
Weekly commentary on economic and financial market developments
Global Views
Corporate Bond Research
Global Views is available on scotiabank.com, Bloomberg at SCOT and Reuters at SM1C
October 23, 2015
Economics
Fed To Focus On U.S. Risks, As International And Market Risks Subside 2-6
Derek Holt
Canadian Renovation Activity To Lead Residential Investment In 2016 7
Adrienne Warren
A Market Briefing On China’s Fifth Plenum 8
Frances Donald and Juan Manuel Herrera
Temporary Ways Of Getting Around The U.S. Debt Ceiling 9-10
Derek Holt, Mary Webb and Dov Zigler
The U.S. Federal Debt Ceiling Constraint 11
Mary Webb
Fixed Income Strategy
UK Waiting For Lift-Off 12
Alan Clarke
From Portugal To Spain, Moving To The Left? 13-14
Frédéric Prêtet
The ECB Almost Pre-Commit To A December Action! 15
Frédéric Prêtet
Key Data Preview A1-A2
Key Indicators A3-A5
Global Auctions Calendar A6-A7
Events Calendar A8
Global Central Bank Watch A9
Latest Economic Statistics A10-A11
Latest Financial Statistics A12
Global Forecast Update Report
Forecasts & Data
This Week’s Featured Chart
Please see the Global Forecast Update, September 30, 2015, for our latest economic, interest and exchange rate and commodity price forecasts and the Foreign Exchange Outlook, October 2015, for more detailed currency forecasts and commentary.
-1
0
1
2
3
4
5
6
11Q3 12Q3 13Q3 14Q3 15Q3
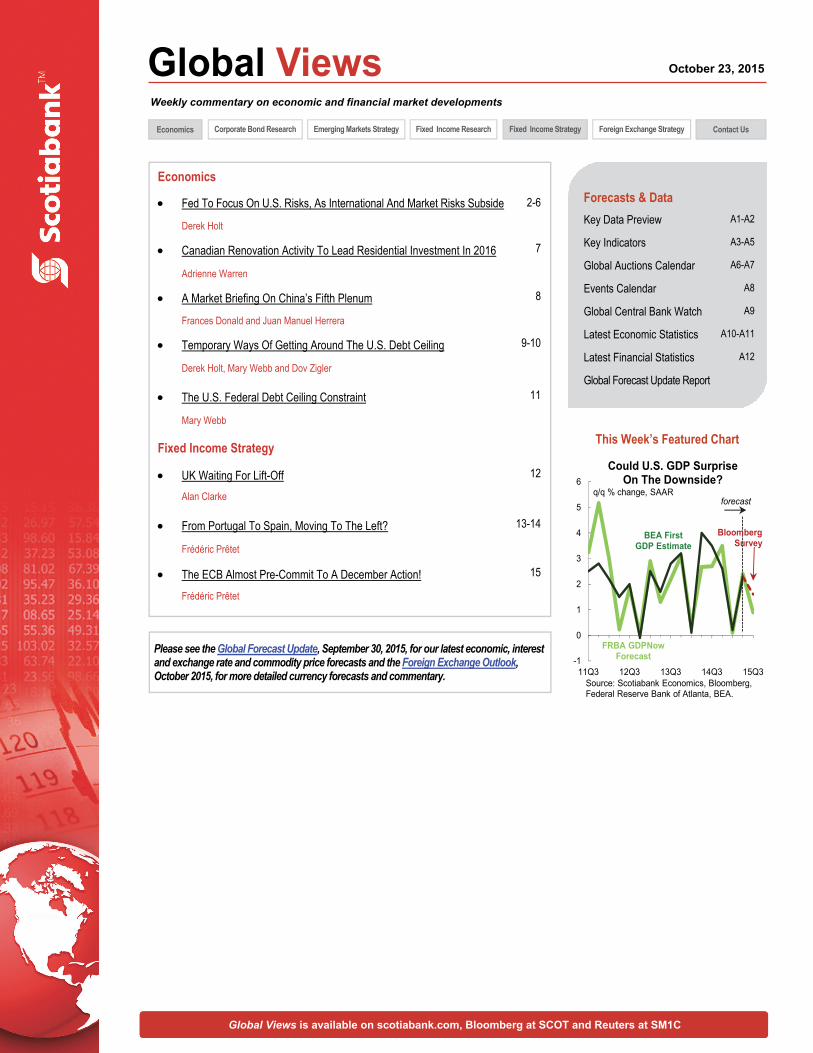
Could U.S. GDP Surprise On The Downside?
q/q % change, SAAR
Source: Scotiabank Economics, Bloomberg, Federal Reserve Bank of Atlanta, BEA.
FRBA GDPNow Forecast
BEA First GDP Estimate
forecast
Bloomberg Survey
Economics
Global Views
October 23, 2015
2
Fed To Focus On U.S. Risks, As International And Market Risks Subside
Please see our full indicator, central bank, auction and event calendars on pp. A3-A9.
United States — Debt Ceiling An Added Impediment To A Fed Hike
It’s pretty unlikely that the Federal Reserve will hike rates on Wednesday, but the statement-only affair sans forecasts will be closely watched for signs of whether the Federal Open Market Committee truly remains committed to a rate hike before year-end. Two factors may be more encouraging to the Fed. One is the improved market tone with the S&P500 having almost recovered all of its late-summer swoon. Two is foreign central bank stimulus including China’s cuts to interest rates and reserve requirements plus a strong ECB hint of more to come in December; such moves may be attempts in those markets to stabilize the international backdrop ahead of a Fed rate hike. That means by December unless the highly unusual step of inserting an unscheduled meeting is taken. Since the last meeting on September 17th, however, the domestic data flow for a data-dependent central bank has been unkind to the hawks. At 142,000 in September and 136,000 in August, growth in nonfarm payrolls has shifted into lower gear and toward the bottom end of monthly job gains experienced over about the past three years. There is a high bar for a hike by year-end that probably includes a pair of solid nonfarm payroll gains in October and November, further traction on inflation goals, a continued calming of financial market volatility notwithstanding the obvious correlation with the Fed debate, and all set against the backdrop of fairly widespread expectations for softer Q3 growth. Bloomberg’s consensus thinks the US economy grew by about 1.7% in Q3, with the Atlanta Fed’s ‘nowcast’ for Q3 growth at 0.9% (go here). The Q3 GDP print will arrive on Thursday — after the Fed, but the two-day FOMC meeting will have an advanced understanding of the print before it arrives. Nevertheless, 48 out of 74 economists in Bloomberg’s consensus expect the Fed to hike before year-end on slightly-better-than-even odds but traders are not convinced; fed funds futures are putting under 20% odds on a hike before year-end. Fed speak will also come from a pair of voting regional Fed Presidents — San Francisco’s John Williams and Atlanta’s Dennis Lockhart.
With the debt ceiling becoming more binding, one must view with skepticism Fed Chair Yellen’s assertion at the press conference following the September FOMC meeting that government shutdown risk played “absolutely no role” in delaying rate hikes. Like in 2013 during the taper debate, we think it is highly unlikely that the Federal Reserve would ever entertain the prospect of adding monetary policy instability on top of potential fiscal policy instability that could be highly disruptive to the US economy — even if a public official is expected to say otherwise by way of sending a signal to Congress that it’s ok to be dysfunctional because the Fed will extend its period of policy accommodation to compensate. Forget an October hike; December faces a high bar but not an impossibly high one.
Indeed the debt ceiling debate is already taking casualties including the decision by the US Treasury to cancel a two year note auction on October 27th because it feared settlement risk. The Treasury recently set November 3rd as the date it runs out of money and exhausts special accounting measures to stay inside the debt limit approved by Congress. Yields on short-term Treasury bills have been volatile from a low of -0.04% on September 24th to a high of 10bps on October 20th and have since fallen again. At risk is trying to convince Congress that default risk should be easily avoidable. As noted by Treasury, “The creditworthiness of the United States is not a bargaining chip, and Congress should address this matter without controversy or brinkmanship.” Recall that the debt ceiling is a cap on borrowing set by Congress and applies to public debt and stands at US$18.113 trillion. Raising it is tantamount to a virtually annual cap-in-
Derek Holt 416.863.7707 [email protected]
THE WEEK AHEAD
Next Week's Risk Dashboard
Fed meeting to turn back to US risks
US debt ceiling
Heavy US macro week
China’s fifth plenum
Bank of Japan meeting
Eurozone inflation
ECB speak
Canadian GDP
UK, Spain Q3 GDP
US, CDN earnings
Alberta’s budget
Australian CPI
RBNZ meeting
Economics
Global Views
October 23, 2015
3
… continued from previous page
hand visit by Treasury officials to Congress — an exercise some think should be abolished. Inability to raise the debt ceiling could be highly disruptive to markets as it raises the prospect of defaulting on US government obligations after a series of controversial steps have been exhausted including delaying payments to federal government employees, government contractors, tax refunds, and potentially more creative options.
The week will also be marked by heavy data flow that will further inform the Fed’s data-dependent policy bias. There will be three focal points. One will be housing in the form of Monday’s release of new home sales, Tuesday’s S&P Case Shiller house prices, and Thursday’s pending home sales for September. Two will be consumers in the form of income and spending updates on Friday, and before that the Conference Board’s consumer confidence gauge on Tuesday. Those monitoring big-ticket cap-ex investment will digest the durable goods orders print on Tuesday. Core orders excluding defense and air serve as a proxy for broader economy-wide investment appetite and they slipped in August but are on three-month smoothed trend gain of 0.9% m/m. Continued trend improvement in cap-ex is important to the cyclical outlook.
The earnings calendar will also remain very active with 167 firms listed on the S&P 500 set to release including names like Apple, Pfizer, Merck, UPS, Ford, Time Warner, MasterCard, and Starbucks.
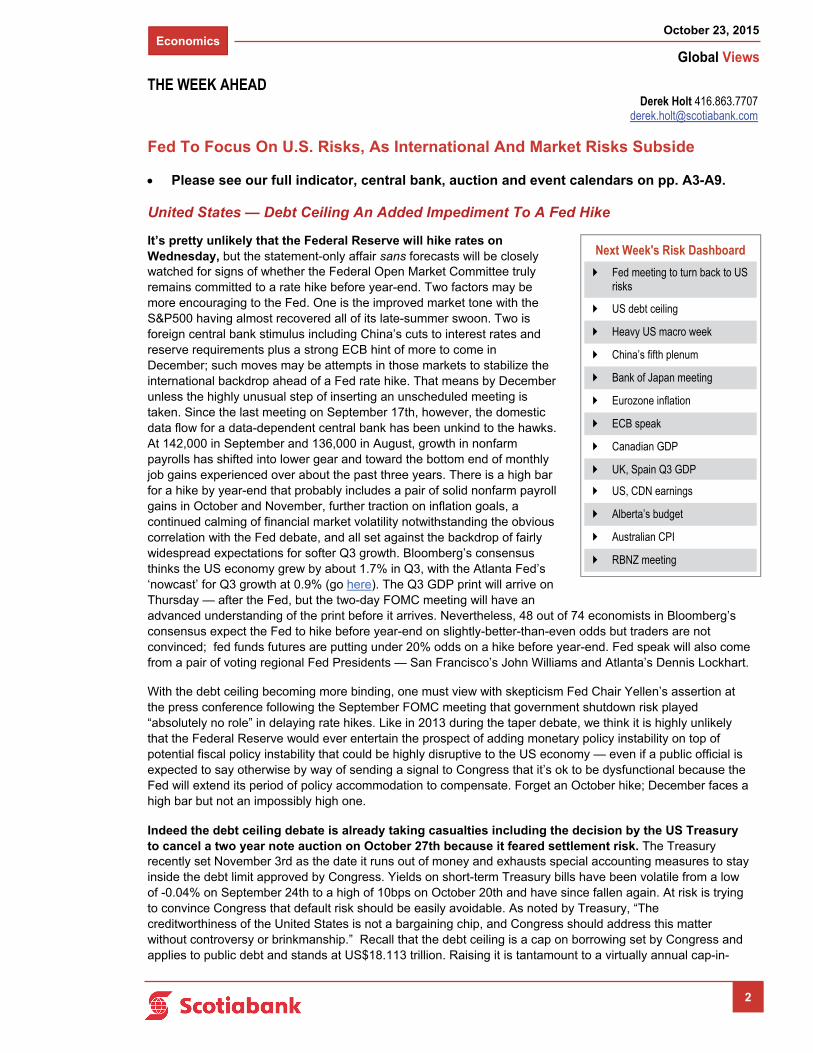
Was stock market volatility a function of the Fed and question marks overhanging international growth, or a classic replay of a recent earnings season bias? Probably both. But chart 1 shows that US equities often sell off going into earnings season when equity analysts — made risk averse by SOX and lawsuits to which they cleverly responded by simply moving the goalposts — downgrade their earnings estimates only to be consistently beaten to the upside thereafter. This is important because we’ve always maintained that the negative equity market bias several weeks ago was over sold. Sure enough, the 11% drop in the S&P500 from August 17th through to the market low later in August has since fully reversed.
Canada — More Recovery Evidence?
Can Canada make it three in a row? Following five consecutive months of contraction, the Canadian economy has already posted two months of growth. The report for August GDP next Friday will attempt to extend the streak — and we think it will.
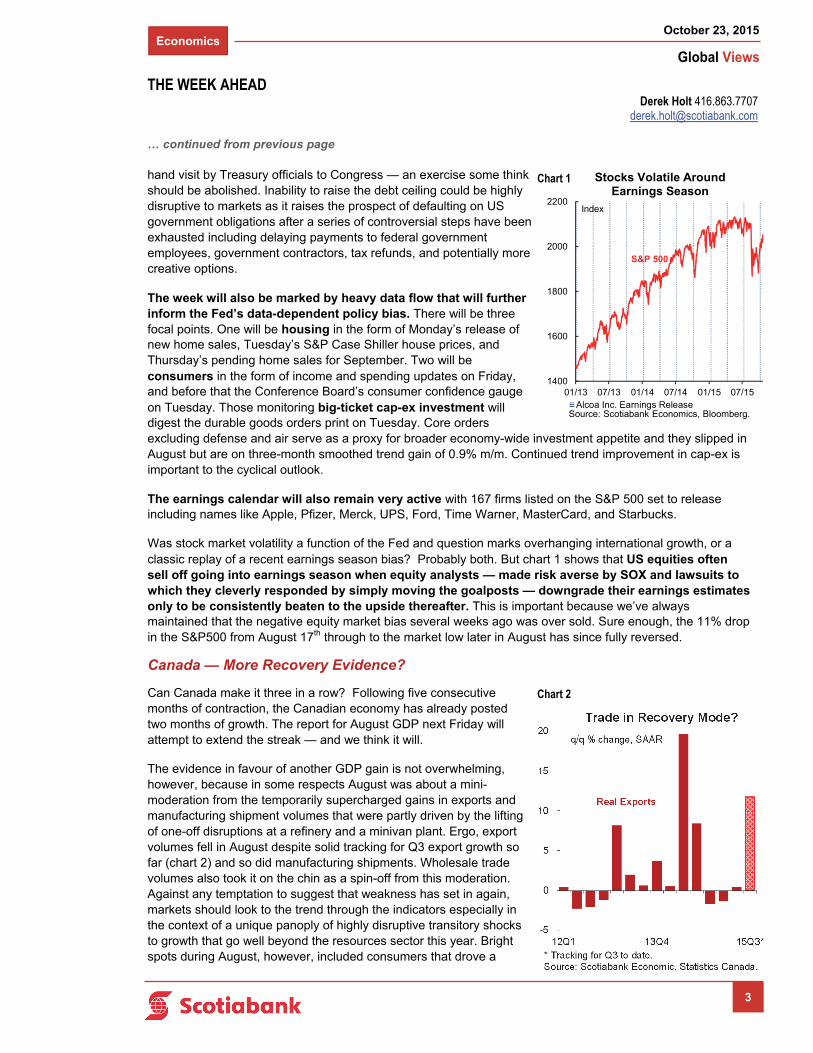
The evidence in favour of another GDP gain is not overwhelming, however, because in some respects August was about a mini-moderation from the temporarily supercharged gains in exports and manufacturing shipment volumes that were partly driven by the lifting of one-off disruptions at a refinery and a minivan plant. Ergo, export volumes fell in August despite solid tracking for Q3 export growth so far (chart 2) and so did manufacturing shipments. Wholesale trade volumes also took it on the chin as a spin-off from this moderation. Against any temptation to suggest that weakness has set in again, markets should look to the trend through the indicators especially in the context of a unique panoply of highly disruptive transitory shocks to growth that go well beyond the resources sector this year. Bright spots during August, however, included consumers that drove a
Derek Holt 416.863.7707 [email protected]
THE WEEK AHEAD
1400
1600
1800
2000
2200
01/13 07/13 01/14 07/14 01/15 07/15Alcoa Inc. Earnings Release
Stocks Volatile Around Earnings Season
Index
Source: Scotiabank Economics, Bloomberg.
S&P 500
Chart 1
Chart 2
Economics
Global Views
October 23, 2015
4
… continued from previous page
larger-than-expected 0.7% m/m rise in sales volumes, and housing starts that climbed in August and then again in September to the highest level since 2012 as two of the clear pieces of evidence that rate cuts further inflated the interest sensitive sectors. Perhaps the most encouraging piece of evidence in August, however, came from hours worked which climbed by a sizeable 0.8% m/m. They’ve been volatile this year, and fell in July and September, but the trend in hours worked has been solidly higher this year and that’s a growth indicator given GDP equals hours worked times labour productivity which, itself, is defined as output per hour worked.
Canada’s earnings season lags the US, but next week’s schedule heats up with 50 firms listed on the TSX set to release. Banks are on an October 31st fiscal year-end and so lag the firms on a calendar quarter schedule, but key names like West Fraser, Barrick Gold, New Gold, Cott, Suncor, Cogeco, Bombardier, Potash Corp, Maple Leaf Foods, Canadian Oil Sands, and a number of other resource plays will release earnings.
Alberta’s budget will also be released on Tuesday. Some think that Alberta’s change of government serves as a model for the federal Liberals in one sense: the ability to act quickly in retroactively applying tax changes promised during an election campaign. Alberta has recently guided that the consolidated budget deficit for FY2015-16 will be between C$5.9-6.5 billion or under 2% of GDP and that balancing the books will be delayed until FY2020. Mary Webb will be following.
Bank of Canada Deputy Governor Timothy Lane will speak on Tuesday about “Inflation Targeting — A Matter of Time”. Time is ticking on the path to the 2016 renewal of the five-year Agreement on the Inflation-Control Target. The generally independent central bank set its inflation target in concert with the Federal Government that has just changed hands in favour of a Liberal majority with an expansionist policy bias. There will be no press conference but there will be audience Q&A.
Of added local headline interest to the stimulus debate surrounding a new Federal government may be two academic stars taking opposite sides of the fiscal austerity debate on Thursday. Go here for the fuller agenda that pits Paul Krugman’s persistent stance in favour of fiscal stimulus against Kenneth Rogoff’s austerity bias.
Asia — One Year After The BoJ’s Halloween Shocker
After spending many months and meetings denying the prospect of additional stimulus and standing by its previously announced measures, Bank of Japan Governor Haruhiko Kuroda shocked markets by increasing the asset purchase target to ¥80 trillion from ¥50 trillion and expanding it to include stocks and real estate funds. The Nikkei jumped by about 5% and the yen plunged to a seven-year low. No you didn’t miss something of late. This is a description of what happened one year ago on Halloween 2014. Nevertheless, it carries strong parallels to today, on the path to next Thursday’s Bank of Japan meeting. Consensus does not expect expanded stimulus, and Governor Kuroda is again standing by current stimulus programs and looking through transitory weakness in inflation data. But the Bank of Japan has a tendency to surprise — arguably when policy is most powerful — and markets are on guard for expanded stimulus announcements into year-end and in the wake of ECB President Mario Draghi’s strong hint to expect expanded stimulus at the December 3rd meeting. The BoJ meeting also follows China’s surprise cuts to interest rates and reserve requirements. Central banks have a tendency to move in herd fashion so against the backdrop of announcements by other large central banks one cannot dismiss the chance of a shift in sentiment toward BoJ stimulus prospects. Recall, however, that a year ago the Bank of Japan was highly divided on the decision and it came down to a close 5-4 vote. Internal divisions may be more powerful this time around in the context of the fairly widespread expectation that headline inflation will rise into next year on stabilizing energy prices.
While the BoJ meeting might be the main event on the week, macro updates out of Japan will also draw some attention. They will include national and Tokyo CPI, retail sales, industrial production, the unemployment rate, and housing starts.
Derek Holt 416.863.7707 [email protected]
THE WEEK AHEAD
Economics
Global Views
October 23, 2015
5
… continued from previous page
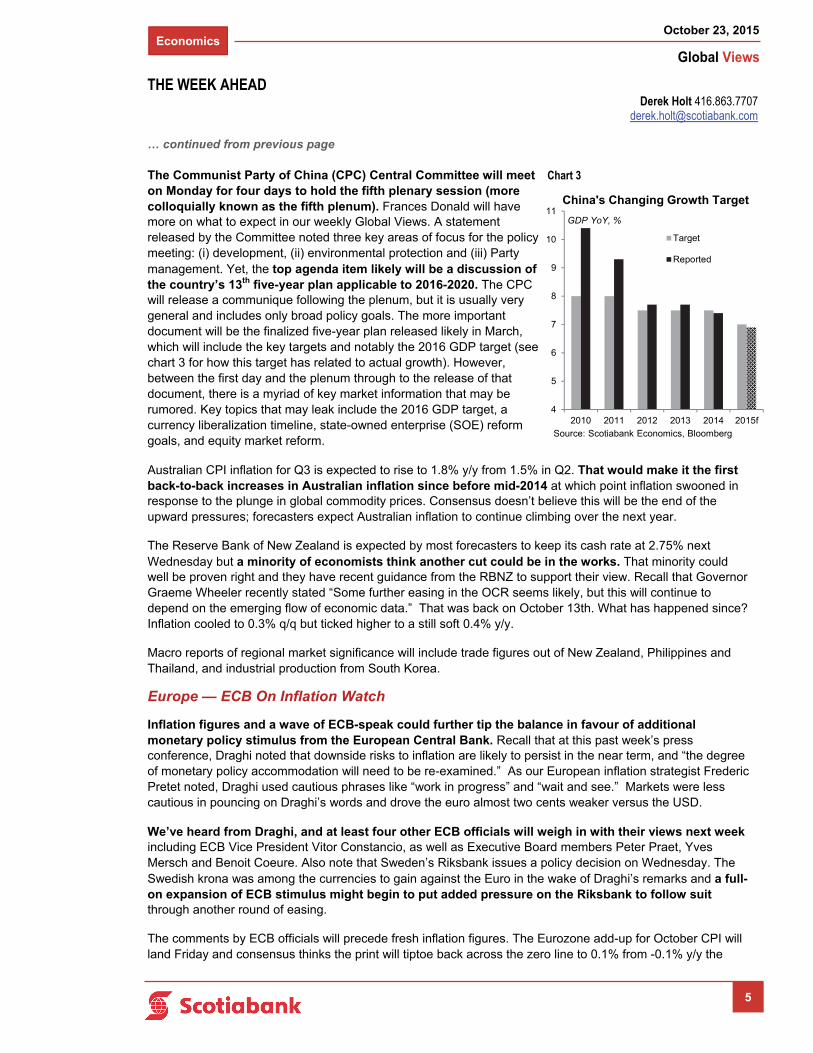
The Communist Party of China (CPC) Central Committee will meet on Monday for four days to hold the fifth plenary session (more colloquially known as the fifth plenum). Frances Donald will have more on what to expect in our weekly Global Views. A statement released by the Committee noted three key areas of focus for the policy meeting: (i) development, (ii) environmental protection and (iii) Party management. Yet, the top agenda item likely will be a discussion of the country’s 13th five-year plan applicable to 2016-2020. The CPC will release a communique following the plenum, but it is usually very general and includes only broad policy goals. The more important document will be the finalized five-year plan released likely in March, which will include the key targets and notably the 2016 GDP target (see chart 3 for how this target has related to actual growth). However, between the first day and the plenum through to the release of that document, there is a myriad of key market information that may be rumored. Key topics that may leak include the 2016 GDP target, a currency liberalization timeline, state-owned enterprise (SOE) reform goals, and equity market reform.
Australian CPI inflation for Q3 is expected to rise to 1.8% y/y from 1.5% in Q2. That would make it the first back-to-back increases in Australian inflation since before mid-2014 at which point inflation swooned in response to the plunge in global commodity prices. Consensus doesn’t believe this will be the end of the upward pressures; forecasters expect Australian inflation to continue climbing over the next year.
The Reserve Bank of New Zealand is expected by most forecasters to keep its cash rate at 2.75% next Wednesday but a minority of economists think another cut could be in the works. That minority could well be proven right and they have recent guidance from the RBNZ to support their view. Recall that Governor Graeme Wheeler recently stated “Some further easing in the OCR seems likely, but this will continue to depend on the emerging flow of economic data.” That was back on October 13th. What has happened since? Inflation cooled to 0.3% q/q but ticked higher to a still soft 0.4% y/y.
Macro reports of regional market significance will include trade figures out of New Zealand, Philippines and Thailand, and industrial production from South Korea.
Europe — ECB On Inflation Watch
Inflation figures and a wave of ECB-speak could further tip the balance in favour of additional monetary policy stimulus from the European Central Bank. Recall that at this past week’s press conference, Draghi noted that downside risks to inflation are likely to persist in the near term, and “the degree of monetary policy accommodation will need to be re-examined.” As our European inflation strategist Frederic Pretet noted, Draghi used cautious phrases like “work in progress” and “wait and see.” Markets were less cautious in pouncing on Draghi’s words and drove the euro almost two cents weaker versus the USD.
We’ve heard from Draghi, and at least four other ECB officials will weigh in with their views next week including ECB Vice President Vitor Constancio, as well as Executive Board members Peter Praet, Yves Mersch and Benoit Coeure. Also note that Sweden’s Riksbank issues a policy decision on Wednesday. The Swedish krona was among the currencies to gain against the Euro in the wake of Draghi’s remarks and a full-on expansion of ECB stimulus might begin to put added pressure on the Riksbank to follow suit through another round of easing.
The comments by ECB officials will precede fresh inflation figures. The Eurozone add-up for October CPI will land Friday and consensus thinks the print will tiptoe back across the zero line to 0.1% from -0.1% y/y the
Derek Holt 416.863.7707 [email protected]
THE WEEK AHEAD
4
5
6
7
8
9
10
11
2010 2011 2012 2013 2014 2015f
Target
Reported
Source: Scotiabank Economics, Bloomberg
China's Changing Growth Target
GDP YoY, %
Chart 3
Economics
Global Views
October 23, 2015
6
… continued from previous page
prior month — the first negative since March. German, Italian, and Spanish CPI reports will be released throughout the week. One more Eurozone inflation report will follow on December 2nd ahead of the December 3rd ECB meeting. So why is the ECB talking about expanded stimulus when inflation might be bottoming? One answer is that many within consensus think that Eurozone inflation will remain subdued over the next year and its rise will be more muted than in, say, the Anglo-American economies.
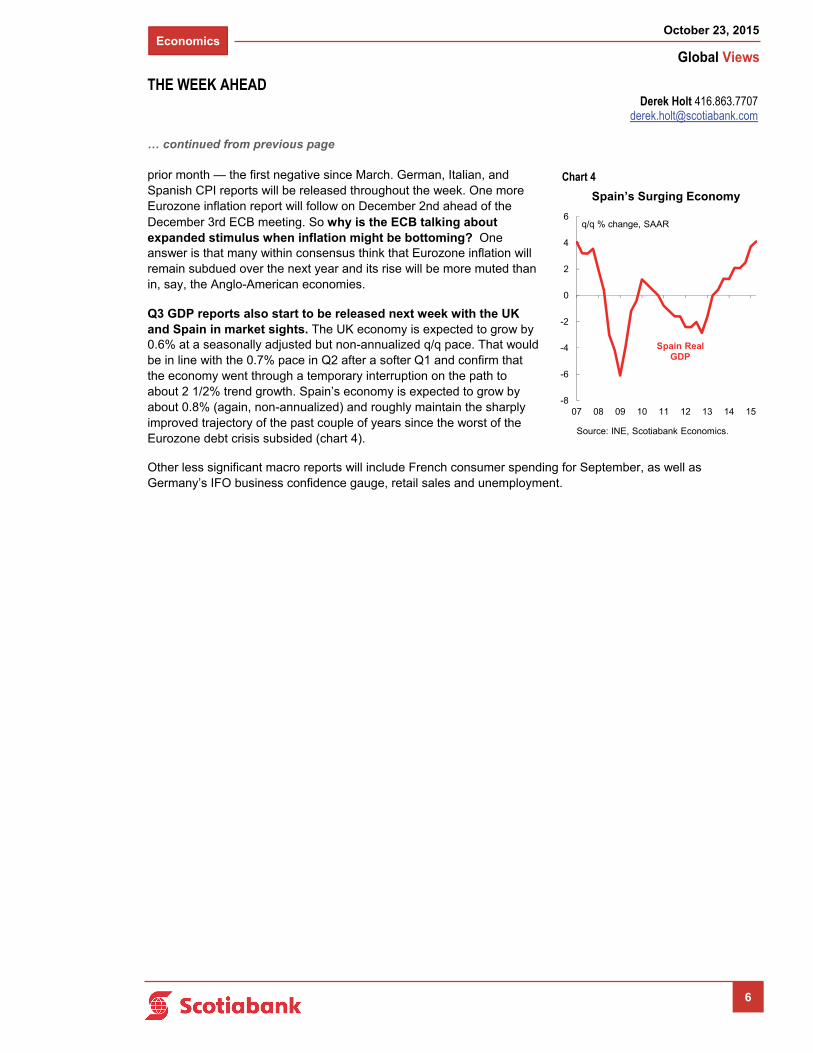
Q3 GDP reports also start to be released next week with the UK and Spain in market sights. The UK economy is expected to grow by 0.6% at a seasonally adjusted but non-annualized q/q pace. That would be in line with the 0.7% pace in Q2 after a softer Q1 and confirm that the economy went through a temporary interruption on the path to about 2 1/2% trend growth. Spain’s economy is expected to grow by about 0.8% (again, non-annualized) and roughly maintain the sharply improved trajectory of the past couple of years since the worst of the Eurozone debt crisis subsided (chart 4).
Other less significant macro reports will include French consumer spending for September, as well as Germany’s IFO business confidence gauge, retail sales and unemployment.
Derek Holt 416.863.7707 [email protected]
THE WEEK AHEAD
-8
-6
-4
-2
0
2
4
6
07 08 09 10 11 12 13 14 15
Spain’s Surging Economy
q/q % change, SAAR
Spain Real GDP
Source: INE, Scotiabank Economics.
Chart 4
Economics
Global Views
October 23, 2015
7
Canadian Renovation Activity To Lead Residential Investment In 2016
Attractive financing costs, an expanding housing stock and robust housing markets in Ontario and B.C. should sustain positive momentum in renovation spending.
Canadian homeowners remain enthusiastic renovators. Expenditures on home additions, alterations and new installations rose 6% y/y through the first half of 2015 (3½% in inflation-adjusted terms). Outlays are on track to total a record $53 billion this year, rivalling spending on new construction. Retailers of building materials and garden equipment supplies are likewise reporting brisk sales, though sales among wholesalers have been slower. Renovation spending is up in all provinces with the notable exception of Alberta.
The ongoing buoyancy in renovation activity mirrors the still elevated level of national home sales and new construction. Home sales this year are running about 5% above last year’s pace, while housing starts are on track to match the 2014 total of 190,000 units. A large share of home renovations are made by recent buyers, and by sellers preparing to list.
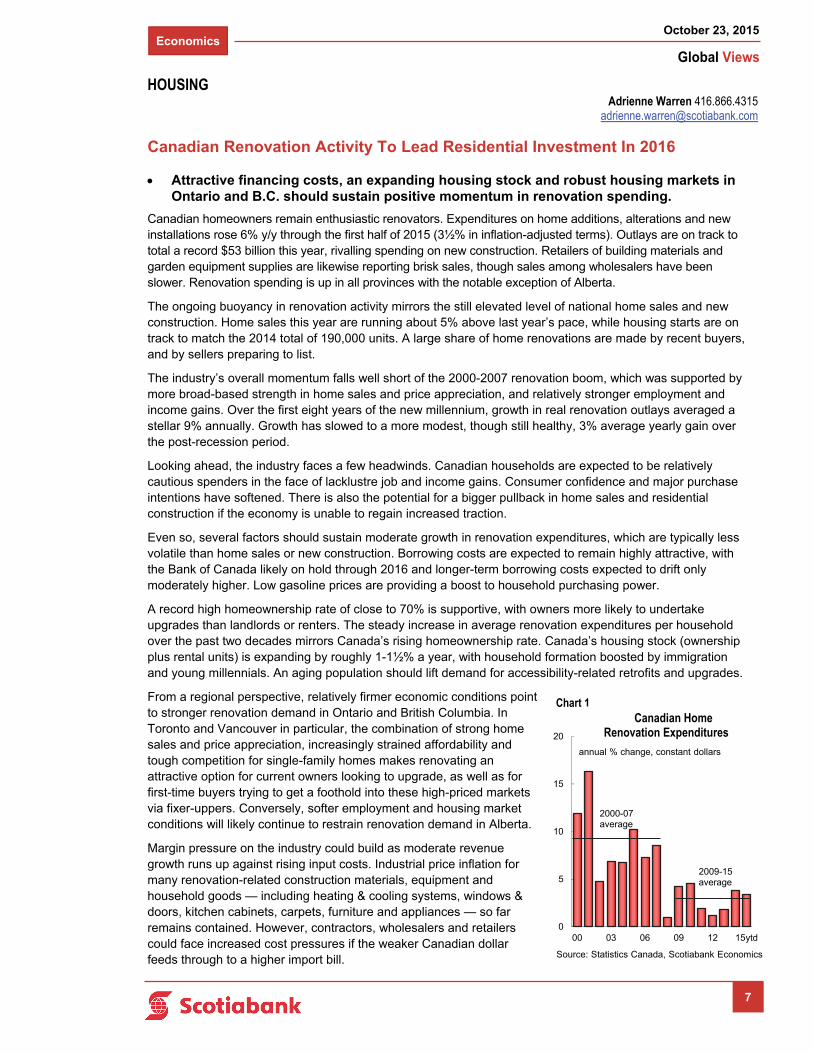
The industry’s overall momentum falls well short of the 2000-2007 renovation boom, which was supported by more broad-based strength in home sales and price appreciation, and relatively stronger employment and income gains. Over the first eight years of the new millennium, growth in real renovation outlays averaged a stellar 9% annually. Growth has slowed to a more modest, though still healthy, 3% average yearly gain over the post-recession period.
Looking ahead, the industry faces a few headwinds. Canadian households are expected to be relatively cautious spenders in the face of lacklustre job and income gains. Consumer confidence and major purchase intentions have softened. There is also the potential for a bigger pullback in home sales and residential construction if the economy is unable to regain increased traction.
Even so, several factors should sustain moderate growth in renovation expenditures, which are typically less volatile than home sales or new construction. Borrowing costs are expected to remain highly attractive, with the Bank of Canada likely on hold through 2016 and longer-term borrowing costs expected to drift only moderately higher. Low gasoline prices are providing a boost to household purchasing power.
A record high homeownership rate of close to 70% is supportive, with owners more likely to undertake upgrades than landlords or renters. The steady increase in average renovation expenditures per household over the past two decades mirrors Canada’s rising homeownership rate. Canada’s housing stock (ownership plus rental units) is expanding by roughly 1-1½% a year, with household formation boosted by immigration and young millennials. An aging population should lift demand for accessibility-related retrofits and upgrades.
From a regional perspective, relatively firmer economic conditions point to stronger renovation demand in Ontario and British Columbia. In Toronto and Vancouver in particular, the combination of strong home sales and price appreciation, increasingly strained affordability and tough competition for single-family homes makes renovating an attractive option for current owners looking to upgrade, as well as for first-time buyers trying to get a foothold into these high-priced markets via fixer-uppers. Conversely, softer employment and housing market conditions will likely continue to restrain renovation demand in Alberta.
Margin pressure on the industry could build as moderate revenue growth runs up against rising input costs. Industrial price inflation for many renovation-related construction materials, equipment and household goods — including heating & cooling systems, windows & doors, kitchen cabinets, carpets, furniture and appliances — so far remains contained. However, contractors, wholesalers and retailers could face increased cost pressures if the weaker Canadian dollar feeds through to a higher import bill.
Adrienne Warren 416.866.4315 [email protected]
HOUSING
Chart 1
0
5
10
15
20
00 03 06 09 12 15ytd
Canadian Home Renovation Expenditures
annual % change, constant dollars
Source: Statistics Canada, Scotiabank Economics
2000-07average
2009-15average
Canadian Home Renovation Expenditures
Economics
Global Views
October 23, 2015
8
A Market Briefing On China’s Fifth Plenum
Important information may leak over the next week and markets should be on watch.
The Communist Party of China (CPC) Central Committee will meet on Monday for four days to hold the fifth plenary session, a key policy-setting meeting among senior leaders known colloquially as the fifth plenum. There is no publically released agenda for plenary sessions, but a statement released by the Committee noted three key areas of focus: (i) development, (ii) environmental protection and (iii) Party management (e.g. anti-corruption efforts). These shouldn’t be much of a surprise as Premier Li’s platform since taking office in 2013 has been a continued emphasis on growth and reform with additional focus on pollution and anti-corruption.
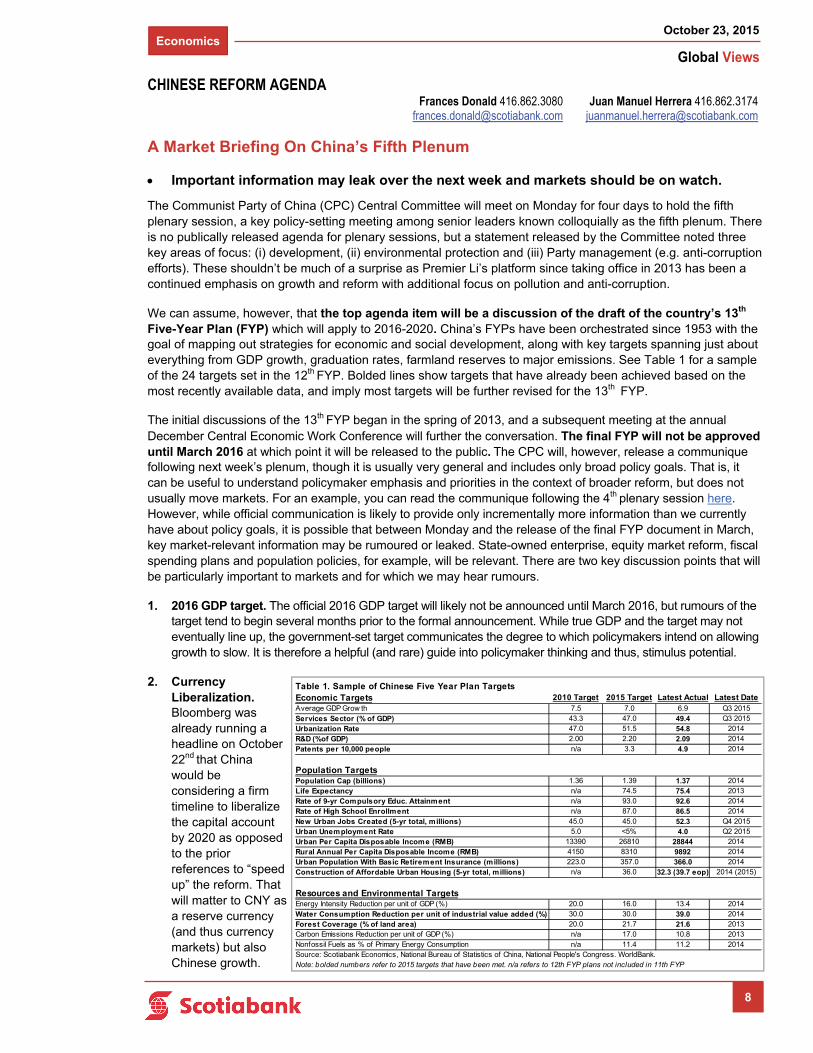
We can assume, however, that the top agenda item will be a discussion of the draft of the country’s 13th Five-Year Plan (FYP) which will apply to 2016-2020. China’s FYPs have been orchestrated since 1953 with the goal of mapping out strategies for economic and social development, along with key targets spanning just about everything from GDP growth, graduation rates, farmland reserves to major emissions. See Table 1 for a sample of the 24 targets set in the 12th FYP. Bolded lines show targets that have already been achieved based on the most recently available data, and imply most targets will be further revised for the 13th FYP.
The initial discussions of the 13th FYP began in the spring of 2013, and a subsequent meeting at the annual December Central Economic Work Conference will further the conversation. The final FYP will not be approved until March 2016 at which point it will be released to the public. The CPC will, however, release a communique following next week’s plenum, though it is usually very general and includes only broad policy goals. That is, it can be useful to understand policymaker emphasis and priorities in the context of broader reform, but does not usually move markets. For an example, you can read the communique following the 4th plenary session here. However, while official communication is likely to provide only incrementally more information than we currently have about policy goals, it is possible that between Monday and the release of the final FYP document in March, key market-relevant information may be rumoured or leaked. State-owned enterprise, equity market reform, fiscal spending plans and population policies, for example, will be relevant. There are two key discussion points that will be particularly important to markets and for which we may hear rumours.
1. 2016 GDP target. The official 2016 GDP target will likely not be announced until March 2016, but rumours of the target tend to begin several months prior to the formal announcement. While true GDP and the target may not eventually line up, the government-set target communicates the degree to which policymakers intend on allowing growth to slow. It is therefore a helpful (and rare) guide into policymaker thinking and thus, stimulus potential.
2. Currency Liberalization. Bloomberg was already running a headline on October 22nd that China would be considering a firm timeline to liberalize the capital account by 2020 as opposed to the prior references to “speed up” the reform. That will matter to CNY as a reserve currency (and thus currency markets) but also Chinese growth.
Frances Donald 416.862.3080 [email protected]
CHINESE REFORM AGENDA Juan Manuel Herrera 416.862.3174
Table 1. Sample of Chinese Five Year Plan TargetsEconomic Targets 2010 Target 2015 Target Latest Actual Latest DateAverage GDP Grow th 7.5 7.0 6.9 Q3 2015Services Sector (% of GDP) 43.3 47.0 49.4 Q3 2015Urbanization Rate 47.0 51.5 54.8 2014R&D (%of GDP) 2.00 2.20 2.09 2014Patents per 10,000 people n/a 3.3 4.9 2014
Population TargetsPopulation Cap (billions) 1.36 1.39 1.37 2014Life Expectancy n/a 74.5 75.4 2013Rate of 9-yr Compulsory Educ. Attainment n/a 93.0 92.6 2014Rate of High School Enrollment n/a 87.0 86.5 2014
New Urban Jobs Created (5-yr total, millions) 45.0 45.0 52.3 Q4 2015Urban Unemployment Rate 5.0 <5% 4.0 Q2 2015Urban Per Capita Disposable Income (RMB) 13390 26810 28844 2014Rural Annual Per Capita Disposable Income (RMB) 4150 8310 9892 2014Urban Population With Basic Retirement Insurance (millions) 223.0 357.0 366.0 2014Construction of Affordable Urban Housing (5-yr total, millions) n/a 36.0 32.3 (39.7 eop) 2014 (2015)
Resources and Environmental TargetsEnergy Intensity Reduction per unit of GDP (%) 20.0 16.0 13.4 2014Water Consumption Reduction per unit of industrial value added (%) 30.0 30.0 39.0 2014Forest Coverage (% of land area) 20.0 21.7 21.6 2013Carbon Emissions Reduction per unit of GDP (%) n/a 17.0 10.8 2013Nonfossil Fuels as % of Primary Energy Consumption n/a 11.4 11.2 2014Source: Scotiabank Economics, National Bureau of Statistics of China, National People's Congress. WorldBank.Note: bolded numbers refer to 2015 targets that have been met. n/a refers to 12th FYP plans not included in 11th FYP
Economics
Global Views
October 23, 2015
9
Temporary Ways Of Getting Around The U.S. Debt Ceiling
While a number of policy options could be hypothetically invoked after Treasury’s extraordinary measures are exhausted, none are sustainable and all carry significant risks.
It’s debt ceiling time again. To remind readers, periodically, new Congressional approval is required by the executive branch to increase the limit of outstanding debt of the United States federal government. This process is seldom entirely smooth, typically requires political negotiation and eventual compromise, and from time to time, that negotiation is acrimonious, possibly leading to a shutdown of the government. Indeed, the 1990s featured three government shutdowns, and there were more in the 1980s. Debt ceilings tend to come and go, however, and whenever they do, various ways of circumventing the debt ceiling are discussed.
Thus, our focus is upon whether the US debt ceiling is so binding that failure to lift it in line with the US Treasury's November 3rd 2015 deadline for running out of cash would automatically translate into default if breached? Yes and no, as there are options to ward off default to bond holders but they place the US into uncharted waters and are risky strategies. The risks could include: impeachment proceedings, a full-blown constitutional crisis, crossing the line on independence of monetary policy from fiscal policy, a potential negative ratings response, and tarnishing demand for Treasuries from key foreign holders like China and Japan. In fact, any of these options could intensify, severely, the market’s negative reaction to the debt ceiling issue. Furthermore, this time around the Republicans are putting more emphasis upon expenditure reductions as a way of addressing the debt ceiling.
We don’t believe things will get to that point, but the purpose of this article is to outline theoretical strategies to avoid default in the worst (and most unlikely) scenario of a pending default. Recall that such options have been used in the past and repeatedly outlined including, for instance, this advisory letter from the General Accounting Office in 1995 around the time of the two Clinton-era government shutdowns in 1995 and 1996.
1. Payments prioritization.
This is an option that in the past has been proposed by the Republicans but to date — and predictably — refused by the Administration and denied by the Treasury, and which could have many variations. For example, payments due to entities with ample liquidity could be replaced with paper “iou’s” alongside the federal government’s commitment to reimburse with interest after the ceiling is raised. For example, in a “debt issuance suspension period,” the US Treasury defers the interest payments owing on government securities held in public retirement and health benefit funds with a promise to make these Funds “whole” after the crisis. While interest on the federal debt is paid out through a separate computer system, other federal payments also are computerized and the automated system of disbursements was never designed to accommodate prioritizing outflows. Thus, this is but the first of several untested options that would place the US Treasury into uncharted waters.
2. The President could invoke Section 4 of the 14th Amendment.
This was adopted in 1868 and says: “The validity of the public debt of the United States, authorized by law, including debts incurred for payment of pensions and bounties for services in suppressing insurrection or rebellions, shall not be questioned.” The original intent of the 14thAmendment was to avoid a scenario whereby the South could hold Congress to ransom by jeopardizing the federal debt position in order to obtain concessions. While some believe it may be subject to a legal challenge, others believe it has already survived a legal challenge and that the option remains a viable one. The Supreme Court ruled in 1935 that “While this provision was undoubtedly inspired by the desire to put beyond question the obligations of the government issued during the Civil War, its language indicates a broader connotation.” The White House has steadily — if not unexpectedly — denied this option.
3. The President can choose the least damaging violation of the Constitution.
An article that was authored by two law professors and published in October 2012 in The Columbia Law Review (available here) argued that since by failing to raise the debt ceiling, Congress is essentially saying
Dov Zigler 212.225.6631 [email protected]
Mary Webb 416.866.4202 [email protected]
U.S. DEBT CEILING Derek Holt 416.863.7707
Economics
Global Views
October 23, 2015
10
… continued from previous page
the government cannot issue debt but must spend and cannot raise additional tax revenues through further means, and therefore the President “has to decide which of Congress’s orders to follow” and must “choose the least unconstitutional option.” The authors believed that issuing debt was the least unconstitutional.
4. Issue ‘premium’ bonds.
The thinking here is that because the debt ceiling applies to the face value of bonds issued and not the total funds raised, new bonds can be sold at a premium interest rate and thus raise greater funding than the par value of the bonds. Such issues could be used to roll over other previously existing debt without violating the debt ceiling while simultaneously raising more funds. This would be a potentially very costly option that would carry a higher interest burden that would further crowd out other government spending, but it may help to temporarily avert a default.
5. Issue a very large denomination platinum coin.
This rather unorthodox option has been officially rejected by the Treasury and Federal Reserve — again, perhaps not unexpectedly — but posits that the US Treasury has the option of issuing platinum coins with no limit. Jack Balkin, a Professor of Constitutional Law at Yale, was the first to suggest this option (along with the next one, and captured in his op-ed here for example) and Nobel laureate Paul Krugman endorsed the idea in early 2013 (here). It would amount to exploiting a loophole that was designed to allow the issuance of commemorative coins in any denomination and turn it into a funding instrument. Just don’t lose it or mix it up with subway change.
6. Tap the Federal Reserve for an ‘exploding option’.
The Federal Reserve is not a direct option for funding the US government because the Federal Reserve Act prohibits buying bonds at issue as opposed to the secondary market. Some — like Yale’s Jack Balkin again — speculate, however, that in desperate times the US government could write an option to the Federal Reserve to purchase government property for a specified amount and the Fed would then credit the government’s account for the associated amount. The so-called ‘exploding option’ could then expire worthless if not needed. This option clearly assumes that the Federal Reserve would play along. Some have noted that a variant of this option is similar to that which has been pursued by other governments at other times, including Greece’s use of derivatives to mask its deficits.
U.S. DEBT CEILING Dov Zigler 212.225.6631
[email protected] Mary Webb 416.866.4202
[email protected] Derek Holt 416.863.7707
Economics
Global Views
October 23, 2015
11
The U.S. Federal Debt Ceiling Constraint
Looking for a debt ceiling increase sufficient to carry Washington well into 2017.
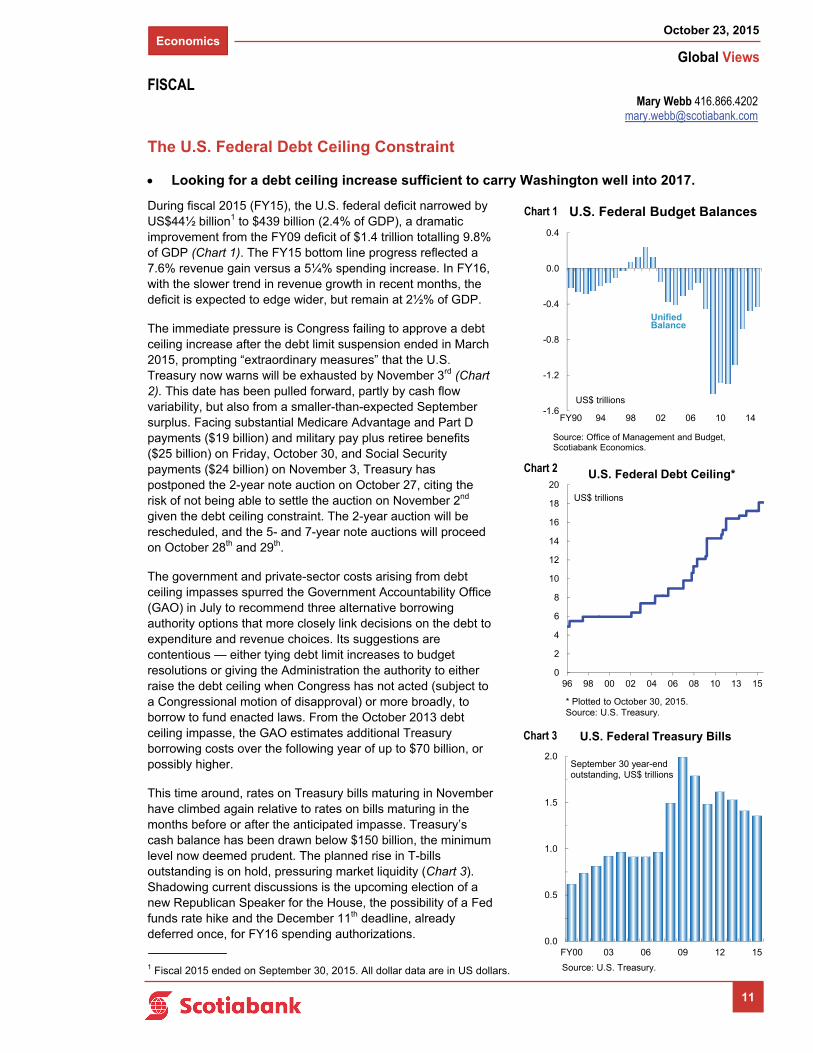
During fiscal 2015 (FY15), the U.S. federal deficit narrowed by US$44½ billion1 to $439 billion (2.4% of GDP), a dramatic improvement from the FY09 deficit of $1.4 trillion totalling 9.8% of GDP (Chart 1). The FY15 bottom line progress reflected a 7.6% revenue gain versus a 5¼% spending increase. In FY16, with the slower trend in revenue growth in recent months, the deficit is expected to edge wider, but remain at 2½% of GDP.
The immediate pressure is Congress failing to approve a debt ceiling increase after the debt limit suspension ended in March 2015, prompting “extraordinary measures” that the U.S. Treasury now warns will be exhausted by November 3rd (Chart 2). This date has been pulled forward, partly by cash flow variability, but also from a smaller-than-expected September surplus. Facing substantial Medicare Advantage and Part D payments ($19 billion) and military pay plus retiree benefits ($25 billion) on Friday, October 30, and Social Security payments ($24 billion) on November 3, Treasury has postponed the 2-year note auction on October 27, citing the risk of not being able to settle the auction on November 2nd given the debt ceiling constraint. The 2-year auction will be rescheduled, and the 5- and 7-year note auctions will proceed on October 28th and 29th.
The government and private-sector costs arising from debt ceiling impasses spurred the Government Accountability Office (GAO) in July to recommend three alternative borrowing authority options that more closely link decisions on the debt to expenditure and revenue choices. Its suggestions are contentious — either tying debt limit increases to budget resolutions or giving the Administration the authority to either raise the debt ceiling when Congress has not acted (subject to a Congressional motion of disapproval) or more broadly, to borrow to fund enacted laws. From the October 2013 debt ceiling impasse, the GAO estimates additional Treasury borrowing costs over the following year of up to $70 billion, or possibly higher.
This time around, rates on Treasury bills maturing in November have climbed again relative to rates on bills maturing in the months before or after the anticipated impasse. Treasury’s cash balance has been drawn below $150 billion, the minimum level now deemed prudent. The planned rise in T-bills outstanding is on hold, pressuring market liquidity (Chart 3). Shadowing current discussions is the upcoming election of a new Republican Speaker for the House, the possibility of a Fed funds rate hike and the December 11th deadline, already deferred once, for FY16 spending authorizations.
Mary Webb 416.866.4202 [email protected]
FISCAL
1 Fiscal 2015 ended on September 30, 2015. All dollar data are in US dollars.
-1.6
-1.2
-0.8
-0.4
0.0
0.4
FY90 94 98 02 06 10 14
Unified Balance
US$ trillions
U.S. Federal Budget Balances
Source: Office of Management and Budget, Scotiabank Economics.
0
2
4
6
8
10
12
14
16
18
20
96 98 00 02 04 06 08 10 13 15
US$ trillions
U.S. Federal Debt Ceiling*
* Plotted to October 30, 2015.Source: U.S. Treasury.
0.0
0.5
1.0
1.5
2.0
FY00 03 06 09 12 15
Source: U.S. Treasury.
September 30 year-endoutstanding, US$ trillions
U.S. Federal Treasury Bills
Chart 1
Chart 2
Chart 3
Fixed Income Strategy
Global Views
October 23, 2015
12
UK Waiting For Lift-Off
Market expectations for the timing of the first Bank of England rate hike have been all over the place over the last year. Just over a year ago, the market had assumed that the BoE would have hiked by 100bp by now. Three months ago, the market consensus had assumed that two or three of the MPC would have voted for a rate hike by now — yet, as of October, we only have one dissenter. Furthermore, the market currently expects the first rate hike to arrive around the end of 2016! Swings like this demonstrate that short interest rate futures have a tendency to overreact.
Why has the market pushed back on rate hikes?
Inflation has stayed lower for longer thanks to the latest downward leg in oil prices in late-summer which has pushed CPI inflation (marginally) into negative territory again.
Wage inflation data have been revised lower, making it less likely that the BoE’s end-year projection of 3% will be hit. It also hints that there may be less domestically generated wage pressures.
There have been downward surprises on various indicators ranging from the RICS housing market survey to the services sector PMI as well as various global growth jitters.
Keeping things in context:
The pace of GDP growth looks set to decelerate slightly from 0.7% q/q in Q2 to 0.6% q/q. But that is still a very respectable pace of growth. That is above trend and consistent with reducing what little slack remains.
It is a similar story for other indicators that have weakened. Indeed, the RICS housing market survey has fallen, but the level of the survey remains above past peaks and is consistent with house price inflation close to double digits.
Wage inflation data are backward looking and are released with a lag. So what we are seeing in the official data right now is telling us what happened in mid-summer. But we know that the situation has moved on since then with several companies raising wages ahead of the National Living Wage implementation scheduled for next April. Furthermore, there have been several reports of skills shortages that are pushing up wage inflation. The January to April period sees a big volume of pay deals and it is that period that is likely to reflect these rising wage pressures. So we would be reluctant to conclude from the latest labour report that the rise in wage inflation has become derailed.
The optics of the headline inflation data start to look more favourable around the turn of the year, when base effects add over 50bp to headline inflation. We expect that to have a big impact on investor perceptions of when the Bank can begin to raise.
Overall, it is understandable that the market has pushed back its expectations for the first BoE rate hike. The BoE doesn’t need to put the brakes on. Rather it just needs to take the opportunity, when it arises, to replenish its monetary policy ammunition. Given the recent weakening in the GBP exchange rate, signs that wage inflation will accelerate and ongoing solid growth, we think that the first rate hike is more likely to come sooner rather than later — early 2016 rather than early 2017.
Alan Clarke 44.207.826.5986 [email protected]
Fixed Income Strategy
Global Views
October 23, 2015
13
From Portugal To Spain, Moving To The Left?
The Portuguese Socialist Party (which was the runner-up in the recent election) indicated that it is in a position to form a coalition government with both the Left Bloc and the Communist Party.
This will be a blow to the current right-wing Prime Minister whose centre-right alliance (PAF) was able to win the general election in early October capturing 38.5% of the vote (ahead of the Socialist opposition with 32.4%) but, nonetheless, unable to get a full majority in parliament (107 seats out of 230).
A new left-wing government led by the Socialist Party would therefore have a majority with 122 seats.
There are a number of potential market implications:
Negative for the EUR as the Euro area is increasingly evolving from a situation where it was common to have strong majority governments, to a situation of less stable coalition governments. This is not very supportive for the visibility of economic policy. Similarly, it does not help the Euro area as a whole where questions about creating a more unified political/economic area requires strong leadership from governments. A move towards more left wing / anti-austerity governments is likely to refuel tensions with Germany.
The ECB buying programme may have to last longer. A left-leaning coalition means that the path for austerity and budget constraint & harsh structural reforms will be loosened. In the absence of ECB purchases, that would be likely to exert upward pressure on yields. For now, ECB QE purchases are holding yields lower and reducing market volatility. However, this situation will only persist for as long as the ECB continues to buy bonds. If / when it stops, there will be a full market repricing of this political risk, implying a retightening in financial conditions which could impair the recovery.
Favours core countries like Germany or France vs. peripherals. The market might be tempted to favour big, strong, centralised states where the political constitution favours the formation of full majority governments.
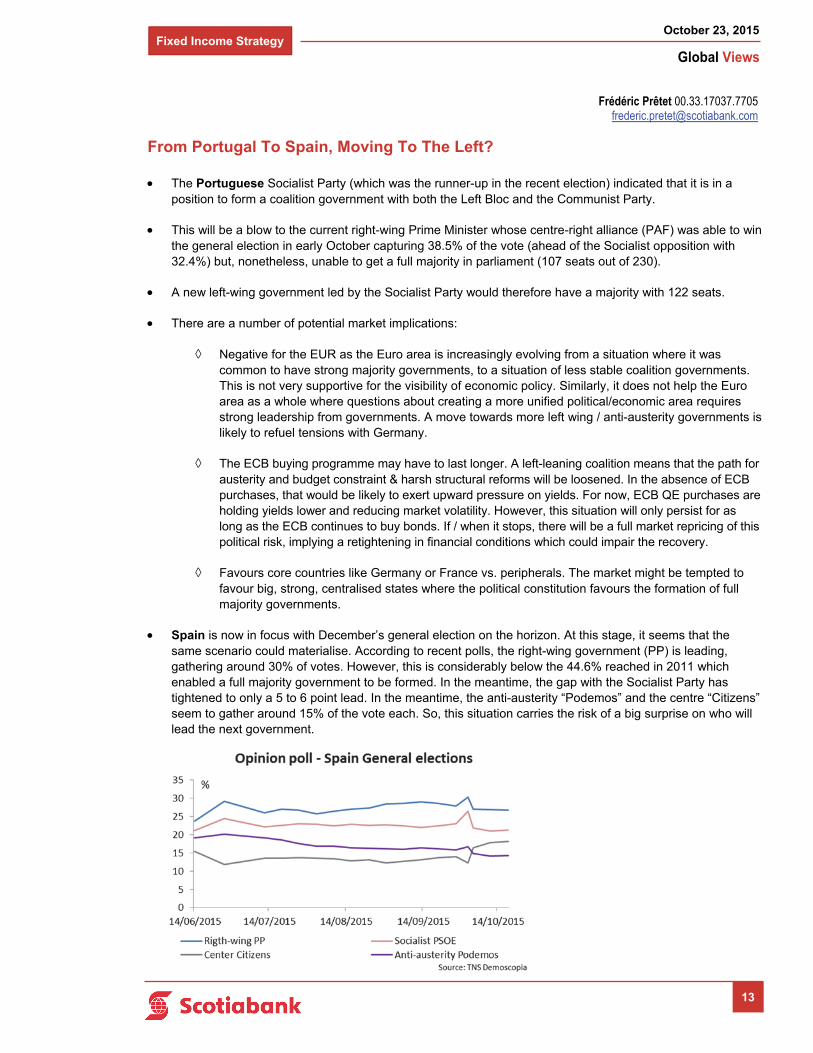
Spain is now in focus with December’s general election on the horizon. At this stage, it seems that the same scenario could materialise. According to recent polls, the right-wing government (PP) is leading, gathering around 30% of votes. However, this is considerably below the 44.6% reached in 2011 which enabled a full majority government to be formed. In the meantime, the gap with the Socialist Party has tightened to only a 5 to 6 point lead. In the meantime, the anti-austerity “Podemos” and the centre “Citizens” seem to gather around 15% of the vote each. So, this situation carries the risk of a big surprise on who will lead the next government.
Frédéric Prêtet 00.33.17037.7705 [email protected]
Fixed Income Strategy
Global Views
October 23, 2015
14
… continued from previous page
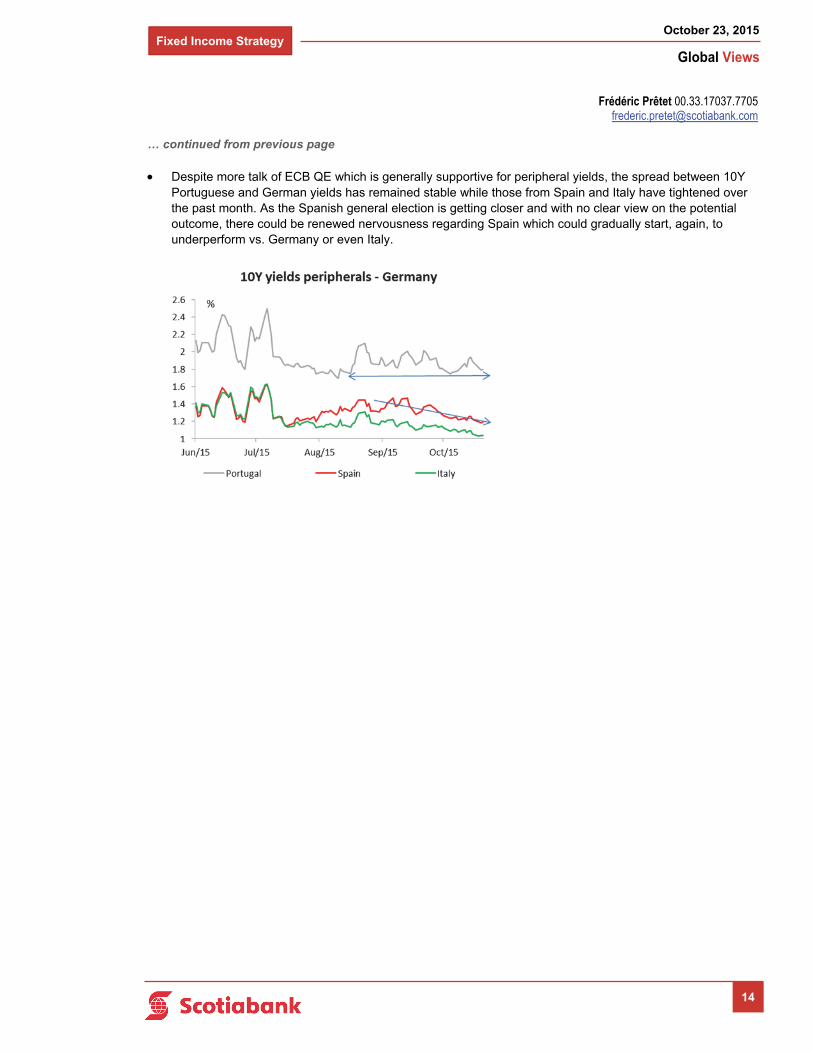
Despite more talk of ECB QE which is generally supportive for peripheral yields, the spread between 10Y Portuguese and German yields has remained stable while those from Spain and Italy have tightened over the past month. As the Spanish general election is getting closer and with no clear view on the potential outcome, there could be renewed nervousness regarding Spain which could gradually start, again, to underperform vs. Germany or even Italy.
Frédéric Prêtet 00.33.17037.7705 [email protected]
Fixed Income Strategy
Global Views
October 23, 2015
15
The ECB Almost Pre-Commit To A December Action!
The ECB president delivered a much more dovish speech at the press conference than we expected. Given that downside risks on inflation are unlikely to abate in the near term, Draghi has just about pre-committed to additional action at the December meeting as “the degree of monetary policy accommodation will need to be re-examined”.
During the press conference, the ECB president made it clear that the ECB is not in “wait and see” mode but is in “work and assess”. So, it is good news as it means that the ECB does not want to be seen as being “behind the curve” as was feared. He then recognised that
Although not prevalent, a few council members asked for additional actions as soon as today.
And most of the meeting was spent discussing a number of potential actions. He once again repeated that the board is ready to adjust the “size, composition and duration” of the QE program. The question of an additional cut in the deposit rate from -0.2% was also discussed. This could be seen as surprising as, one year ago, the ECB president indicated that rates have now reached “their lower band”. So, there was a willingness to show that the ECB can use a very broad based set of instruments. Although no preferred option was mentioned, an extension of the QE program beyond September 2016 looks to be, at least, the minimum step we could expect in December. Beyond this, the release of the minutes of this meeting on November 19th will be closely watched to assess the pros and cons of each option.
What would be the potential triggers:
First and foremost, the updated macroeconomic projections. In this regard, all the upcoming data will be key (both hard data and business surveys). In view of the commentary today, it seems that the ECB is rather confident about Q3 GDP growth but, possibly less so, for Q4. While the ECB’s baseline scenario is for Eurozone domestic demand to remain resilient, Draghi also pointed to “increased uncertainty” that may negatively impact it.
The EUR exchange rate also matters with the president repeating that it is an important influence on forecasts. Remember, the ECB’s September forecasts are based on a stable EUR/USD at 1.12. So, any significant upward move from this assumption will negatively impact its outlook and it confirms that there is an implicit cap on the EUR.
Finally, as we suspected, medium term inflation is key and it seems that the ECB president clearly linked it to the decision to cut or not the deposit rate in December. Linking the two together helped the ECB president to move away from a previous statement that rates have reached their “lower band” as any changes in medium term inflation expectations have some implications on the level of “real interest rates” in the economy. So, any additional deterioration in medium term inflation will thus justify a cut. So, it is important to watch both the dynamic in the ECB survey of professional forecasters as well as Euro 5Y in 5Y inflation swaps in financial markets. On the latter metric, although still low, the ECB president seems to welcome the recent rebound in the 5Y/5Y inflation swaps in the 1.65%/1.70% range. So, we would suspect that any renewed weakness from this point would increase nervousness.
So, the magnitude of the actions to be taken in December will be influenced by all these metrics. The most adverse developments requiring therefore the strongest reaction! As mentioned above, an extension of QE seems to be almost a done deal while the probability of an additional cut in the deposit rates in view of any downward revision in the inflation forecast has clearly increased as the ECB president has strengthened the link between the management of monetary policy and the level of “real rates”.
Frédéric Prêtet 00.33.17037.7705 [email protected]
Economics
Global Views
October 23, 2015
16
Key Data Preview
CANADA
We’re looking for Canadian GDP to come in at 0.2% m/m in August driven by a complex set of factors. In terms of coincident indicators, retail sales were very strong in volume terms at +0.7% m/m; hours worked were even stronger at +0.8% m/m; housing starts surged too, albeit on multifamily residence construction. Combined, these represent a material and meaningful base for growth in Q3 as consumers bounce back from a mediocre H1 and the economy experiences more resource utilization. Alas, all of the numbers from the industrial sector were soft. Trade data were weak, with export volumes falling by 0.6% m/m and import volumes lower by 0.1% m/m. Manufacturing figures were also soft at -0.1% m/m in constant dollar terms. Wholesale trade was down by 0.5% m/m. We would note that the soft production/export figures probably signal a moderation of the strong gains clocked in the prior couple of months, and that the trend remains solid overall. The net leaves us putting very volatile data into our coincident indicator add-up, and shaving the edges to wind up at a good but not great monthly number with a big error band.
UNITED STATES
We’re looking for U.S. GDP to print in the 2% vicinity for Q3. It’s a particularly tough call as there are very substantial risks both to the upside and to the downside, much as in Canada. To start with, consumer spending looks like it should be quite strong: real consumption expenditure was tracking at 3.5% q/q annualized through August, vehicle sales (in unit terms) tracked at +15.4% q/q annualized according to Wards, residential construction spending (in nominal terms) was tracking for an increase of 13% q/q annualized and non-res at 6.8% q/q annualized. In short, parts of the economy looked very healthy in Q3. The net trade side of the ledger, however, was another matter. Through August, exports were tracking for a 1.6% q/q annualized decline, imports for a 5.9% q/q annualized increase. The import number, on its own, points to likely inventory restocking. However inventories printed at very high consecutive levels in Q1 and Q2 (USD112.8bn and USD113.5bn, respectively) implying likely destocking, and potentially steep destocking. The two inputs don’t really fit together. The point is that there is a larger number of potential outcomes surrounding the first estimate of GDP this time around.
Personal spending and income figures for September will land the day after GDP is released, and will reflect the outcomes baked into Q3 GDP and therefore be somewhat of a non-event from an economic tracking perspective. For what it’s worth, ahead of the release, we’re anticipating a +0.2% m/m print for personal consumption spending after retail sales printed at a soft +0.1% m/m. We’re expecting a fairly flat 0% m/m print on incomes after the index of aggregate payrolls actually fell on the month (-0.2% m/m) which points to overall downside risk. The PCE deflator should, as usual, follow CPI with a bit of a lower rate of growth due to its slightly different basket mix, and we’re expecting a -0.1% m/m print on headline and +0.2% m/m print on core.
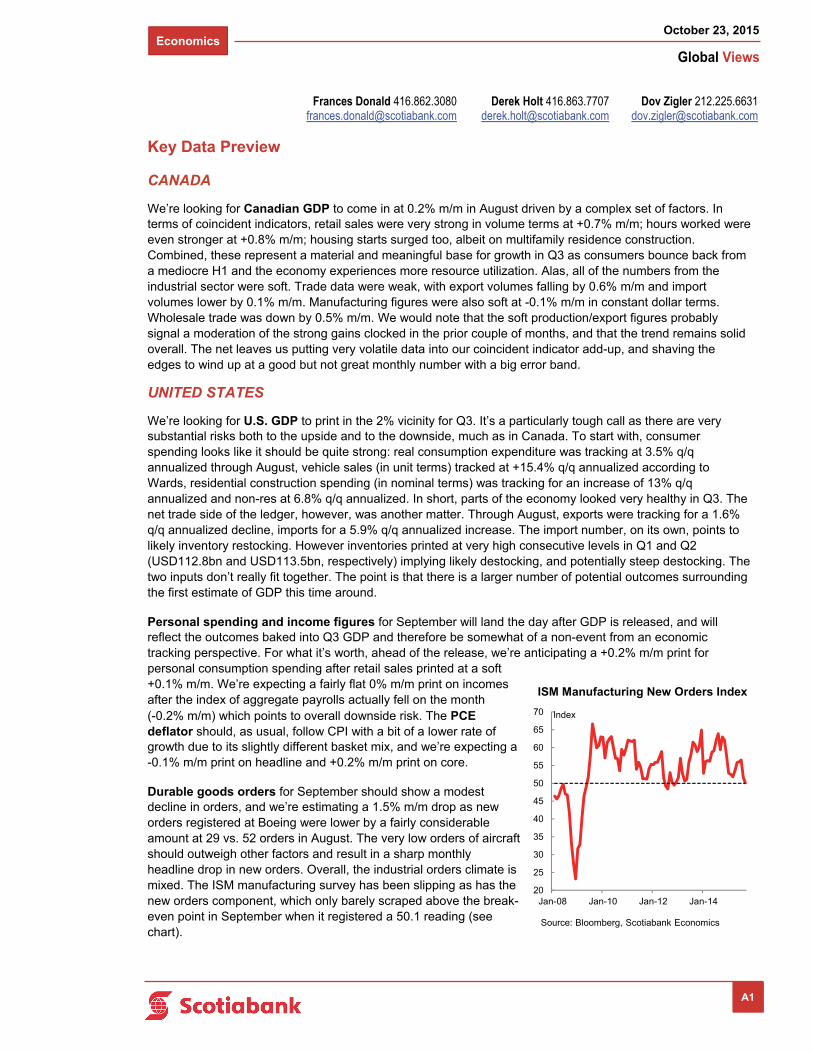
Durable goods orders for September should show a modest decline in orders, and we’re estimating a 1.5% m/m drop as new orders registered at Boeing were lower by a fairly considerable amount at 29 vs. 52 orders in August. The very low orders of aircraft should outweigh other factors and result in a sharp monthly headline drop in new orders. Overall, the industrial orders climate is mixed. The ISM manufacturing survey has been slipping as has the new orders component, which only barely scraped above the break-even point in September when it registered a 50.1 reading (see chart).
Dov Zigler 212.225.6631 [email protected]
Derek Holt 416.863.7707 [email protected]
Frances Donald 416.862.3080 [email protected]
A1
20
25
30
35
40
45
50
55
60
65
70
Jan-08 Jan-10 Jan-12 Jan-14
ISM Manufacturing New Orders Index
Source: Bloomberg, Scotiabank Economics
Index
Economics
Global Views
October 23, 2015
17
… continued from previous page
EUROPE
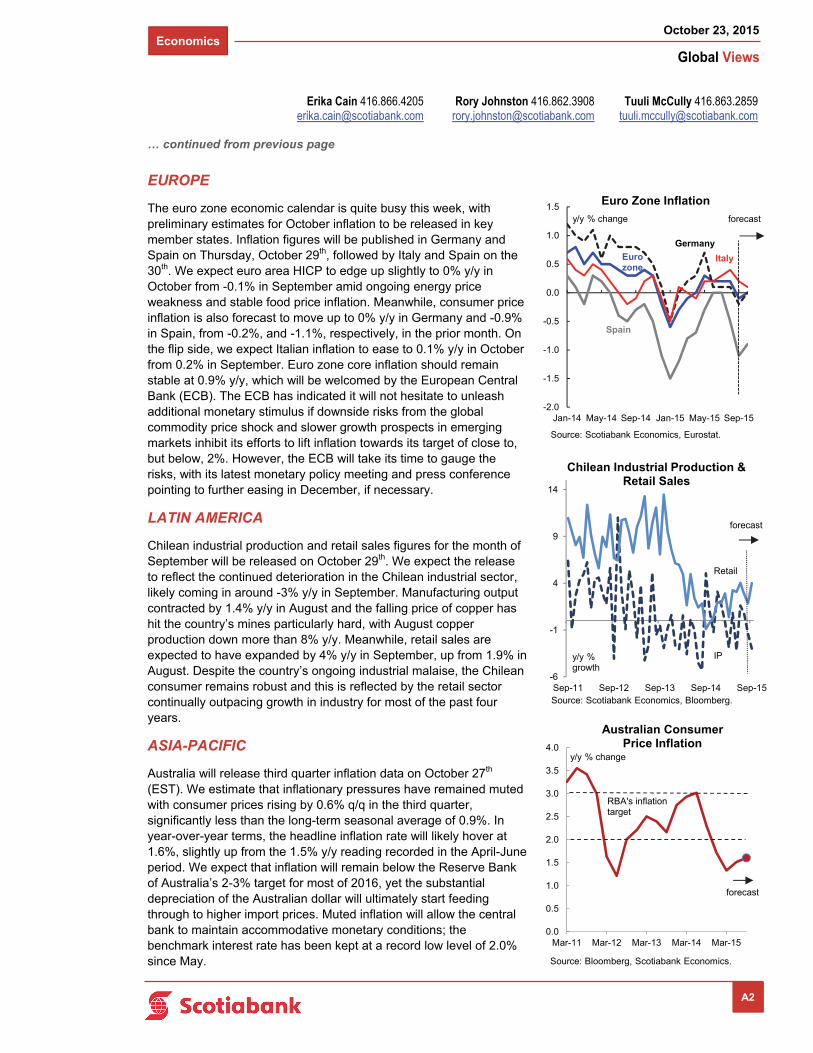
The euro zone economic calendar is quite busy this week, with preliminary estimates for October inflation to be released in key member states. Inflation figures will be published in Germany and Spain on Thursday, October 29th, followed by Italy and Spain on the 30th. We expect euro area HICP to edge up slightly to 0% y/y in October from -0.1% in September amid ongoing energy price weakness and stable food price inflation. Meanwhile, consumer price inflation is also forecast to move up to 0% y/y in Germany and -0.9% in Spain, from -0.2%, and -1.1%, respectively, in the prior month. On the flip side, we expect Italian inflation to ease to 0.1% y/y in October from 0.2% in September. Euro zone core inflation should remain stable at 0.9% y/y, which will be welcomed by the European Central Bank (ECB). The ECB has indicated it will not hesitate to unleash additional monetary stimulus if downside risks from the global commodity price shock and slower growth prospects in emerging markets inhibit its efforts to lift inflation towards its target of close to, but below, 2%. However, the ECB will take its time to gauge the risks, with its latest monetary policy meeting and press conference pointing to further easing in December, if necessary.
LATIN AMERICA
Chilean industrial production and retail sales figures for the month of September will be released on October 29th. We expect the release to reflect the continued deterioration in the Chilean industrial sector, likely coming in around -3% y/y in September. Manufacturing output contracted by 1.4% y/y in August and the falling price of copper has hit the country’s mines particularly hard, with August copper production down more than 8% y/y. Meanwhile, retail sales are expected to have expanded by 4% y/y in September, up from 1.9% in August. Despite the country’s ongoing industrial malaise, the Chilean consumer remains robust and this is reflected by the retail sector continually outpacing growth in industry for most of the past four years.
ASIA-PACIFIC
Australia will release third quarter inflation data on October 27th (EST). We estimate that inflationary pressures have remained muted with consumer prices rising by 0.6% q/q in the third quarter, significantly less than the long-term seasonal average of 0.9%. In year-over-year terms, the headline inflation rate will likely hover at 1.6%, slightly up from the 1.5% y/y reading recorded in the April-June period. We expect that inflation will remain below the Reserve Bank of Australia’s 2-3% target for most of 2016, yet the substantial depreciation of the Australian dollar will ultimately start feeding through to higher import prices. Muted inflation will allow the central bank to maintain accommodative monetary conditions; the benchmark interest rate has been kept at a record low level of 2.0% since May.
A2
Tuuli McCully 416.863.2859 [email protected]
Rory Johnston 416.862.3908 [email protected]
Erika Cain 416.866.4205 [email protected]
0.0
0.5
1.0
1.5
2.0
2.5
3.0
3.5
4.0
Mar-11 Mar-12 Mar-13 Mar-14 Mar-15
Australian Consumer Price Inflation
Source: Bloomberg, Scotiabank Economics.
y/y % change
forecast
RBA's inflation target
-6
-1
4
9
14
Sep-11 Sep-12 Sep-13 Sep-14 Sep-15
y/y %growth
Retail
IP
Source: Scotiabank Economics, Bloomberg.
forecast
Chilean Industrial Production & Retail Sales
-2.0
-1.5
-1.0
-0.5
0.0
0.5
1.0
1.5
Jan-14 May-14 Sep-14 Jan-15 May-15 Sep-15
Euro Zone Inflation
y/y % change
Source: Scotiabank Economics, Eurostat.
Eurozone
forecast
Italy
Germany
Spain
Economics
Global Views
October 23, 2015
1
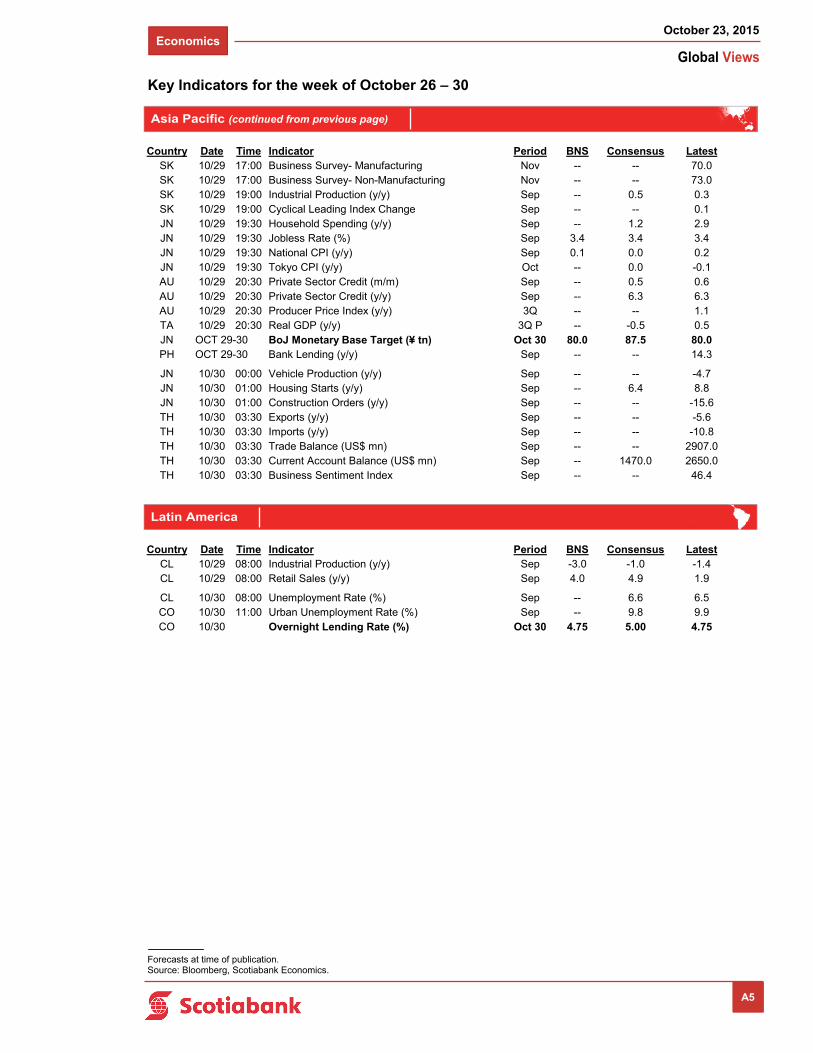
Key Indicators for the week of October 26 – 30
Forecasts at time of publication. Source: Bloomberg, Scotiabank Economics.
North America
A3
Europe
Country Date Time Indicator Period BNS Consensus LatestMX 10/26 10:00 Global Economic Indicator IGAE (y/y) Aug -- 2.3 2.0US 10/26 10:00 New Home Sales (000s a.r.) Sep 555.0 550.0 552US 10/26 10:30 Dallas Fed. Manufacturing Activity Oct -- -6.0 -9.5
US 10/27 08:30 Durable Goods Orders (m/m) Sep -1.5 -1.3 -2.3US 10/27 08:30 Durable Goods Orders ex. Trans. (m/m) Sep -- 0.0 -0.2US 10/27 09:00 S&P/Case-Shiller Home Price Index (m/m) Aug 0.2 0.1 -0.2US 10/27 09:00 S&P/Case-Shiller Home Price Index (y/y) Aug 5.2 5.1 5.0MX 10/27 10:00 Trade Balance (US$ mn) Sep -- -1458.3 -2782.1US 10/27 10:00 Consumer Confidence Index Oct 103.0 102.8 103.0US 10/27 10:00 Richmond Fed Manufacturing Index Oct -5.0 -3.0 -5.0
US 10/28 07:00 MBA Mortgage Applications (w/w) OCT 23 -- -- 11.8US 10/28 14:00 FOMC Interest Rate Meeting (%) Oct 28 0.25 0.25 0.25
CA 10/29 08:30 IPPI (m/m) Sep -- -0.1 -0.3CA 10/29 08:30 Raw Materials Price Index (m/m) Sep -- 1.5 -6.6US 10/29 08:30 GDP (q/q a.r.) 3Q A 2.0 1.6 3.9US 10/29 08:30 GDP Deflator (q/q a.r.) 3Q A -- 1.4 2.1US 10/29 08:30 Initial Jobless Claims (000s) OCT 24 270 263 259US 10/29 08:30 Continuing Claims (000s) OCT 17 2165 2160 2170US 10/29 10:00 Pending Home Sales (m/m) Sep -- 1.0 -1.4MX 10/29 15:00 Overnight Rate (%) Oct 29 3.00 3.00 3.00
CA 10/30 08:30 Real GDP (m/m) Aug 0.2 0.1 0.3US 10/30 08:30 Employment Cost Index (q/q) 3Q 0.8 0.6 0.2US 10/30 08:30 PCE Deflator (m/m) Sep -0.1 -0.1 0.0US 10/30 08:30 PCE Deflator (y/y) Sep 0.2 0.2 0.3US 10/30 08:30 PCE ex. Food & Energy (m/m) Sep 0.2 0.2 0.1US 10/30 08:30 PCE ex. Food & Energy (y/y) Sep 1.4 1.4 1.3US 10/30 08:30 Personal Spending (m/m) Sep -- 0.2 0.4US 10/30 08:30 Personal Income (m/m) Sep -- 0.2 0.3US 10/30 09:45 Chicago PMI Oct -- 49.5 48.7US 10/30 10:00 U. of Michigan Consumer Sentiment Oct F -- 92.5 92.1
Country Date Time Indicator Period BNS Consensus LatestGE 10/26 05:00 IFO Business Climate Survey Oct 107.7 107.8 108.5GE 10/26 05:00 IFO Current Assessment Survey Oct 113.5 113.5 114.0GE 10/26 05:00 IFO Expectations Survey Oct 102.3 102.4 103.3FR 10/26 13:00 Total Jobseekers (000s) Sep 3581.0 3575.0 3571.6FR 10/26 13:00 Jobseekers Net Change (000s) Sep 9.0 3.2 20.0
UK 10/27 05:30 GDP (q/q) 3Q A -- 0.6 0.7UK 10/27 05:30 Index of Services (m/m) Aug -- 0.2 0.2SP 10/27 Budget Balance YTD (€ mn) Sep -- -- -27320
GE 10/28 03:00 GfK Consumer Confidence Survey Nov 9.3 9.4 9.6SW 10/28 04:30 Riksbank Interest Rate (%) Oct 28 -0.35 -0.35 -0.35
UK 10/29 03:00 Nationwide House Prices (m/m) Oct -- 0.5 0.5SP 10/29 04:00 CPI (m/m) Oct P -- 0.7 -0.3SP 10/29 04:00 CPI (y/y) Oct P -- -0.6 -0.9SP 10/29 04:00 CPI - EU Harmonized (m/m) Oct P -- 0.3 0.4SP 10/29 04:00 CPI - EU Harmonized (y/y) Oct P -0.9 -0.9 -1.1SP 10/29 04:00 Real Retail Sales (y/y) Sep -- -- 3.2
Economics
Global Views
October 23, 2015
2
Key Indicators for the week of October 26 – 30
Forecasts at time of publication. Source: Bloomberg, Scotiabank Economics.
A4
Europe (continued from previous page)
Asia Pacific
Country Date Time Indicator Period BNS Consensus LatestTH 10/25 23:30 Customs Exports (y/y) Sep -- -8.3 -6.7TH 10/25 23:30 Customs Imports (y/y) Sep -- -21.0 -4.8TH 10/25 23:30 Customs Trade Balance (US$ mn) Sep -- 1113.0 721.2
SI 10/26 01:00 Industrial Production (y/y) Sep -- -4.5 -7.0SK 10/26 17:00 Consumer Confidence Index Oct -- -- 103.0NZ 10/26 17:45 Trade Balance (NZD mn) Sep -- -825.0 -1034.7NZ 10/26 17:45 Exports (NZD bn) Sep -- 3.9 3730.6NZ 10/26 17:45 Imports (NZD bn) Sep -- 4.8 4765.3PH 10/26 21:00 Imports (y/y) Aug -- 10.7 16.9PH 10/26 21:00 Trade Balance (US$ mn) Aug -- -750.0 -1177.0CH 10/26 21:30 Industrial Profits YTD (y/y) Sep -- -- -8.8
HK 10/27 04:30 Exports (y/y) Sep -- -3.5 -6.1HK 10/27 04:30 Imports (y/y) Sep -- -8.0 -7.4HK 10/27 04:30 Trade Balance (HKD bn) Sep -- -32.8 -25.1JN 10/27 19:50 Large Retailers' Sales (y/y) Sep -- 1.4 1.8JN 10/27 19:50 Retail Trade (y/y) Sep -- 0.4 0.8AU 10/27 20:30 Consumer Prices (y/y) 3Q 1.6 1.7 1.5SK 10/27 22:00 Department Store Sales (y/y) Sep -- -- -6.5CH OCT 27-31 Leading Index Sep -- -- 98.2
NZ 10/28 16:00 RBNZ Official Cash Rate (%) Oct 29 2.50 2.75 2.75JN 10/28 19:50 Industrial Production (y/y) Sep P -- -2.6 -0.4AU 10/28 20:00 HIA New Home Sales (m/m) Sep -- -- 2.3SI 10/28 22:30 Unemployment Rate (%) 3Q 2.0 2.0 2.0
Country Date Time Indicator Period BNS Consensus LatestGE 10/29 04:55 Unemployment (000s) Oct -5.0 -4.0 2.0GE 10/29 04:55 Unemployment Rate (%) Oct 6.4 6.4 6.4UK 10/29 05:30 Net Consumer Credit (£ bn) Sep -- 1.1 0.9EC 10/29 06:00 Business Climate Indicator Oct -- 0.3 0.3EC 10/29 06:00 Economic Confidence Oct 104.7 105.1 105.6EC 10/29 06:00 Industrial Confidence Oct -3.2 -2.7 -2.2GE 10/29 09:00 CPI (m/m) Oct P -0.2 -0.1 -0.2GE 10/29 09:00 CPI (y/y) Oct P 0.1 0.2 0.0GE 10/29 09:00 CPI - EU Harmonized (m/m) Oct P -0.2 -0.1 -0.3GE 10/29 09:00 CPI - EU Harmonized (y/y) Oct P 0.0 0.0 -0.2UK 10/29 20:05 GfK Consumer Confidence Survey Oct -- 4.0 3.0
GE 10/30 03:00 Retail Sales (m/m) Sep -- 0.4 -0.6FR 10/30 03:45 Consumer Spending (m/m) Sep 0.1 0.2 0.0FR 10/30 03:45 Producer Prices (m/m) Sep -- -- -0.9SP 10/30 04:00 Real GDP (q/q) 3Q P 0.8 0.8 1.0SP 10/30 05:00 Current Account (€ bn) Aug -- -- 3.0EC 10/30 06:00 Euro zone CPI Estimate (y/y) Oct 0.0 0.0 -0.1EC 10/30 06:00 Euro zone Core CPI Estimate (y/y) Oct A 0.9 0.9 0.9EC 10/30 06:00 Unemployment Rate (%) Sep 11.0 11.0 11.0IT 10/30 06:00 CPI (m/m) Oct P -- 0.1 -0.4IT 10/30 06:00 CPI (y/y) Oct P -- 0.2 0.2IT 10/30 06:00 CPI - EU Harmonized (m/m) Oct P -- 0.3 1.6IT 10/30 06:00 CPI - EU Harmonized (y/y) Oct P 0.1 0.1 0.2RU 10/30 06:30 One-Week Auction Rate (%) Oct 30 11.00 11.00 11.00
Economics
Global Views
October 23, 2015
3
Key Indicators for the week of October 26 – 30
Forecasts at time of publication. Source: Bloomberg, Scotiabank Economics.
A5
Latin America
Asia Pacific (continued from previous page)
Country Date Time Indicator Period BNS Consensus LatestSK 10/29 17:00 Business Survey- Manufacturing Nov -- -- 70.0SK 10/29 17:00 Business Survey- Non-Manufacturing Nov -- -- 73.0SK 10/29 19:00 Industrial Production (y/y) Sep -- 0.5 0.3SK 10/29 19:00 Cyclical Leading Index Change Sep -- -- 0.1JN 10/29 19:30 Household Spending (y/y) Sep -- 1.2 2.9JN 10/29 19:30 Jobless Rate (%) Sep 3.4 3.4 3.4JN 10/29 19:30 National CPI (y/y) Sep 0.1 0.0 0.2JN 10/29 19:30 Tokyo CPI (y/y) Oct -- 0.0 -0.1AU 10/29 20:30 Private Sector Credit (m/m) Sep -- 0.5 0.6AU 10/29 20:30 Private Sector Credit (y/y) Sep -- 6.3 6.3AU 10/29 20:30 Producer Price Index (y/y) 3Q -- -- 1.1TA 10/29 20:30 Real GDP (y/y) 3Q P -- -0.5 0.5JN OCT 29-30 BoJ Monetary Base Target (¥ tn) Oct 30 80.0 87.5 80.0PH OCT 29-30 Bank Lending (y/y) Sep -- -- 14.3
JN 10/30 00:00 Vehicle Production (y/y) Sep -- -- -4.7JN 10/30 01:00 Housing Starts (y/y) Sep -- 6.4 8.8JN 10/30 01:00 Construction Orders (y/y) Sep -- -- -15.6TH 10/30 03:30 Exports (y/y) Sep -- -- -5.6TH 10/30 03:30 Imports (y/y) Sep -- -- -10.8TH 10/30 03:30 Trade Balance (US$ mn) Sep -- -- 2907.0TH 10/30 03:30 Current Account Balance (US$ mn) Sep -- 1470.0 2650.0TH 10/30 03:30 Business Sentiment Index Sep -- -- 46.4
Country Date Time Indicator Period BNS Consensus LatestCL 10/29 08:00 Industrial Production (y/y) Sep -3.0 -1.0 -1.4CL 10/29 08:00 Retail Sales (y/y) Sep 4.0 4.9 1.9
CL 10/30 08:00 Unemployment Rate (%) Sep -- 6.6 6.5CO 10/30 11:00 Urban Unemployment Rate (%) Sep -- 9.8 9.9CO 10/30 Overnight Lending Rate (%) Oct 30 4.75 5.00 4.75
Economics
Global Views
October 23, 2015
4
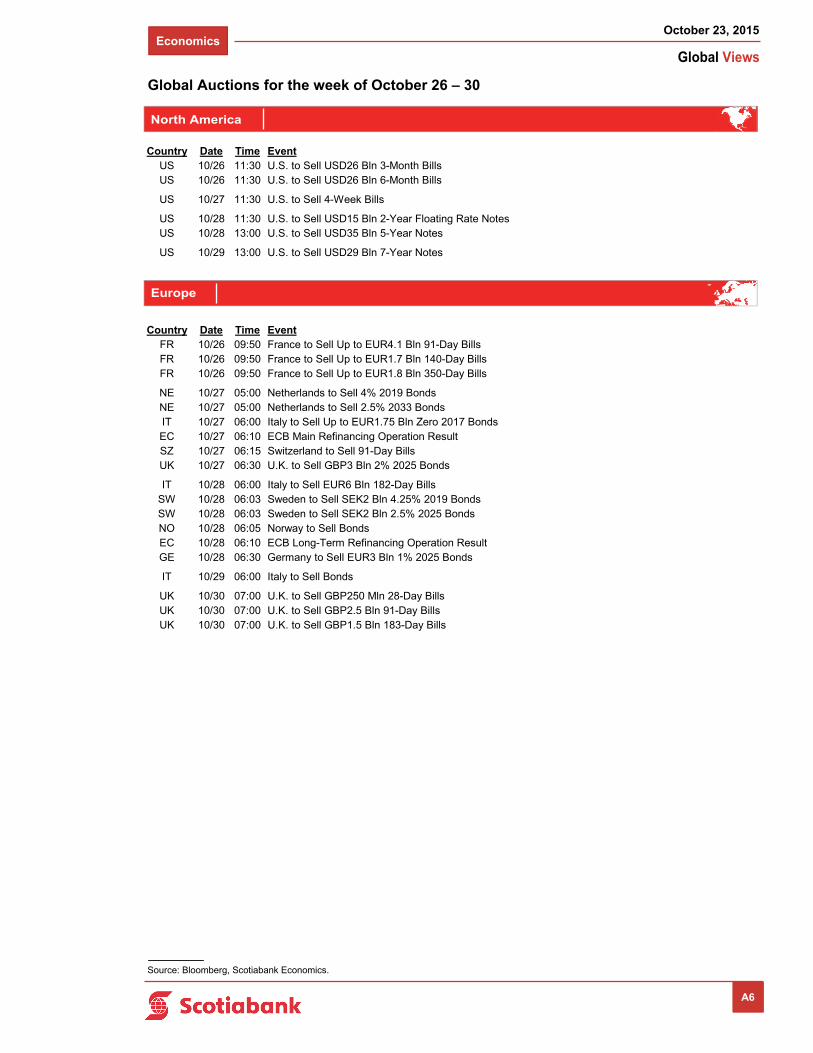
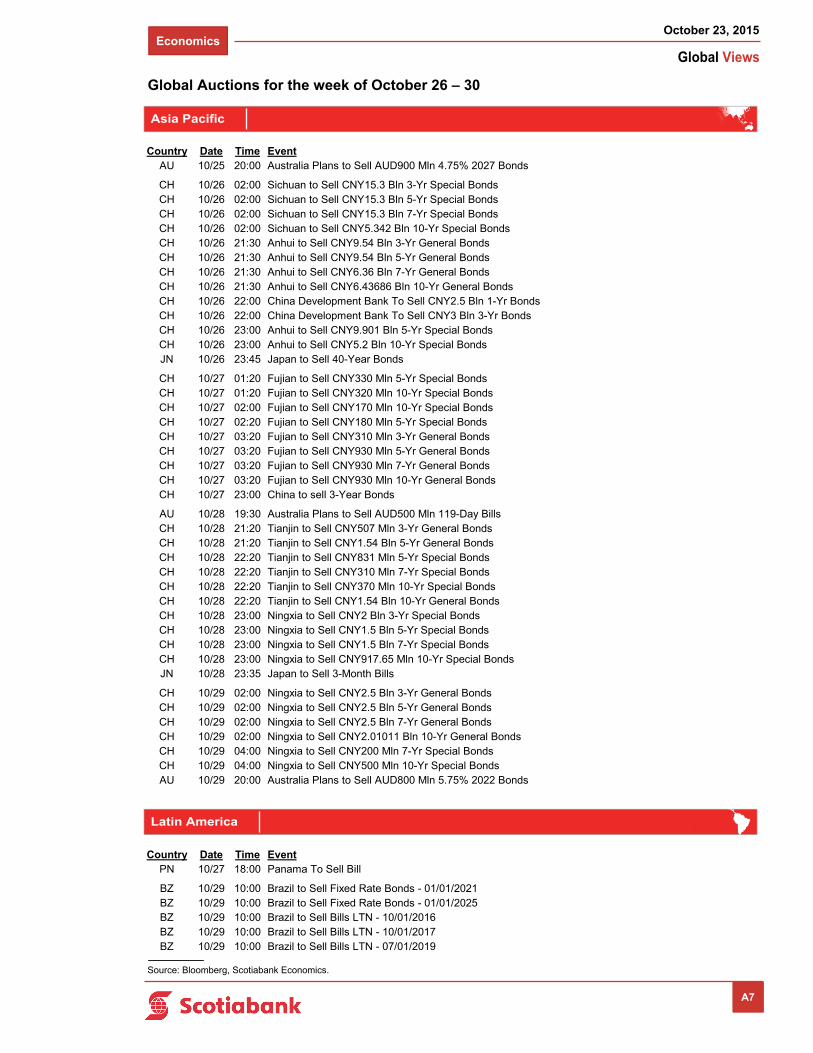
Global Auctions for the week of October 26 – 30
North America
Europe
Source: Bloomberg, Scotiabank Economics.
A6
Country Date Time EventUS 10/26 11:30 U.S. to Sell USD26 Bln 3-Month BillsUS 10/26 11:30 U.S. to Sell USD26 Bln 6-Month Bills
US 10/27 11:30 U.S. to Sell 4-Week Bills
US 10/28 11:30 U.S. to Sell USD15 Bln 2-Year Floating Rate NotesUS 10/28 13:00 U.S. to Sell USD35 Bln 5-Year Notes
US 10/29 13:00 U.S. to Sell USD29 Bln 7-Year Notes
Country Date Time EventFR 10/26 09:50 France to Sell Up to EUR4.1 Bln 91-Day BillsFR 10/26 09:50 France to Sell Up to EUR1.7 Bln 140-Day BillsFR 10/26 09:50 France to Sell Up to EUR1.8 Bln 350-Day Bills
NE 10/27 05:00 Netherlands to Sell 4% 2019 BondsNE 10/27 05:00 Netherlands to Sell 2.5% 2033 BondsIT 10/27 06:00 Italy to Sell Up to EUR1.75 Bln Zero 2017 BondsEC 10/27 06:10 ECB Main Refinancing Operation ResultSZ 10/27 06:15 Switzerland to Sell 91-Day BillsUK 10/27 06:30 U.K. to Sell GBP3 Bln 2% 2025 Bonds
IT 10/28 06:00 Italy to Sell EUR6 Bln 182-Day BillsSW 10/28 06:03 Sweden to Sell SEK2 Bln 4.25% 2019 BondsSW 10/28 06:03 Sweden to Sell SEK2 Bln 2.5% 2025 BondsNO 10/28 06:05 Norway to Sell BondsEC 10/28 06:10 ECB Long-Term Refinancing Operation ResultGE 10/28 06:30 Germany to Sell EUR3 Bln 1% 2025 Bonds
IT 10/29 06:00 Italy to Sell Bonds
UK 10/30 07:00 U.K. to Sell GBP250 Mln 28-Day BillsUK 10/30 07:00 U.K. to Sell GBP2.5 Bln 91-Day BillsUK 10/30 07:00 U.K. to Sell GBP1.5 Bln 183-Day Bills
Economics
Global Views
October 23, 2015
5
Global Auctions for the week of October 26 – 30
Source: Bloomberg, Scotiabank Economics.
A7
Asia Pacific
Latin America
Country Date Time EventAU 10/25 20:00 Australia Plans to Sell AUD900 Mln 4.75% 2027 Bonds
CH 10/26 02:00 Sichuan to Sell CNY15.3 Bln 3-Yr Special BondsCH 10/26 02:00 Sichuan to Sell CNY15.3 Bln 5-Yr Special BondsCH 10/26 02:00 Sichuan to Sell CNY15.3 Bln 7-Yr Special BondsCH 10/26 02:00 Sichuan to Sell CNY5.342 Bln 10-Yr Special BondsCH 10/26 21:30 Anhui to Sell CNY9.54 Bln 3-Yr General BondsCH 10/26 21:30 Anhui to Sell CNY9.54 Bln 5-Yr General BondsCH 10/26 21:30 Anhui to Sell CNY6.36 Bln 7-Yr General BondsCH 10/26 21:30 Anhui to Sell CNY6.43686 Bln 10-Yr General BondsCH 10/26 22:00 China Development Bank To Sell CNY2.5 Bln 1-Yr BondsCH 10/26 22:00 China Development Bank To Sell CNY3 Bln 3-Yr BondsCH 10/26 23:00 Anhui to Sell CNY9.901 Bln 5-Yr Special BondsCH 10/26 23:00 Anhui to Sell CNY5.2 Bln 10-Yr Special BondsJN 10/26 23:45 Japan to Sell 40-Year Bonds
CH 10/27 01:20 Fujian to Sell CNY330 Mln 5-Yr Special BondsCH 10/27 01:20 Fujian to Sell CNY320 Mln 10-Yr Special BondsCH 10/27 02:00 Fujian to Sell CNY170 Mln 10-Yr Special BondsCH 10/27 02:20 Fujian to Sell CNY180 Mln 5-Yr Special BondsCH 10/27 03:20 Fujian to Sell CNY310 Mln 3-Yr General BondsCH 10/27 03:20 Fujian to Sell CNY930 Mln 5-Yr General BondsCH 10/27 03:20 Fujian to Sell CNY930 Mln 7-Yr General BondsCH 10/27 03:20 Fujian to Sell CNY930 Mln 10-Yr General BondsCH 10/27 23:00 China to sell 3-Year Bonds
AU 10/28 19:30 Australia Plans to Sell AUD500 Mln 119-Day BillsCH 10/28 21:20 Tianjin to Sell CNY507 Mln 3-Yr General BondsCH 10/28 21:20 Tianjin to Sell CNY1.54 Bln 5-Yr General BondsCH 10/28 22:20 Tianjin to Sell CNY831 Mln 5-Yr Special BondsCH 10/28 22:20 Tianjin to Sell CNY310 Mln 7-Yr Special BondsCH 10/28 22:20 Tianjin to Sell CNY370 Mln 10-Yr Special BondsCH 10/28 22:20 Tianjin to Sell CNY1.54 Bln 10-Yr General BondsCH 10/28 23:00 Ningxia to Sell CNY2 Bln 3-Yr Special BondsCH 10/28 23:00 Ningxia to Sell CNY1.5 Bln 5-Yr Special BondsCH 10/28 23:00 Ningxia to Sell CNY1.5 Bln 7-Yr Special BondsCH 10/28 23:00 Ningxia to Sell CNY917.65 Mln 10-Yr Special BondsJN 10/28 23:35 Japan to Sell 3-Month Bills
CH 10/29 02:00 Ningxia to Sell CNY2.5 Bln 3-Yr General BondsCH 10/29 02:00 Ningxia to Sell CNY2.5 Bln 5-Yr General BondsCH 10/29 02:00 Ningxia to Sell CNY2.5 Bln 7-Yr General BondsCH 10/29 02:00 Ningxia to Sell CNY2.01011 Bln 10-Yr General BondsCH 10/29 04:00 Ningxia to Sell CNY200 Mln 7-Yr Special BondsCH 10/29 04:00 Ningxia to Sell CNY500 Mln 10-Yr Special BondsAU 10/29 20:00 Australia Plans to Sell AUD800 Mln 5.75% 2022 Bonds
Country Date Time EventPN 10/27 18:00 Panama To Sell Bill
BZ 10/29 10:00 Brazil to Sell Fixed Rate Bonds - 01/01/2021BZ 10/29 10:00 Brazil to Sell Fixed Rate Bonds - 01/01/2025BZ 10/29 10:00 Brazil to Sell Bills LTN - 10/01/2016BZ 10/29 10:00 Brazil to Sell Bills LTN - 10/01/2017BZ 10/29 10:00 Brazil to Sell Bills LTN - 07/01/2019

Economics
Global Views
October 23, 2015
6
Events for the week of October 26 – 30
Europe
Source: Bloomberg, Scotiabank Economics.
A8
North America
Asia Pacific
Latin America
Country Date Time EventCA 10/27 11:05 Bank of Canada Deputy Lane Speaks in Halifax NSCA 10/27 Finance Minister Ceci's Alberta Budget to be Released
US 10/28 14:00 FOMC Rate DecisionUS 10/28 U.S. House Republicans Vote on Speaker Nominee
US 10/29 09:10 Fed's Lockhart Makes Opening Remarks on Workforce DevelopmentMX 10/29 15:00 Overnight Rate
US 10/30 10:00 Fed's Williams Speaks in WashingtonUS 10/30 11:25 Fed's George Speaks on Federal Reserve Structure
Country Date Time EventEC 10/24 05:45 EU's Tusk Meets With Dutch Prime Minister Rutte in The Hague
EC 10/26 06:45 ECB Executive Board Member Yves Mersch Speaks in Brussels
SW 10/27 04:00 Riksbank Monetary Policy MeetingEC 10/27 07:15 ECB's Nowotny Speaks in ZurichEC 10/27 18:00 ECB Executive Board member Coeure Speaks in Mexico City
SW 10/28 04:30 Riksbank Rate Decision, Monetary Policy ReportEC 10/28 05:15 ECB Executive Board member Peter Praet Speaks in RigaIT 10/28 05:30 Bank of Italy Governor, Finance Minister At World Saving DayEC 10/28 10:45 ECB Vice President Vitor Constancio Speaks in Berlin
EC 10/29 11:00 ECB's Constancio Speaks in London
RU 10/30 06:30 Key RateSZ 10/30 Switzerland Sovereign Debt Rating Published by Fitch
Country Date Time EventNZ 10/28 16:00 RBNZ Official Cash Rate
JN 10/29 23:00 Bank of Japan Policy Statement/Kuroda Press ConferenceJN 10/29 00:00 BOJ Annual Rise in Monetary Base
JN 10/30 02:00 BOJ Semi Annual Outlook Report
Country Date Time EventBZ 10/29 06:30 COPOM Monetary Policy Meeting Minutes
CO 10/30 Overnight Lending Rate
Economics
Global Views
October 23, 2015
7
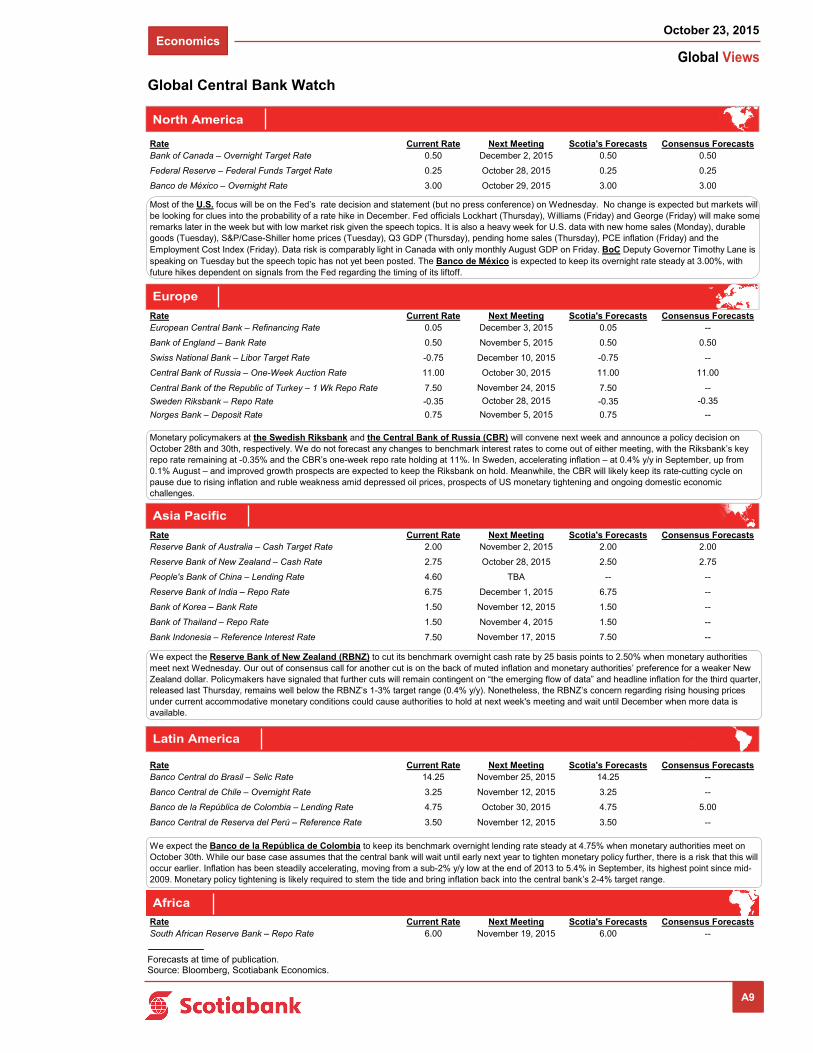
Global Central Bank Watch
NORTH AMERICARate Current Rate Next Meeting Scotia's Forecasts Consensus ForecastsBank of Canada – Overnight Target Rate 0.50 December 2, 2015 0.50 0.50
Federal Reserve – Federal Funds Target Rate 0.25 October 28, 2015 0.25 0.25
Banco de México – Overnight Rate 3.00 October 29, 2015 3.00 3.00
EUROPERate Current Rate Next Meeting Scotia's Forecasts Consensus ForecastsEuropean Central Bank – Refinancing Rate 0.05 December 3, 2015 0.05 --
Bank of England – Bank Rate 0.50 November 5, 2015 0.50 0.50
Swiss National Bank – Libor Target Rate -0.75 December 10, 2015 -0.75 --
Central Bank of Russia – One-Week Auction Rate 11.00 October 30, 2015 11.00 11.00
Central Bank of the Republic of Turkey – 1 Wk Repo Rate 7.50 November 24, 2015 7.50 --
Sweden Riksbank – Repo Rate -0.35 October 28, 2015 -0.35 -0.35
Norges Bank – Deposit Rate 0.75 November 5, 2015 0.75 --
ASIA PACIFICRate Current Rate Next Meeting Scotia's Forecasts Consensus ForecastsReserve Bank of Australia – Cash Target Rate 2.00 November 2, 2015 2.00 2.00
Reserve Bank of New Zealand – Cash Rate 2.75 October 28, 2015 2.50 2.75
People's Bank of China – Lending Rate 4.60 TBA -- --
Reserve Bank of India – Repo Rate 6.75 December 1, 2015 6.75 --
Bank of Korea – Bank Rate 1.50 November 12, 2015 1.50 --
Bank of Thailand – Repo Rate 1.50 November 4, 2015 1.50 --
Bank Indonesia – Reference Interest Rate 7.50 November 17, 2015 7.50 --
LATIN AMERICARate Current Rate Next Meeting Scotia's Forecasts Consensus ForecastsBanco Central do Brasil – Selic Rate 14.25 November 25, 2015 14.25 --
Banco Central de Chile – Overnight Rate 3.25 November 12, 2015 3.25 --
Banco de la República de Colombia – Lending Rate 4.75 October 30, 2015 4.75 5.00
Banco Central de Reserva del Perú – Reference Rate 3.50 November 12, 2015 3.50 --
AFRICARate Current Rate Next Meeting Scotia's Forecasts Consensus ForecastsSouth African Reserve Bank – Repo Rate 6.00 November 19, 2015 6.00 --
Most of the U.S. focus will be on the Fed’s rate decision and statement (but no press conference) on Wednesday. No change is expected but markets will be looking for clues into the probability of a rate hike in December. Fed officials Lockhart (Thursday), Williams (Friday) and George (Friday) will make some remarks later in the week but with low market risk given the speech topics. It is also a heavy week for U.S. data with new home sales (Monday), durable goods (Tuesday), S&P/Case-Shiller home prices (Tuesday), Q3 GDP (Thursday), pending home sales (Thursday), PCE inflation (Friday) and the Employment Cost Index (Friday). Data risk is comparably light in Canada with only monthly August GDP on Friday. BoC Deputy Governor Timothy Lane is speaking on Tuesday but the speech topic has not yet been posted. The Banco de México is expected to keep its overnight rate steady at 3.00%, with future hikes dependent on signals from the Fed regarding the timing of its liftoff.
Monetary policymakers at the Swedish Riksbank and the Central Bank of Russia (CBR) will convene next week and announce a policy decision on October 28th and 30th, respectively. We do not forecast any changes to benchmark interest rates to come out of either meeting, with the Riksbank’s key repo rate remaining at -0.35% and the CBR’s one-week repo rate holding at 11%. In Sweden, accelerating inflation – at 0.4% y/y in September, up from 0.1% August – and improved growth prospects are expected to keep the Riksbank on hold. Meanwhile, the CBR will likely keep its rate-cutting cycle on pause due to rising inflation and ruble weakness amid depressed oil prices, prospects of US monetary tightening and ongoing domestic economic challenges.
We expect the Reserve Bank of New Zealand (RBNZ) to cut its benchmark overnight cash rate by 25 basis points to 2.50% when monetary authorities meet next Wednesday. Our out of consensus call for another cut is on the back of muted inflation and monetary authorities’ preference for a weaker New Zealand dollar. Policymakers have signaled that further cuts will remain contingent on “the emerging flow of data” and headline inflation for the third quarter, released last Thursday, remains well below the RBNZ’s 1-3% target range (0.4% y/y). Nonetheless, the RBNZ’s concern regarding rising housing prices under current accommodative monetary conditions could cause authorities to hold at next week's meeting and wait until December when more data is available.
We expect the Banco de la República de Colombia to keep its benchmark overnight lending rate steady at 4.75% when monetary authorities meet on October 30th. While our base case assumes that the central bank will wait until early next year to tighten monetary policy further, there is a risk that this will occur earlier. Inflation has been steadily accelerating, moving from a sub-2% y/y low at the end of 2013 to 5.4% in September, its highest point since mid-2009. Monetary policy tightening is likely required to stem the tide and bring inflation back into the central bank’s 2-4% target range.
North America
Europe
Asia Pacific
Latin America
Africa
Forecasts at time of publication. Source: Bloomberg, Scotiabank Economics.
A9
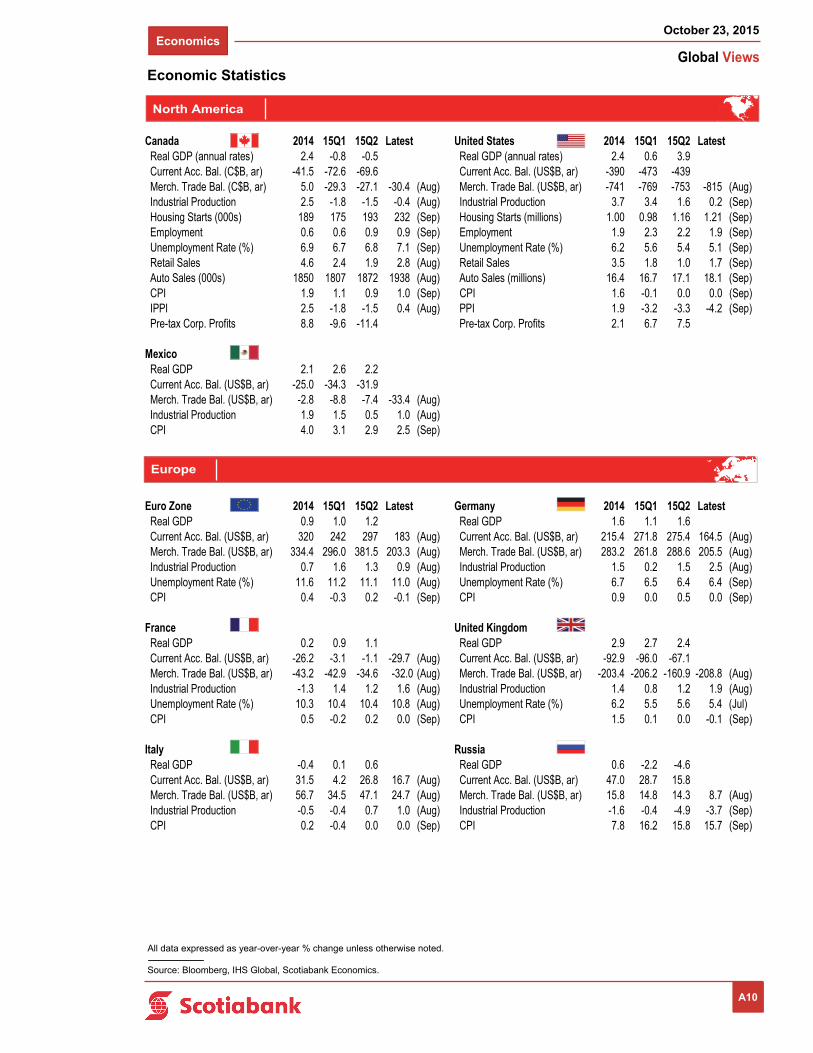
Economics
Global Views
October 23, 2015
8
North America
Canada 2014 15Q1 15Q2 Latest United States 2014 15Q1 15Q2 Latest Real GDP (annual rates) 2.4 -0.8 -0.5 Real GDP (annual rates) 2.4 0.6 3.9 Current Acc. Bal. (C$B, ar) -41.5 -72.6 -69.6 Current Acc. Bal. (US$B, ar) -390 -473 -439 Merch. Trade Bal. (C$B, ar) 5.0 -29.3 -27.1 -30.4 (Aug) Merch. Trade Bal. (US$B, ar) -741 -769 -753 -815 (Aug) Industrial Production 2.5 -1.8 -1.5 -0.4 (Aug) Industrial Production 3.7 3.4 1.6 0.2 (Sep) Housing Starts (000s) 189 175 193 232 (Sep) Housing Starts (millions) 1.00 0.98 1.16 1.21 (Sep) Employment 0.6 0.6 0.9 0.9 (Sep) Employment 1.9 2.3 2.2 1.9 (Sep) Unemployment Rate (%) 6.9 6.7 6.8 7.1 (Sep) Unemployment Rate (%) 6.2 5.6 5.4 5.1 (Sep) Retail Sales 4.6 2.4 1.9 2.8 (Aug) Retail Sales 3.5 1.8 1.0 1.7 (Sep) Auto Sales (000s) 1850 1807 1872 1938 (Aug) Auto Sales (millions) 16.4 16.7 17.1 18.1 (Sep) CPI 1.9 1.1 0.9 1.0 (Sep) CPI 1.6 -0.1 0.0 0.0 (Sep) IPPI 2.5 -1.8 -1.5 0.4 (Aug) PPI 1.9 -3.2 -3.3 -4.2 (Sep) Pre-tax Corp. Profits 8.8 -9.6 -11.4 Pre-tax Corp. Profits 2.1 6.7 7.5
Mexico Real GDP 2.1 2.6 2.2 Current Acc. Bal. (US$B, ar) -25.0 -34.3 -31.9 Merch. Trade Bal. (US$B, ar) -2.8 -8.8 -7.4 -33.4 (Aug) Industrial Production 1.9 1.5 0.5 1.0 (Aug) CPI 4.0 3.1 2.9 2.5 (Sep)
Euro Zone 2014 15Q1 15Q2 Latest Germany 2014 15Q1 15Q2 Latest Real GDP 0.9 1.0 1.2 Real GDP 1.6 1.1 1.6 Current Acc. Bal. (US$B, ar) 320 242 297 183 (Aug) Current Acc. Bal. (US$B, ar) 215.4 271.8 275.4 164.5 (Aug) Merch. Trade Bal. (US$B, ar) 334.4 296.0 381.5 203.3 (Aug) Merch. Trade Bal. (US$B, ar) 283.2 261.8 288.6 205.5 (Aug) Industrial Production 0.7 1.6 1.3 0.9 (Aug) Industrial Production 1.5 0.2 1.5 2.5 (Aug) Unemployment Rate (%) 11.6 11.2 11.1 11.0 (Aug) Unemployment Rate (%) 6.7 6.5 6.4 6.4 (Sep) CPI 0.4 -0.3 0.2 -0.1 (Sep) CPI 0.9 0.0 0.5 0.0 (Sep)
France United Kingdom Real GDP 0.2 0.9 1.1 Real GDP 2.9 2.7 2.4 Current Acc. Bal. (US$B, ar) -26.2 -3.1 -1.1 -29.7 (Aug) Current Acc. Bal. (US$B, ar) -92.9 -96.0 -67.1 Merch. Trade Bal. (US$B, ar) -43.2 -42.9 -34.6 -32.0 (Aug) Merch. Trade Bal. (US$B, ar) -203.4 -206.2 -160.9 -208.8 (Aug) Industrial Production -1.3 1.4 1.2 1.6 (Aug) Industrial Production 1.4 0.8 1.2 1.9 (Aug) Unemployment Rate (%) 10.3 10.4 10.4 10.8 (Aug) Unemployment Rate (%) 6.2 5.5 5.6 5.4 (Jul) CPI 0.5 -0.2 0.2 0.0 (Sep) CPI 1.5 0.1 0.0 -0.1 (Sep)
Italy Russia Real GDP -0.4 0.1 0.6 Real GDP 0.6 -2.2 -4.6 Current Acc. Bal. (US$B, ar) 31.5 4.2 26.8 16.7 (Aug) Current Acc. Bal. (US$B, ar) 47.0 28.7 15.8 Merch. Trade Bal. (US$B, ar) 56.7 34.5 47.1 24.7 (Aug) Merch. Trade Bal. (US$B, ar) 15.8 14.8 14.3 8.7 (Aug) Industrial Production -0.5 -0.4 0.7 1.0 (Aug) Industrial Production -1.6 -0.4 -4.9 -3.7 (Sep) CPI 0.2 -0.4 0.0 0.0 (Sep) CPI 7.8 16.2 15.8 15.7 (Sep)
Europe
All data expressed as year-over-year % change unless otherwise noted.
Economic Statistics
Source: Bloomberg, IHS Global, Scotiabank Economics.
A10
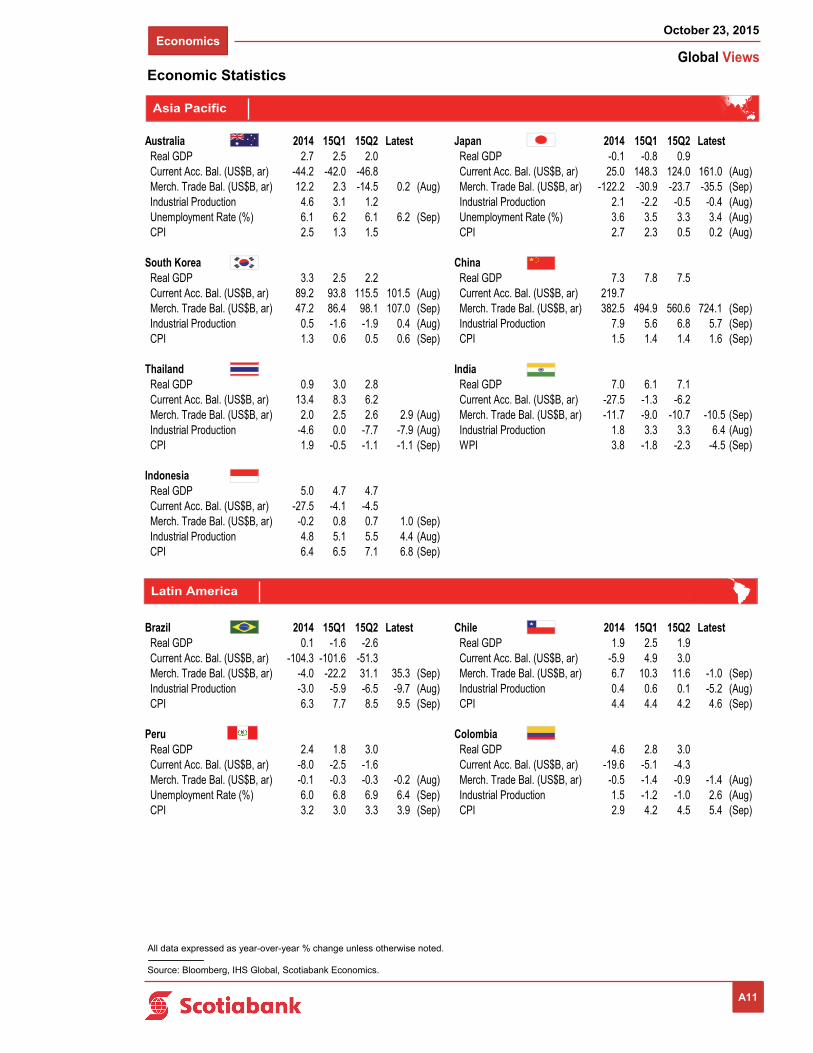
Economics
Global Views
October 23, 2015
9
Asia Pacific
Australia 2014 15Q1 15Q2 Latest Japan 2014 15Q1 15Q2 Latest Real GDP 2.7 2.5 2.0 Real GDP -0.1 -0.8 0.9 Current Acc. Bal. (US$B, ar) -44.2 -42.0 -46.8 Current Acc. Bal. (US$B, ar) 25.0 148.3 124.0 161.0 (Aug) Merch. Trade Bal. (US$B, ar) 12.2 2.3 -14.5 0.2 (Aug) Merch. Trade Bal. (US$B, ar) -122.2 -30.9 -23.7 -35.5 (Sep) Industrial Production 4.6 3.1 1.2 Industrial Production 2.1 -2.2 -0.5 -0.4 (Aug) Unemployment Rate (%) 6.1 6.2 6.1 6.2 (Sep) Unemployment Rate (%) 3.6 3.5 3.3 3.4 (Aug) CPI 2.5 1.3 1.5 CPI 2.7 2.3 0.5 0.2 (Aug)
South Korea China Real GDP 3.3 2.5 2.2 Real GDP 7.3 7.8 7.5 Current Acc. Bal. (US$B, ar) 89.2 93.8 115.5 101.5 (Aug) Current Acc. Bal. (US$B, ar) 219.7 Merch. Trade Bal. (US$B, ar) 47.2 86.4 98.1 107.0 (Sep) Merch. Trade Bal. (US$B, ar) 382.5 494.9 560.6 724.1 (Sep) Industrial Production 0.5 -1.6 -1.9 0.4 (Aug) Industrial Production 7.9 5.6 6.8 5.7 (Sep) CPI 1.3 0.6 0.5 0.6 (Sep) CPI 1.5 1.4 1.4 1.6 (Sep)
Thailand India Real GDP 0.9 3.0 2.8 Real GDP 7.0 6.1 7.1 Current Acc. Bal. (US$B, ar) 13.4 8.3 6.2 Current Acc. Bal. (US$B, ar) -27.5 -1.3 -6.2 Merch. Trade Bal. (US$B, ar) 2.0 2.5 2.6 2.9 (Aug) Merch. Trade Bal. (US$B, ar) -11.7 -9.0 -10.7 -10.5 (Sep) Industrial Production -4.6 0.0 -7.7 -7.9 (Aug) Industrial Production 1.8 3.3 3.3 6.4 (Aug) CPI 1.9 -0.5 -1.1 -1.1 (Sep) WPI 3.8 -1.8 -2.3 -4.5 (Sep)
Indonesia Real GDP 5.0 4.7 4.7 Current Acc. Bal. (US$B, ar) -27.5 -4.1 -4.5 Merch. Trade Bal. (US$B, ar) -0.2 0.8 0.7 1.0 (Sep) Industrial Production 4.8 5.1 5.5 4.4 (Aug) CPI 6.4 6.5 7.1 6.8 (Sep)
Brazil 2014 15Q1 15Q2 Latest Chile 2014 15Q1 15Q2 Latest Real GDP 0.1 -1.6 -2.6 Real GDP 1.9 2.5 1.9 Current Acc. Bal. (US$B, ar) -104.3 -101.6 -51.3 Current Acc. Bal. (US$B, ar) -5.9 4.9 3.0 Merch. Trade Bal. (US$B, ar) -4.0 -22.2 31.1 35.3 (Sep) Merch. Trade Bal. (US$B, ar) 6.7 10.3 11.6 -1.0 (Sep) Industrial Production -3.0 -5.9 -6.5 -9.7 (Aug) Industrial Production 0.4 0.6 0.1 -5.2 (Aug) CPI 6.3 7.7 8.5 9.5 (Sep) CPI 4.4 4.4 4.2 4.6 (Sep)
Peru Colombia Real GDP 2.4 1.8 3.0 Real GDP 4.6 2.8 3.0 Current Acc. Bal. (US$B, ar) -8.0 -2.5 -1.6 Current Acc. Bal. (US$B, ar) -19.6 -5.1 -4.3 Merch. Trade Bal. (US$B, ar) -0.1 -0.3 -0.3 -0.2 (Aug) Merch. Trade Bal. (US$B, ar) -0.5 -1.4 -0.9 -1.4 (Aug) Unemployment Rate (%) 6.0 6.8 6.9 6.4 (Sep) Industrial Production 1.5 -1.2 -1.0 2.6 (Aug) CPI 3.2 3.0 3.3 3.9 (Sep) CPI 2.9 4.2 4.5 5.4 (Sep)
Latin America
Economic Statistics
All data expressed as year-over-year % change unless otherwise noted.
Source: Bloomberg, IHS Global, Scotiabank Economics.
A11
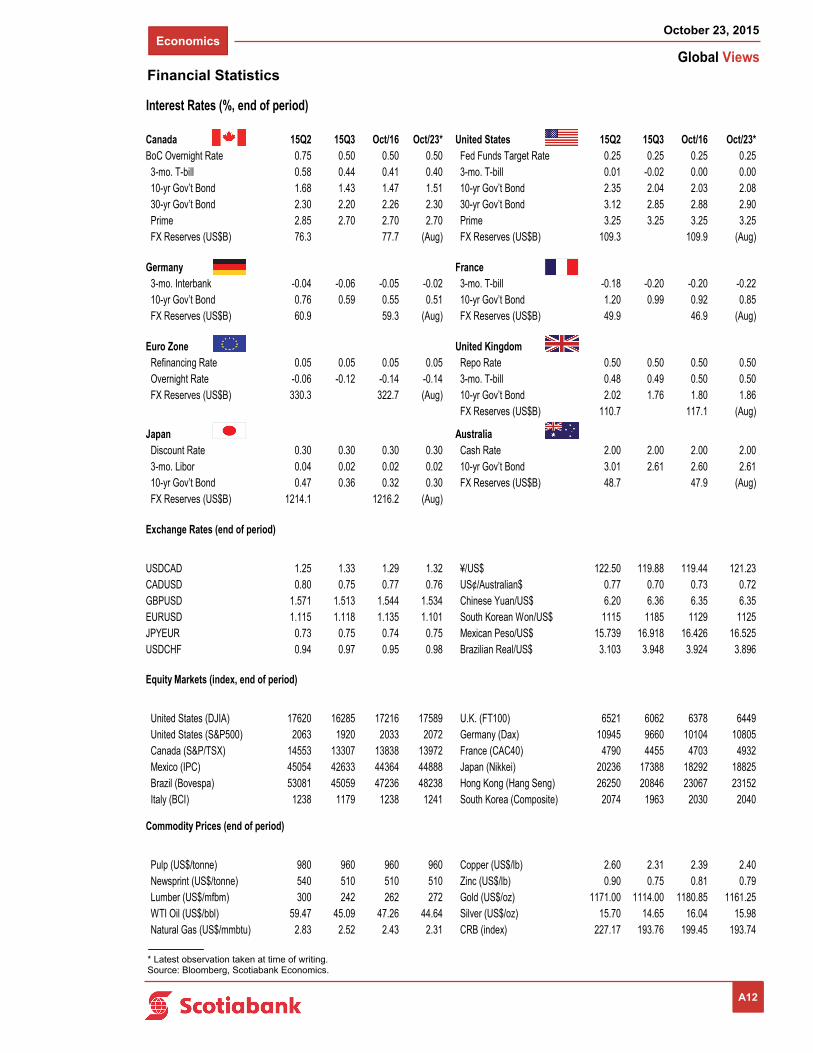
Economics
Global Views
October 23, 2015
10
Financial Statistics
A12
Interest Rates (%, end of period)
Canada 15Q2 15Q3 Oct/16 Oct/23* United States 15Q2 15Q3 Oct/16 Oct/23*BoC Overnight Rate 0.75 0.50 0.50 0.50 Fed Funds Target Rate 0.25 0.25 0.25 0.25 3-mo. T-bill 0.58 0.44 0.41 0.40 3-mo. T-bill 0.01 -0.02 0.00 0.00 10-yr Gov’t Bond 1.68 1.43 1.47 1.51 10-yr Gov’t Bond 2.35 2.04 2.03 2.08 30-yr Gov’t Bond 2.30 2.20 2.26 2.30 30-yr Gov’t Bond 3.12 2.85 2.88 2.90 Prime 2.85 2.70 2.70 2.70 Prime 3.25 3.25 3.25 3.25 FX Reserves (US$B) 76.3 77.7 (Aug) FX Reserves (US$B) 109.3 109.9 (Aug)
Germany France 3-mo. Interbank -0.04 -0.06 -0.05 -0.02 3-mo. T-bill -0.18 -0.20 -0.20 -0.22 10-yr Gov’t Bond 0.76 0.59 0.55 0.51 10-yr Gov’t Bond 1.20 0.99 0.92 0.85 FX Reserves (US$B) 60.9 59.3 (Aug) FX Reserves (US$B) 49.9 46.9 (Aug)
Euro Zone United Kingdom Refinancing Rate 0.05 0.05 0.05 0.05 Repo Rate 0.50 0.50 0.50 0.50 Overnight Rate -0.06 -0.12 -0.14 -0.14 3-mo. T-bill 0.48 0.49 0.50 0.50 FX Reserves (US$B) 330.3 322.7 (Aug) 10-yr Gov’t Bond 2.02 1.76 1.80 1.86
FX Reserves (US$B) 110.7 117.1 (Aug)
Japan Australia Discount Rate 0.30 0.30 0.30 0.30 Cash Rate 2.00 2.00 2.00 2.00 3-mo. Libor 0.04 0.02 0.02 0.02 10-yr Gov’t Bond 3.01 2.61 2.60 2.61 10-yr Gov’t Bond 0.47 0.36 0.32 0.30 FX Reserves (US$B) 48.7 47.9 (Aug) FX Reserves (US$B) 1214.1 1216.2 (Aug)
Exchange Rates (end of period)
USDCAD 1.25 1.33 1.29 1.32 ¥/US$ 122.50 119.88 119.44 121.23CADUSD 0.80 0.75 0.77 0.76 US¢/Australian$ 0.77 0.70 0.73 0.72GBPUSD 1.571 1.513 1.544 1.534 Chinese Yuan/US$ 6.20 6.36 6.35 6.35EURUSD 1.115 1.118 1.135 1.101 South Korean Won/US$ 1115 1185 1129 1125JPYEUR 0.73 0.75 0.74 0.75 Mexican Peso/US$ 15.739 16.918 16.426 16.525USDCHF 0.94 0.97 0.95 0.98 Brazilian Real/US$ 3.103 3.948 3.924 3.896
Equity Markets (index, end of period)
United States (DJIA) 17620 16285 17216 17589 U.K. (FT100) 6521 6062 6378 6449 United States (S&P500) 2063 1920 2033 2072 Germany (Dax) 10945 9660 10104 10805 Canada (S&P/TSX) 14553 13307 13838 13972 France (CAC40) 4790 4455 4703 4932 Mexico (IPC) 45054 42633 44364 44888 Japan (Nikkei) 20236 17388 18292 18825 Brazil (Bovespa) 53081 45059 47236 48238 Hong Kong (Hang Seng) 26250 20846 23067 23152 Italy (BCI) 1238 1179 1238 1241 South Korea (Composite) 2074 1963 2030 2040
Commodity Prices (end of period)
Pulp (US$/tonne) 980 960 960 960 Copper (US$/lb) 2.60 2.31 2.39 2.40 Newsprint (US$/tonne) 540 510 510 510 Zinc (US$/lb) 0.90 0.75 0.81 0.79 Lumber (US$/mfbm) 300 242 262 272 Gold (US$/oz) 1171.00 1114.00 1180.85 1161.25 WTI Oil (US$/bbl) 59.47 45.09 47.26 44.64 Silver (US$/oz) 15.70 14.65 16.04 15.98 Natural Gas (US$/mmbtu) 2.83 2.52 2.43 2.31 CRB (index) 227.17 193.76 199.45 193.74
* Latest observation taken at time of writing. Source: Bloomberg, Scotiabank Economics.
A12
Global Views
October 23, 2015
Fixed Income Strategy (London) www.gbm.scotiabank.com © 2012, The Bank of Nova Scotia This material, its content, or any copy of it, may not be altered in any way, transmitted to, copied or distributed to any other party without the prior express written consent of ScotiabankTM. This material has not been prepared by a member of the research department of Scotiabank, it is solely for the use of sophisticated institutional investors, and this material does not constitute investment advice or any personal recommendation to invest in a financial instrument or “investment research” as defined by the Financial Services Authority. This material is provided for information and discussion purposes only. An investment decision should not be made solely on the basis of the contents of this publication. It is not to be construed as a solicitation or an offer to buy or sell any financial instruments and has no regard to the specific investment objectives, financial situation or particular needs of any recipient. It is not intended to provide legal, tax, accounting or other advice and recipients should obtain specific professional advice from their own legal, tax, accounting or other appropriate professional advisers before embarking on any course of action. The information in this material is based on publicly available information and although it has been compiled or obtained from sources believed to be reliable, such information has not been independently verified and no guarantee, representation or warranty, express or implied, is made as to its accuracy, completeness or correctness. Information included in this material related to comparison performance (whether past or future) or simulated performance (whether past or future) is not a reliable indicator of future returns. This presentation is not directed to or intended for use by any person resident or located in any country where the distribution of such information is contrary to the laws of such country. Scotiabank its directors, officers, employees or clients may currently or from time to time own or hold interests in long or short positions in any securities referred to herein, and may at any time make purchases or sales of these securities as principal or agent. Scotiabank may also have provided or may provide investment banking, capital markets or other services to the companies referred to in this communication.
TM Trademark of The Bank of Nova Scotia. Used under license, where applicable. Scotiabank, together with "Global Banking and Markets", is a marketing name for the global corporate and investment banking and capital markets businesses of The Bank of Nova Scotia and certain of its affiliates in the countries where they operate, including Scotia Capital Inc., Scotia Capital (USA) Inc., Scotiabanc Inc.; Citadel Hill Advisors L.L.C.; The Bank of Nova Scotia Trust Company of New York; Scotiabank Europe plc; Scotia Capital (Europe) Limited; Scotiabank (Ireland) Limited; Scotiabank Inverlat S.A., Institución de Banca Múltiple, Scotia Inverlat Casa de Bolsa S.A. de C.V., Scotia Inverlat Derivados S.A. de C.V. – all members of the Scotiabank Group and authorized users of the mark. The Bank of Nova Scotia is incorporated in Canada with limited liability. Scotia Capital Inc. is a member of CIPF. Scotia Capital (USA) Inc. is a registered broker-dealer with the SEC and is a member of the NASD and SIPC. The Bank of Nova Scotia, Scotiabank Europe plc, Scotia Capital (Europe) Limited and Scotia Capital Inc. are each authorised and regulated by the Financial Services Authority (FSA) in the U.K. Scotiabank Inverlat, S.A., Scotia Inverlat Casa de Bolsa, S.A. de C.V., and Scotia Derivados, S.A. de C.V., are each authorized and regulated by the Mexican financial authorities. Fixed Income Strategy (Paris) Disclaimer © 2011, The Bank of Nova Scotia This material, its content, or any copy of it, may not be altered in any way, transmitted to, copied or distributed to any other party without the prior express written consent of Scotiabank™. This material has not been prepared by a member of the research department of Scotiabank, it is solely for the use of sophisticated institutional investors, and this material does not constitute investment advice or any personal recommendation to invest in a financial instrument or “investment research” as defined by the Financial Services Authority. This material is provided for information and discussion purposes only. An investment decision should not be made solely on the basis of the contents of this publication. It is not to be construed as a solicitation or an offer to buy or sell any financial instruments and has no regard to the specific investment objectives, financial situation or particular needs of any recipient. It is not intended to provide legal, tax, accounting or other advice and recipients should obtain specific professional advice from their own legal, tax, accounting or other appropriate professional advisers before embarking on any course of action. The information in this material is based on publicly available information and although it has been compiled or obtained from sources believed to be reliable, such information has not been independently verified and no guarantee, representation or warranty, express or implied, is made as to its accuracy, completeness or correctness. Information included in this material related to comparison performance (whether past or future) or simulated performance (whether past or future) is not a reliable indicator of future returns. This presentation is not directed to or intended for use by any person resident or located in any country where the distribution of such information is contrary to the laws of such country. Scotiabank its directors, officers, employees or clients may currently or from time to time own or hold interests in long or short positions in any securities referred to herein, and may at any time make purchases or sales of these securities as principal or agent. Scotiabank may also have provided or may provide investment banking, capital markets or other services to the companies referred to in this communication.
Disclaimer

Scotiabank Economics
Scotia Plaza 40 King Street West, 63rd Floor
Toronto, Ontario Canada M5H 1H1
Tel: 416.866.6253 Fax: 416.866.2829
Email: [email protected]
For general and publication-related inquiries, contact
us by telephone, email and/or fax.
Scotiabank Economics
This report has been prepared by Scotiabank Economics as a resource for the clients of Scotiabank. Opinions, estimates and projections contained herein are our own as of the date hereof and are subject to change without notice. The information and opinions contained herein have been compiled or arrived at from sources believed reliable but no representation or warranty, express or implied, is made as to their accuracy or completeness. Neither Scotiabank nor its affiliates accepts any liability whatsoever for any loss arising from any use of this report or its contents. TM Trademark of The Bank of Nova Scotia. Used under license, where applicable.
Disclaimer
Global Views
October 23, 2015