Embed Size (px)
Citation preview

Nuclear Physics A519 (1990) 61 l-630
North-Holland
GLOBAL VARIABLES AND IMPACT PARAMETER DETERMINATION
IN NUCLEUS-NUCLEUS COLLISIONS BELOW 100 MeVh
J. PETER’, D. CUSSOL’, Cl. BIZARD’, R. BROU’, M. LOUVEL’,
J.P. PATRY’, R. REGIMBART’, J.C. STECKMEYER’, J.P. SULLIVAN’, B. TAMAIN’,
E. CREMA’+, H. DOUBRE’, K. HAGEL’***, G.M. JIN’*‘, A. PEGHAIRE*,
F. SAINT-LAURENT’, Y. CASSAGNOU3, R. LEGRAINs, C. LEBRUN4, E. ROSATO’,
R. MacGRATH6, S.G. JEONG*, S.M. LEE’, Y. NAGASHIMA’, T. NAKAGAWA’,
M. OGIHARA’, J. KASAG19 and T. MOTOBAYASHI’~2~9
’ LPC Caen, ISMRA, IN2P3-CNRS, 14050 Caen, France
’ GANIL, BP5027, 14021 Caen, France
3 DPhN/SEPN, CEN Saclay, 91191 Gtf Sur Yvette, France 4 LPN, 2 Rue Houssiniere, 44072 Nantes, France
5 Dipart. di Scienze Fisiche, Univ. di Napoli, Italy 6 SUNY, Stony Brook, USA
’ Inst. of Modern Physics, PG Box 31 Lanzhou, China
’ Inst. of Physics, Univ. of Tsukuba, Japan
9 Dept. of Physics, Tokyo Inst. of Technology, Tokyo, Japan I0 Rikkyo University, Tokyo, Japan
Received 12 June 1990
Abstract: Several global variables are tested for determining the impact parameter in 4?r measurements
of charged products. For the system Art Al from 25 to 85 MeV/u, simulated reactions are used
to study the correlation between the real impact parameter value and the experimentally determined
one. Even with a perfect detector, the total multiplicity and the mid-rapidity charge give a poor
correlation. Filtering through the acceptance of an actual detector (Mur + Tonneau at GANIL)
provides a poor correlation with the total charge, and an acceptable one with the total perpendicular
momentum. The average (mass weighted) parallel velocity V,, gives the best correlation and is less
sensitive to the incident energy and to the mechanisms used in the simulation. Measurements
extending to very forward angles are needed to accurately sort events by impact parameter. Real data are used to study the variation of other global variables versus V,, : they exhibit the expected
average trend, with broad fluctuations. The eccentricity and flow angle allow the evolution of
central reactions with the incident energy to be followed. The proportion of relative motion
transformed into energy perpendicular to the beam direction decreases when the incident energy
increases; its absolute value, however, doubles from 25 to 65 MeV/u.
In experimental studies where good separation between participant (pre-equilibrium) and spec-
tator (equilibrium) particles is wanted in addition to good impact parameter sorting, the projectile
mass should be in the range 1.2-2.5 times the target mass.
NUCLEAR REACTIONS 27Al(40Ar, X), E = 25-85 MeV/nucleon; measured all charged
E products with multidetectors. Event-by-event analysis. Determined which global variable
leads to the most correct impact parameter value. Studied correlations between several
global variables.
l Permanent address: Inst. de Fisico, Univ. de Sao Paulo, Brazil.
l * Present address: Cyclotron Institute, Texas A & M Univ. College Station, USA.
03759474/90/%03.50 @ 1990 - Elsevier Science Publishers B.V. (North-Holland)

612 J. Pe’ter et al. / Global variables
1. Introduction
Exclusive detection of reaction products provides a powerful tool for studying nucleus-nucleus collisions at intermediate energies. Such measurements are made using the 4~ arrays which have been developed and built in recent years at intermediate-energy heavy-ion facilities l-699).
In analyzing the data, the events have to be sorted according to their impact parameter value b. Actually, there is no way to directly measure 6. What can be measured is the violence of the collision, i.e. the amount of the initial relative motion (between the projectile and target nuclei) which is transformed into other forms of energy. The basic assumption is: the larger this amount, the larger the interaction volume of the two nuclei, i.e. the smaller the impact parameter. Once the events are sorted according to the violence of the collision, their cross sections give b via da = 2rrb db, b = 0 corresponding to the most violent event.
The violence of the collision is expressed through the value of a global variable; several global variables have been used in the study of reactions induced by relativistic heavy ions. The main purpose of this paper is to determine which one is the best one for determining b at energies below 100 MeV/u, via simulated reactions and detectors. Then, the other global variables will be used to study the general trends of actual reactions. The system chosen here is 40Ar projectiles from 25 to 85 MeV/u on an “Al target, studied at GANIL with the multidetectors Mur and Tonneau. The maximum interaction distance is 1.25 (401’3 + 27 1’3) = 8 fm, corre- sponding to a geometric reaction cross section of 2 b.
The simulation of events and the limitations of the detector will be discussed in sect. 2. Due to the detector limitations, the information obtained on some events is incomplete to such an extent that their analysis would be meaningless. The rejection of these badly measured events will be discussed in sect. 3. In sect. 4, simulated events will be used to test the correlation beXP versus breal obtained with 5 global variables and determine which one should be used to sort the real events. In sect. 5, experimental data are used to study the information on the reaction brought by the other global variables. Sect. 6 contains the summary and conclusions.
2. Simulation and detectors
The quality of the impact parameter determination is expressed by the correlation between the real b value and the experimentally determined value. It is affected by two factors: first, the sensitivity of the global variable to the violence of the collision and second, the distortion of the value of the global variable due to the characteristics of the detectors. We will first study the correlation be_, versus breal for a perfect 47r array for charged products, i.e. a detector which would measure accurately the charge, mass, velocity, polar and azimuthal angles of all charged products. In the analysis we put a low velocity threshold. This is to avoid finding a constant value
J. P&r et al. I Global variables 613
for some global variables (total detected charge, average parallel velocity). This threshold mostly eliminates the target-like spectators or residue. The results are not sensitive to the value of this threshold, in the range l-3 cm/ns (i.e. 0.5-4.5 MeV/u). We use the same trigger condition as in the real experiment - at least two charged products must be “detected”.
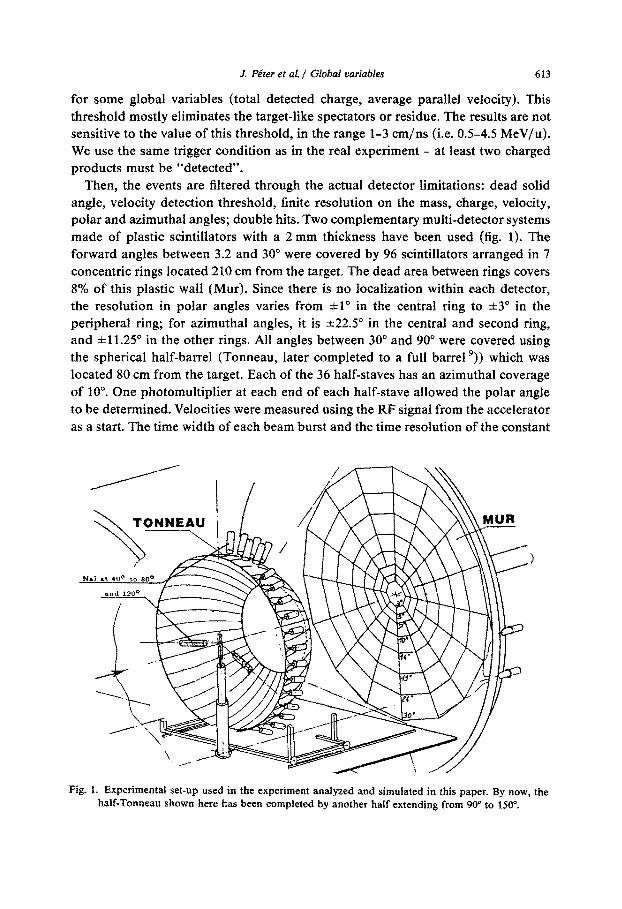
Then, the events are filtered through the actual detector limitations: dead solid angle, velocity detection threshold, finite resolution on the mass, charge, velocity, polar and azimuthal angles; double hits. Two complementary multi-detector systems made of plastic scintillators with a 2 mm thickness have been used (fig. 1). The forward angles between 3.2 and 30” were covered by 96 scintillators arranged in 7 concentric rings located 210 cm from the target. The dead area between rings covers 8% of this plastic wall (Mur). Since there is no localization within each detector, the resolution in polar angles varies from *lo in the central ring to &3” in the peripheral ring; for azimuthal angles, it is ~t22.5” in the central and second ring, and zt11.25” in the other rings. All angles between 30” and 90” were covered using the spherical half-barrel (Tonneau, later completed to a full barrel ‘)) which was located 80 cm from the target. Each of the 36 half-staves has an azimuthal coverage of 10”. One photomultiplier at each end of each half-stave allowed the polar angle to be determined. Velocities were measured using the RF signal from the accelerator as a start. The time width of each beam burst and the time resolution of the constant
Fig. 1. Experimental set-up used in the experiment analyzed and simulated in this paper. By now, the hatf-Tonneau shown here has been completed by another half extending from 90” to 150”.
614 J. P&er et al. / Global variables
fraction discriminator resulted in a time resolution of 1.5 ns. Elements were separated using the energy versus time-of-flight technique. For particles stopping in the scintillator, deuterons are mixed with alpha particles (i.e. below 13.5 MeV per nucleon) and the heavier elements are poorly separated. The gains of the multipliers were set such that charges above 8 saturate the charge-to-digital converter and are taken as 9 in the analysis.
To prevent electrons from the target from reaching the scintillator, Mur was covered by aluminium sheets 200 pm thick, which results in a velocity threshold ranging from 3 cm/ns (4.5 MeV/u) for light particles to 5 cm/ns (12.5 MeV/u) for 2 = 10. On Tonneau, the thickness was 100 urn resulting in lower threshold values.
The simulated events are produced by a code which simulates the reaction mechanisms. Those mechanisms are not well known (their study is the aim of these experiments!) and the simulation is not reality. To be reliable, the impact parameter sorting should be independent of the reaction mechanism. We have used two extreme mechanisms. In this range of energies, mean field effects decrease to the benefit of nucleon-nucleon collisions. If mean field effects are dominant “incomplete fusion” or “massive transfer” occurs: the interaction volume sticks to the heavy nucleus (here, the projectile), a heavy fast moving nucleus carries most of the excitation energy and a light slow nucleus has a small excitation energy. Both de-excite via evaporation of particles and fragments. The interaction volume has been taken as the participants in the fire-ball geometry ‘) with some fluctuations about the number of protons and neutrons it contains. Other assumptions could be made, provided the violence of the collision increases when b decreases. A correction would be to add some pre-equilibrium emission of particles at the beginning of the collision, as indicated by experimental results “).
The other extreme is to use a participant-spectator model, where the very excited interaction volume separates from the cold projectile-spectator and target-spectator nuclei. A correction would be to give some excitation energy to these spectators.
In the de-excitation part, the complete calculation of all possible decay channels would lead to a complicated and slow code. These sophisticated formulae would provide a false accuracy, since the reaction mechanisms are more complex. We preferred to use simple recipes and check the sensitivity of the correlation bexp versus brea, to the parameter values used. The probability of emission of heavier charged fragments is significant due to large angular momenta brought in the excited nuclei and to the possibility of multifragmentation into several large pieces. This significant probability has been modeled by a l/A mass dependence of the evaporated fragments widths instead of the exponential decrease given by the Coulomb barrier in the partial widths of different particles. That makes the bexp versus breal correlations broader, i.e. they may be somewhat pessimistic, but we consider them as more realistic. Two shapes of the angular distribution of particles, in the center-of-mass of the emitter nucleus, have been tried: isotropic or forward-backward peaked. Both give almost the same correlations.

J. Hter et al. / Global va~ables 615
Hereafter, we will show the results obtained at 45 MeV/u with the incomplete fusion mechanism, unless otherwise specified. The result obtained with the par- ticipant-spectator model and the effect of the incident energy will be described.
3. Selection of well measured events
How to ensure that sufficient information has been obtained in an event? The initial projectile linear momentum Pproj is equal to the sum Pll of the components parallel to the beam direction of all final products. With a perfect charged particle detector, the sum is lower than Pploj by about lO%, due to the emission of undetected neutrons: fig. 2 (left). With the actual detector, a further reduction occurs, since some particles are not detected or their charge is not correct (mostly 2 > 9 taken as 9): fig. 2 (center). In central and mid-central collisions, a few unlucky events reach a total parallel momentum as low as 50% of Pproj (i.e. 60% of a perfect detector), but most of them have a higher value. In mid-peripheral reactions, two components show up. The lower momentum component is due to the non-detection of the projectile-like fragment. Indeed, the grazing angle is close to 1” and most of the projectile-like fragments are not emitted above 3.2”, the minimum detection angle in Mur.
The distribution of experimental data, shown at right, is quite similar to the sum of the simulated responses for the different impact parameters.
The events whose Pii is larger than 60% Pproj are “well measured” events which are kept for further analysis. “Badly measured” events are used only to correct the cross sections. We verified that well measured events with multiplicity ZJ become identical to badly measured events with multiplicity v- 1, when their heaviest fragment is removed from the analysis. The cross section is obtained by adding the badly measured events with v - 1 to well measured events with v. As seen in fig. 2, the correction is negligible for central collisions, very small for mid-central ones and becomes significant for mid-peripheral collisions.
The “measured” cross section with the perfect detector is 1470 mb, corresponding to b between 0 and 7 fm. Most peripheral reactions, between 7 and 8 fm, are eliminated by the trigger condition (Y 2 2) since the detection threshold prevents the detection of the target-like product. After filtering with the actual detector, the “measured” cross section becomes 1270 mb, due to peripheral reactions for which only one product at forward angles is detected instead of two. This cross section is consistent with the experimental value (1350 f 50 mb).
4. Simulated response of several global variables
The sorting of events versus their impact parameter value should fulfill the following requirements:
(i) it should be independent of the incident energy (in the range 25-100 MeV/u).

616 Js P&er et al. / Global variables
I
2D -- I-2fm 20 . . .._ 3-4 - 5-6
V
- I -2fm exp.
0 Pproj
0 0
Total parallel momentum P/1
Fig. 2. Simulated and experimental data. Distribution of charged products multiplicity v and measured total parallel momentum PiI. @Ar on 27A1 at 45 MeV/u. Lefr part: distribution simulated for 3 impact parameter bins (central, intermediate and mid-peripheral) measured with a perfect 4?r array. The contour levels are differential cross section d*o/dv, dP,i : 0.01, 0.1,0.3, 1 mb (MeV/c). Ce~r~a~p~rf: same events, after applying a software filter which reproduces the defects of the array used in the experiment. Right part: experimentally measured distribution. Events with PI, greater than 0.6 x Ppcoj are “well measured”
events kept for furtber analysis.
(ii) it should be independent of the reaction mechanism. Indeed, the reaction mechanism changes in the range of energy studied and the best sorting could be obtained with different global variables at different energies. But that would make it hazardous to compare results obtained at different energies.
(iii) a clear physical meaning of the value of the variable would help to verify the absence of mistakes in experimental data.
First, the study will be made with variables which use only a part of the info~ation obtained: multiplicity, total charge, mid-rapidity charge. Then, we will try two variables which make use of the ful information and are thus expected to be better: total perpendicular momentum, and average parallel velocity.
4.1. METHOD
The method used to get the correlation between the real value of b and the experimentally determined one is illustrated in fig. 3. The global variable is the multiplicity of charged products measured with a perfect 47r array (with an analysis threshold velocity of 2 cm/ns (c/15) and the trigger condition va2); the curve labelled 1 is the multiplicity dist~bution obtained for reactions with bECat from 0 to 1 fm, i.e. 31 mb; the average multiplicity is large, since almost all the available energy
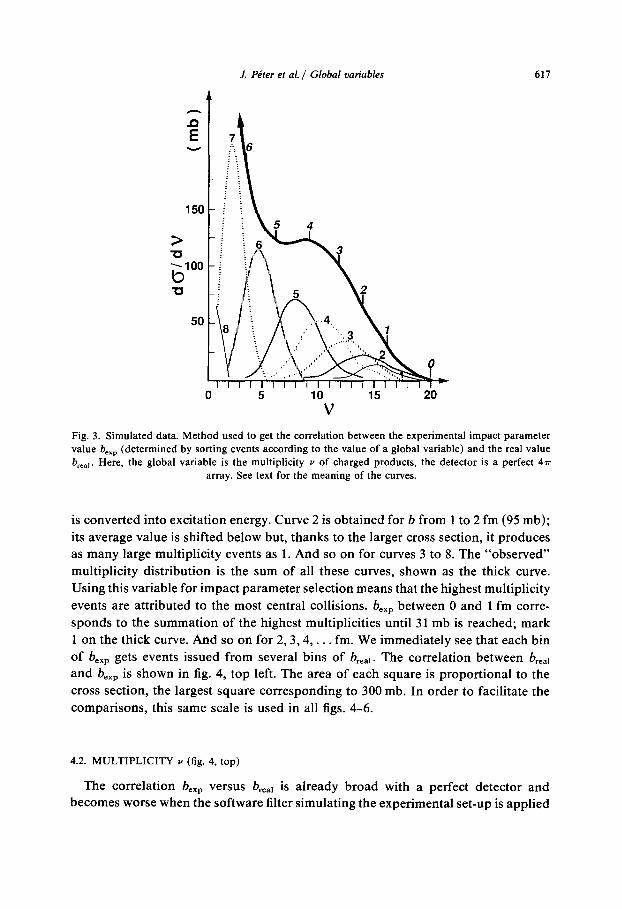
J. Pe’ter et al. / Global variables 617
V
Fig. 3. Simulated data. Method used to get the correlation between the experimental impact parameter
value be._ (determined by sorting events according to the value of a global variable) and the real value
b,,,,. Here, the global variable is the multiplicity Y of charged products, the detector is a perfect 47r
array. See text for the meaning of the curves.
is converted into excitation energy. Curve 2 is obtained for b from 1 to 2 fm (95 mb);
its average value is shifted below but, thanks to the larger cross section, it produces
as many large multiplicity events as 1. And so on for curves 3 to 8. The “observed”
multiplicity distribution is the sum of all these curves, shown as the thick curve.
Using this variable for impact parameter selection means that the highest multiplicity
events are attributed to the most central collisions. be._, between 0 and 1 fm corre-
sponds to the summation of the highest multiplicities until 31 mb is reached; mark
1 on the thick curve. And so on for 2,3,4,. . . fm. We immediately see that each bin of b exp gets events issued from several bins of breal. The correlation between b,,,,
and bexp is shown in fig. 4, top left. The area of each square is proportional to the
cross section, the largest square corresponding to 300 mb. In order to facilitate the
comparisons, this same scale is used in all figs. 4-6.
4.2. MULTIPLICITY v (fig. 4, top)
The correlation be._ versus breal is already broad with a perfect detector and becomes worse when the software filter simulating the experimental set-up is applied

618 J. Peter et al. / Global variables
7
6
5
4
3
2
1
bexp 0 7
6
5
4
3
2
1
0 12345678
7 6
5
4
3
2
1
9
6
5
4
3
2
1
0
b real b real
Fig. 4. Simulated data. Correlation in bins 1 fm wide between be._, (vertical axis) and b_, (horizontal
axis) obtained in simulated reactions sorted according to the value of a global variable Ar+AI at
45 MeV/u. The area of each square is proportional to the cross section of events; the scale is given by
the area of the square in the right-bottom corner, equal to 300 mb. The cross sections n-b2 corresponding
to b = 1,2,. . . fm are indicated in mb. Leftpart: assuming the 4?r array has a detection velocity threshold,
but is otherwise perfect. Right part: after filtering through the simulated actual detector array. On top,
the global variable is the multiplicity v of charged products. Bottom, it is the total detected charge.
(top right): events attributed to bin 2-3 fm come from breal values ranging from 0
to 6 fm.
Both reaction mechanisms give the same correlations.
4.3. TOTAL DETECTED CHARGE z 2 (fig. 4, bottom)
With a perfect detector, all charges are detected, except the slow target-like
fragment or residue and its de-excitation products whose velocities are below the
detection threshold. Since the number of charges in the interaction volume increases,
on the average, with the interaction volume, the correlation bexp versus breal is rather
narrow with a perfect detector. With an actual detector, unfortunately, the correlation
is as bad as with V. Indeed, since the interaction volume is a sensitive function of
b, missing one moderately heavy product (2 > 3) decreases C Z to a value which
J. Peter et al. I Global variables 619
corresponds to several fermis above the real b value. Moreover, the result is sensitive
to the de-excitation step: if heavy fragments are produced in larger quantities
(multi-fragmentation), then the correlation is worse.
Both reaction mechanisms give almost the same correlations.
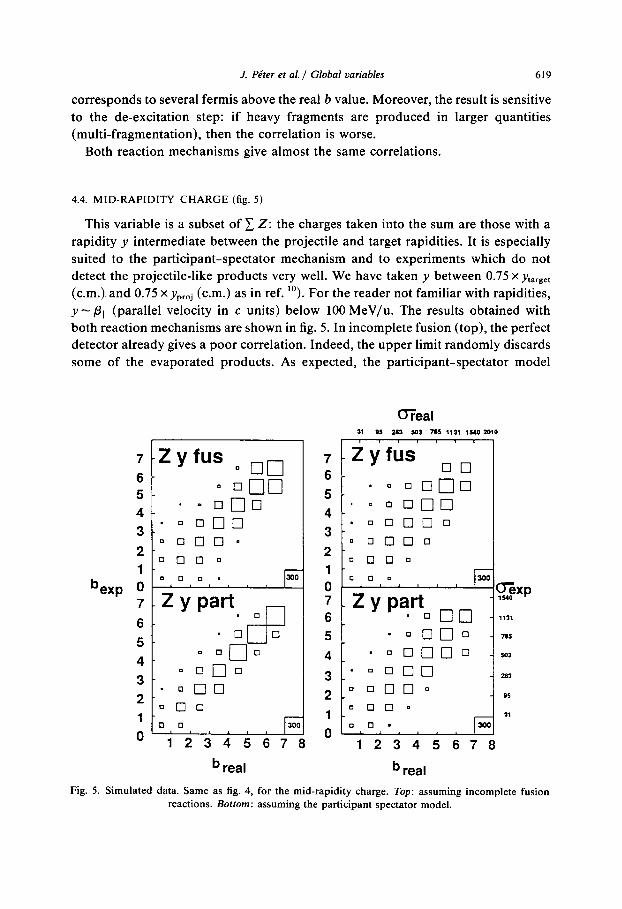
4.4. MID-RAPIDITY CHARGE (fig. 5)
This variable is a subset of 12: the charges taken into the sum are those with a
rapidity y intermediate between the projectile and target rapidities. It is especially
suited to the participant-spectator mechanism and to experiments which do not
detect the projectile-like products very well. We have taken y between 0.75 x ytarget
(c.m.) and 0.75 Xyp,oj ( . .) c m as in ref. lo). For the reader not familiar with rapidities,
y - pII (parallel velocity in c units) below 100 MeV/u. The results obtained with
both reaction mechanisms are shown in fig. 5. In incomplete fusion (top), the perfect
detector already gives a poor correlation. Indeed, the upper limit randomly discards
some of the evaporated products. As expected, the participant-spectator model
1 ,-
0 q n 7 n n ’ s 12345678
b real
El cl
b real
Fig. 5. Simulated data. Same as fig. 4, for the mid-rapidity charge. Top: assuming incomplete fusion
reactions. Bottom: assuming the participant spectator model.

620 J. P&er et al. j Global variables
gives a good correlation. With an actual detector, the reaction mechanisms, for the same reason as for C 2.
4.5. TOTAL PERPENDICULAR MOMENTUM (fig. 6, top)
It is equal to:
correlation is poor for both
(1)
where mi is the mass, Vi the laboratory velocity, @, the laboratory polar angle and -yi the relativistic parameter of each of the v detected products.
This variable, or the total perpendicular kinetic energy, is often used in collisions at relativistic energies. We prefer to use momenta since our detectors measure velocities and charges. The largest values are attributed to central collisions. The correlation is rather good, both with the perfect detector and the actual one. It is not sensitive to the reaction mechanism.
7
6 5
4
3
2
1
%xp O 7
6
5
4
3
2
1
0 12345678
b real
Ll ” 12345678
b real
Fig. 6. Simulated data. Same as fig. 4 for the total perpendicular momentum (top) and the average parallel velocity V,, (bottom).

J. Pe’ter et al. / Global variables
4.6. AVERAGE PARALLEL VELOCITY V,, (fig. 6, bottom)
621
This method is based on linear momentum conservation. After the collision, the
projectile momentum Pproj is found in the sum of the parallel momenta of all final
particles. The average (mass-weighted) parallel velocity of these particles is:
v =CF=* miYiV, cos ei a” Cr=* WYi .
(2)
V,, is simply the velocity which, when multiplied by the detected mass (denominator
in 2), gives the parallel momentum detected in the event (numerator).
If all particles, including neutrons, were measured, the numerator would be the
total mass of the system and V,, would be nothing but the center-of-mass velocity
V c,m,, for any event. For a perfect charged product detector, the absence of neutrons
produces some fluctuation and V,, - V,.,. . To get a variation of V,, with b, we make
use of the fact that the target nucleons not located in the interaction region (“spec-
tators”) have a very low velocity. In the analysis of the perfect detector data, a
small velocity threshold eliminates these nucleons. Whether they are isolated or
form a target-like product does not make any difference. The remaining nucleons
are all the projectile nucleons and the target nucleons which were in the interaction
region. The maximum value of V,, is V,, obtained in very peripheral reactions where
the denominator is the projectile mass. Its minimum value is reached in head-on
collisions. When the target is heavier than the projectile nucleus, some part of the
target might be left as “spectator” and this minimum value is then larger than V,.,. .
In reverse kinematics, the whole target nucleus is involved in the interaction (no
“target spectator nucleons”), this minimum value is I(,.,..
With the real detector Mur + Tonneau, the velocity threshold which eliminates
the “spectator” target nucleons is due to the aluminum foil which is used to prevent
the detection of electrons (sect. 2).
The sorting is made by attributing the minimum values of V,, to the most central
reactions. With a perfect detector and a low velocity threshold in the analysis, V,,
gives a very good correlation, bexp versus breal similar to C 2. When it is filtered
through the actual detector, the correlation broadens, but remains better than with
the other global variables. The reason is that, in eq. (2), the errors in the numerator
and the denominator due to the missed particles cancel each other to a large extent.
The correlation is not sensitive to the reaction mechanism.
An average perpendicular velocity could be defined, similarly to V,,, by dividing
the measured total perpendicular momentum (1) by the total detected mass: it is
formula (2) with cos 8i replaced by sin 0:. We did not check this variable.
4.7. INFLUENCE OF THE INCIDENT ENERGY
The feature common to all variables is a clear weakening of the correlation when
the incident energy decreases. Three effects play a role (1) the smaller number of

622 _I. P&r ef al. / Global variabies
products: (missing one of them in a dead area makes a larger relative error); (2) a larger propo~ion of products fall below the detection threshold, (3) in central collisions, most evaporation residues have a charge greater than 9 and are thus poorly measured, whereas at 45 MeV/u and above such heavy residues are scarce.
The correlations improve when the energy increases above 45 MeV/u, but the improvement is small, since most products are well measured already at 45 MeV/u.
4.8. CONCLUSION
At 45 MeV/u, the best be_, versus breal correlations are obtained with the mid- rapidity charge (if the participant-spectator model applies), the total perpendicular momentum and the average parallel velocity. The participant spectator model is unrealistic at 25 ~eV/u; even at higher energies, experimental results for the system studied here are much closer to incomplete fusion accompanied by pre-equilibrium emission 8). The mid-rapidity charge is thus excluded. V’, gives a better correlation than the total perpendicular momentum, due to its lower sensitivity to the missed products.
In addition, the distribution of V,, provides a way to check the quality of the measurement in a real experiment as well as in a simulated one. Indeed, a direct observation of the experimental resolution is given by events with V, lower than V c.m., since Vi.,. is the minimum value. Also, VP should not be reached since the peripheral collisions are excluded by the trigger and the selection of well-measured events.
5. Information obtained through global variables on experimental data
On real data, we use V,, as the best sorting of events versus b and study its relationship with other global variables. The first aim is to examine the behaviors seen in the simulation above. The second aim is to verify the validity of the sorting we had made previously on the basis of a momentum tensor analysis. Finally, we want to use some of these variables as tools to get some knowledge of the reactions as a function of the incident energy.
5.1. MULTi~L~C~~, TOTAL CHARGE AND MID-~PIDITY CHARGE
Fig. 7 (top) shows a steady increase of the average multiplicity (v) when V, decreases from Vproj to V,.,., i.e. from the most peripheral to the most central collisions. As expected by comparing figs. 4 (top) and 6 (bottom), v exhibits a large fluctuation around (v). At lower energies, the fluctuation is larger. The multiplicity value would allow a rough sorting between rather central collisions (Y> 13 at 65 MeV/u), rather peripheral collisions (v < 6), and mixed collisions (6 < Y < 13) which cover almost the whole range of b values.

J. P&r et al. / Global uariables 623
Fig. 7. Expe~mentai data. distribution of the muItipli~ity v versus the average parallel velocity V,, . b
goes from 0 to the maximum interaction distance, 8 fm, when V,, increases from V,,,, to VP (but the correspondence between V,, and b is not linear). Top: data obtained with 65 MeV/u Ar ions on an Al
target. Bottom: same data after removing the particles detected below 7” for obtaining v.
For the total charge, fig. 8 leads to conclusions similar to fig. 7. As explained in sect. 4, the dead solid angle produces a decrease of the average value of C 2 and a large fluctuation around this average value.
Fig. 9 top shows the correlation between the mid-rapidity charge and V,,, which is quite similar to figs. 7 (top) and 8.
5.2. INFLUENCE OF THE MINIMUM POLAR ANGLE
Since detectors at very forward angles operate in difficult conditions (very high counting rate), experimentalists are tempted not to install them or not to use them. We want to check to what extent this absence of detectors affects the sorting. For instance, what would be the effect of a minimum polar angle of 7” instead of 3.2”? We have kept the information on b given by the value of V, obtained with the complete detector. Then, we calculated the multiplicity and the mid-rapidity charge obtained by removing the products below 7” [ref. ‘“)I. The results are shown in the bottom parts in figs. 7 and 9. For the multiplicity, it does not make much difference, since it is not a sensitive function of b. A given value of the mid-rapidity charge corresponds to a broader range of V,, values, i.e. the rather poor determination of b obtained by means of the mid-rapidity charge would become poorer.
A similar effect is observed with all global variables, including V,, obtained by removing the products detected below 7”. All impact parameter sortings would be less accurate. In addition, many more events would become “badly measured” with

524 J. Peter et al. / Global variables
I8
VCM
, 0
!!a!!
b
VP *
bmax
Fig. 8. Experimental data. Same as fig. 7 top for the total detected charge. The shaded area is the figure which would be obtained with a perfect detector.
a minimum detection angle of 7”. We conclude that it is important to cover small polar angles.
5.3. MOMENTUM TENSOR ANALYSIS
Another method of using all of the information in the event is to perform a shape analysis of the momentum distribution of each event by using the sphericity tensor:
where Pmi is the ith momentum component of particle M in the total center-of-mass of the system, v is the number of particles detected, and i, j = x, y, Z. By diagonaliz- ation, one obtains the eigenvalues, ti, of the tensor. The square roots of these eigenvalues, qi =v$ are the lengths of the axes of the ellipsoid which represents the momentum distribution. We order the eigenvalues such that 14, - q21 < lq2 - q3( <

f. P&er er aL j Global variables 625
30
20
10 *
NO
30
20
10
0 vcM6 7 8 ‘Jp
average velocity
Fig. 9. Experimental data. Same as fig. 7 for the mid-rapidity charge.
/qt-q,/. This particular scheme forces q1 and q2 to have approximately the same length and q3 to be the s~rnet~ axis. With this definition, we define the eccentricity
of the momentum ellipsoid to be:
J3-f(%+qZ)
41+q2+93
which is zero for an event which has a spherical momentum distribution in the center of mass, approaches 1 as the shape of the momentum distribution approaches the shape of a pencil, and approaches -4 for events in which the shape of the momentum distribution resembles a pancake. The angle @,, between the symmetry axis and the beam direction measures the average direction of matter flow when E > 0 (since q3 is then the largest axis).
We had made such an analysis in ref. “), both for events simulated with the incomplete fusion mechanism and for experimental data, on the same system Ar + Al. The experimental distribution (E, @,,) can be divided into 3 areas. These areas are reproduced in fig. 11. Area P contains the well characterized “peripheral” collisions, and area C contains part of the events that result from the most central collisions. Area M, for “mixed”, includes intermediate impact parameter events as well as part of the central collision events and part of the peripheral collision events.
This method satisfies the 3 requirements given in sect. 4; also, the values of (E, fig,) have a clear meaning. The main limitations are the sorting into only 3 areas and the vague definition of central and peripheral collisions, since areas C and M contain only a part of these events.

626 J. Pe’ter et al. / Global variables
Let us again use V,, as the best approximation to b. The V,, distribution is divided
into 11 bins: bin 1 contains the events with V,, below V,.,., bins 2 to 11 correspond
to 10 equal intervals from V,.,. to VP. For each bin, we build the (E, 19,~) distributions.
The distributions obtained for bins 1,3,5,7,9, 11 at the incident energies 25 to
65 MeV/u are shown in figs. 10 to 12. Let us look first at 25 MeV/u, fig. 10. In
peripheral reactions (bins 11,9), the projectile like fragment and the particles it
emits have a center-of-mass velocity much larger than V,.,,; then, the corresponding
ellipsoid is very elongated and points in the forward direction. The value of E thus
approaches 1 and 8,, is small. Conversely, in very central reactions (bin l), V,, is
close to V,.,. , complete or nearly complete fusion occurred, the products are emitted
isotropically and the momentum ellipsoid is nearly spherical (it can never be exactly
spherical because of the fluctuations due to small multiplicities). Therefore E has
positive or negative values close to zero and e9, points randomly in any direction
(the minimum near 0” is due to the absence of detectors at very forward and backward
angles). This confirms the attribution of areas C, M and P made in ref. “). One sees
that V,, provides a more detailed sorting of all events; in addition, it is handier.
25 MeV/u Q
10. Experimental data. Momentum tensor of analysis of events sorted according to their average parallel
velocity value. From bin 1 to bin 11, V,, increases from V,,,, (very central collisions) to V, (very
peripheral collisions). E is the eccentricity of the ellipsoid which represents the momentum distribution
of all products in an event, es, is the orientation of the symmetry axis (the flow angle for E > 0). Examples
of shapes and orientations of the ellipsoid are drawn. Experimental data obtained with 25 MeV/u Ar projectile on “Al.

J. Pe’ter et al. / Global variables
7
b?D . . .
1
1
627
90’
Ql.3
60’
45’
30’ 90’
60’
45’
30’
Fig. 11. Same as fig. 10 except that the beam energy is 45 MeV/u. P, C and M areas show the selection
of peripheral central and mixed collisions made previously (see text).
65 MeVh 1
.8
.6
-4
iid f C
i
L
M I P t I
I
OF= * ’ $i[
’ * -.5 0 I-.!? 0 & l-3 0
90’
%3
60’
45*
30’ 90’
60’
45’
30’
Fig. 12. Same as fig. 10 except that the beam energy is 65 MeV/u.

628 J. Peter et al. / Global variables
We now use (E, O,,) plots as tools to get an overall picture of the reactions. In peripheral reactions, the same behavior is observed at all energies. Central reactions gradually evolve with energy. At 25 MeV/u, nearly complete fusion results in isotropic distributions. At 36 and 45 MeV/u, the values of E still indicate a compact shape, but the flow angle has a maximum close to the beam direction. As shown in ref. ‘), two sources of particles are present: Pre-equilibrium around the nucleon- nucleon velocity (below V,.,.) and a very incomplete fusion nucleus between Vi,,,,.
and V,. When the number of pre-equilibrium particles is low, more complete fusion is reached, and f3,, may reach values above 45”. These trends are also observed at 65 MeV/u (fig. 12), with more pre-equilibrium particles and events directed more forward. Fusion becomes less and less complete when the energy increases, even in very central reactions.
4
200 -
V cm v, Ll VP
Fig. 13. Experimental data. Distribution of the total perpendicular energy ISper,, versus the average
parallel velocity V,, (V,, close to V,,,, corresponds to the most central collisions). The left-hand axis is the ratio of I&, to the total center-of-mass energy and is the same for the four figures. The right-hand
axis is I& in MeV and varies with the incident energy.

.i. Pe’ter et al. / Global variables
5.4. TOTAL PERPENDICULAR ENERGY
629
The value of this variable is related to the amount of initial relative motion transformed into other degrees of freedom during the reaction. In fig. 13, the same number of events and the same contour levels have been used at all energies. The left-hand vertical axis is the ratio of Eperp to the total center-of-mass energy and
has the same scale at the four energies. Of course, it is nearly 0 in peripheral collisions at all incident energies. In central collisions, the ratio decreases when the incident energy increases: the energy transfer mechanisms become less effective. The absolute value of EPerp is shown on the right-hand scale, which varies according to the incident energy. It increases steadily with the incident energy: it doubles from 25 to 65 MeVfu. The energy removed from relative motion does not saturate in central collisions. This growth is used in increasing both the number of pre- equilib~~m particles and the excitation energy of the incomplete fusion nucleus **“).
6. Summary and conclusion
Reactions occurring at several impact parameter values in collisions between 4oAr projectiles from 25 to 85 MeV/u on *‘Al have been simulated. The charged products have been “detected” with a perfect 4~ array and a realistic 4~ array reproducing the limitations of the actual multidetector Mur f Tonneau. The detected events are sorted into “badly measured events”, thrown away, and “well detected events” kept for further analysis. The “well detected events” have been sorted according to the value of several global variables linked to the impact parameter. The global variable which gives the best information on b was found to be the average parallel velocity of the detected products. It is not sensitive to the reaction mechanism used in the simulation. The importance of extending the measurements to very forward angles has been demonstrated.
An earlier selection of a part of the central reactions and a part of the peripheral reactions was based on the sphericity tensor analysis. This selection is found to be correct. The sorting based on V,, has two bonuses: it allows all events to be sorted and gives numerical values of b, instead of the vague meaning of “central” and “peripheral”.
The variation of other global variables versus the impact parameter value allows the general trends of reactions to be followed as a function of the incident energy. The sphericity and flow angle show that even in the most central collisions, fusion becomes less and less complete when the incident energy increases. The total perpendicular momentum shows that the energy released from relative motion does not increase as fast as the incident energy. However, it increases steadily.
Let us conclude by answering the question: what is the best projectile mass/target mass ratio to be used in experimental studies? Two requirements lead us to two opposite choices and a compromise must be made.

630 J. Pe’ter et al. / Global variables
First, we want a good resolution on b. Due to the experimental resolution on V,,,
the range of V,, values should be as broad as possible, which implies that the projectile mass should not be much larger than the target mass. For instance, with a projectile heavier than the target by a factor larger than 2, V,.,. is larger than $ V, and the correlation beXp versus 6,_, broadens. The lower the mass ratio, the better. Second, we want to separate the particles emitted from the interaction region (pre-equilibrium, participants) from those issued from the “spectator” equilibrated nucleus. The source velocity of the participant particles is the nucleon-nucleon velocity (V,, - f VP), whereas the “spectator” nucleus velocity varies from VP in tangential reactions down to a value intermediate between V,,,, and VP in head-on reactions (it would be equal to V,,,, if there would be no P.E. particles). To keep the velocity distributions of participant and spectator particles as well separated as possible at all impact parameter values, V,, must be lower than V,,,,, i.e. the projectile mass must be larger than the target mass [the reader willing to visualize this comment can look at figs. 1 and 2 in ref. “)I. The larger the mass ratio, the better. The compromise between a good impact parameter determination and a good separation between participant (pre-equilibrium) and spectator (equilibrium) particles is obtained for a projectile mass in the range 1.2-2.5 times the target mass.
References
1) G.D. Westfall, J.E. Yurkon, J. Van der Plicht, Z.M. Koenig, B.V. Jacak, R. Fox, G.M. Crawley,
M.R. Maier, B.E. Hasselquist, R.S. Tickle and D. Horn, Nucl. Instr. Meth. A238 (1985) 347
2) G. Bizard, A. Drouet, F. Lefebvres, J.P. Patty, B. Tamain, F. Guilbault and C. Lebrun, Nucl. Instr.
Meth. A244 (1986) 483
3) R. Bougault, J. Duchon, J.M. Gautier, A. Genoux-Lubain, C. Le Brun, J.F. Lecolley, F. Lefebves,
M. Louvel, P. Mosrin and R. Regimbart, Nucl. Instr. Meth. A259 (1987) 473
4) R. Bougault, D. Horn, G.C. Ball, M.G. Steer and L. Potvin, Nucl. Instr. Meth. A245 (1986) 455 5) D.G. Sarantites, L.G. Sobotka, T.M. Semkov, V. Abenante, J. Elson, J.T. Hood, Z. Li, N.G. Nicolis,
D.W. Stracener, J. Valdes and D.C. Hensley, Nucl. Instr. Meth. A264 (1988) 319
6) E. Migneco, Proc. Int. Symp. on Physics at Tandem, Beijing, China (1986) p. 559;
P. Piatelli, Thesis, Catania (1985)
7) See appendix in: J. Gosset, H.H. Gutbrod, W.G. Meyer, A.M. Poskanzer, A. Sandoval, R. Stock
and G.D. Westfall, Phys. Rev. Cl6 (1977) 629 8) J. Peter, J. Sullivan, D. Cussol, G. Bizard, R. Brou, M. Louvel, J.P. Patry, R. Regimbart, J.C.
Steckmeyer, B. Tamain, E. Crema, H. Doubre, K. Hagel, G.M. Jin, A. Wghaire, F. Saint-Laurent,
Y. Cassagnou, R. Legrain, C. Lebrun, E. Rosato, R. MacGrath, S.C. Jeong, S.M. Lee, Y. Nagashima, T. Nakagawa, M. Ogihara, J. Kasagi and T. Motobayashi, Phys. Lett. B237 (1990) 187
9) A. Wghaire, B. Zwieglinski, E. Rosato, G.M. Jin, J. Kasagi, H. Doubre, J. Peter, F. Guilbault, C.
Lebrun, Y. Cassagnou and R. Legrain, Report GANIL p. 89-24, to be published in Nucl. Instr. Meth.
10) C.A. Ogilvie, D.A. Cebra, J. Clayton, S. Howden, J. Kam, A. Vander Molen, G.D. Westfall, W.K.
Wilson and J.S. Winfield, Phys. Rev. C40 (1989) 654
11) K. Hagel, A. Pighaire, G.M. Jin, D. Cussol, H. Doubre, J. Peter, F. Saint-Laurent, G. Bizard, R.
Brou, M. Louvel, J.P. Patry, R. Regimbart, J.C. Steckmeyer, B. Tamain, Y. Cassagnou, R. Legrain,
C. Lebrun, E. Rosato, R. MacGrath, S.C. Jeong, S.M. Lee, Y. Nagashima, T. Nakagawa, M. Ogihara, J. Kasagi and T. Motobayashi, Phys. Lett. B229 (1989) 20; B234 (1990) 541