Embed Size (px)
Citation preview

Global trends in telecom development and
Int’l Interconnection
Seminar in Arusha, April 2002
The original document is elaborated by Dr Tim Kelly, ITU/SPU. It has completed by Saburo Tanaka and by Pape-Gorgui Toure. The views expressed in this presentation are those of the authors, and do not necessarily reflect the opinions of the ITU or its membership. Authors can be contacted by e -mail at: [email protected] [email protected] [email protected].

Global trends in telecom Global trends in telecom developmentdevelopment
l The state of the industryl The state of the marketl Situation in the Regions
l Paradigm shiftl Examining market realityl ITU-T SG3 activities
ð Transitional arrangementsð New remuneration systems
l Int’l Interconnection with mobile networkl Internet Interconnection – IP Telephony

A Mobile RevolutionA Mobile Revolution
Source: ITU World Telecommunication Indicators Database.
0
200
400
600
800
1'000
1'200
1'400
1993 1995 1997 1999 2001 2003
Mobile Users
Fixed Lines
Fixed Lines vs. Mobile Users, worldwide, Million

0
100
200
300
400
500
600
700
800
900
1000
90 91 92 93 94 95 96 97 98 99 00 01 02
Ser
vice
rev
enu
e (U
S$
bn
)Actual
Projected
Domestic Telephone/fax
Int'l
Mobile
Other: Data, Internet, Leased lines, telex, etc
Projection of revenue growth (US$bn)Projection of revenue growth (US$bn)
Source: ITU.
43%
8%
36%
13%

Telecommunications revenue Africa/World (1994, 1996, 1998, 2000)
7'2089'381 12'193
16'391
513'013 620'196 722'548 925'074
1'000
10'000
100'000
1'000'000
1994 1996 1998 2000
(180%)
(227%)
M. US$
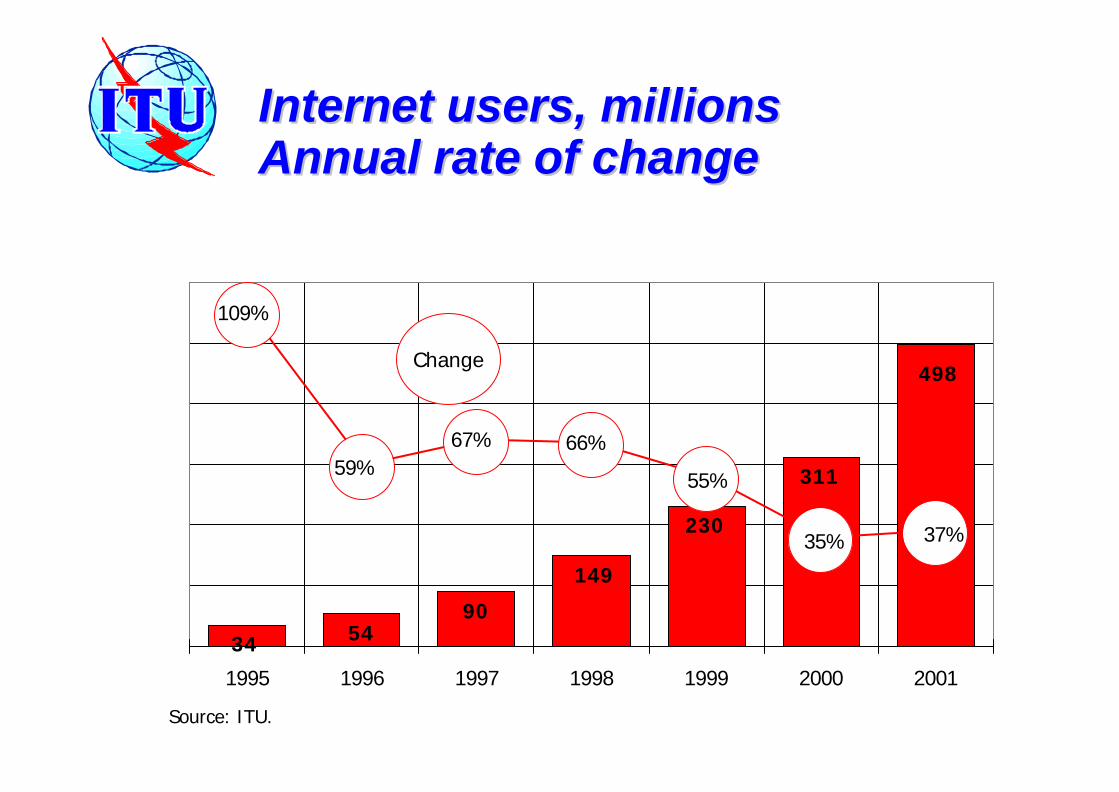
Internet users, millionsInternet users, millionsAnnual rate of changeAnnual rate of change
498
311
230
34 5490
149
37%35%
55%
66%67%59%
109%
1995 1996 1997 1998 1999 2000 2001
Change
Source: ITU.

InterInter--regional Internet regional Internet connectivityconnectivity
Asia /Pacific
LatinAmerica
USA / Canada
Europe
Africa,Arab
162Gbit/s
0.1 Gbit/s
0.77 Gbit /s
Note: Gbit/s = Gigabits (1’000 Mb) per second.Source: ITU adapted from TeleGeography.
41.8Gbit
/s
0.4 Gbit/s
14 G
bit/s
0.45 G
bit/s
The state of the marketThe state of the market
l Increasing competitionð Around two-thirds of telecom subscribers now have a
choice of operatorð More than 99 per cent of mobile and Internet subscribers
now have a choice of operator
l Dominantly private-ownershipð 19 out of top 20 top public telecom operators are partially
or fully private-ownedð Of the top 20 mobile operators, 16 are fully-private, 3 are
partially private, 1 is state-owned
l Independent regulatorsð There are currently 112 independent regulators (only 12 in
1990)

85%
13% 113
49
39
2%
Fully orpartly privateincumbentOther privateoperators(e.g. mobile)No privateoperators
Oth
By telecom revenue
By country
Status oftelecom
privatization2001
Private, competitive, mobile and global
Status of telecommunication privatization , by country and by share of global revenue, 2001

37% 38% 43%
78% 86%
Longdistance
Int'l Local Mobile Internet
MonopolyCompetition
Legal status of telecommunication competition, by country, 2001
Legal status of competitionDistribution by country, 2001

0
500
1'000
1'500
2'000
82 84 86 88 90 92 94 96 98 00 02 04
Telephone subscribers, world,
Fixed
MobileForecast
Mobile as the new global network
Mobile and fixed telephone subscribers worldwide, 1982-2005

More mobile countries
Countries with more mobile than fixed telephones (97), 2001
More mobile countries
Countries with more mobile than fixed telephones (97), 2001
More mobile countries
Countries with more mobile than fixed telephones (97), 2001

Mobile as % of total telephone subscribers, LDCs, 2001
5050.350.75252.453.453.554.255.156.6
59.862.2
65.566.466.767.867.868.6
71.674.275.1
83.58787.2
BurundiBangladesh
MalawiAngola
CARHaiti
ZambiaS.LeoneGambiaBurkinaLesothoSenegal
MozambiqueTogoChad
Eq. GuineaBenin
GuineaMadagascar
TanzaniaRwandaUganda
CambodiaD.R. Congo

0.0
0.5
1.0
1.5
2.0
2.5
3.0
3.5
4.0
1960 65 70 75 80 85 90 95 2000
Togo
Benin
Uganda
Mada-gascar
It took 35 years to increase telephone density by a factor
of 3.
In just 6 years, telephone density
increased by a factor of 6.
Total telephone users (fixed plus mobile) per 100 inhabitants

0%
20%
40%
60%
80%
100%
Population Telephones Mobile Internet
Low Low er Middle Upper Middle High
Distribution by economic classification, 2001
Distribution of population, main telephone lines, mobile cellular subscribers and Internet users by country economic
classification, 2001

0
5
10
15
20
25
1986 1988 1990 1992 1994 1996 1998 2000
1988: Privatization and competition in Chile
1990: Privatization w ith 7-year exclusivity in Argentina
Exclusivity extended by 3 years in Argentina
Teledensity, in Chile and Argentina
Growth in fixed line teledensity, Chile and Argentina, 1986-2000

0
10
20
30
40
50
60
70
80
90
1988 1990 1992 1994 1996 1998 2000
Singapore: Mobile
competition delayed until
April 1997
Hongkong SAR: Mobile competition introduced in 1988 for analogue
Additional competition introduced w ith digital mobile in 1993
Six additional PCS licences awarded in 1996
Mobile penetration rate, per 100 inhabitants
Growth in mobile teledensity, Hong Kong SAR and Singapore, 1988-2000

Teledensity with rising rank
Country 2000 1990Rank 2000
Rank 1990 Change
China 17.8 0.6 95 159 64
V iet Nam 4.2 0.1 141 189 48
Botsw ana 21.6 2.1 91 129 38
El Salvador 21.8 2.4 90 125 35
Jamaica 34.1 4.5 71 106 35
Hungary 67.4 9.6 43 78 35
Mauritius 38.6 5.4 67 100 33
Chile 44.4 6.7 61 93 32
Philippines 12.4 1.0 112 143 31
Morocco 13.3 1.6 107 136 29
Paraguay 20.7 2.7 92 120 28
Cambodia 1.2 0.0 167 194 27
Cape Verde 17.2 2.4 98 125 27
Taiw an, China 137.0 31.4 5 31 26
Poland 45.6 8.6 60 85 25

Teledensity with falling rank
Country 2000 1990Rank 2000
Rank 1990 Change
Armenia 15.6 15.7 102 60 -42
Iraq 2.9 3.9 149 109 -40
Tajikistan 3.6 4.5 143 105 -38
Uzbekistan 6.9 6.9 128 92 -36
Kyrgyzstan 7.9 7.2 125 90 -35
Angola 0.7 0.8 177 146 -31
Liberia 0.2 0.4 190 162 -28
DPR Korea 4.6 3.8 138 111 -27
Canada 96.1 58.6 33 6 -27
Turkmenistan 8.4 6.0 123 97 -26
Cuba 4.4 3.1 140 115 -25
Moldova 16.5 10.6 99 74 -25
Kazakhstan 12.5 8.0 111 87 -24
Comoros 1.0 0.8 171 149 -22
Ukraine 22.7 13.6 87 66 -21

Total (fixed-line + mobile) telephone subscribers per 100 inhabitants, LDCs
0
0.2
0.4
0.6
0.8
1
1.2
1.4
1992 1993 1994 1995 1996 1997 1998 1999 2000 2001
MobileFixed-lineTotal

Outgoing telephone traffic 1995-2000
160%
211%167%
168%
160%
182%
1
10
100
1,000
10,000
100,000
1,000,000
Africa Americas Asia Europe Oceania World
Regions
Mill
ion
min
utes
19952000

Telephone tariffs (2000)
14.3
9.7
8.0
17.6
5.7
9.8
M. Subscription
8.6
7.8
4.4
8.3
5.0
6.3
M. Subscription
3.70.137955Oceania
1.10.1011784Europe
5.50.04139108Asia
3.10.07134105Americas
12.70.087762Africa
ConnectionConnection
5.7
Subscription as % of GDP per capita
0.07
Local call (US$)
113
Business (US$)
86
Residential (US$)
World

Cellular tariffs (2000)
0.75
0.41
0.32
0.57
0.39
0.42
Off Peak
35.7
13.8
14.9
21
13.3
16.6
M. Subscription
1.4091Oceania
0.5962Europe
0.4783Asia
0.7858Americas
0.5679Africa
PeakConnection
0.62
3 minutes local call
75World

Accounting rates trend
2.122.08
2.042
1.961.9
1.83
1.731.69
1.61
1.34
1.19
0.95
1.161.08
0.25
0.768
0.685
0.855
0.7880.735
1 1
0.90.8
0.750.68
0.61 0.550.5
0.460.39
0.260.31 0.28
0.22
0.338
0
0.5
1
1.5
2
2.5
1988 1989 1990 1991 1992 1993 1994 1995 1996 1997 1998 1999 2000 2001 2002
Years
Acco
untin
g ra
tes
(in S
DR)
World averageTAF averageUS averageBenchmark LBenchmark H

TelephonyTelephony : : SomeSome DATA(2000)DATA(2000)
Intern’l TelephoneIntern’l Telephone revenue : 54 billion US $revenue : 54 billion US $
Settlement Settlement transaction : transaction : 27 billion US $27 billion US $
Net Net Settlement paymentSettlement payment to to developingdevelopingcountries countries amountamount to to aroundaround : 5 billion US$: 5 billion US$
Int’lInt’l Infrastructure Infrastructure costs reductioncosts reduction: < 20 %: < 20 %
Annual averageAnnual average traffictraffic increaseincrease : 8 %: 8 %
AverageAverage Settlement Settlement rate rate reductionreduction: ? %: ? %
25

Global international telephone callsBillions of minutesand Growth rates
4 5 5 6 8 9 10 11 13 14 16 18 2124
2833
3843
4957
6471
7986
94101
8%8%9%
12%12%12%
15%15%
13%14%
17%17%17%
15%15%
11%11%
13%12%
16%15%
19%18%17%
15%
18%
75 76 77 78 79 80 81 82 83 84 85 86 87 88 89 90 91 92 93 94 95 96 97 98 99 00
Annual change

USA Net settlement payments and Average settlement rates movement
(in US$)
0.3650.315
0.270.215
0.160.175
0.4050.4550.48
0.5150.575
0.640.6750.68
0
1
2
3
4
5
6
7
1988 1989 1990 1991 1992 1993 1994 1995 1996 1997 1998 1999 2000 2001
.
Years
Ne
t S
ett
lem
en
t P
ay
me
nts
0
0.1
0.2
0.3
0.4
0.5
0.6
0.7
0.8
US
av
era
ge
se
ttle
me
nt
ra
tes
Net SettlementpaymentsSettlement ratesmovement

Falling prices
$0.00
$0.50
$1.00
$1.50
$2.00
90 92 94 96 98 00 02 04
Average retail price of one minute call to USA.
Mark-up
Settlement
Source: ITU adapted from FCC and national data (34 countries).
Forecast

X X
Traditional regime:Traditional regime:Joint provision of serviceJoint provision of service
Country A Country B
29
Two different national operators jointly establish an international circuit and decide the revenue they wish to
obtain. They then divide that revenue fifty-fifty split.

X
Emerging regime:Emerging regime:Market entry and interconnectionMarket entry and interconnection
XXCountry A Country B
Jointly provided circuit
Circuit provided by operator B
30
Cross border interconnection and the trading of international traffic minutes

A
C
B
C
B
A
Operator in A sends traffic tooperator in C under anarrangement of exclusivity
• Operator in A is a partnerof operator in C
• Settlement rates A/B > C/B
Origin A
Destination B Origin
C
Destinati
on B
Operator in C declares traffic to B on transit through A
Operator in B receives traffic at settlement rate C/B instead of A/B
Operator in C “re-labels” the traffic as originated in C
1
2
3
4
Refile and other practices using accounting rate system

7Alternative calling proceduresAlternative calling procedures
Country A
Country B Country C4.5 $
3.5$
2.0$
Call-Back
1.2$
0.8$1.0$1.5$
Interconnection of two outgoing calls in country A
Call-Back
Using ARCALL BACK using Accounting Rates

Mobile tromboning (using accounting rate)
É ÈCalled BCaller A
Operator A’s national network Operator B’s
mobile network
Operator A’s Int’l facility
Operator B’s Int’l facility
Operator X or Operator A’s facility in another country
International boundary
High Interconnection
charge

Country A Country B
Operator A Operator BPSTN
IWF
Interconnect
Leased lines
International simple resale (ISR)(By-passing accounting rate)
Once a foreign carrier accepts the benchmark rate, it can negotiate ISR arrangements with US carriers

Country A Country B
Telephone service using data transmission(By-passing accounting rate)
Operator A
PSTN
Voice is packetized = data transmissionTelephone regulations do not apply
VSAT
Inter-connection
É

T 0 2 0 8 5 0 0 - 0 0( 1 0 6 1 4 7 )
I P N e t w o r k
IW F
T e r m i n a t i n gN e t w o r k
L o c a l o r d i s t r i b u t e df u n c t i o n C a l l i n i t i a t e d f r o m P S T N / I S D N / P L M N
t o P S T N / I S D N / P L M N
P S T N / I S D N/ P L M N
IW F
P S T N / I S D N/ P L M N
L o c a l o r d i s t r i b u t e df u n c t i o n
O r i g i n a t i n gN e t w o r k
Call from International Telecommunication Network (ITN) to another ITN via IP-based Network
IP Telephony (by-passing accounting rate)

ITUITU––T SGT SG--3 Major achievements3 Major achievements
l New Remuneration systemð Termination charge systemð Settlement rate systemð Special arrangement
l Difficulty to quickly implement those systemsð Condition is to reach cost-oriented rate, butð No cost data or model for some administrations Group
3 is developing cost methodologies
l SG3 is now developing cost methodologies l Transitional arrangements
ð To facilitate staged reduction to cost based rateð to avoid sudden fall of revenue (smooth transition)

AnnexAnnex E to E to RecommendationRecommendation D.140 D.140 “indicative “indicative targettarget rates” by rates” by TeledensityTeledensity (T) (T) BandBand, in SDR (, in SDR (andand US cents) US cents) perper minute.minute.
T<1 A
1<T>5 B
5<T<10 C
10<T<20 D
20<T<35 E
35<T<50 F
T>50 G
0.327 SDR
0.251 SDR
0.210 SDR
0.162 SDR
0.118 SDR
0.088 SDR
0.043 SDR
43.7¢ 33.5¢ 28.0¢ 21.6¢ 15.8¢ 11.8¢ 5.7¢
Low income Lower middle Upper middle
High income
Note: The correspondence between teledensity band and income group shown in the bottom row is intended to be approximate, not precise. Source: ITU-T SG3 Report. 1 SDR = US$1.39.
38
FCC : 23 ¢(January2002/2003)
FCC : 19 ¢(January2001) 19 ¢(J.2000)
FCC : 15 ¢(January1999)
(end 2001) (end 2001) (end 2001) (end 2001)
(
end 2001) (end 2001) (end 2001)

Annex E Recommends alsoAnnex E Recommends also
l That transit Administrations move towards the indicative target rate (upper limit) of 0.05SDR (0.07US $) per minute.
l To negotiate asymmetrical accounting rate (other than 50/50) if both administrations agree to move to below the indicative target rate. Example: Operator A belong to teledensity band EOperator B belong to teledensity band FA and B agree to achieve TAR 0.2SDR (<0.118x2)ð A can request settlement rate of 0.09 SDRð B accepts to pay 0.11SDR to A

Termination chargeTermination charge
l Destination operator (or Government) set the chargel Charge should be established based on costsl Termaination Charge includes
ð International exchangeð National extension, including local loopð And if appropriate, international circuitð Other costs imposed on carriers by the national regulation
l Those components should be separately identified (Unbundled)
l Charge applies to all traffic from any sourcel However if significant variation in costs, charge may
vary (volume discount)l Termination charge may be introduced on bilateral
agreement basis

Full-circuit regime (could be unbundled)
Half-circuit regime (would not normally be unbundled)
Non-discriminatory (same rate for all correspondents)
Discriminatory (different rates negotiated with different correspondents)
In theory, set unilaterally (need agreement to implement)
Bilaterally negotiation
Not necessarily symmetric (if cost differ)
Normally symmetric(50/50)
Termination chargeTermination chargeAccounting rateAccounting rate
Accounting rates and Termination ChargesWhat’ s the difference

International call terminating on International call terminating on mobile networkmobile network
l SG3 revised D.93 in year 2000, allowing to negotiateð a separate rate for traffic terminating on a mobile
networkð however, this is by bilateral negotiation and when
the rate is cost orientatedð The difference between the two rates should be as
small as possible
l Many countries now request very high settlement rates (3 – 5 times)ð A review is now going on in the SG3

Fixed-to-mobile interconnect rate
Mobile-to-fixed interconnect rate LOCAL
Mobile-to-fixed interconnect rate SINGLE
TRANSIT
Mobile-to-fixed interconnect rate DOUBLE
TRANSIT
Austria 0.23 0.017 0.017 0.022
Belgium 0.18 0.008 0.014 0.018
Denmark 0.17 0.008 0.011 0.016Finland 0.21 0.013 0.013 0.024
France 0.20 0.006 0.012 0.018
Germany 0.24 0.008 0.017 0.021Greece n.a. 0.018 0.018 0.025
Italy 0.23 0.009 0.015 0.021
Ireland n.a. 0.010 0.015 0.021
Luxembourg n.a. 0.015 0.015 0.015Netherlands 0.18 0.009 0.013 0.016
Portugal n.a. 0.009 0.015 0.024
Spain 0.20 0.009 0.015 0.028
Sw eden 0.22 0.008 0.011 0.015UK 0.16 0.005 0.007 0.016
Switzerland 0.30 n.a n.a 0.020
Norway 0.156 n.a n.a 0.018Average 0.21 0.010 0.014 0.020
Interconnection Rates in selected European countries under CPP (in US $ / minute)
In 2001, there is an estimate indicating that the average of Fixed-mobile decreased to 0.136 and mobile to fixed has not changed

Internet Interconnection Internet Interconnection
l Internet Interconnection has slightly different meaning. Historically Internet interconnection has involved simply different Internet networks.
l This Internet Interconnection policies have proved increasingly inappropriate in a commercial industry.ð Many operator with larger networks often charge smaller ISPs
a traffic-based interconnection feeð Many backbone providers have begun offering transit service
networks.
l Different type of Interconnection Arrangementsð ISP Relationships with customers: usually via a dial-upð ISP-ISP Interconnection: peering or bilateral agreementð Multiple ISP Exchanges when several ISPs need to
interconnect in a same city (use of an IXP)
l International Regulatory Development

Recommendation D.50Recommendation D.50
The ITU-T,recognizingthe sovereign right of each State to regulate its telecommunication, as
reflected in the Preamble to the Constitution,notinga) the rapid growth of Internet and Internet protocol-based international
services;b) that international Internet connections remain subject to commercial
agreements between the parties concerned; andc) that continuing technical and economic developments require ongoing
studies in this area,Recommends that
administrations involved in the provision of international Internet connections negotiate and agree to bilateral commercial arrangements enabling direct international Internet connections that take into account the possible need for compensation between them for the value ofelements such as traffic flow, number of routes, geographical coverage and cost of international transmission amongst others.

Lowinternational
Internetconnectivity
Littleinterest of
privateinvestors
Highconnectivitycharges for
ISPs
Low demandof Internet
services
No growth ininfrastructure,
limitedInternet
connectivity
No exploitation ofeconomies of scale
Low bargainingpower of ISPs
Lack of competition
High end-usercharges
Internet vicious circle

ITU IP Connectivity Project
Liberalisationof the Internetmarket
Market growth
Bargaining powerof ISPs
Economies of scale
Interest in investing Lower costs
Higherdemand
Higherinternational
Internet connectivity
Virtuous circle

IPIP--TelephonyTelephony
Telephone to Telephone to telephone (fax to telephone (fax to fax) via Internetfax) via Internet
l Any telephone/mobile user to any otherl Main motivation: Accounting rate bypass, market
entry for non-facilities-based carriersl Potential service providers include any PTO with
settlement payments deficit (e.g., US = US$5.7bn)
l Market potential: 1.3 billion telephone/mobile users
Telephone TelephonePublic Switch
Internet
Phone Gateway Computer
Phone Gateway Computer

IP TelephonyIP TelephonyOpportunities and challengesOpportunities and challenges
l Opportunities ð Reduce prices to consumers and the costs of market
entry for operators ð In terms of volume of traffic carried and level of
investment committed
l Challenges ð Undermine the pricing structure of the incumbent
Public Telecommunication Operators (PTOs)ð Transition to IP-based networks also poses significant
human ressource development challenges

+0.28 US$
Receives 0.30 US $ for terminating charge
Pays 0.02 US $ for local call.
Retains 0.28 US $
0ISP in
Developing country
-0.53 US$Receives US $ 0.02 local call charge.
Receives US $ 0.55 settlement.
PTO in Developing
country
+0.25 US$
CollectUS$ 1.00 from user
Pays US$ 0.30 to ISP for terminating call.Retains US$ 0.70
Collect US$ 1.00 from user
Pays US $ 0.55 settlement.
Retains US $ 0.45
PTO in Developed
country
DifferenceIP-TelephonyAccounting Rate
ChallengesChallenges
Revenue gain and revenue loss

ISP
PSTNOperator
Switch
How the operators in developping countries stop IP-Telephony
Operator check only this line
Users can call ISP but ISP is unable to call users

Conclusion and Recommendation Conclusion and Recommendation
l Erosion of traditional system of accounting rates for exchange of international trafficð Domestic interconnect fees will be dominant mode
l Major price cuts in international calls ð Availability of new infrastructuresð Impact of Internet pricing model (distance and duration
independent)
l Mobiles exceed fixed-line phones worldwide ð Introduction of “third generation” mobiles after 2001ð Generational shift, as new users reject fixed-lines
“ Interconnection and tariff rebalancing”