Embed Size (px)
Citation preview

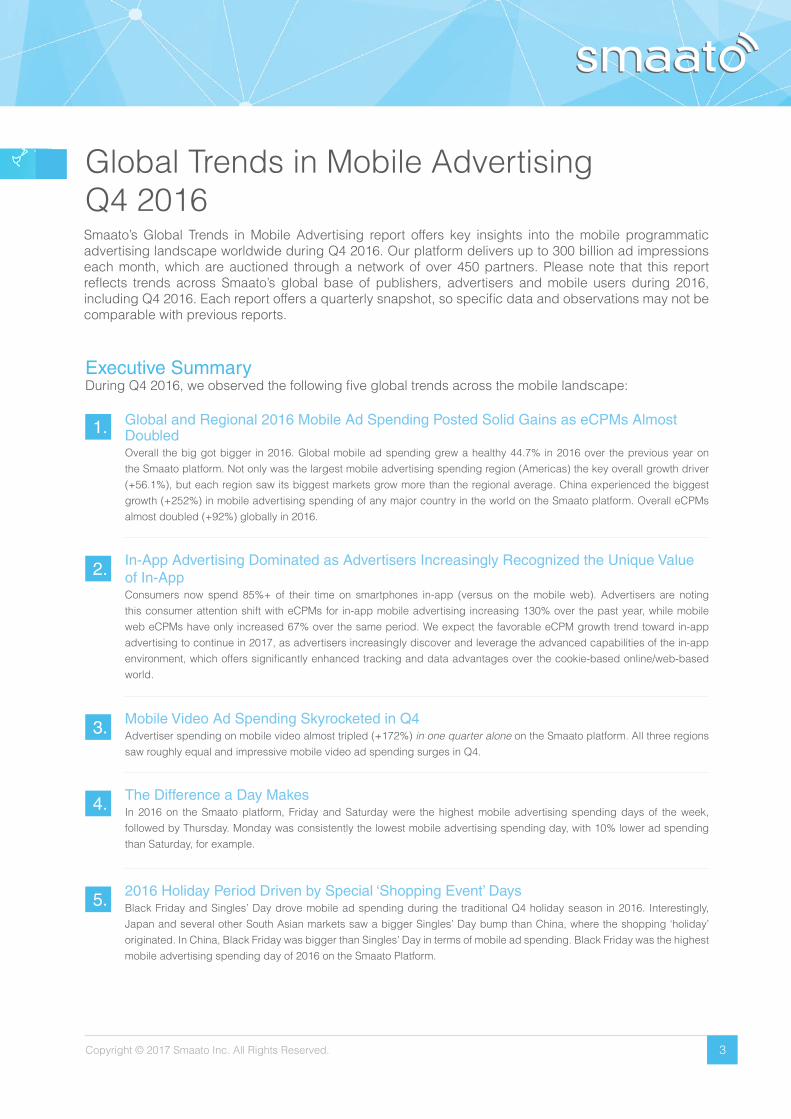
Global Trends in Mobile AdvertisingQ4 2016
Copyright © 2017 Smaato Inc. All Rights Reserved. 3
Global Trends in Mobile AdvertisingQ4 2016Smaato’s Global Trends in Mobile Advertising report offers key insights into the mobile programmatic advertising landscape worldwide during Q4 2016. Our platform delivers up to 300 billion ad impressions each month, which are auctioned through a network of over 450 partners. Please note that this report reflects trends across Smaato’s global base of publishers, advertisers and mobile users during 2016, including Q4 2016. Each report offers a quarterly snapshot, so specific data and observations may not be comparable with previous reports.
Executive SummaryDuring Q4 2016, we observed the following five global trends across the mobile landscape:
Global and Regional 2016 Mobile Ad Spending Posted Solid Gains as eCPMs Almost DoubledOverall the big got bigger in 2016. Global mobile ad spending grew a healthy 44.7% in 2016 over the previous year on the Smaato platform. Not only was the largest mobile advertising spending region (Americas) the key overall growth driver (+56.1%), but each region saw its biggest markets grow more than the regional average. China experienced the biggest growth (+252%) in mobile advertising spending of any major country in the world on the Smaato platform. Overall eCPMs almost doubled (+92%) globally in 2016.
1.
In-App Advertising Dominated as Advertisers Increasingly Recognized the Unique Value of In-AppConsumers now spend 85%+ of their time on smartphones in-app (versus on the mobile web). Advertisers are noting this consumer attention shift with eCPMs for in-app mobile advertising increasing 130% over the past year, while mobile web eCPMs have only increased 67% over the same period. We expect the favorable eCPM growth trend toward in-app advertising to continue in 2017, as advertisers increasingly discover and leverage the advanced capabilities of the in-app environment, which offers significantly enhanced tracking and data advantages over the cookie-based online/web-based world.
2.
Mobile Video Ad Spending Skyrocketed in Q4Advertiser spending on mobile video almost tripled (+172%) in one quarter alone on the Smaato platform. All three regions saw roughly equal and impressive mobile video ad spending surges in Q4.
3.
The Difference a Day MakesIn 2016 on the Smaato platform, Friday and Saturday were the highest mobile advertising spending days of the week, followed by Thursday. Monday was consistently the lowest mobile advertising spending day, with 10% lower ad spending than Saturday, for example.
4.
2016 Holiday Period Driven by Special ‘Shopping Event’ DaysBlack Friday and Singles’ Day drove mobile ad spending during the traditional Q4 holiday season in 2016. Interestingly, Japan and several other South Asian markets saw a bigger Singles’ Day bump than China, where the shopping ‘holiday’ originated. In China, Black Friday was bigger than Singles’ Day in terms of mobile ad spending. Black Friday was the highest mobile advertising spending day of 2016 on the Smaato Platform.
5.
Copyright © 2017 Smaato Inc. All Rights Reserved. 4
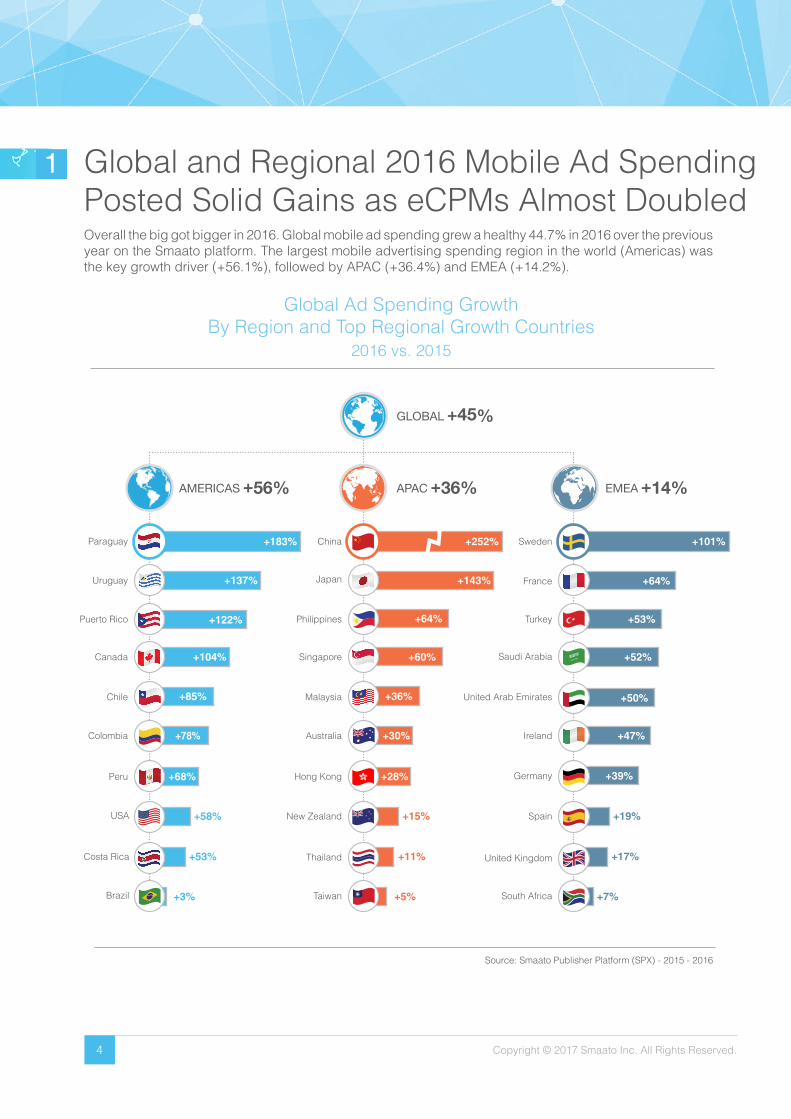
Global and Regional 2016 Mobile Ad Spending Posted Solid Gains as eCPMs Almost Doubled
1
Overall the big got bigger in 2016. Global mobile ad spending grew a healthy 44.7% in 2016 over the previous year on the Smaato platform. The largest mobile advertising spending region in the world (Americas) was the key growth driver (+56.1%), followed by APAC (+36.4%) and EMEA (+14.2%).
Global Ad Spending GrowthBy Region and Top Regional Growth Countries
2016 vs. 2015
Source: Smaato Publisher Platform (SPX) - 2015 - 2016
+183%
+137%
+122%
+104%
+85%
+78%
+68%
+58%
+53%
+3%
Uruguay
Puerto Rico
Canada
Chile
Colombia
Peru
Paraguay
Costa Rica
Brazil
USA
GLOBAL +45%
APAC +36%AMERICAS +56% EMEA +14%
China
New Zealand
Thailand
Singapore
Australia
Japan
Hong Kong
+252% +101%
+64%
+53%
+52%
+50%
+47%
+39%
+19%
+17%
+7%
+143%
+64%
+60%
+36%
+30%
+28%
+15%
+11%
+5%
Malaysia
France
Sweden
Turkey
Saudi Arabia
United Arab Emirates
Ireland
Germany
Spain
United Kingdom
South AfricaTaiwan
Philippines
Copyright © 2017 Smaato Inc. All Rights Reserved. 5
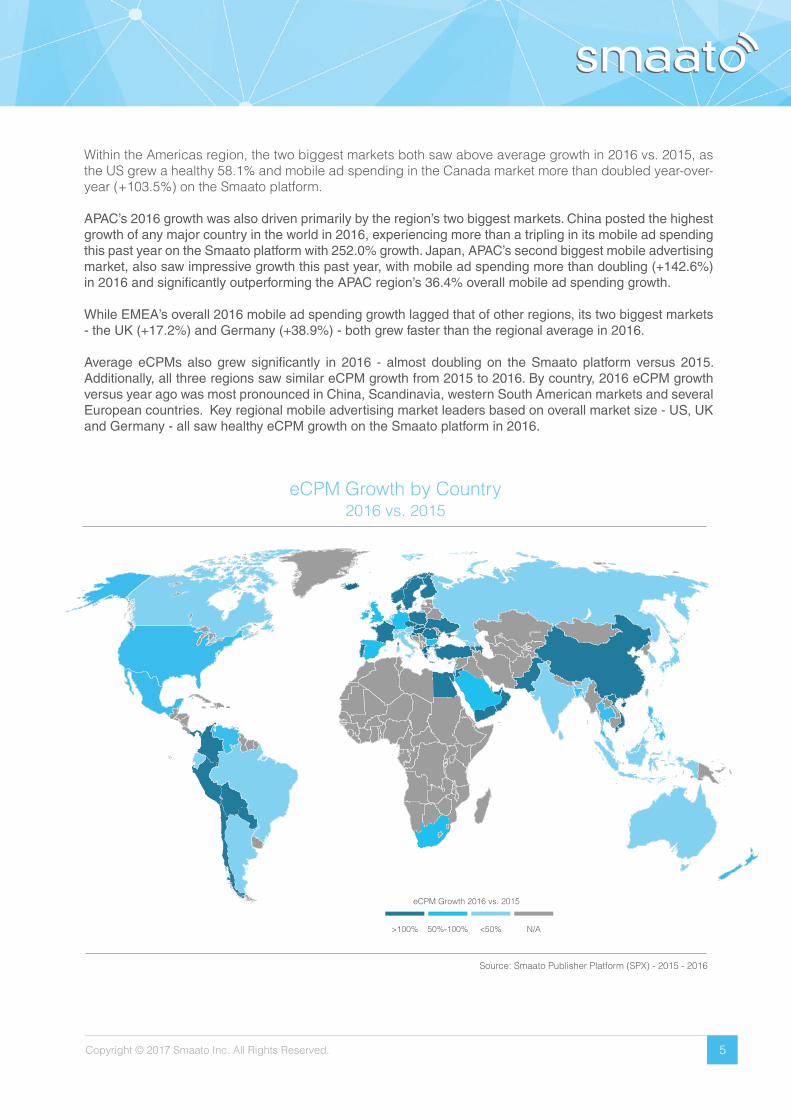
Within the Americas region, the two biggest markets both saw above average growth in 2016 vs. 2015, as the US grew a healthy 58.1% and mobile ad spending in the Canada market more than doubled year-over-year (+103.5%) on the Smaato platform.
APAC’s 2016 growth was also driven primarily by the region’s two biggest markets. China posted the highest growth of any major country in the world in 2016, experiencing more than a tripling in its mobile ad spending this past year on the Smaato platform with 252.0% growth. Japan, APAC’s second biggest mobile advertising market, also saw impressive growth this past year, with mobile ad spending more than doubling (+142.6%) in 2016 and significantly outperforming the APAC region’s 36.4% overall mobile ad spending growth.
While EMEA’s overall 2016 mobile ad spending growth lagged that of other regions, its two biggest markets - the UK (+17.2%) and Germany (+38.9%) - both grew faster than the regional average in 2016.
Average eCPMs also grew significantly in 2016 - almost doubling on the Smaato platform versus 2015. Additionally, all three regions saw similar eCPM growth from 2015 to 2016. By country, 2016 eCPM growth versus year ago was most pronounced in China, Scandinavia, western South American markets and several European countries. Key regional mobile advertising market leaders based on overall market size - US, UK and Germany - all saw healthy eCPM growth on the Smaato platform in 2016.
>100% 50%-100% <50% N/A
eCPM Growth 2016 vs. 2015
Source: Smaato Publisher Platform (SPX) - 2015 - 2016
eCPM Growth by Country2016 vs. 2015
Copyright © 2017 Smaato Inc. All Rights Reserved. 6
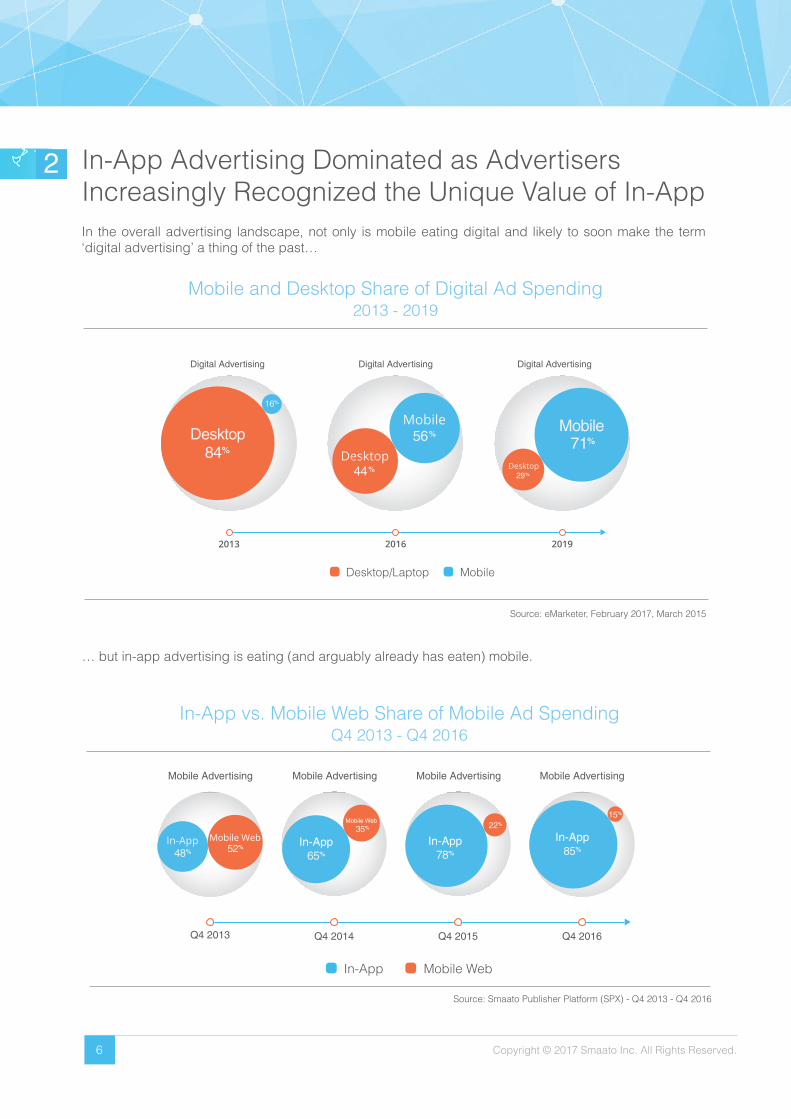
In-App Advertising Dominated as Advertisers Increasingly Recognized the Unique Value of In-AppIn the overall advertising landscape, not only is mobile eating digital and likely to soon make the term ‘digital advertising’ a thing of the past…
… but in-app advertising is eating (and arguably already has eaten) mobile.
2
Mobile and Desktop Share of Digital Ad Spending2013 - 2019
Source: eMarketer, February 2017, March 2015
2013
Digital Advertising
Desktop Mobile
Digital Advertising Digital Advertising
2016 2019
84%
16%
44%
56%
29%
71%
Desktop/Laptop Mobile
Source: Smaato Publisher Platform (SPX) - Q4 2013 - Q4 2016
In-App vs. Mobile Web Share of Mobile Ad SpendingQ4 2013 - Q4 2016
Q4 2013 Q4 2014 Q4 2015 Q4 2016
In-App In-AppIn-App48% 52%
65% 78% 85%
15%
22%Mobile Web
35%
In-App Mobile Web
Mobile Advertising Mobile Advertising Mobile Advertising Mobile Advertising
Copyright © 2017 Smaato Inc. All Rights Reserved. 7
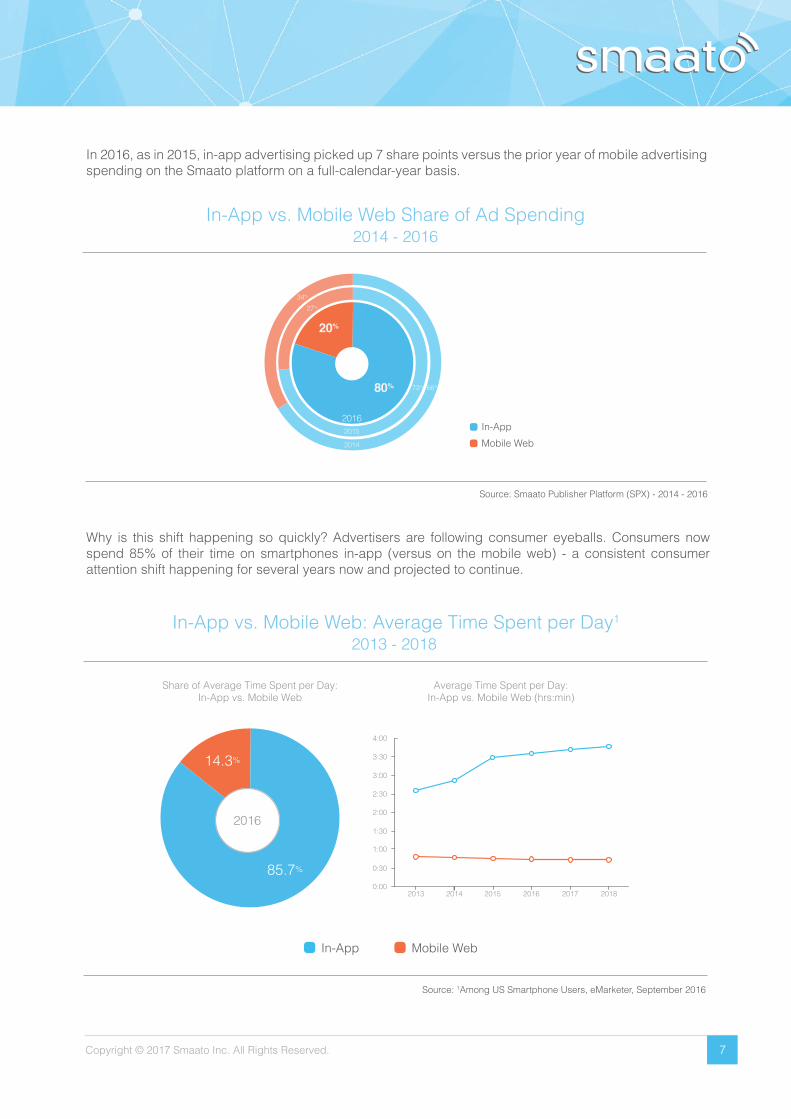
In 2016, as in 2015, in-app advertising picked up 7 share points versus the prior year of mobile advertising spending on the Smaato platform on a full-calendar-year basis.
Source: Smaato Publisher Platform (SPX) - 2014 - 2016
In-App vs. Mobile Web Share of Ad Spending2014 - 2016
Mobile Web
In-App
27%
20162015
2014
34%
20%
80% 73% 66%
Why is this shift happening so quickly? Advertisers are following consumer eyeballs. Consumers now spend 85% of their time on smartphones in-app (versus on the mobile web) - a consistent consumer attention shift happening for several years now and projected to continue.
In-App vs. Mobile Web: Average Time Spent per Day1
Source: 1Among US Smartphone Users, eMarketer, September 2016
2013 - 2018
Mobile WebIn-App
14.3%
85.7%
20152013 20172014 2016 20180:00
0:30
1:00
1:30
2:00
2:30
3:00
3:30
4:00
Share of Average Time Spent per Day:In-App vs. Mobile Web
Average Time Spent per Day:In-App vs. Mobile Web (hrs:min)
2016
Copyright © 2017 Smaato Inc. All Rights Reserved. 8
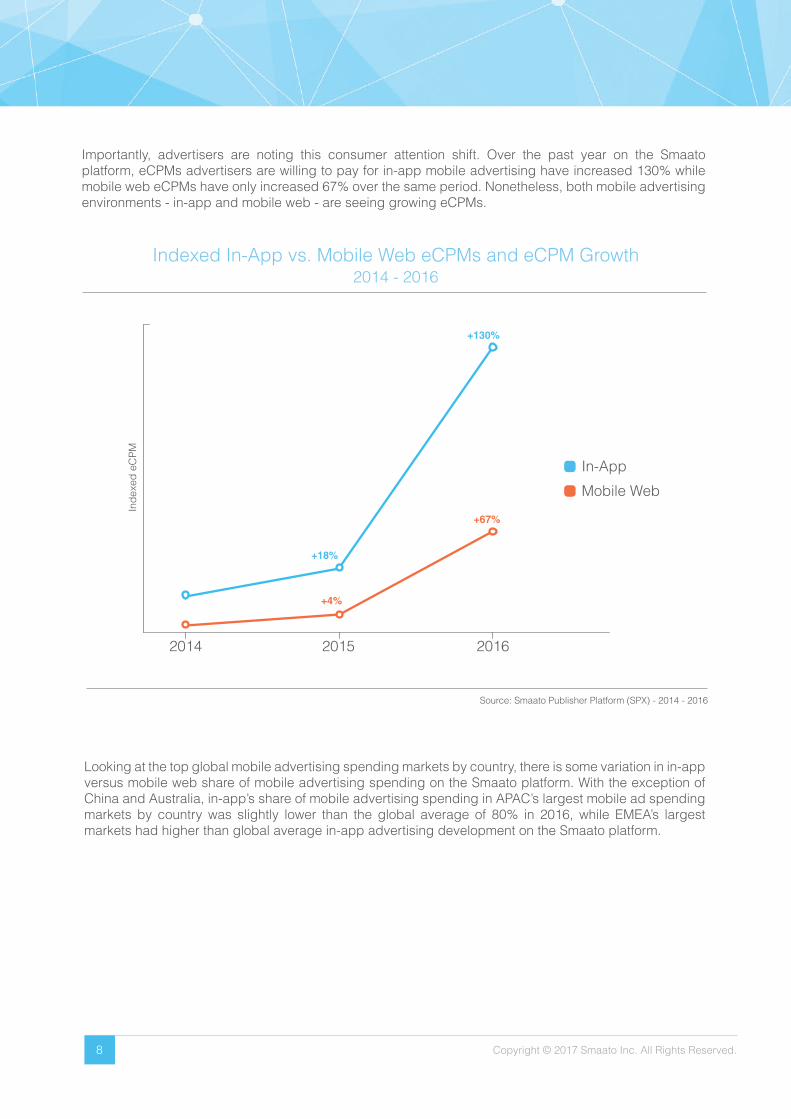
Importantly, advertisers are noting this consumer attention shift. Over the past year on the Smaato platform, eCPMs advertisers are willing to pay for in-app mobile advertising have increased 130% while mobile web eCPMs have only increased 67% over the same period. Nonetheless, both mobile advertising environments - in-app and mobile web - are seeing growing eCPMs.
Source: Smaato Publisher Platform (SPX) - 2014 - 2016
Indexed In-App vs. Mobile Web eCPMs and eCPM Growth2014 - 2016
201620152014
Inde
xed
eCPM
Mobile Web
In-App
+18%
+130%
+4%
+67%
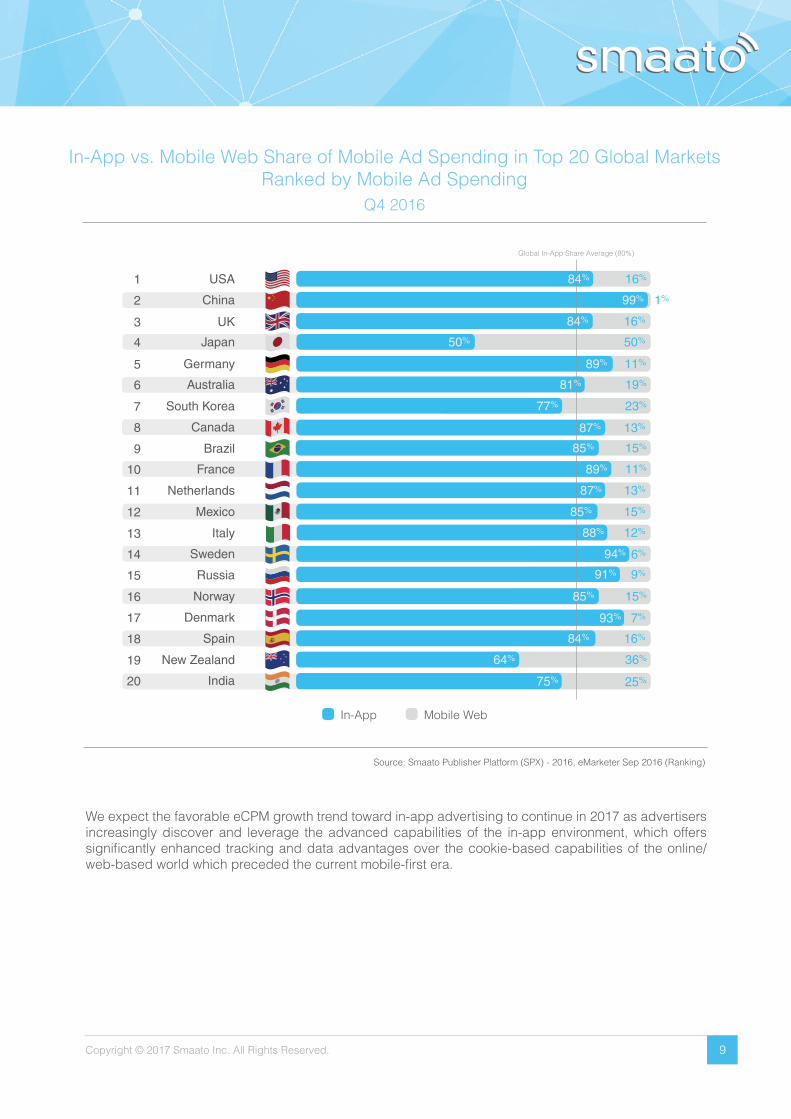
Looking at the top global mobile advertising spending markets by country, there is some variation in in-app versus mobile web share of mobile advertising spending on the Smaato platform. With the exception of China and Australia, in-app’s share of mobile advertising spending in APAC’s largest mobile ad spending markets by country was slightly lower than the global average of 80% in 2016, while EMEA’s largest markets had higher than global average in-app advertising development on the Smaato platform.
Copyright © 2017 Smaato Inc. All Rights Reserved. 9
Source: Smaato Publisher Platform (SPX) - 2016, eMarketer Sep 2016 (Ranking)
We expect the favorable eCPM growth trend toward in-app advertising to continue in 2017 as advertisers increasingly discover and leverage the advanced capabilities of the in-app environment, which offers significantly enhanced tracking and data advantages over the cookie-based capabilities of the online/web-based world which preceded the current mobile-first era.
In-App vs. Mobile Web Share of Mobile Ad Spending in Top 20 Global Markets Ranked by Mobile Ad Spending
Q4 2016
1
2
3
4
5
6
7
8
9
10
11
12
13
14
15
16
17
18
19
20
USA 16%
China 99% 1%
UK
87% 13%
Japan
16%
Germany 89% 11%
Australia 19%
South Korea
89% 11%
Canada
64% 36%
Brazil
75% 25%
France
15%
Netherlands
88% 12%
Mexico
16%
Italy
15%
Sweden
77% 23%
Russia
93% 7%
Norway 15%
Denmark
91% 9%
Spain
94% 6%
91%
New Zealand
50% 50%
India
87% 13%
84%
Global In-App Share Average (80%)
81%
85%
85%
85%
84%
84%
Mobile WebIn-App
Copyright © 2017 Smaato Inc. All Rights Reserved. 10
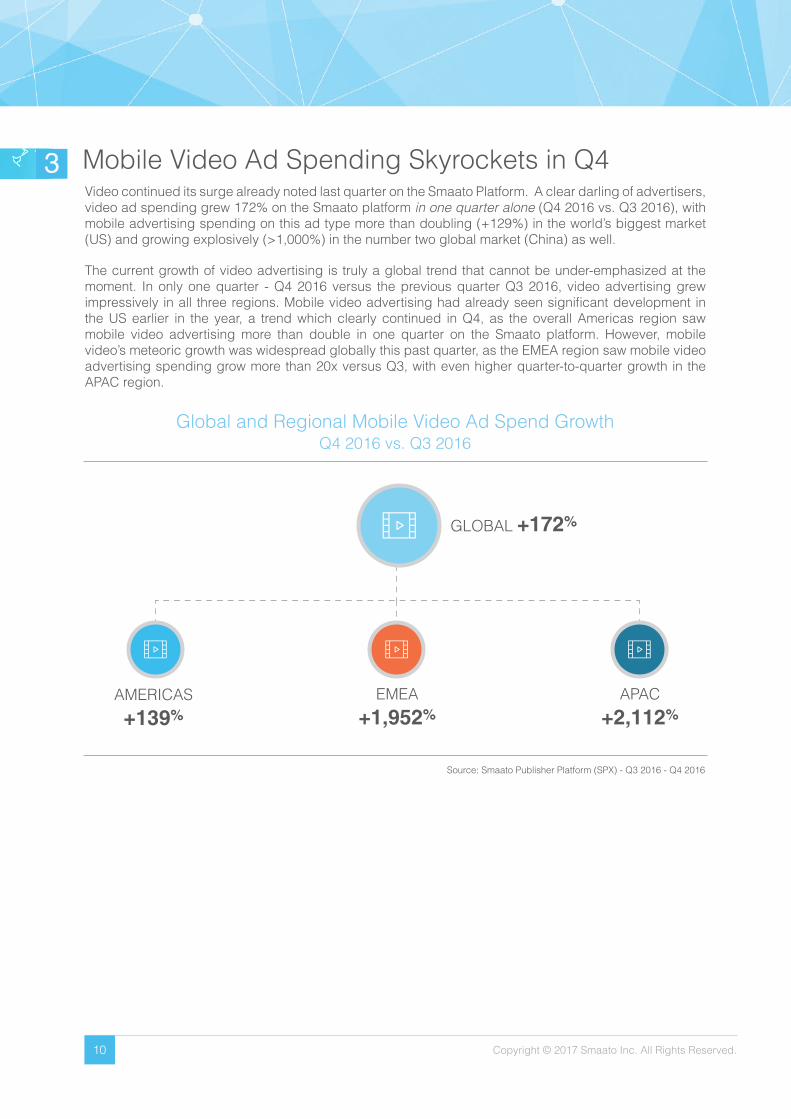
Global and Regional Mobile Video Ad Spend GrowthQ4 2016 vs. Q3 2016
Source: Smaato Publisher Platform (SPX) - Q3 2016 - Q4 2016
Mobile Video Ad Spending Skyrockets in Q43Video continued its surge already noted last quarter on the Smaato Platform. A clear darling of advertisers, video ad spending grew 172% on the Smaato platform in one quarter alone (Q4 2016 vs. Q3 2016), with mobile advertising spending on this ad type more than doubling (+129%) in the world’s biggest market (US) and growing explosively (>1,000%) in the number two global market (China) as well.
The current growth of video advertising is truly a global trend that cannot be under-emphasized at the moment. In only one quarter - Q4 2016 versus the previous quarter Q3 2016, video advertising grew impressively in all three regions. Mobile video advertising had already seen significant development in the US earlier in the year, a trend which clearly continued in Q4, as the overall Americas region saw mobile video advertising more than double in one quarter on the Smaato platform. However, mobile video’s meteoric growth was widespread globally this past quarter, as the EMEA region saw mobile video advertising spending grow more than 20x versus Q3, with even higher quarter-to-quarter growth in the APAC region.
GLOBAL +172%
AMERICAS
+139%
1,952%
EMEA
+1,952%APAC
+2,112%
Copyright © 2017 Smaato Inc. All Rights Reserved. 11
Source: Smaato Publisher Platform (SPX) - Q4 2016
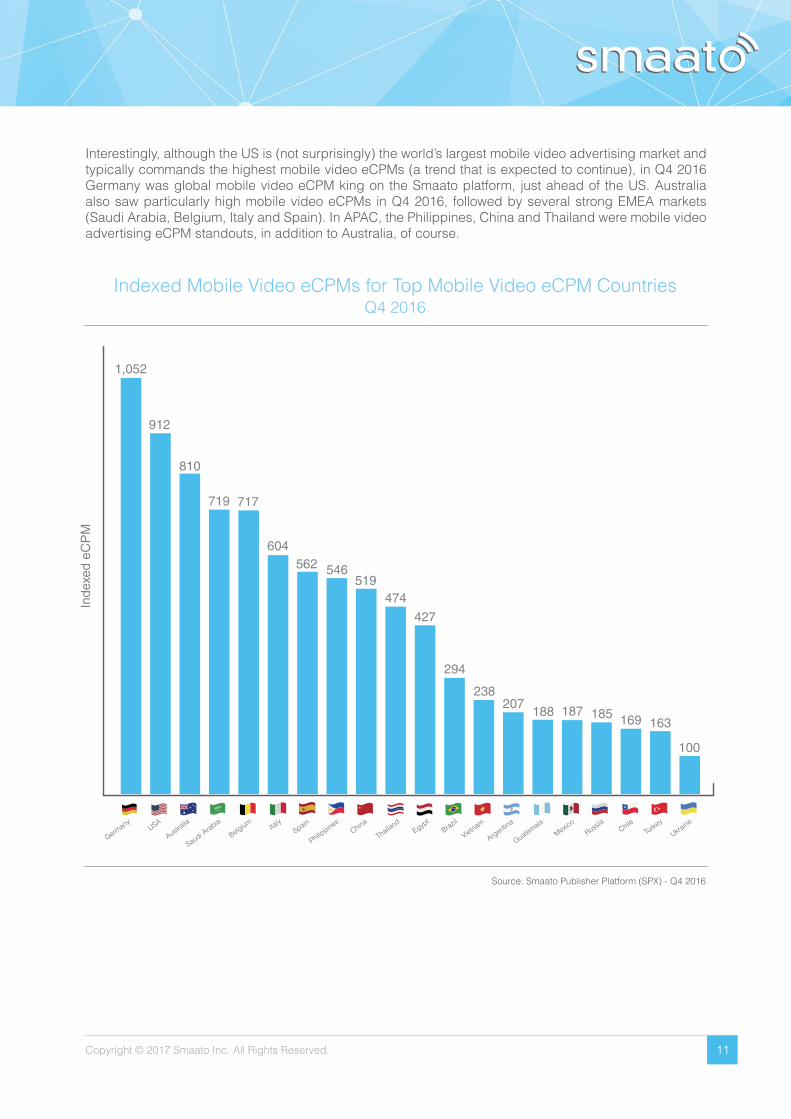
Indexed Mobile Video eCPMs for Top Mobile Video eCPM CountriesQ4 2016
100
163169185187188207
238
294
427
474519
546562604
717719
810
912
1,052
Inde
xed
eCP
M
Germany
USA
Australia
Saudi Arabia
Belgium Italy
Spain
Philippines
China
ThailandEgyp
tBrazil
Vietnam
Argentina
Guatemala
Mexico
Russia
ChileTurke
y
Ukraine
Interestingly, although the US is (not surprisingly) the world’s largest mobile video advertising market and typically commands the highest mobile video eCPMs (a trend that is expected to continue), in Q4 2016 Germany was global mobile video eCPM king on the Smaato platform, just ahead of the US. Australia also saw particularly high mobile video eCPMs in Q4 2016, followed by several strong EMEA markets (Saudi Arabia, Belgium, Italy and Spain). In APAC, the Philippines, China and Thailand were mobile video advertising eCPM standouts, in addition to Australia, of course.
Copyright © 2017 Smaato Inc. All Rights Reserved.
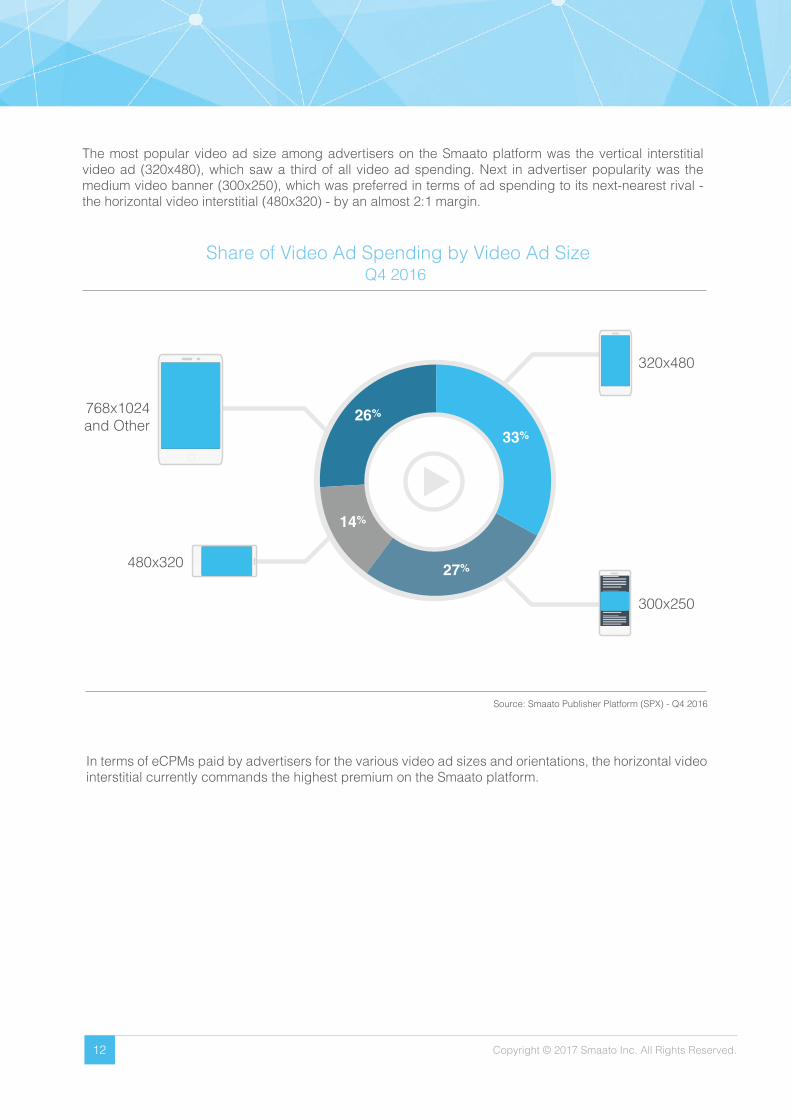
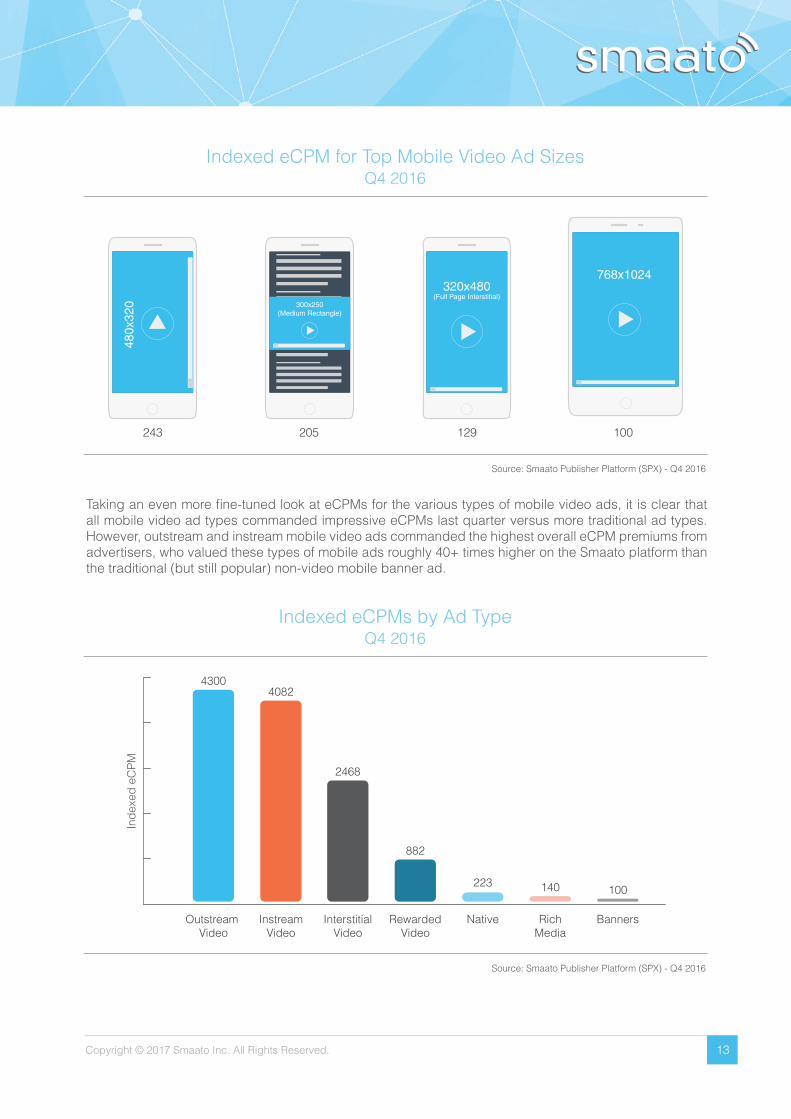
The most popular video ad size among advertisers on the Smaato platform was the vertical interstitial video ad (320x480), which saw a third of all video ad spending. Next in advertiser popularity was the medium video banner (300x250), which was preferred in terms of ad spending to its next-nearest rival - the horizontal video interstitial (480x320) - by an almost 2:1 margin.
12
Source: Smaato Publisher Platform (SPX) - Q4 2016
In terms of eCPMs paid by advertisers for the various video ad sizes and orientations, the horizontal video interstitial currently commands the highest premium on the Smaato platform.
Share of Video Ad Spending by Video Ad SizeQ4 2016
320x480
300x250
768x1024and Other
480x320
26%
14%
33%
27%
Copyright © 2017 Smaato Inc. All Rights Reserved. 13
Source: Smaato Publisher Platform (SPX) - Q4 2016
Source: Smaato Publisher Platform (SPX) - Q4 2016
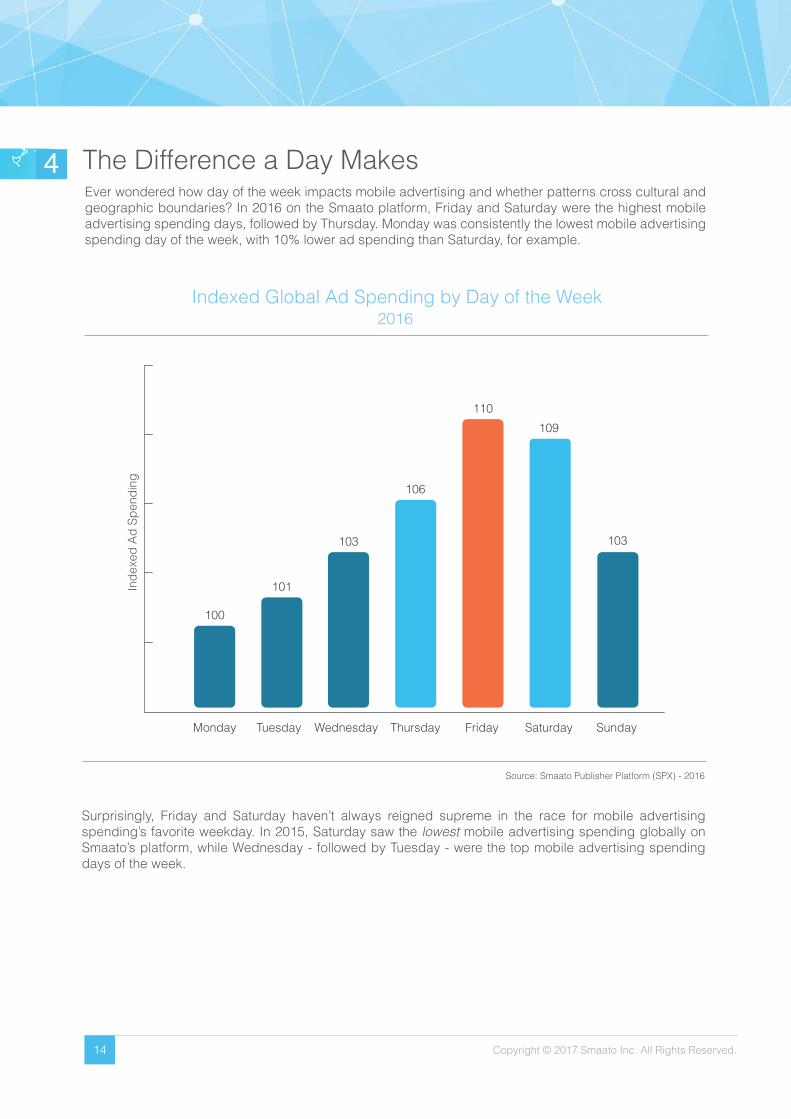
Taking an even more fine-tuned look at eCPMs for the various types of mobile video ads, it is clear that all mobile video ad types commanded impressive eCPMs last quarter versus more traditional ad types. However, outstream and instream mobile video ads commanded the highest overall eCPM premiums from advertisers, who valued these types of mobile ads roughly 40+ times higher on the Smaato platform than the traditional (but still popular) non-video mobile banner ad.
Indexed eCPM for Top Mobile Video Ad Sizes
Indexed eCPMs by Ad Type
Q4 2016
Q4 2016
243
480x
320
205
300x250(Medium Rectangle)
129 100
320x480(Full Page Interstitial)
768x1024
Outstream Video
InstreamVideo
InterstitialVideo
RewardedVideo
Native RichMedia
Banners
Inde
xed
eCPM
43004082
2468
882
223 140 100
Copyright © 2017 Smaato Inc. All Rights Reserved. 14
4
Source: Smaato Publisher Platform (SPX) - 2016
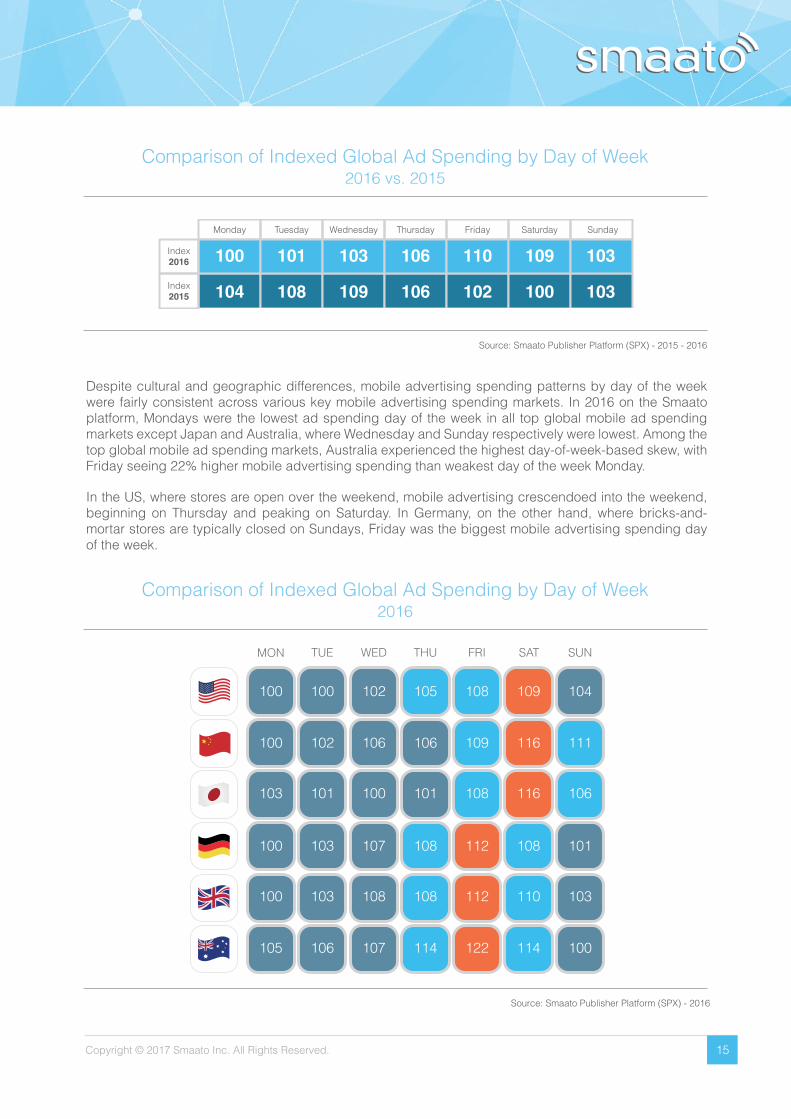
Indexed Global Ad Spending by Day of the Week2016
Surprisingly, Friday and Saturday haven’t always reigned supreme in the race for mobile advertising spending’s favorite weekday. In 2015, Saturday saw the lowest mobile advertising spending globally on Smaato’s platform, while Wednesday - followed by Tuesday - were the top mobile advertising spending days of the week.
The Difference a Day MakesEver wondered how day of the week impacts mobile advertising and whether patterns cross cultural and geographic boundaries? In 2016 on the Smaato platform, Friday and Saturday were the highest mobile advertising spending days, followed by Thursday. Monday was consistently the lowest mobile advertising spending day of the week, with 10% lower ad spending than Saturday, for example.
Monday Tuesday Wednesday Thursday Friday Saturday Sunday
Inde
xed
Ad
Spen
ding
100
101
103
106
110
109
103
Copyright © 2017 Smaato Inc. All Rights Reserved. 15
Source: Smaato Publisher Platform (SPX) - 2015 - 2016
Source: Smaato Publisher Platform (SPX) - 2016
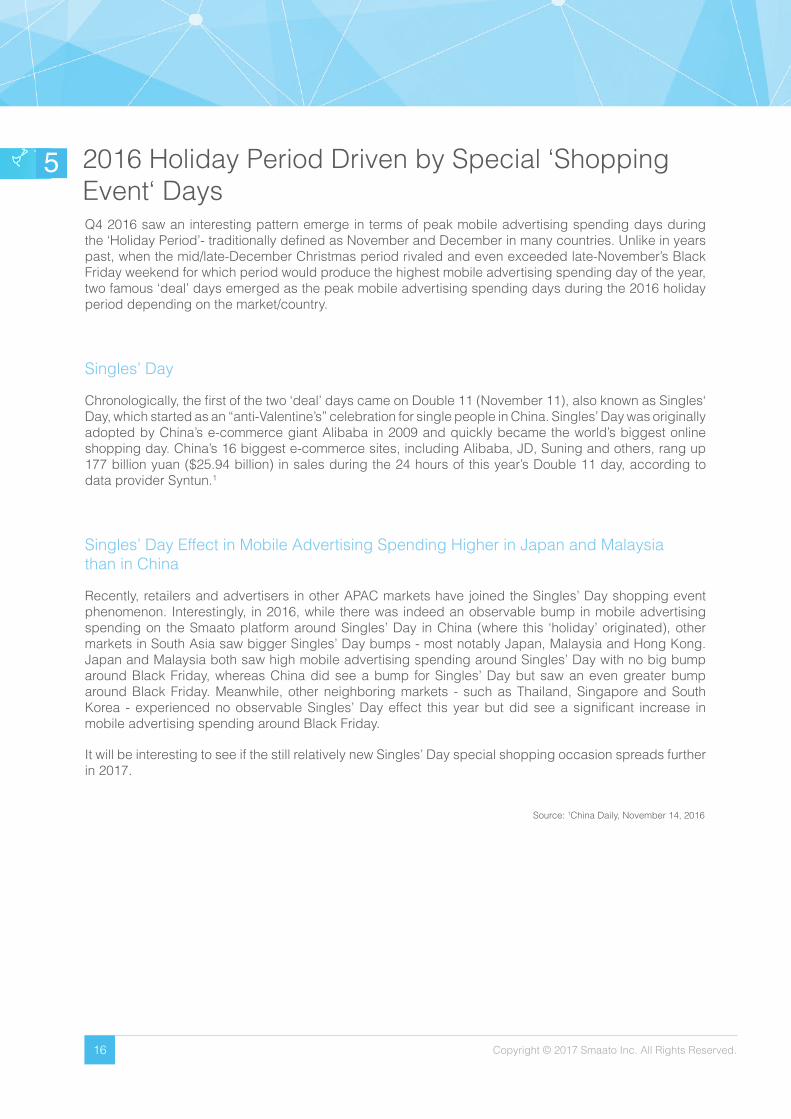
Comparison of Indexed Global Ad Spending by Day of Week
Comparison of Indexed Global Ad Spending by Day of Week
2016 vs. 2015
2016
Despite cultural and geographic differences, mobile advertising spending patterns by day of the week were fairly consistent across various key mobile advertising spending markets. In 2016 on the Smaato platform, Mondays were the lowest ad spending day of the week in all top global mobile ad spending markets except Japan and Australia, where Wednesday and Sunday respectively were lowest. Among the top global mobile ad spending markets, Australia experienced the highest day-of-week-based skew, with Friday seeing 22% higher mobile advertising spending than weakest day of the week Monday.
In the US, where stores are open over the weekend, mobile advertising crescendoed into the weekend, beginning on Thursday and peaking on Saturday. In Germany, on the other hand, where bricks-and-mortar stores are typically closed on Sundays, Friday was the biggest mobile advertising spending day of the week.
Monday
Index2015
Index2016
Tuesday Wednesday Thursday Friday Saturday Sunday
104
100
108
101
109
103
106
106
102
110
100
109
103
103
100 100 102 105 108 109 104
100 102 106 106 109 116 111
103 101 100 101 108 116 106
100 103 107 108 112 108 101
100 103 108 108 112 110 103
105 106 107 114 122 114 100
MON TUE WED THU FRI SAT SUN
Copyright © 2017 Smaato Inc. All Rights Reserved. 16
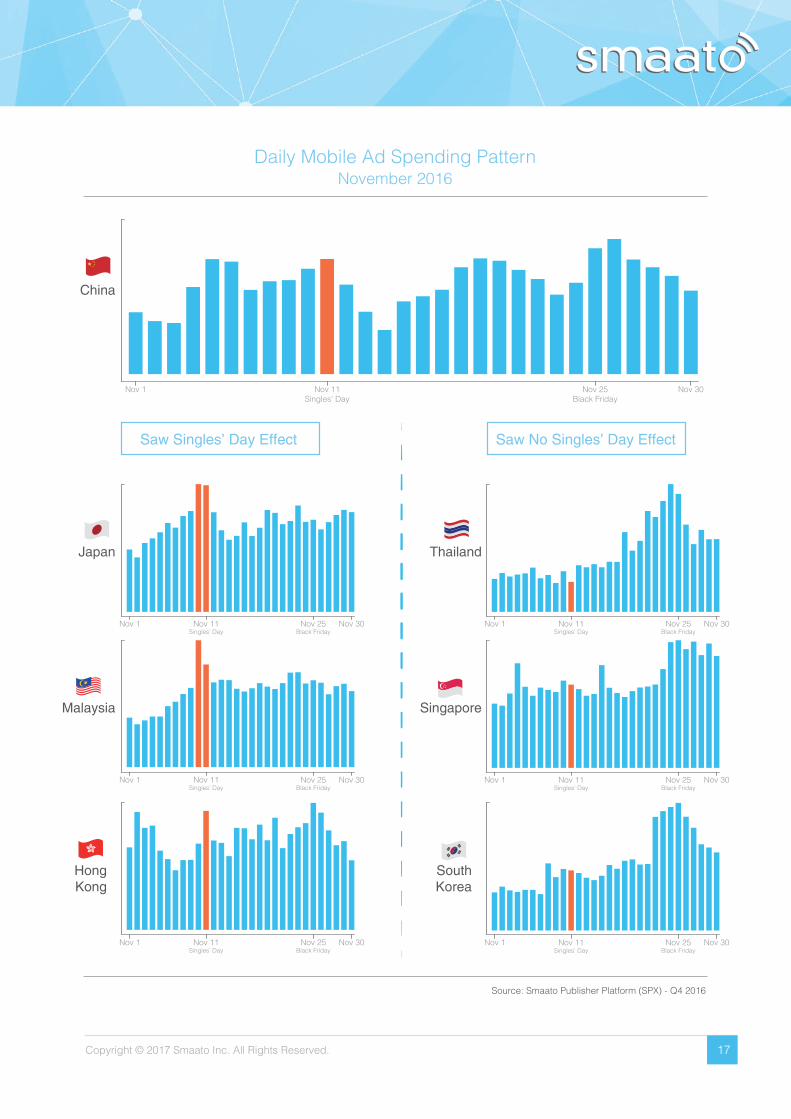
5 2016 Holiday Period Driven by Special ‘Shopping Event‘ DaysQ4 2016 saw an interesting pattern emerge in terms of peak mobile advertising spending days during the ‘Holiday Period’- traditionally defined as November and December in many countries. Unlike in years past, when the mid/late-December Christmas period rivaled and even exceeded late-November’s Black Friday weekend for which period would produce the highest mobile advertising spending day of the year, two famous ‘deal’ days emerged as the peak mobile advertising spending days during the 2016 holiday period depending on the market/country.
Singles’ Day
Chronologically, the first of the two ‘deal’ days came on Double 11 (November 11), also known as Singles‘ Day, which started as an “anti-Valentine’s” celebration for single people in China. Singles’ Day was originally adopted by China’s e-commerce giant Alibaba in 2009 and quickly became the world’s biggest online shopping day. China’s 16 biggest e-commerce sites, including Alibaba, JD, Suning and others, rang up 177 billion yuan ($25.94 billion) in sales during the 24 hours of this year’s Double 11 day, according to data provider Syntun.1
Singles’ Day Effect in Mobile Advertising Spending Higher in Japan and Malaysiathan in China
Recently, retailers and advertisers in other APAC markets have joined the Singles’ Day shopping event phenomenon. Interestingly, in 2016, while there was indeed an observable bump in mobile advertising spending on the Smaato platform around Singles’ Day in China (where this ‘holiday’ originated), other markets in South Asia saw bigger Singles’ Day bumps - most notably Japan, Malaysia and Hong Kong. Japan and Malaysia both saw high mobile advertising spending around Singles’ Day with no big bump around Black Friday, whereas China did see a bump for Singles’ Day but saw an even greater bump around Black Friday. Meanwhile, other neighboring markets - such as Thailand, Singapore and South Korea - experienced no observable Singles’ Day effect this year but did see a significant increase in mobile advertising spending around Black Friday.
It will be interesting to see if the still relatively new Singles’ Day special shopping occasion spreads further in 2017.
Source: 1China Daily, November 14, 2016
Copyright © 2017 Smaato Inc. All Rights Reserved. 17
Source: Smaato Publisher Platform (SPX) - Q4 2016
Daily Mobile Ad Spending PatternNovember 2016
Nov 1 Nov 11Singles’ Day
Nov 25Black Friday
Nov 30
Saw Singles’ Day Effect
Nov 1 Nov 11Singles’ Day
Nov 30Nov 25Black Friday
Nov 11Singles’ Day
Nov 25Black Friday
Nov 11Singles’ Day
Nov 25Black Friday
Nov 11Singles’ Day
Nov 25Black Friday
Japan
Nov 1 Nov 30
Malaysia
Nov 1 Nov 30
HongKong
Nov 1 Nov 30
Thailand
Nov 1 Nov 30
Singapore
Nov 1 Nov 30
SouthKorea
Saw No Singles’ Day Effect
China
Nov 11Singles’ Day
Nov 25Black Friday
Nov 11Singles’ Day
Nov 25Black Friday
Copyright © 2017 Smaato Inc. All Rights Reserved. 18
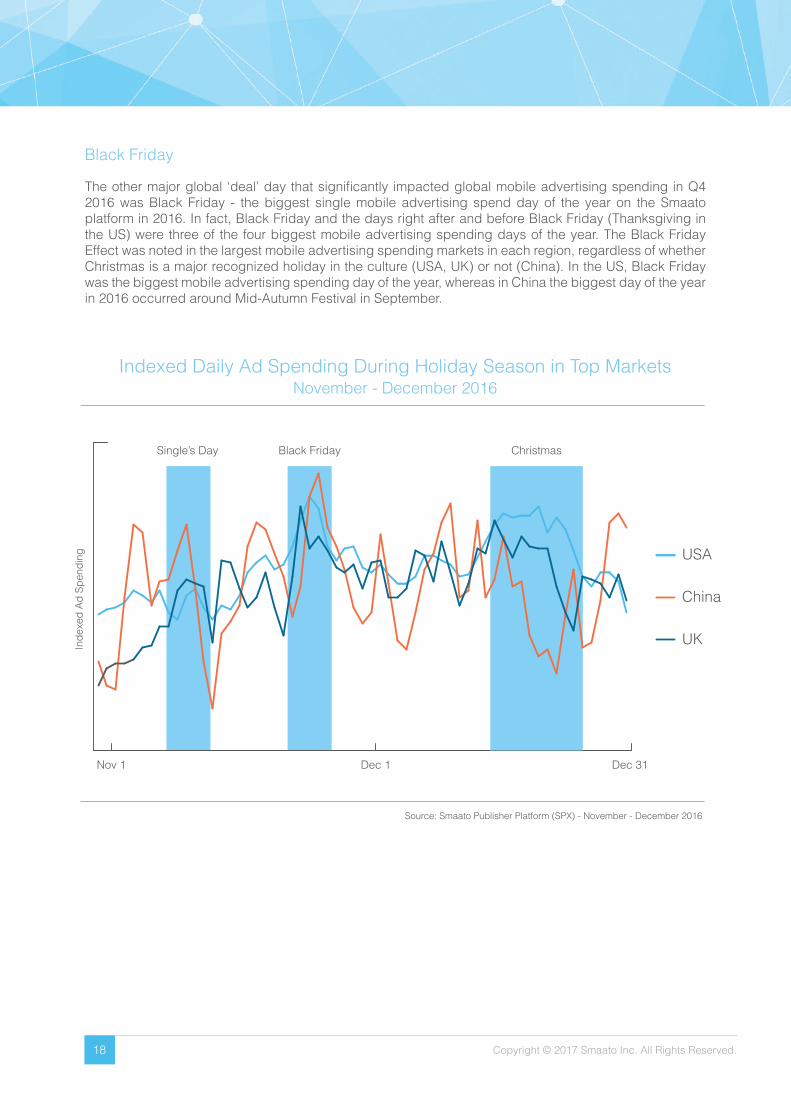
Source: Smaato Publisher Platform (SPX) - November - December 2016
Indexed Daily Ad Spending During Holiday Season in Top MarketsNovember - December 2016
Black Friday
The other major global ‘deal’ day that significantly impacted global mobile advertising spending in Q4 2016 was Black Friday - the biggest single mobile advertising spend day of the year on the Smaato platform in 2016. In fact, Black Friday and the days right after and before Black Friday (Thanksgiving in the US) were three of the four biggest mobile advertising spending days of the year. The Black Friday Effect was noted in the largest mobile advertising spending markets in each region, regardless of whether Christmas is a major recognized holiday in the culture (USA, UK) or not (China). In the US, Black Friday was the biggest mobile advertising spending day of the year, whereas in China the biggest day of the year in 2016 occurred around Mid-Autumn Festival in September.
USA
China
UK
Nov 1 Dec 1 Dec 31
Single’s Day Black Friday Christmas
Inde
xed
Ad
Spen
ding
Copyright © 2017 Smaato Inc. All Rights Reserved. 19
Thank You
About Smaato
We hope you’ve enjoyed Smaato’s report on Global Trends in Mobile Advertising - Q4 2016. To download white papers, read case studies and subscribe to our monthly publisher & app developer newsletter, visit us online at www.smaato.com.
Smaato is the leading global real-time advertising platform for mobile publishers and app developers. Smaato runs the world’s largest independent mobile ad exchange and has been pioneering innovative, mobile-first solutions for publishers since 2005.
The Smaato Publisher Platform (SPX) is a global, intelligent and free-to-use self-service platform and ad server that brings native, video and real-time advertising to over 90,000 app developers and mobile publishers. The company’s worldwide reach and extensive network of 450+ demand partners provides a massive variety of advertisers with one single integration. Smaato manages up to 10 billion ads every day around the world, across over 1 billion unique mobile users each month.