Embed Size (px)
Citation preview
Global Top 100 companies by market capitalisation
31 March 2018 update
An IPO Centre publication
PwC | Title
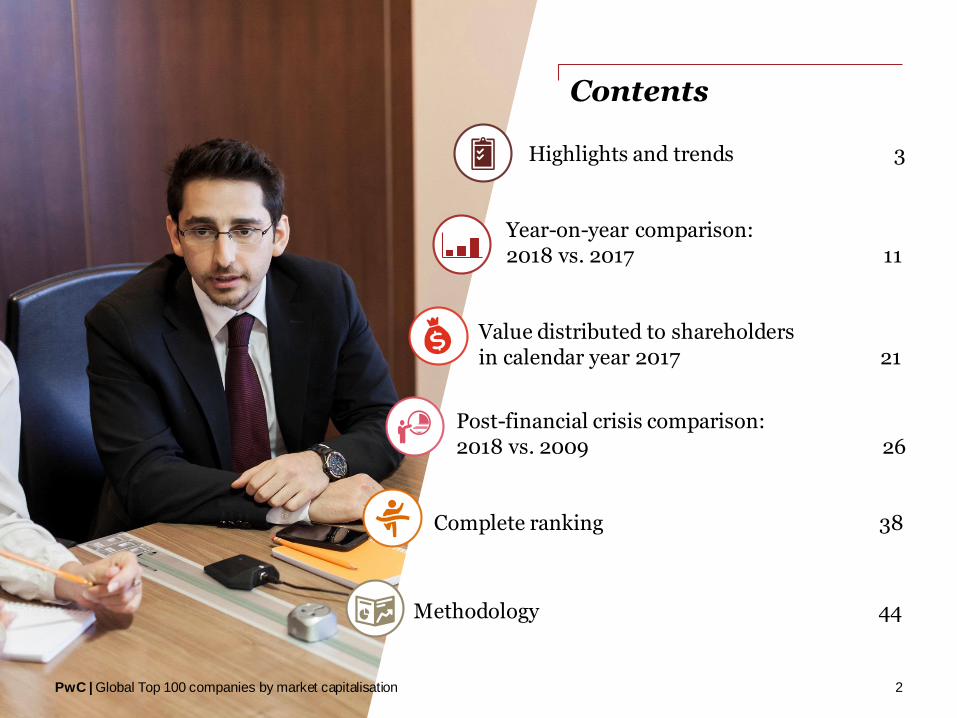
Highlights and trends 3
Year-on-year comparison:2018 vs. 2017 11
Value distributed to shareholdersin calendar year 2017 21
Post-financial crisis comparison:2018 vs. 2009 26
Complete ranking 38
2PwC | Global Top 100 companies by market capitalisation
Contents
Methodology 44
3
Agenda
PwC | Global Top 100 companies by market capitalisation 3
Highlights and trends
Year-on-year comparison:
2018 vs. 2017
Value distributed to shareholders in calendar
year 2017
Post-financial crisis comparison: 2018 vs. 2009
Completeranking
Highlights and trends
PwC | Global Top 100 companies by market capitalisation
Introduction
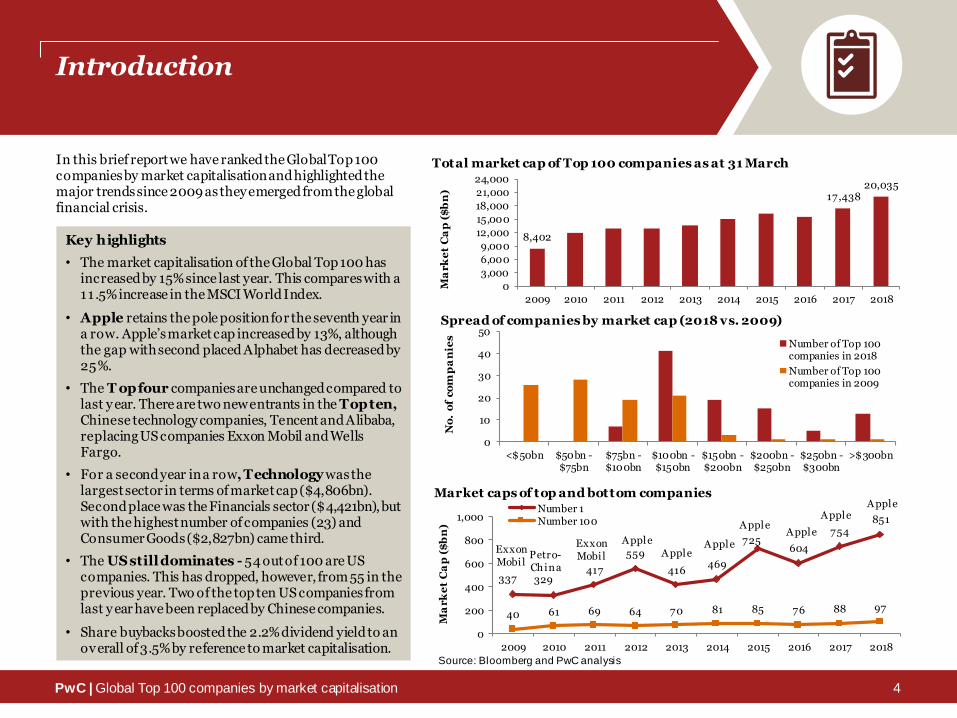
In this brief report we have ranked the Global Top 100 companies by market capitalisation and highlighted the major trends since 2009 as they emerged from the global financial crisis.
337 329417
559
416469
725604
754851
40 61 69 64 70 81 85 76 88 97
0
200
400
600
800
1,000
2009 2010 2011 2012 2013 2014 2015 2016 2017 2018
Ma
rk
et C
ap
($
bn
)
Market caps of top and bottom companiesNumber 1Number 100
A pple
A pple
A ppleA pple
A ppleA pple
A pple
8,402
17,43820,035
0
3,000
6,000
9,000
12,000
15,000
18,000
21,000
24,000
2009 2010 2011 2012 2013 2014 2015 2016 2017 2018
Ma
rk
et C
ap
($
bn
)
Total market cap of Top 100 companies as at 31 March
0
10
20
30
40
50
<$50bn $50bn -$75bn
$75bn -$100bn
$100bn -$150bn
$150bn -$200bn
$200bn -$250bn
$250bn -$300bn
>$300bnN
o.
of c
om
pa
nie
s
Spread of companies by market cap (2018 vs. 2009)
Number of Top 100companies in 2018
Number of Top 100companies in 2009
Key highlights
• The market capitalisation of the Global Top 100 has increased by 15% since last year. This compares with a 11 .5% increase in the MSCI World Index.
• Apple retains the pole position for the seventh year in a row. Apple’s market cap increased by 13%, although the gap with second placed Alphabet has decreased by 25%.
• The T op four companies are unchanged compared to last y ear. There are two new entrants in the Top ten, Chinese technology companies, Tencent and Alibaba, replacing US companies Exxon Mobil and Wells Fargo.
• For a second year in a row, Technology wasthe largest sector in terms of market cap ($4,806bn). Second place was the Financials sector ($4,421bn), but with the highest number of companies (23) and Consumer Goods ($2,827bn) came third.
• The US still dominates - 54 out of 100 are US companies. This has dropped, however, from 55 in the previous year. Two of the top ten US companies from last y ear have been replaced by Chinese companies.
• Share buybacks boosted the 2.2% dividend yield to an overall of 3.5% by reference to market capitalisation.
Source: Bloomberg and PwC analysis
Exxon Mobil
Petro-China
Exxon Mobil
4
PwC | Global Top 100 companies by market capitalisation
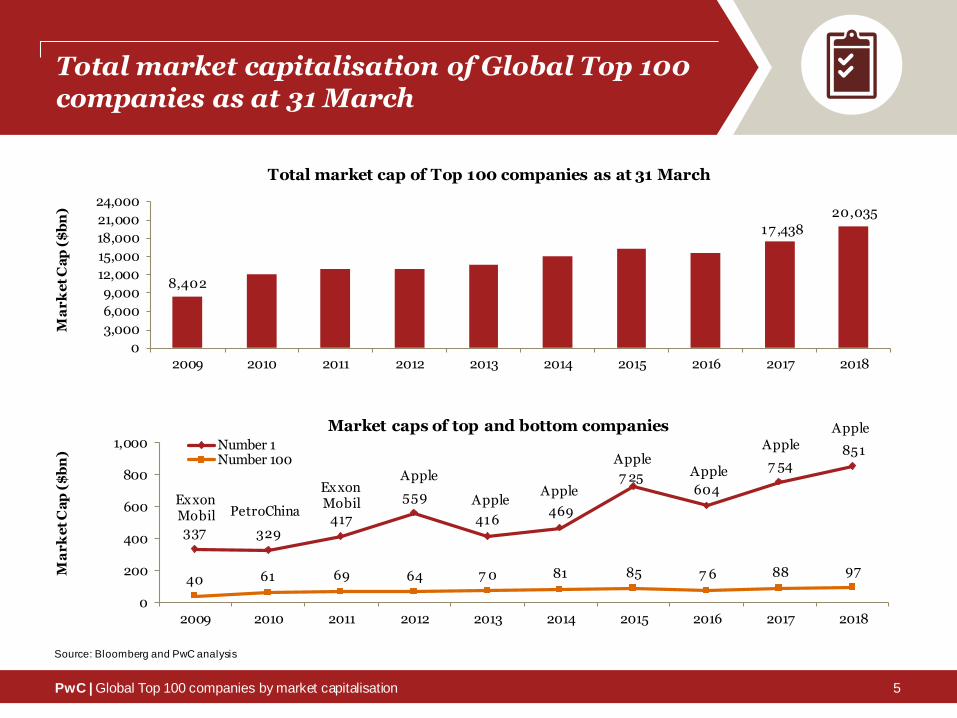
Total market capitalisation of Global Top 100 companies as at 31 March
8,402
17,438
20,035
0
3,000
6,000
9,000
12,000
15,000
18,000
21,000
24,000
2009 2010 2011 2012 2013 2014 2015 2016 2017 2018
Ma
rk
et
Ca
p (
$b
n)
Total market cap of Top 100 companies as at 31 March
337 329417
559
416469
7 25604
7 54851
40 61 69 64 7 0 81 85 7 6 88 97
0
200
400
600
800
1,000
2009 2010 2011 2012 2013 2014 2015 2016 2017 2018
Ma
rk
et
Ca
p (
$b
n)
Market caps of top and bottom companiesNumber 1Number 100
Source: Bloomberg and PwC analysis
Apple
ApplePetroChina
Apple
AppleApple
Exxon Mobil
AppleAppleExxon
Mobil
5
PwC | Global Top 100 companies by market capitalisation
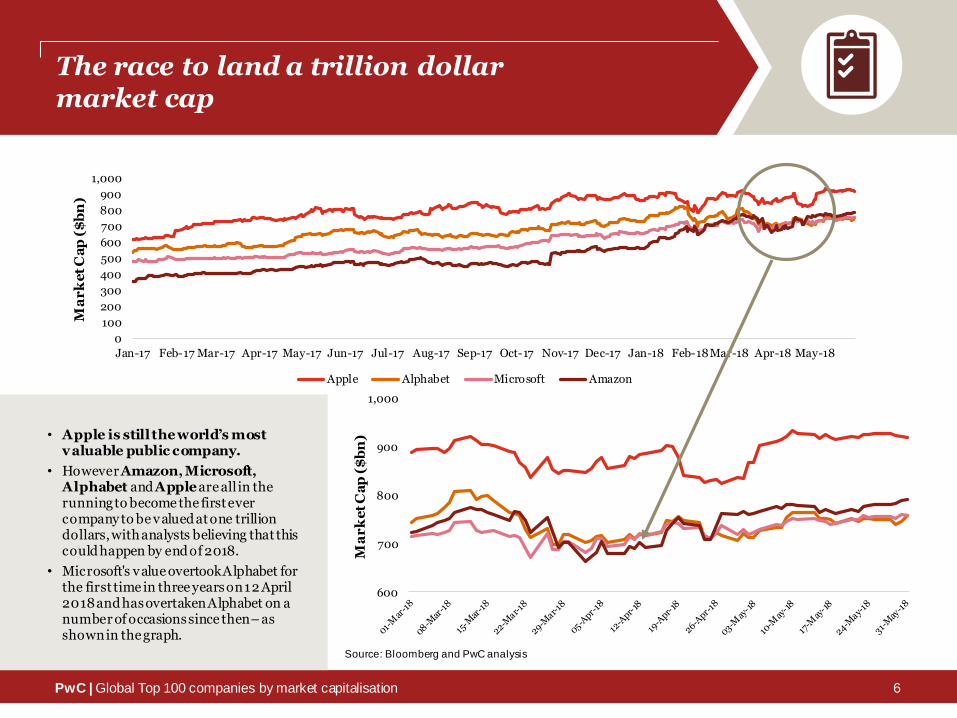
The race to land a trillion dollarmarket cap
• Apple is still the world’s most valuable public company.
• HoweverAmazon, Microsoft, Alphabet andApple are all in the running to become the first ever company to be valued at one trillion dollars, with analysts believing that this could happen by end of 2018.
• Microsoft's value overtook Alphabet for the first time in three years on 12 April 2018 and has overtaken Alphabet on a number of occasions since then – as shown in thegraph.
Source: Bloomberg and PwC analysis
0
100
200
300
400
500
600
700
800
900
1,000
Jan-17 Feb-17 Mar-17 Apr-17 May-17 Jun-17 Jul-17 Aug-17 Sep-17 Oct-17 Nov-17 Dec-17 Jan-18 Feb-18Mar-18 Apr-18 May-18
Ma
rk
et
Ca
p (
$b
n)
Apple Alphabet Microsoft Amazon
600
700
800
900
1,000
Ma
rk
et
Ca
p (
$b
n)
6
PwC | Global Top 100 companies by market capitalisation
Market cap of the Global Top 100 by world region
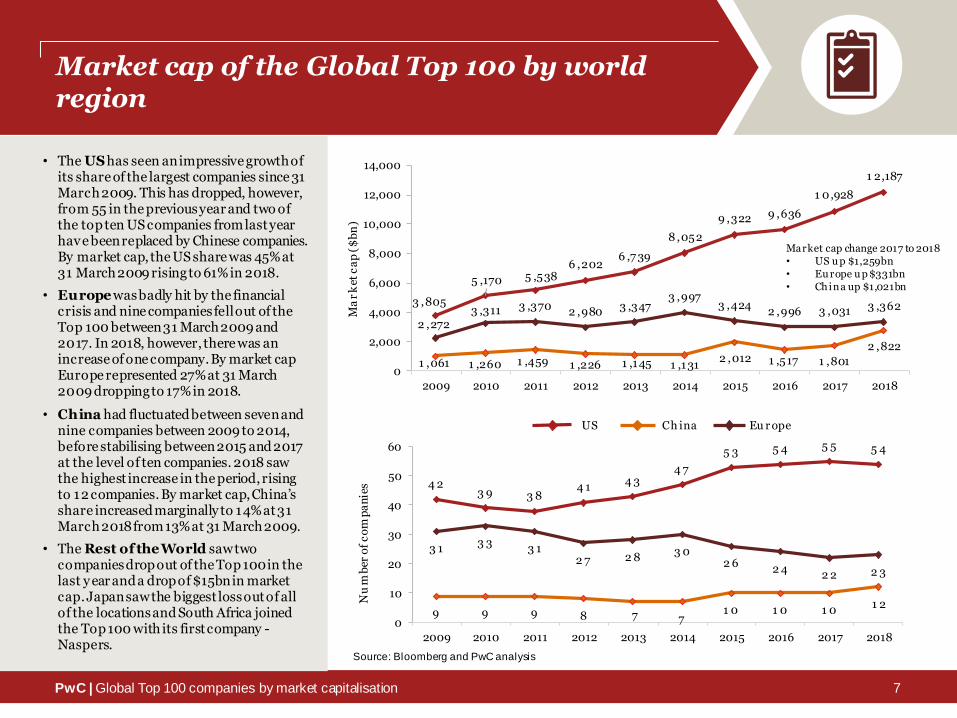
• The UShas seen an impressive growth of its share of the largest companies since 31 March 2009. This has dropped, however, from 55 in the previous year and two of the top ten US companies from last year have been replaced by Chinese companies. By market cap, the US share was 45% at 31 March 2009 rising to 61% in 2018.
• Europe was badly hit by the financial crisis and nine companies fell out of the Top 100 between 31 March 2009 and 2017. In 2018, however, there was an increase of one company. By market cap Europe represented 27% at 31 March 2009 dropping to 17% in 2018.
• China had fluctuated between seven and nine companies between 2009 to 2014, before stabilising between 2015 and 2017 at the level of ten companies. 2018 saw the highest increase in the period, rising to 12 companies. By market cap, China’s share increased marginally to 14% at 31 March 2018 from 13% at 31 March 2009.
• The Rest of the World saw two companies drop out of the Top 100 in the last y ear and a drop of $15bn in market cap. Japan saw the biggest loss out of all of the locations and South Africa joined the Top 100 with its first company -Naspers.
Source: Bloomberg and PwC analysis
3 ,805
5 ,170 5 ,5386 ,202
6 ,7 39
8 ,052
9 ,322 9 ,636
1 0,928
1 2,187
1 ,061 1 ,260 1 ,459 1 ,226 1 ,145 1 ,1312 ,012 1 ,517 1 ,801
2 ,822
2 ,2723 ,311 3 ,370 2 ,980 3 ,347
3 ,9973 ,424
2 ,996 3 ,031 3 ,362
0
2,000
4,000
6,000
8,000
10,000
12,000
14,000
2009 2010 2011 2012 2013 2014 2015 2016 2017 2018
Ma
rk
et c
ap
($
bn
)
Market cap change 2017 to 2018 • US u p $1,259bn• Eu rope u p $331bn• China up $1,021bn
4 23 9 3 8
4 14 3
4 7
5 3 5 4 5 5 5 4
9 9 9 8 7 71 0 1 0 1 0
1 2
3 13 3
3 12 7 2 8
3 02 6
2 42 2 2 3
0
10
20
30
40
50
60
2009 2010 2011 2012 2013 2014 2015 2016 2017 2018
Nu
mb
er o
f c
om
pa
nie
s
US Ch ina Eu r ope
7
PwC | Global Top 100 companies by market capitalisation
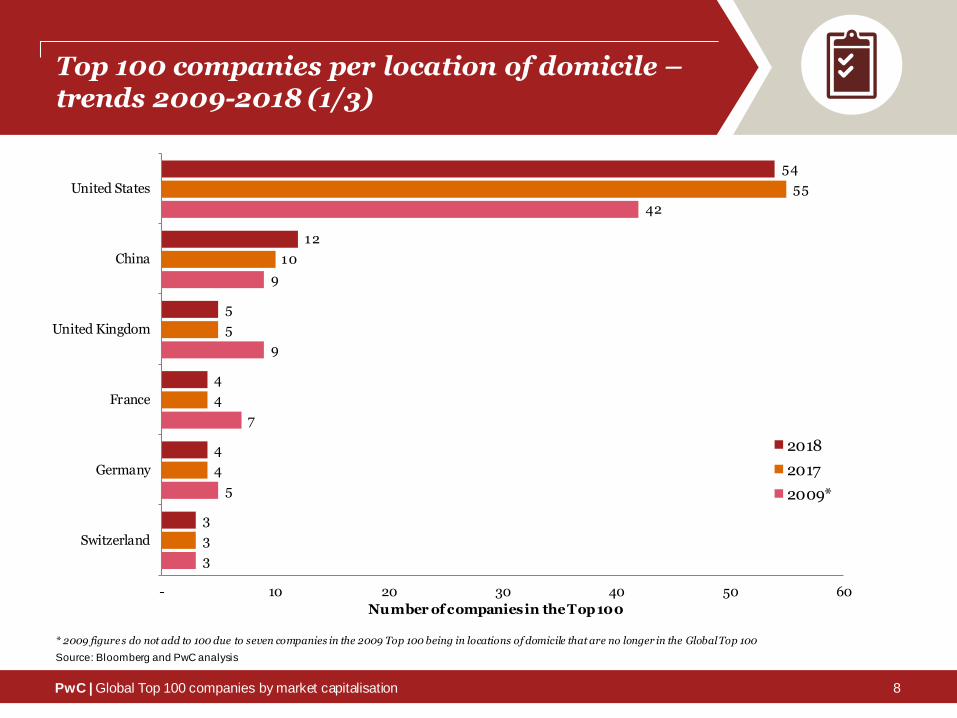
Top 100 companies per location of domicile –trends 2009-2018 (1/3)
Source: Bloomberg and PwC analysis
* 2009 figure s do not add to 100 due to seven companies in the 2009 Top 100 being in locations of domicile that are no longer in the Global Top 100
3
5
7
9
9
42
3
4
4
5
10
55
3
4
4
5
12
54
- 10 20 30 40 50 60
Switzerland
Germany
France
United Kingdom
China
United States
Number of companies in the Top 100
2018
2017
2009*
8
PwC | Global Top 100 companies by market capitalisation
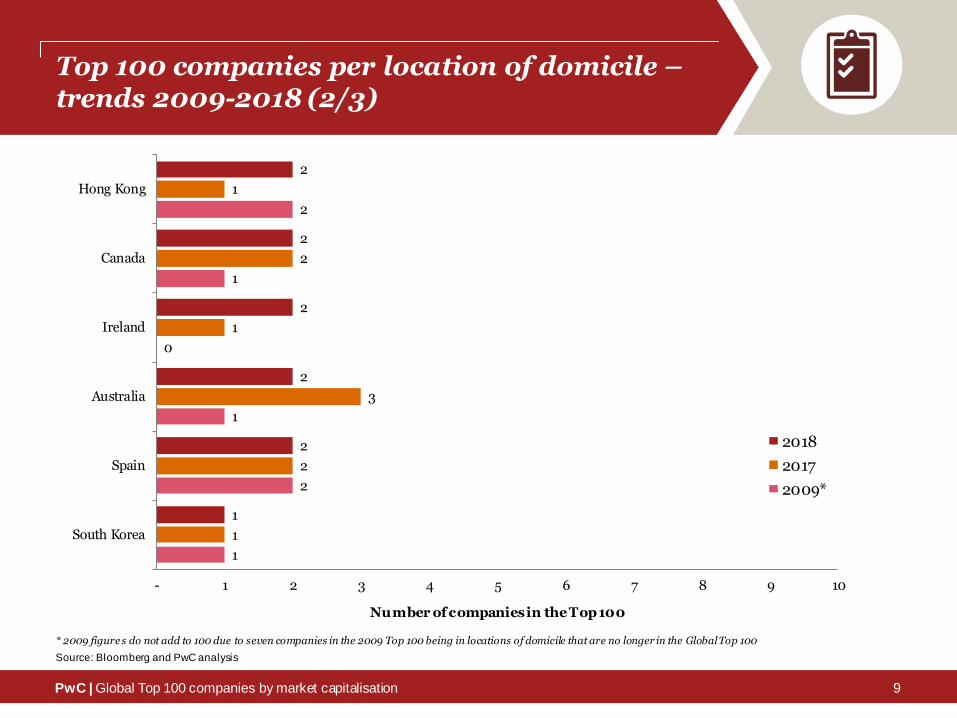
Top 100 companies per location of domicile –trends 2009-2018 (2/3)
Source: Bloomberg and PwC analysis
* 2009 figure s do not add to 100 due to seven companies in the 2009 Top 100 being in locations of domicile that are no longer in the Global Top 100
1
2
1
0
1
2
1
2
3
1
2
1
1
2
2
2
2
2
- 1 2 3 4 5 6 7 8 9 10
South Korea
Spain
Australia
Ireland
Canada
Hong Kong
Number of companies in the Top 100
2018
2017
2009*
9
PwC | Global Top 100 companies by market capitalisation
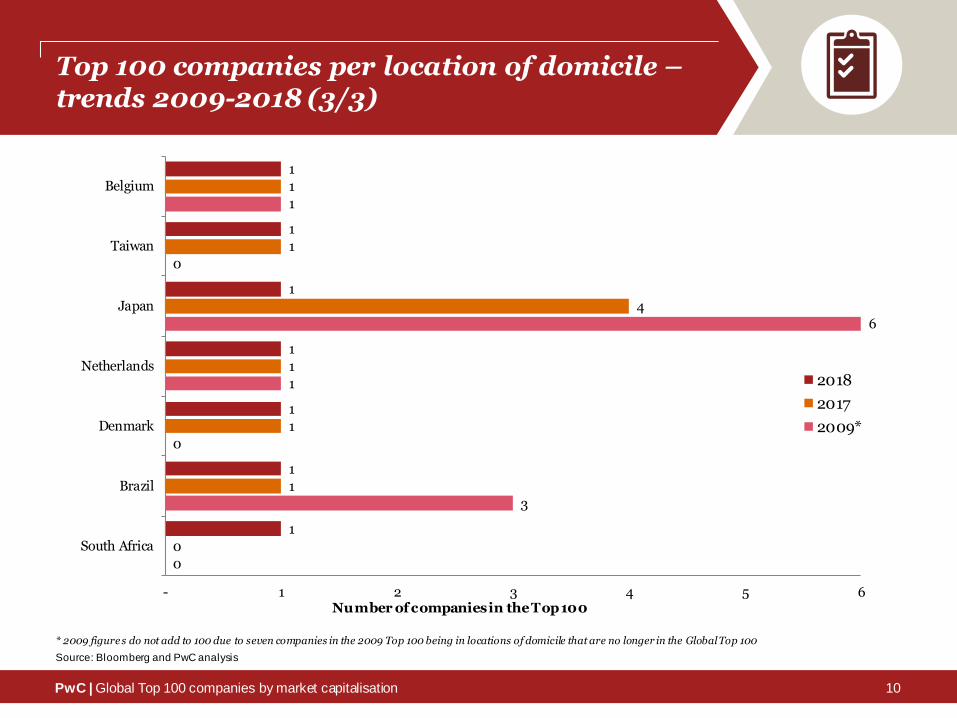
Top 100 companies per location of domicile –trends 2009-2018 (3/3)
Source: Bloomberg and PwC analysis
* 2009 figure s do not add to 100 due to seven companies in the 2009 Top 100 being in locations of domicile that are no longer in the Global Top 100
0
3
0
1
6
0
1
0
1
1
1
4
1
1
1
1
1
1
1
1
1
- 1 2 3 4 5 6
South Africa
Brazil
Denmark
Netherlands
Japan
Taiwan
Belgium
Number of companies in the Top 100
2018
2017
2009*
10
11
Agenda
PwC | Global Top 100 companies by market capitalisation 11
Highlights and trends
Year-on-year comparison:
2018 vs. 2017
Value distributed to shareholders in calendar
year 2017
Post-financial crisis comparison: 2018 vs. 2009
Completeranking
Year-on-year comparison2018 vs. 2017
PwC | Global Top 100 companies by market capitalisation
The movements
Key highlights
• Top 100 companies market cap increased by 15% compared to 31 March 2017.
• The US is the largest contributor of the Top 100, gaining $1,259bn to total $12,187bn.
• China, the second largest contributor to the Top 100, saw an increase of 57% when compared to the Top 100 companies at 31 March 2017, totalling $2,822bn.
• 85 companies from 2017 survived to be in the list at 31 March 2018 – a decrease of 7% compared to last year (91 companies from the 2016 Top 100 list were on the 2017 list).
• There were no direct entries via IPO this year. The last company to enter the Top 100 via IPO was Alibaba in 2014.
• The market cap of the most valuable company at 31 March 2018, Apple, increased by 13% to $851bn. The US still has the highest combined market capitalisation of national Global Top 100 companies ($12,187bn), a 12% increase since 31 March 2017.
• 2018 has not seen much change in the location split compared to 2017: the US dominates with 54 US companies in the Global Top 100 (55 in 2017, 42 in 2009). China holds the second position with 12 companies (two more than last year and three more than 2009) and the UK comes third with five companies (no change from last year, there were nine in 2009).
• The threshold to enter the Top 100 has increased to $97bn this year, compared to $88bn in March 2017.
12
PwC | Global Top 100 companies by market capitalisation
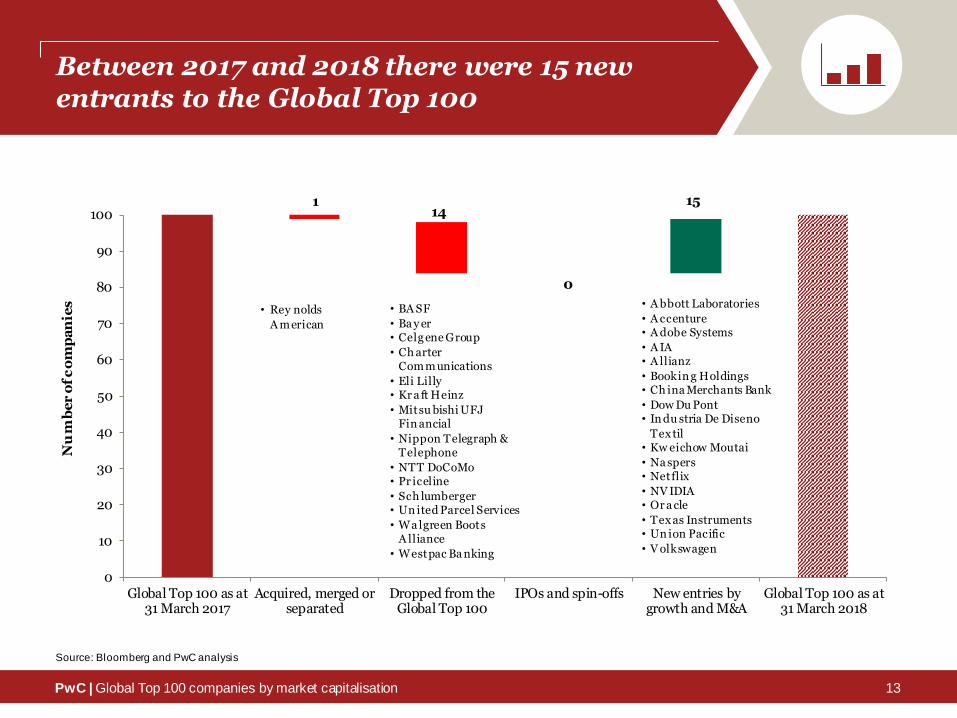
Between 2017 and 2018 there were 15 new entrants to the Global Top 100
114
0
15
0
10
20
30
40
50
60
70
80
90
100
Global Top 100 as at31 March 2017
Acquired, merged orseparated
Dropped from theGlobal Top 100
IPOs and spin-offs New entries bygrowth and M&A
Global Top 100 as at31 March 2018
Nu
mb
er
of
co
mp
an
ies • Rey nolds
A merican
Source: Bloomberg and PwC analysis
• BA SF
• Ba y er • Celg ene Group
• Ch arter Com m unications
• Eli Lilly • Kr a ft Heinz
• Mitsu bishi UFJ Fin ancial
• Nippon Telegraph & Telephone
• NTT DoCoMo• Pr iceline
• Sch lumberger • Un ited Parcel Services
• Wa lgreen Boots A lliance
• Westpac Ba nking
• A bbott Laboratories
• A ccenture • A dobe Systems
• A IA • A llianz
• Bookin g Holdings• Ch ina Merchants Bank
• Dow Du Pont• In du stria De Diseno
Tex til• Kw eichow Moutai
• Na spers • Netflix
• NV IDIA• Or a cle
• Tex as Instruments • Un ion Pacific
• V olkswagen
13
PwC | Global Top 100 companies by market capitalisation
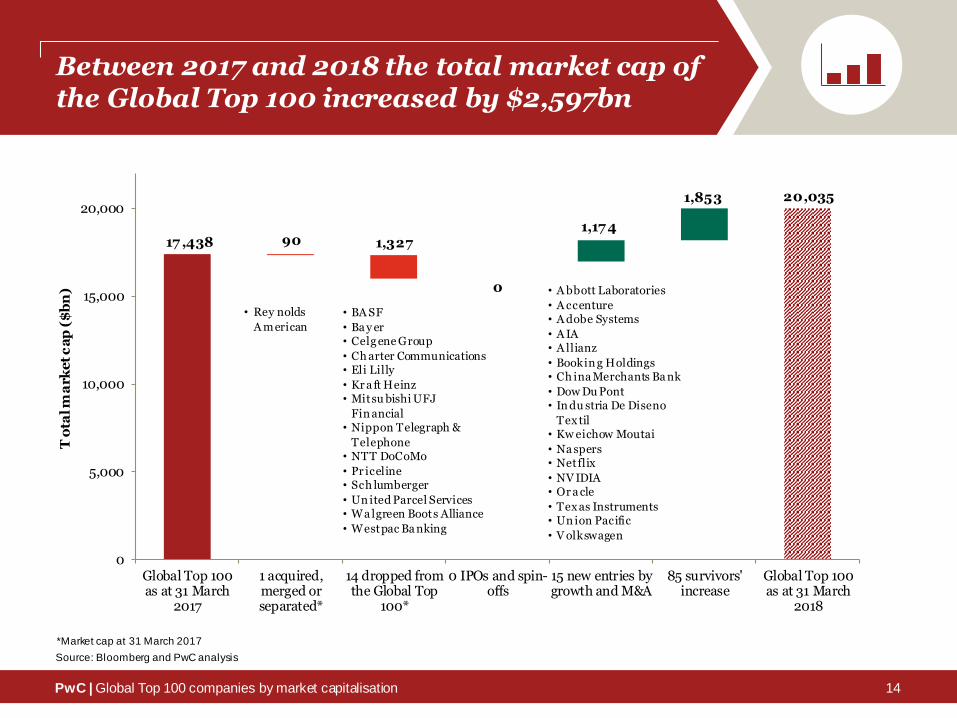
Between 2017 and 2018 the total market cap of the Global Top 100 increased by $2,597bn
Source: Bloomberg and PwC analysis
0
17 ,438 90 1,3271,17 4
1,853 20,035
0
5,000
10,000
15,000
20,000
Global Top 100as at 31 March
2017
1 acquired,merged orseparated*
14 dropped fromthe Global Top
100*
0 IPOs and spin-offs
15 new entries bygrowth and M&A
85 survivors'increase
Global Top 100as at 31 March
2018
To
tal m
ark
et
ca
p (
$b
n)
• Rey nolds
A merican
*Market cap at 31 March 2017
• BA SF
• Ba y er • Celg ene Group
• Ch arter Communications• Eli Lilly
• Kr a ft Heinz • Mitsu bishi UFJ
Fin ancial • Nippon Telegraph &
Telephone • NTT DoCoMo
• Pr iceline• Sch lumberger
• Un ited Parcel Services• Wa lgreen Boots Alliance
• Westpac Ba nking
• A bbott Laboratories
• A ccenture • A dobe Systems
• A IA • A llianz
• Bookin g Holdings• Ch ina Merchants Ba nk
• Dow Du Pont• In du stria De Diseno
Tex til• Kw eichow Moutai
• Na spers • Netflix
• NV IDIA• Or a cle
• Tex as Instruments • Un ion Pacific
• V olkswagen
14
PwC | Global Top 100 companies by market capitalisation
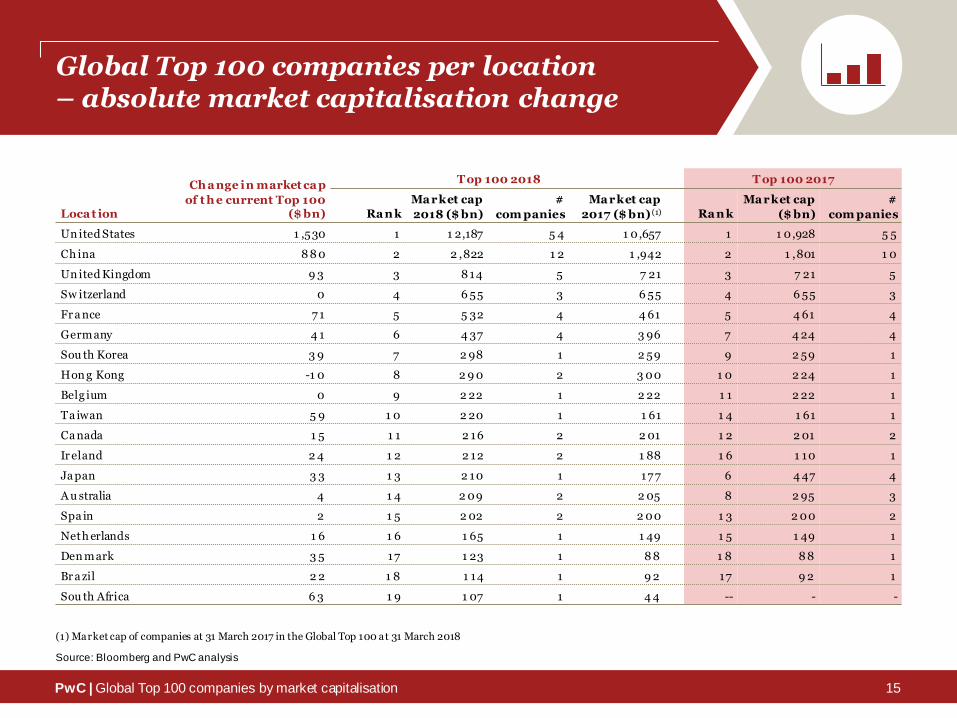
Global Top 100 companies per location – absolute market capitalisation change
Source: Bloomberg and PwC analysis
Loca t ion
Ch a nge in market ca p
of t h e current Top 100 ($ bn)
T op 100 2018 T op 100 2017
Ra n k
Ma rket cap
2018 ($ bn)
#
com panies
Ma rket cap
2017 ($ bn) (1) Ra n k
Ma rket cap
($ bn)
#
com panies
Un ited States 1 ,530 1 1 2,187 5 4 1 0,657 1 1 0,928 5 5
Ch ina 8 8 0 2 2 ,822 1 2 1 ,942 2 1 ,801 1 0
Un ited Kingdom 9 3 3 8 14 5 7 21 3 7 21 5
Sw itzerland 0 4 6 55 3 6 55 4 6 55 3
Fr a nce 7 1 5 5 32 4 4 61 5 4 61 4
Germany 4 1 6 4 37 4 3 96 7 4 24 4
Sou th Korea 3 9 7 2 98 1 2 59 9 2 59 1
Hon g Kong -1 0 8 2 9 0 2 3 00 1 0 2 24 1
Belg ium 0 9 2 22 1 2 22 1 1 2 22 1
Ta iwan 5 9 1 0 2 20 1 1 61 1 4 1 61 1
Ca nada 1 5 1 1 2 16 2 2 01 1 2 2 01 2
Ir eland 2 4 1 2 2 12 2 1 88 1 6 1 10 1
Ja pan 3 3 1 3 2 10 1 17 7 6 4 47 4
A u stralia 4 1 4 2 09 2 2 05 8 2 95 3
Spa in 2 1 5 2 02 2 2 00 1 3 2 00 2
Neth erlands 1 6 1 6 1 65 1 1 49 1 5 1 49 1
Den mark 3 5 17 1 23 1 8 8 1 8 8 8 1
Br a zil 2 2 1 8 1 14 1 9 2 17 9 2 1
Sou th Africa 6 3 1 9 1 07 1 4 4 -- - -
(1) Market cap of companies at 31 March 2017 in the Global Top 100 at 31 March 2018
15

PwC | Global Top 100 companies by market capitalisation
Global Top 100 companies per location– relative market capitalisation change
Source: Bloomberg and PwC analysis
Loca t ion
% m a rket cap change
2017-2018
% in dex change
2017-2018*
T op 100 v s. National
index performance
2018 2017
Ma rket cap of current
T op 100 ($ bn)
Ma rket cap of current
T op 100 ($ bn)
Un ited States 514% 512% 5Ou tperformed 1 2,187 1 0,657
Ch ina 54 5% 513% 5Ou tperformed 2 ,822 1 ,942
Un ited Kingdom 513% 6-4 % 5Ou tperformed 8 14 7 21
Sw itzerland } 0% 51 % 6Un derperformed 6 55 6 55
Fr a nce 515% 51 % 5Ou tperformed 5 32 4 61
Germany 51 0% 6-2 % 5Ou tperformed 4 37 3 96
Sou th Korea 515% 513% 5Ou tperformed 2 98 2 59
Hon g Kong 6-3 % 525% 6Un derperformed 2 9 0 3 00
Belg ium } 0% 51 % 6Un derperformed 2 22 2 22
Ta iwan 537 % 511% 5Ou tperformed 2 20 1 61
Ca nada 57 % 6-1 % 5Ou tperformed 2 16 2 01
Ir eland 513% 6-1 % 5Ou tperformed 2 12 1 88
Ja pan 519% 513% 5Ou tperformed 2 10 17 7
A u stralia 52 % 6-2 % 5Ou tperformed 2 09 2 05
Spa in 51 % 6-8 % 5Ou tperformed 2 02 2 00
Neth erlands 511% 53 % 5Ou tperformed 1 65 1 49
Den mark 54 0% 52 2% 5Ou tperformed 1 23 8 8
Br a zil 52 4% 531% 6Un derperformed 1 14 9 2
Sou th Africa 5143% 58 % 5Ou tperformed 1 07 4 4
* Price change of the local main index per location
16
PwC | Global Top 100 companies by market capitalisation
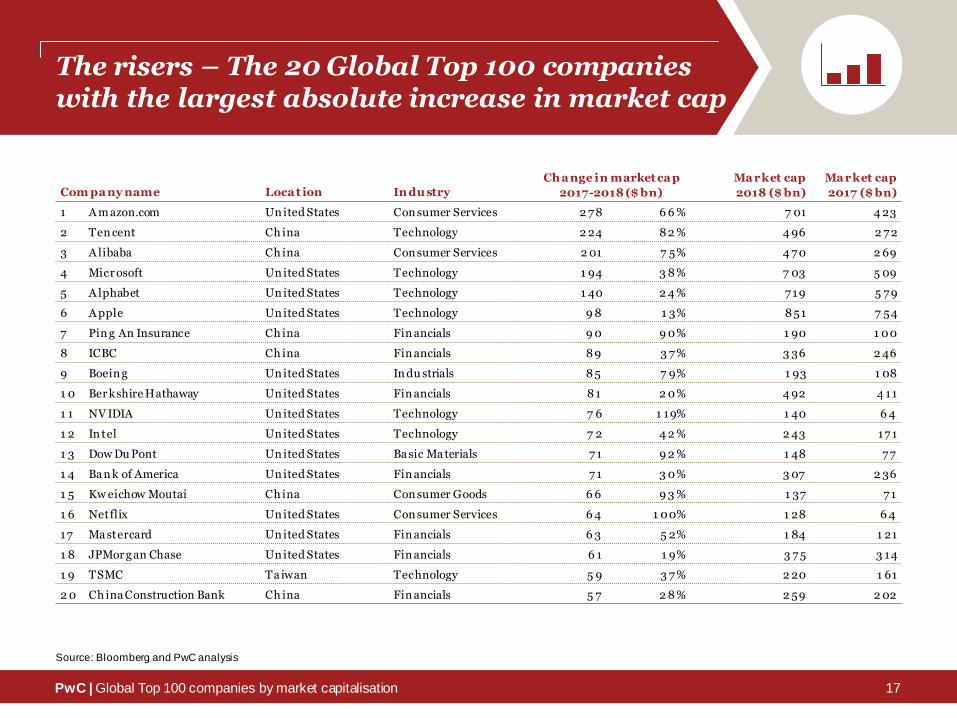
The risers – The 20 Global Top 100 companieswith the largest absolute increase in market cap
Source: Bloomberg and PwC analysis
Com pa ny name Loca t ion Indu stry
Ch a nge in market ca p
2017-2018 ($ bn)
Ma rket cap
2018 ($ bn)
Ma rket cap
2017 ($ bn)
1 A m azon.com Un ited States Con sumer Services 2 7 8 6 6 % 7 01 4 23
2 Ten cent Ch ina Technology 2 24 8 2 % 4 96 2 7 2
3 A libaba Ch ina Con sumer Services 2 01 7 5% 4 7 0 2 69
4 Micr osoft Un ited States Technology 1 94 3 8 % 7 03 5 09
5 A lphabet Un ited States Technology 1 40 2 4 % 7 19 5 7 9
6 A pple Un ited States Technology 9 8 1 3% 8 51 7 54
7 Pin g An Insurance Ch ina Fin ancials 9 0 9 0% 1 90 1 00
8 ICBC Ch ina Fin ancials 8 9 3 7 % 3 36 2 46
9 Boein g Un ited States In du strials 8 5 7 9% 1 93 1 08
1 0 Ber kshire Hathaway Un ited States Fin ancials 8 1 2 0% 4 92 4 11
1 1 NV IDIA Un ited States Technology 7 6 1 19% 1 40 6 4
1 2 In tel Un ited States Technology 7 2 4 2 % 2 43 17 1
1 3 Dow Du Pont Un ited States Ba sic Ma terials 7 1 9 2 % 1 48 7 7
1 4 Ba n k of America Un ited States Fin ancials 7 1 3 0% 3 07 2 36
1 5 Kw eichow Moutai Ch ina Con sumer Goods 6 6 9 3 % 1 37 7 1
1 6 Netflix Un ited States Con sumer Services 6 4 1 00% 1 28 6 4
17 Ma stercard Un ited States Fin ancials 6 3 5 2% 1 84 1 21
1 8 JPMor g an Chase Un ited States Fin ancials 6 1 1 9% 3 7 5 3 14
1 9 TSMC Ta iwan Technology 5 9 3 7 % 2 20 1 61
2 0 Ch ina Construction Bank Ch ina Fin ancials 5 7 2 8 % 2 59 2 02
17
PwC | Global Top 100 companies by market capitalisation
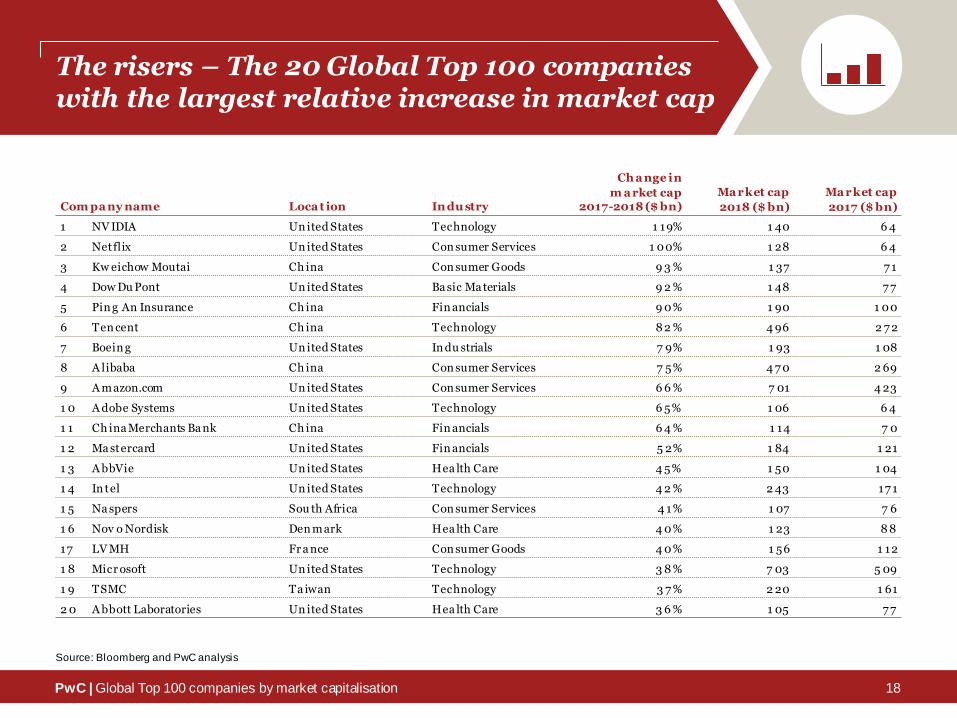
The risers – The 20 Global Top 100 companieswith the largest relative increase in market cap
Source: Bloomberg and PwC analysis
Com pa ny name Loca t ion Indu stry
Ch a nge in
m a rket cap 2017-2018 ($ bn)
Ma rket cap
2018 ($ bn)
Ma rket cap
2017 ($ bn)
1 NV IDIA Un ited States Technology 1 19% 1 40 6 4
2 Netflix Un ited States Con sumer Services 1 00% 1 28 6 4
3 Kw eichow Moutai Ch ina Con sumer Goods 9 3 % 1 37 7 1
4 Dow Du Pont Un ited States Ba sic Ma terials 9 2 % 1 48 7 7
5 Pin g An Insurance Ch ina Fin ancials 9 0% 1 90 1 00
6 Ten cent Ch ina Technology 8 2 % 4 96 2 7 2
7 Boein g Un ited States In du strials 7 9% 1 93 1 08
8 A libaba Ch ina Con sumer Services 7 5% 4 7 0 2 69
9 A m azon.com Un ited States Con sumer Services 6 6 % 7 01 4 23
1 0 A dobe Systems Un ited States Technology 6 5% 1 06 6 4
1 1 Ch ina Merchants Ba nk Ch ina Fin ancials 6 4 % 1 14 7 0
1 2 Ma stercard Un ited States Fin ancials 5 2% 1 84 1 21
1 3 A bbVie Un ited States Hea lth Care 4 5% 1 50 1 04
1 4 In tel Un ited States Technology 4 2 % 2 43 17 1
1 5 Na spers Sou th Africa Con sumer Services 4 1% 1 07 7 6
1 6 Nov o Nordisk Den mark Hea lth Care 4 0% 1 23 8 8
17 LV MH Fr a nce Con sumer Goods 4 0% 1 56 1 12
1 8 Micr osoft Un ited States Technology 3 8 % 7 03 5 09
1 9 TSMC Ta iwan Technology 3 7 % 2 20 1 61
2 0 A bbott Laboratories Un ited States Hea lth Care 3 6 % 1 05 7 7
18
PwC | Global Top 100 companies by market capitalisation
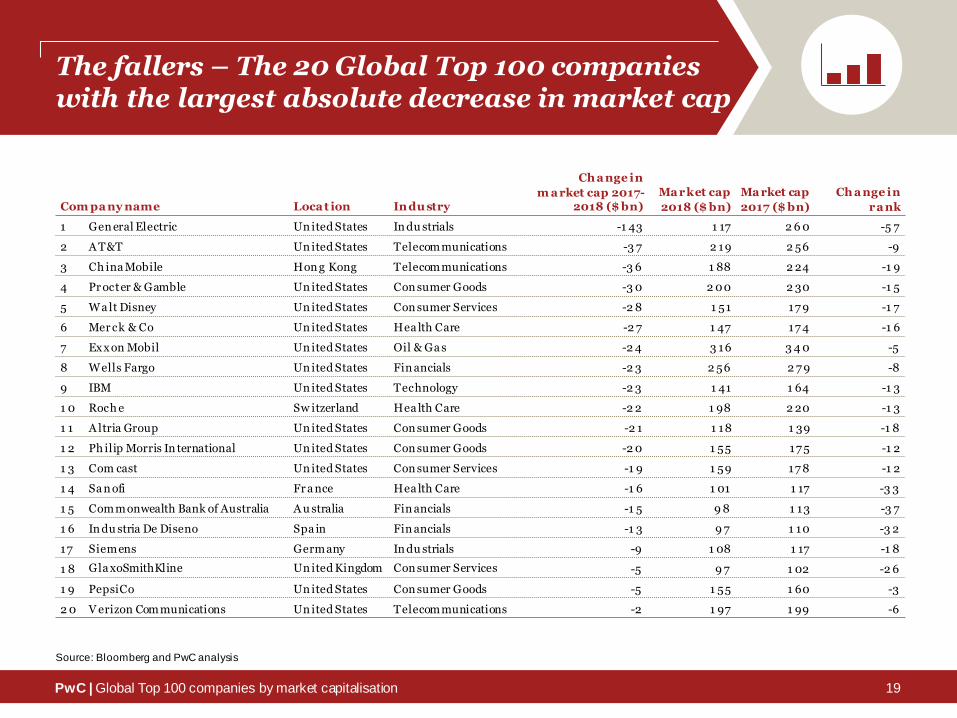
The fallers – The 20 Global Top 100 companieswith the largest absolute decrease in market cap
Com pa ny name Loca t ion Indu stry
Ch a nge in
m a rket cap 2017-2018 ($ bn)
Ma rket cap
2018 ($ bn)
Ma rket cap
2017 ($ bn)
Ch a nge in
ra nk
1 Gen eral Electric Un ited States In du strials -1 43 1 17 2 6 0 -5 7
2 A T&T Un ited States Telecommunications -3 7 2 19 2 56 -9
3 Ch ina Mobile Hon g Kong Telecommunications -3 6 1 88 2 24 -1 9
4 Pr octer & Gamble Un ited States Con sumer Goods -3 0 2 00 2 30 -1 5
5 Wa lt Disney Un ited States Con sumer Services -2 8 1 51 17 9 -1 7
6 Mer ck & Co Un ited States Hea lth Care -2 7 1 47 17 4 -1 6
7 Ex x on Mobil Un ited States Oil & Ga s -2 4 3 16 3 4 0 -5
8 Wells Fargo Un ited States Fin ancials -2 3 2 56 2 7 9 -8
9 IBM Un ited States Technology -2 3 1 41 1 64 -1 3
1 0 Roch e Sw itzerland Hea lth Care -2 2 1 98 2 20 -1 3
1 1 A ltria Group Un ited States Con sumer Goods -2 1 1 18 1 39 -1 8
1 2 Ph ilip Morris In ternational Un ited States Con sumer Goods -2 0 1 55 17 5 -1 2
1 3 Com cast Un ited States Con sumer Services -1 9 1 59 17 8 -1 2
1 4 Sa n ofi Fr a nce Hea lth Care -1 6 1 01 1 17 -3 3
1 5 Commonwealth Bank of Australia A u stralia Fin ancials -1 5 9 8 1 13 -3 7
1 6 In du stria De Diseno Spa in Fin ancials -1 3 9 7 1 10 -3 2
17 Siemens Germany In du strials -9 1 08 1 17 -1 8
1 8 Gla xoSmithKline Un ited Kingdom Con sumer Services -5 9 7 1 02 -2 6
1 9 PepsiCo Un ited States Con sumer Goods -5 1 55 1 60 -3
2 0 V erizon Communications Un ited States Telecommunications -2 1 97 1 99 -6
Source: Bloomberg and PwC analysis
19

PwC | Global Top 100 companies by market capitalisation
Industry comparison
Indu stry
Ma rket cap
2018 ($ bn)
Nu mber of
com panies 2018
Ch a nge in market ca p
of cu rrent T op 100 2017-2018
In du stry index
performance 2017-2018(1)
Index
ou t performance
1 Technology 4 ,806 1 5 2 7 % 2 8 % 6Un derperformed
2 Fin ancials 4 ,421 2 3 2 0% 1 4% 5Ou tperformed
3 Con sumer Goods 2 ,827 17 9 % 9 % A ligned
4 Con sumer Services 2 ,507 1 1 3 3% 1 9% 5Ou tperformed
5 Hea lth Care 2 ,230 1 4 7 % 8 % 6Un derperformed
6 Oil & Ga s 1 ,416 7 9 % 6 % 5Ou tperformed
7 In du strials 9 65 8 2 % 1 3% 6Un derperformed
8 Telecommunications 6 04 3 -1 1% -4 % 6Un derperformed
9 Ba sic Ma terials 2 59 2 5 3% 1 3% 5Ou tperformed
1 ) In dustry index performance is based on the MSCI In ternational ACWI In dustry Price In dex USD
Source: Bloomberg and PwC analysis
20
21
Agenda
PwC | Global Top 100 companies by market capitalisation 21
Highlights and trends
Year-on-year comparison:
2018 vs. 2017
Value distributed to shareholders in calendar
year 2017
Post-financial crisis comparison: 2018 vs. 2009
Completeranking
Value distributed to shareholders in calendar year 2017
PwC | Global Top 100 companies by market capitalisation
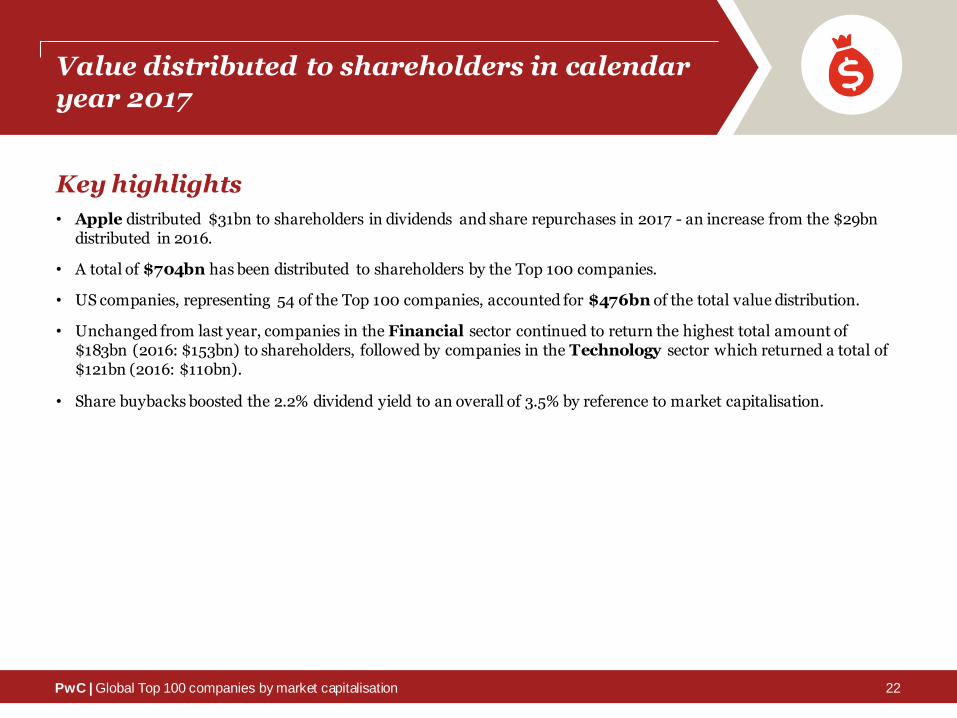
Value distributed to shareholders in calendar year 2017
Key highlights
• Apple distributed $31bn to shareholders in dividends and share repurchases in 2017 - an increase from the $29bn distributed in 2016.
• A total of $704bn has been distributed to shareholders by the Top 100 companies.
• US companies, representing 54 of the Top 100 companies, accounted for $476bn of the total value distribution.
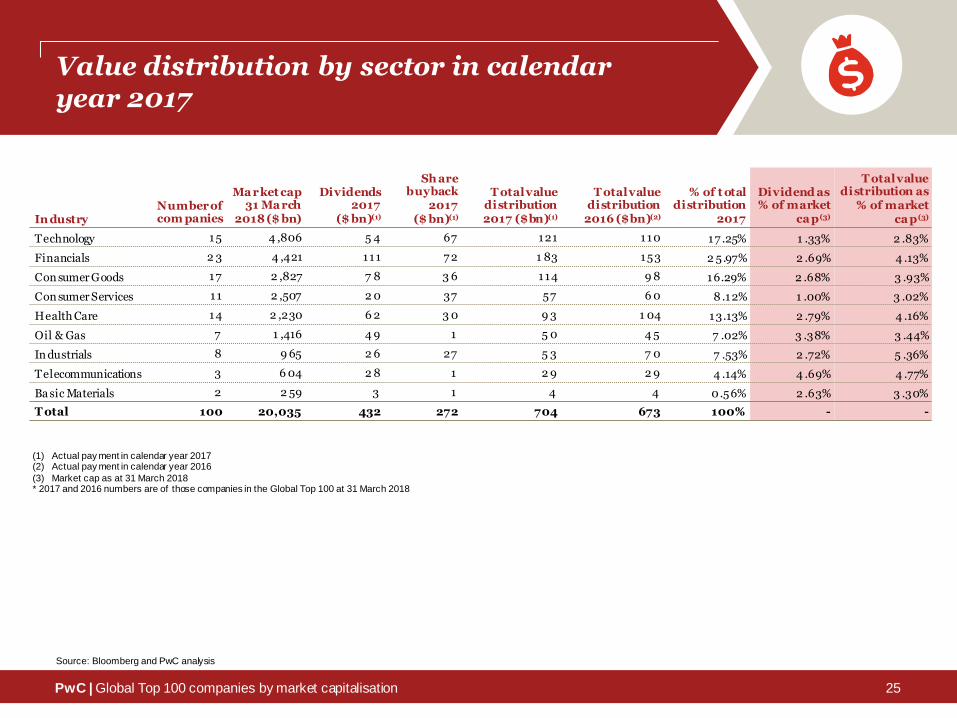
• Unchanged from last year, companies in the Financial sector continued to return the highest total amount of $183bn (2016: $153bn) to shareholders, followed by companies in the Technology sector which returned a total of $121bn (2016: $110bn).
• Share buybacks boosted the 2.2% dividend yield to an overall of 3.5% by reference to market capitalisation.
22
PwC | Global Top 100 companies by market capitalisation
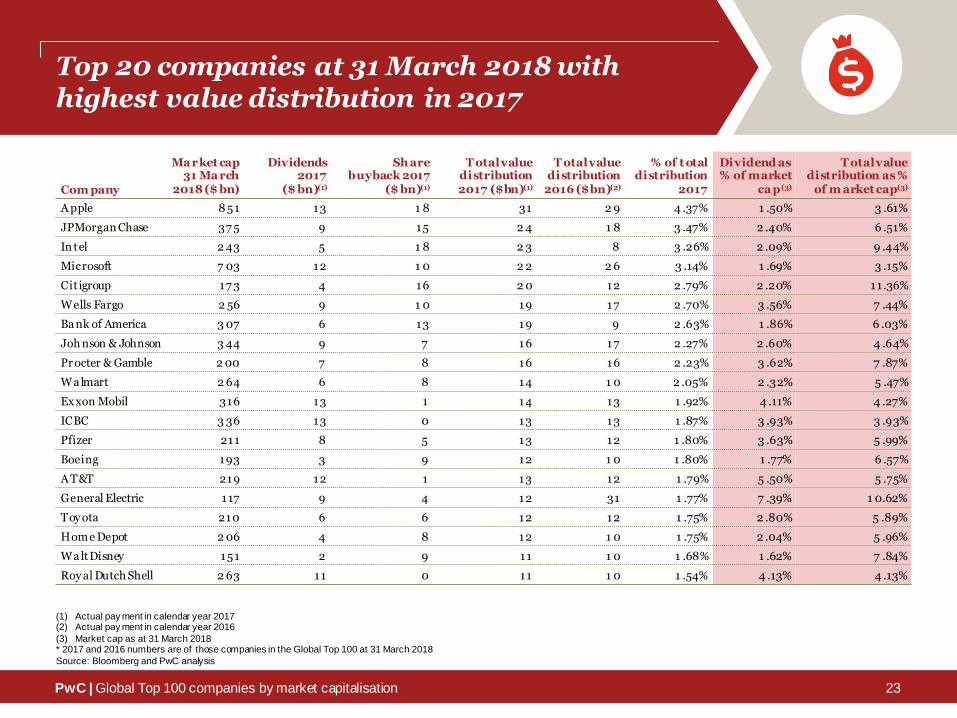
Top 20 companies at 31 March 2018 with highest value distribution in 2017
Com pany
Ma rket cap 31 Ma rch
2018 ($ bn)
Dividends 2017
($ bn)(1)
Sh are buyback 2017
($ bn)(1)
T otal value distribution 2017 ($bn)(1)
T otal value distribution
2016 ($bn)(2)
% of t otal distribution
2017
Dividend as % of market
ca p(3)
T otal value distribution as %
of m arket cap(3)
A pple 8 51 13 1 8 31 2 9 4 .37% 1 .50% 3 .61%
JPMorgan Chase 37 5 9 15 2 4 1 8 3 .47% 2 .40% 6 .51%
In tel 2 43 5 1 8 2 3 8 3 .26% 2 .09% 9 .44%
Microsoft 7 03 12 1 0 2 2 2 6 3 .14% 1 .69% 3 .15%
Cit igroup 17 3 4 16 2 0 12 2 .79% 2 .20% 11.36%
Wells Fargo 2 56 9 1 0 19 17 2 .70% 3 .56% 7 .44%
Ba nk of America 3 07 6 13 19 9 2 .63% 1 .86% 6 .03%
Joh nson & Johnson 3 44 9 7 16 17 2 .27% 2 .60% 4 .64%
Pr octer & Gamble 2 00 7 8 16 16 2 .23% 3 .62% 7 .87%
Wa lmart 2 64 6 8 14 1 0 2 .05% 2 .32% 5 .47%
Ex xon Mobil 316 13 1 14 13 1 .92% 4 .11% 4 .27%
ICBC 3 36 13 0 13 13 1 .87% 3 .93% 3 .93%
Pfizer 211 8 5 13 12 1 .80% 3 .63% 5 .99%
Boeing 193 3 9 12 1 0 1 .80% 1 .77% 6 .57%
A T&T 219 12 1 13 12 1 .79% 5 .50% 5 .75%
General Electric 117 9 4 12 31 1 .77% 7 .39% 1 0.62%
Toy ota 210 6 6 12 12 1 .75% 2 .80% 5 .89%
Home Depot 2 06 4 8 12 1 0 1 .75% 2 .04% 5 .96%
Wa lt Disney 151 2 9 11 1 0 1 .68% 1 .62% 7 .84%
Roy al Dutch Shell 2 63 11 0 11 1 0 1 .54% 4 .13% 4 .13%
(1) Actual pay ment in calendar year 2017(2) Actual pay ment in calendar year 2016
(3) Market cap as at 31 March 2018* 2017 and 2016 numbers are of those companies in the Global Top 100 at 31 March 2018
Source: Bloomberg and PwC analysis
23
PwC | Global Top 100 companies by market capitalisation
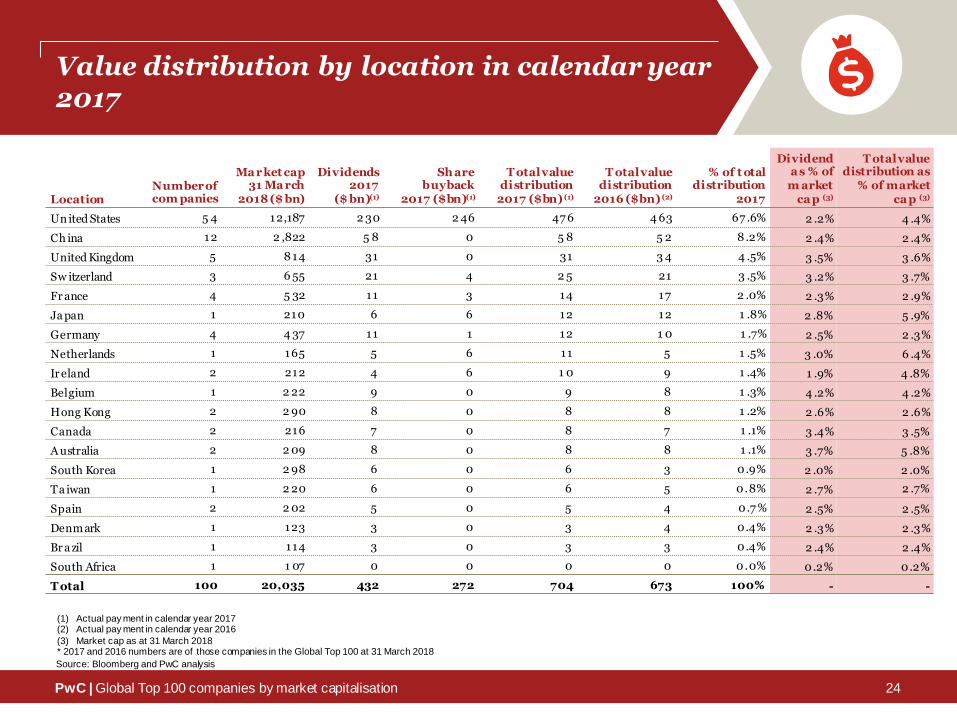
Value distribution by location in calendar year 2017
LocationNumber of com panies
Ma rket cap 31 Ma rch
2018 ($ bn)
Dividends 2017
($ bn)(1)
Sh are buyback
2017 ($bn)(1)
T otal value distribution
2017 ($bn) (1)
T otal value distribution
2016 ($bn) (2)
% of t otal distribution
2017
Dividend a s % of
m arket ca p (3)
T otal value distribution as
% of market ca p (3)
Un ited States 5 4 12,187 2 30 2 46 47 6 4 63 67 .6% 2 .2% 4 .4%
Ch ina 12 2 ,822 5 8 0 5 8 5 2 8 .2% 2 .4% 2 .4%
United Kingdom 5 8 14 31 0 31 3 4 4 .5% 3 .5% 3 .6%
Sw itzerland 3 6 55 21 4 2 5 21 3 .5% 3 .2% 3 .7%
Fr ance 4 5 32 11 3 14 17 2 .0% 2 .3% 2 .9%
Ja pan 1 210 6 6 12 12 1 .8% 2 .8% 5 .9%
Germany 4 4 37 11 1 12 1 0 1 .7% 2 .5% 2 .3%
Netherlands 1 165 5 6 11 5 1 .5% 3 .0% 6 .4%
Ir eland 2 212 4 6 1 0 9 1 .4% 1 .9% 4 .8%
Belgium 1 2 22 9 0 9 8 1 .3% 4 .2% 4 .2%
Hong Kong 2 2 90 8 0 8 8 1 .2% 2 .6% 2 .6%
Canada 2 216 7 0 8 7 1 .1% 3 .4% 3 .5%
A ustralia 2 2 09 8 0 8 8 1 .1% 3 .7% 5 .8%
South Korea 1 2 98 6 0 6 3 0.9% 2 .0% 2 .0%
Ta iwan 1 2 20 6 0 6 5 0.8% 2 .7% 2 .7%
Spain 2 2 02 5 0 5 4 0.7 % 2 .5% 2 .5%
Denm ark 1 123 3 0 3 4 0.4% 2 .3% 2 .3%
Br a zil 1 114 3 0 3 3 0.4% 2 .4% 2 .4%
South Africa 1 1 07 0 0 0 0 0.0% 0.2% 0.2%
T otal 100 20,035 432 272 704 673 100% - -
(1) Actual pay ment in calendar year 2017(2) Actual pay ment in calendar year 2016
(3) Market cap as at 31 March 2018* 2017 and 2016 numbers are of those companies in the Global Top 100 at 31 March 2018
Source: Bloomberg and PwC analysis
24
PwC | Global Top 100 companies by market capitalisation
Value distribution by sector in calendar year 2017
In dustryNumber of com panies
Ma rket cap 31 Ma rch
2018 ($ bn)
Dividends 2017
($ bn)(1)
Sh are buyback
2017 ($ bn)(1)
T otal value distribution 2017 ($bn)(1)
T otal value distribution
2016 ($bn)(2)
% of t otal distribution
2017
Dividend as % of market
ca p(3)
T otal value distribution as
% of market ca p(3)
Technology 15 4 ,806 5 4 67 121 110 17 .25% 1 .33% 2 .83%
Financials 2 3 4 ,421 111 7 2 1 83 153 2 5.97% 2 .69% 4 .13%
Con sumer Goods 17 2 ,827 7 8 3 6 114 9 8 16.29% 2 .68% 3 .93%
Con sumer Services 11 2 ,507 2 0 37 57 6 0 8 .12% 1 .00% 3 .02%
Health Care 14 2 ,230 6 2 3 0 9 3 1 04 13.13% 2 .79% 4 .16%
Oil & Gas 7 1 ,416 4 9 1 5 0 4 5 7 .02% 3 .38% 3 .44%
In dustrials 8 9 65 2 6 27 5 3 7 0 7 .53% 2 .72% 5 .36%
Telecommunications 3 6 04 2 8 1 2 9 2 9 4 .14% 4 .69% 4 .77%
Ba sic Materials 2 2 59 3 1 4 4 0.56% 2 .63% 3 .30%
T otal 100 20,035 432 272 704 673 100% - -
(1) Actual pay ment in calendar year 2017(2) Actual pay ment in calendar year 2016
(3) Market cap as at 31 March 2018* 2017 and 2016 numbers are of those companies in the Global Top 100 at 31 March 2018
Source: Bloomberg and PwC analysis
25
26
Agenda
PwC | Global Top 100 companies by market capitalisation 26
Highlights and trends
Year-on-year comparison:
2018 vs. 2017
Value distributed to shareholders in calendar
year 2017
Post-financial crisis comparison: 2018 vs. 2009
Completeranking
Post-financial crisis comparison2018 vs. 2009
PwC | Global Top 100 companies by market capitalisation
The movements
Key highlights
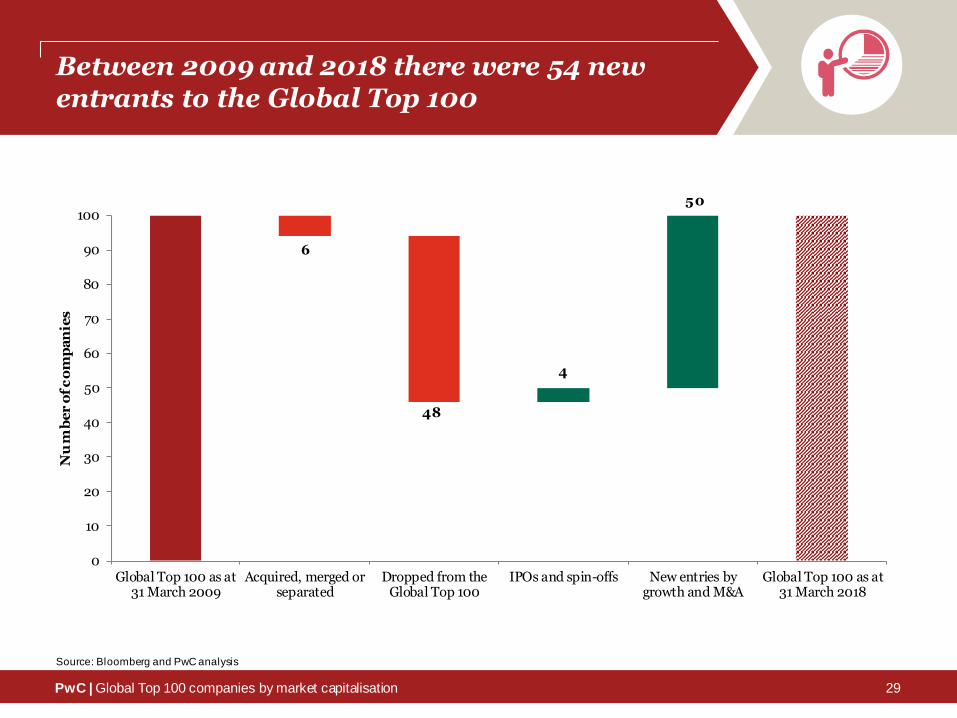
• 61 companies from the 2009 Top 100 survived to be in the list at 31 March 2018.
• Three companies entered the Global Top 100 by IPOs and one by spin-off. IPOs: Alibaba (2014), Facebook (2012) and Agricultural Bank of China (2011). Spin-off: AbbVie (2013).
• The two main risers since 2009 are Technology companies - Apple and Alphabet. Facebook (based on value increase since IPO) and Amazon.com come next, though the latter’s status as an e-retailer classifies it within Consumer Services. All are US companies.
• In fifth place is Tencent, the Chinese technology company. Tencent’s market cap has increased by $483bn (2161%), from $13bn at 31 March 2009 to $496bn at 31 March 2018.
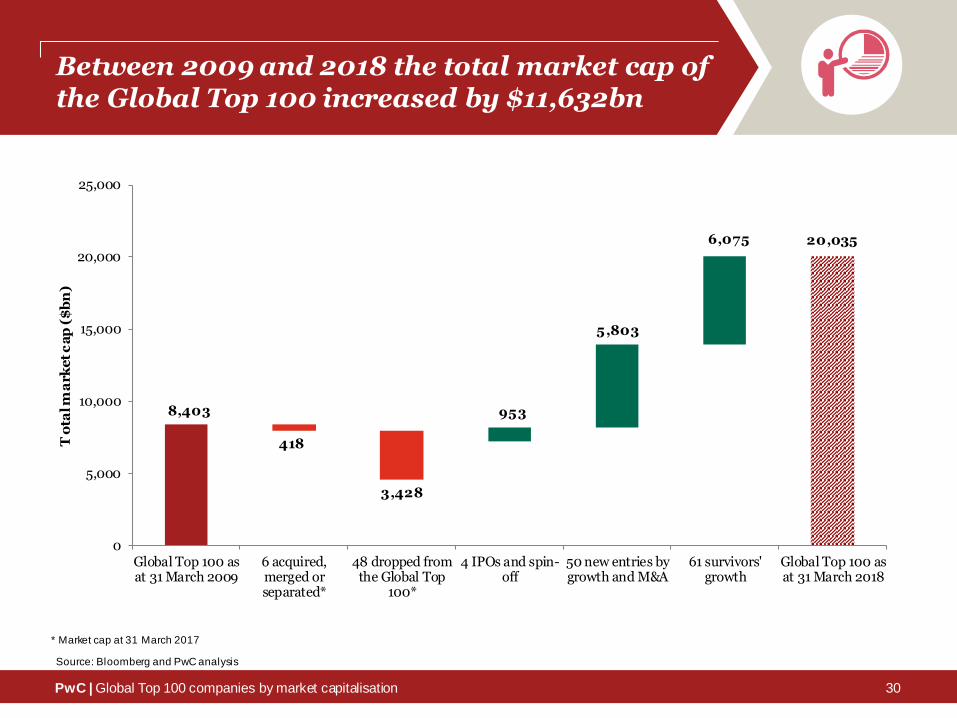
• The threshold to enter the Global Top 100 in 2018 was $97bn market cap. In 2009, $40bn was sufficient.
27
PwC | Global Top 100 companies by market capitalisation
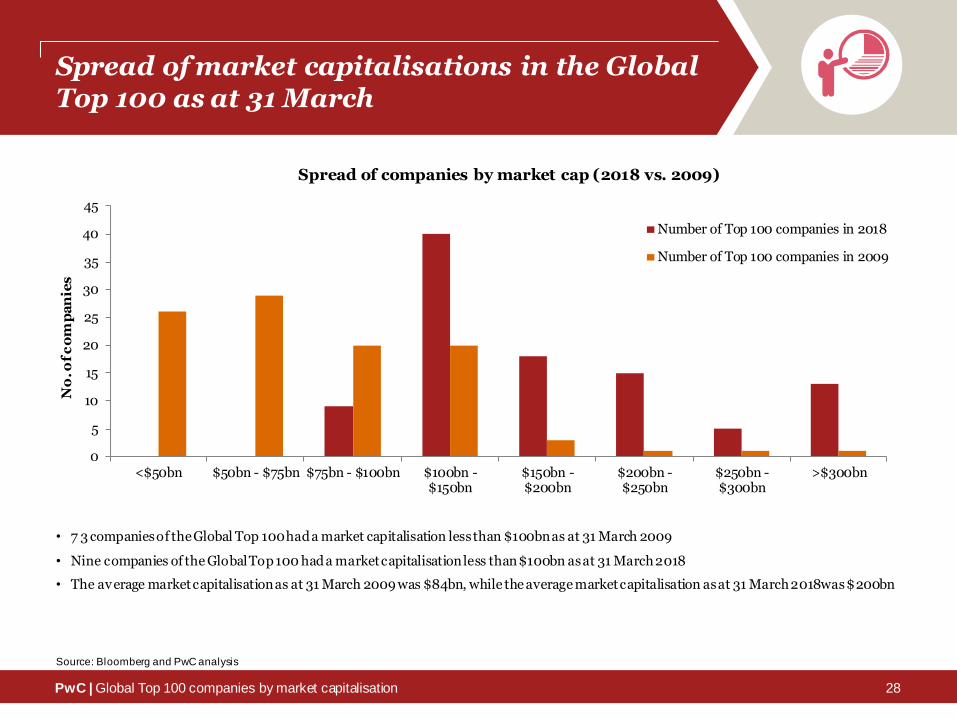
Spread of market capitalisations in the Global Top 100 as at 31 March
• 7 3 companies of the Global Top 100 had a market capitalisation less than $100bn as at 31 March 2009
• Nine companies of the Global Top 100 had a market capitalisation less than $100bn as at 31 March 2018
• The average market capitalisation as at 31 March 2009 was $84bn, while the average market capitalisation as at 31 March 2018 was$200bn
Source: Bloomberg and PwC analysis
0
5
10
15
20
25
30
35
40
45
<$50bn $50bn - $75bn $75bn - $100bn $100bn -$150bn
$150bn -$200bn
$200bn -$250bn
$250bn -$300bn
>$300bn
No
. of
co
mp
an
ies
Spread of companies by market cap (2018 vs. 2009)
Number of Top 100 companies in 2018
Number of Top 100 companies in 2009
28
PwC | Global Top 100 companies by market capitalisation
Between 2009 and 2018 there were 54 new entrants to the Global Top 100
6
48
4
50
0
10
20
30
40
50
60
70
80
90
100
Global Top 100 as at31 March 2009
Acquired, merged orseparated
Dropped from theGlobal Top 100
IPOs and spin-offs New entries bygrowth and M&A
Global Top 100 as at31 March 2018
Nu
mb
er
of
co
mp
an
ies
Source: Bloomberg and PwC analysis
29
PwC | Global Top 100 companies by market capitalisation
Between 2009 and 2018 the total market cap of the Global Top 100 increased by $11,632bn
8,403
418
3,428
953
5,803
6,075 20,035
0
5,000
10,000
15,000
20,000
25,000
Global Top 100 asat 31 March 2009
6 acquired,merged orseparated*
48 dropped fromthe Global Top
100*
4 IPOs and spin-off
50 new entries bygrowth and M&A
61 survivors'growth
Global Top 100 asat 31 March 2018
To
tal m
ark
et
ca
p (
$b
n)
* Market cap at 31 March 2017
Source: Bloomberg and PwC analysis
30
PwC | Global Top 100 companies by market capitalisation
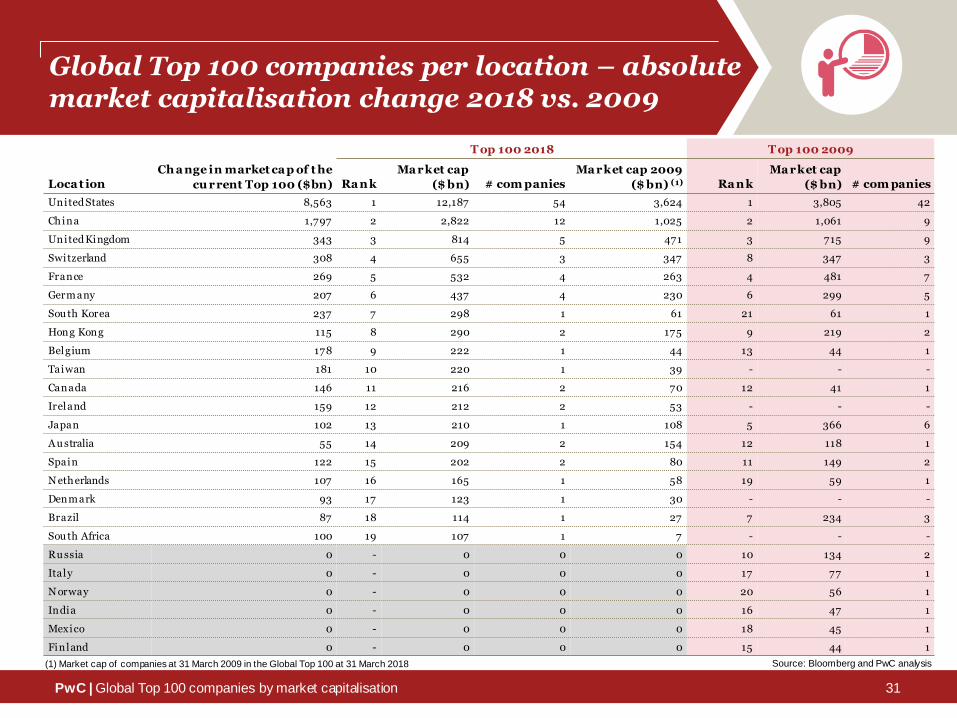
Global Top 100 companies per location – absolute market capitalisation change 2018 vs. 2009
Loca t ion
Ch a nge in market ca p of t he
cu rrent Top 100 ($bn)
T op 100 2018 T op 100 2009
Ra nk
Ma rket cap
($ bn) # com panies
Ma rket cap 2009
($ bn) (1) Ra nk
Ma rket cap
($ bn) # com panies
United States 8,563 1 12,187 54 3,624 1 3,805 42
China 1,797 2 2,822 12 1,025 2 1,061 9
United Kingdom 343 3 814 5 471 3 715 9
Switzerland 308 4 655 3 347 8 347 3
France 269 5 532 4 263 4 481 7
Germany 207 6 437 4 230 6 299 5
Sou th Korea 237 7 298 1 61 21 61 1
Hong Kong 115 8 290 2 175 9 219 2
Belgium 178 9 222 1 44 13 44 1
Taiwan 181 10 220 1 39 - - -
Canada 146 11 216 2 70 12 41 1
Ireland 159 12 212 2 53 - - -
Japan 102 13 210 1 108 5 366 6
A u stralia 55 14 209 2 154 12 118 1
Spain 122 15 202 2 80 11 149 2
N etherlands 107 16 165 1 58 19 59 1
Denmark 93 17 123 1 30 - - -
Brazil 87 18 114 1 27 7 234 3
Sou th Africa 100 19 107 1 7 - - -
Ru ssia 0 - 0 0 0 10 134 2
Italy 0 - 0 0 0 17 77 1
N orway 0 - 0 0 0 20 56 1
India 0 - 0 0 0 16 47 1
Mexico 0 - 0 0 0 18 45 1
Finland 0 - 0 0 0 15 44 1
(1) Market cap of companies at 31 March 2009 in the Global Top 100 at 31 March 2018 Source: Bloomberg and PwC analysis
31
PwC | Global Top 100 companies by market capitalisation
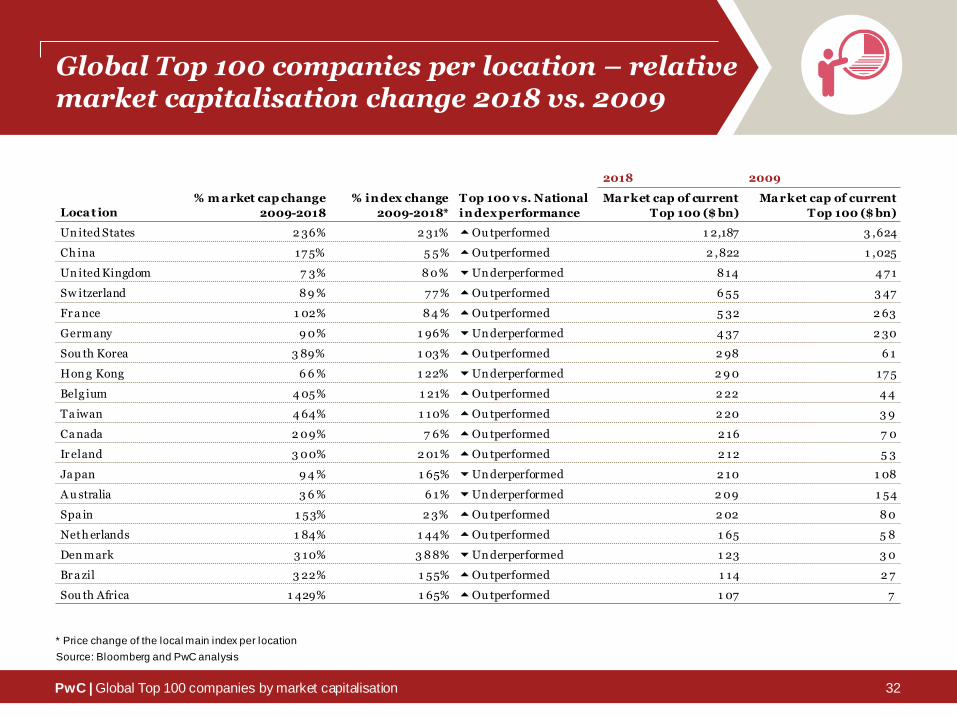
Global Top 100 companies per location – relative market capitalisation change 2018 vs. 2009
Loca t ion
% m a rket cap change
2009-2018
% index change
2009-2018*
T op 100 v s. National
in dex performance
2018 2009
Ma rket cap of current
T op 100 ($ bn)
Ma rket cap of current
T op 100 ($ bn)
Un ited States 2 36% 2 31% 5Ou tperformed 1 2,187 3 ,624
Ch ina 17 5% 5 5% 5Ou tperformed 2 ,822 1 ,025
Un ited Kingdom 7 3% 8 0% 6Un derperformed 8 14 4 7 1
Sw itzerland 8 9 % 7 7 % 5Ou tperformed 6 55 3 47
Fr a nce 1 02% 8 4 % 5Ou tperformed 5 32 2 63
Germany 9 0% 1 96% 6Un derperformed 4 37 2 30
Sou th Korea 3 89% 1 03% 5Ou tperformed 2 98 6 1
Hon g Kong 6 6 % 1 22% 6Un derperformed 2 9 0 17 5
Belg ium 4 05% 1 21% 5Ou tperformed 2 22 4 4
Ta iwan 4 64% 1 10% 5Ou tperformed 2 20 3 9
Ca nada 2 09% 7 6% 5Ou tperformed 2 16 7 0
Ir eland 3 00% 2 01% 5Ou tperformed 2 12 5 3
Ja pan 9 4 % 1 65% 6Un derperformed 2 10 1 08
A u stralia 3 6 % 6 1% 6Un derperformed 2 09 1 54
Spa in 1 53% 2 3% 5Ou tperformed 2 02 8 0
Neth erlands 1 84% 1 44% 5Ou tperformed 1 65 5 8
Den m ark 3 10% 3 8 8% 6Un derperformed 1 23 3 0
Br a zil 3 22% 1 55% 5Ou tperformed 1 14 2 7
Sou th Africa 1 429% 1 65% 5Ou tperformed 1 07 7
Source: Bloomberg and PwC analysis
* Price change of the local main index per location
32
PwC | Global Top 100 companies by market capitalisation
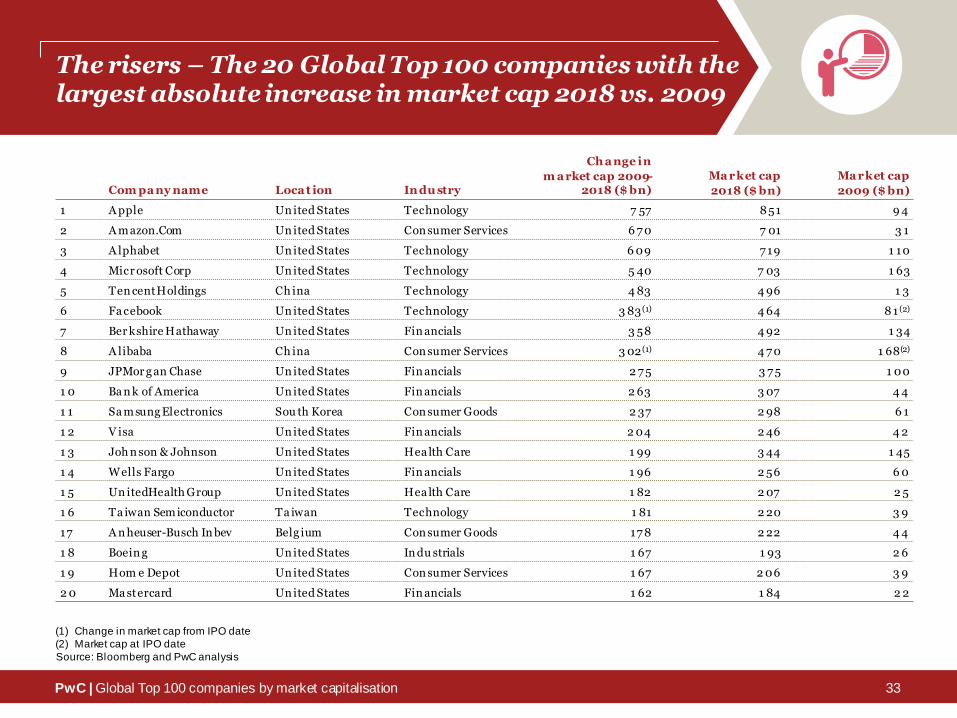
The risers – The 20 Global Top 100 companies with the largest absolute increase in market cap 2018 vs. 2009
Com pa ny name Loca t ion Indu stry
Ch a nge in
m a rket cap 2009-2018 ($ bn)
Ma rket cap
2018 ($ bn)
Ma rket cap
2009 ($ bn)
1 A pple Un ited States Technology 7 57 8 51 9 4
2 A mazon.Com Un ited States Con sumer Services 6 7 0 7 01 3 1
3 A lphabet Un ited States Technology 6 09 7 19 1 10
4 Micr osoft Corp Un ited States Technology 5 40 7 03 1 63
5 Ten cent Holdings Ch ina Technology 4 83 4 96 1 3
6 Fa cebook Un ited States Technology 3 83 (1) 4 64 8 1 (2)
7 Ber kshire Hathaway Un ited States Fin ancials 3 58 4 92 1 34
8 A libaba Ch ina Con sumer Services 3 02(1) 4 7 0 1 68(2)
9 JPMor g an Chase Un ited States Fin ancials 2 7 5 3 7 5 1 00
1 0 Ba n k of America Un ited States Fin ancials 2 63 3 07 4 4
1 1 Sa m sung Electronics Sou th Korea Con sumer Goods 2 37 2 98 6 1
1 2 V isa Un ited States Fin ancials 2 04 2 46 4 2
1 3 Joh n son & Johnson Un ited States Hea lth Care 1 99 3 44 1 45
1 4 Wells Fargo Un ited States Fin ancials 1 96 2 56 6 0
1 5 Un itedHealth Group Un ited States Hea lth Care 1 82 2 07 2 5
1 6 Ta iwan Semiconductor Ta iwan Technology 1 81 2 20 3 9
17 A n heuser-Busch In bev Belg ium Con sumer Goods 17 8 2 22 4 4
1 8 Boein g Un ited States In du strials 1 67 1 93 2 6
1 9 Hom e Depot Un ited States Con sumer Services 1 67 2 06 3 9
2 0 Ma stercard Un ited States Fin ancials 1 62 1 84 2 2
Source: Bloomberg and PwC analysis
(1) Change in market cap from IPO date
(2) Market cap at IPO date
33
PwC | Global Top 100 companies by market capitalisation
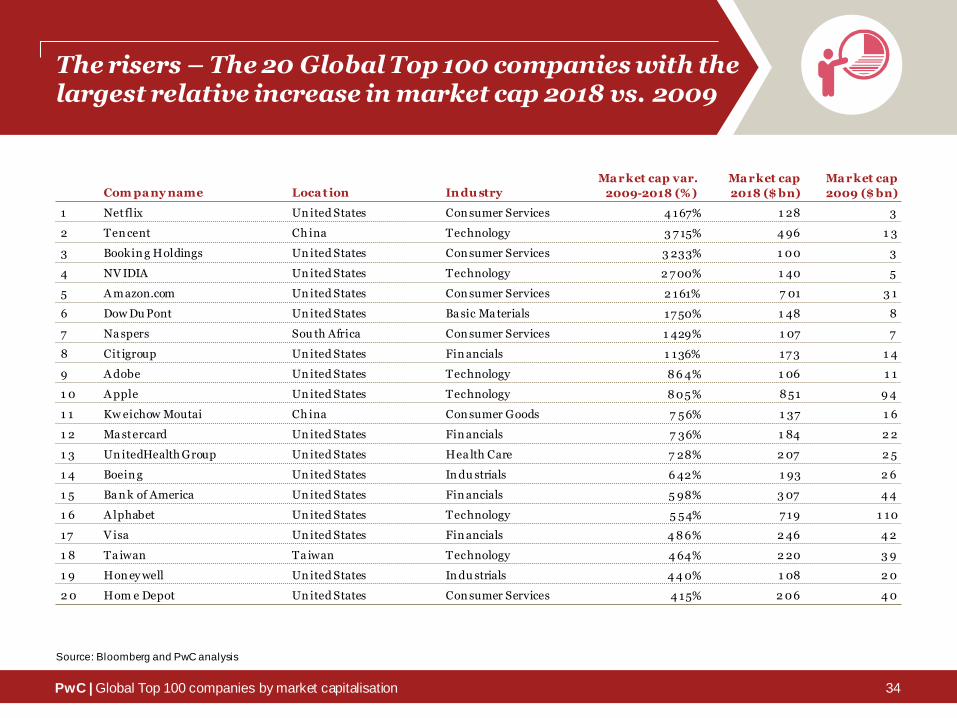
The risers – The 20 Global Top 100 companies with the largest relative increase in market cap 2018 vs. 2009
Com pa ny name Loca t ion In du stry
Ma rket cap var.
2009-2018 (%)
Ma rket cap
2018 ($ bn)
Ma rket cap
2009 ($ bn)
1 Netflix Un ited States Con sumer Services 4 167% 1 28 3
2 Ten cent Ch ina Technology 3 7 15% 4 96 1 3
3 Bookin g Holdings Un ited States Con sumer Services 3 233% 1 00 3
4 NV IDIA Un ited States Technology 2 7 00% 1 40 5
5 A m azon.com Un ited States Con sumer Services 2 161% 7 01 3 1
6 Dow Du Pont Un ited States Ba sic Ma terials 17 50% 1 48 8
7 Na spers Sou th Africa Con sumer Services 1 429% 1 07 7
8 Cit igroup Un ited States Fin ancials 1 136% 17 3 1 4
9 A dobe Un ited States Technology 8 6 4% 1 06 1 1
1 0 A pple Un ited States Technology 8 05% 8 51 9 4
1 1 Kw eichow Moutai Ch ina Con sumer Goods 7 56% 1 37 1 6
1 2 Ma stercard Un ited States Fin ancials 7 36% 1 84 2 2
1 3 Un itedHealth Group Un ited States Hea lth Care 7 28% 2 07 2 5
1 4 Boein g Un ited States In du strials 6 42% 1 93 2 6
1 5 Ba n k of America Un ited States Fin ancials 5 98% 3 07 4 4
1 6 A lphabet Un ited States Technology 5 54% 7 19 1 10
17 V isa Un ited States Fin ancials 4 8 6% 2 46 4 2
1 8 Ta iwan Ta iwan Technology 4 64% 2 20 3 9
1 9 Hon ey well Un ited States In du strials 4 4 0% 1 08 2 0
2 0 Hom e Depot Un ited States Con sumer Services 4 15% 2 06 4 0
Source: Bloomberg and PwC analysis
34
PwC | Global Top 100 companies by market capitalisation
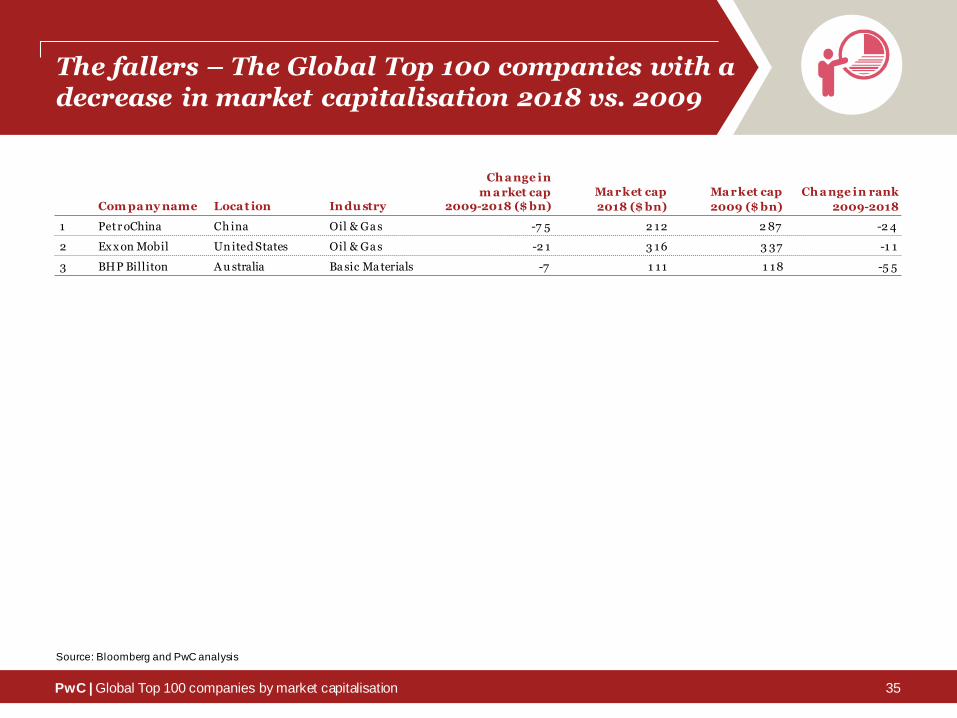
The fallers – The Global Top 100 companies with a decrease in market capitalisation 2018 vs. 2009
Com pa ny name Loca t ion In du stry
Ch a nge in
m a rket cap2009-2018 ($ bn)
Ma rket cap
2018 ($ bn)
Ma rket cap
2009 ($ bn)
Ch a nge in rank
2009-2018
1 Petr oChina Ch ina Oil & Ga s -7 5 2 12 2 87 -2 4
2 Ex x on Mobil Un ited States Oil & Ga s -2 1 3 16 3 37 -1 1
3 BHP Billiton A u stralia Ba sic Ma terials -7 1 11 1 18 -5 5
Source: Bloomberg and PwC analysis
35
PwC | Global Top 100 companies by market capitalisation
The industries
Key highlights
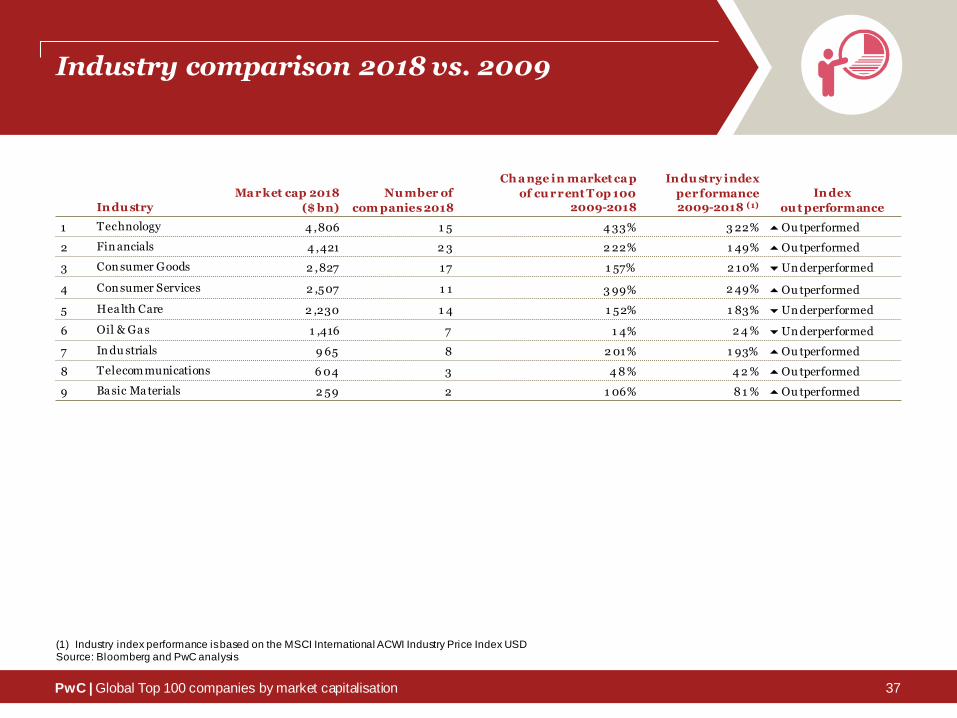
• Three industries show significant upward trends in their market cap: Technology (+433%), Consumer Services (+399%), and Financials (+222%) are the leading sectors to have grown their market cap in the Top 100 since 2009, driven by innovation and recovery from the financial crisis.
• Utilities industry (four companies in 2009) has been absent from the Top 100 for six years.
36
PwC | Global Top 100 companies by market capitalisation
Industry comparison 2018 vs. 2009
In du stry
Ma rket cap 2018
($ bn)
Nu mber of
com panies 2018
Ch a nge in market ca p
of cu rrent T op 100 2009-2018
Indu stry index
performance 2009-2018 (1)
In dex
ou t performance
1 Technology 4 ,806 1 5 4 33% 3 22% 5Ou tperformed
2 Fin ancials 4 ,421 2 3 2 22% 1 49% 5Ou tperformed
3 Con sumer Goods 2 ,827 17 1 57% 2 10% 6Un derperformed
4 Con sumer Services 2 ,507 1 1 3 99% 2 49% 5Ou tperformed
5 Hea lth Care 2 ,230 1 4 1 52% 1 83% 6Un derperformed
6 Oil & Ga s 1 ,416 7 1 4% 2 4 % 6Un derperformed
7 In du strials 9 65 8 2 01% 1 93% 5Ou tperformed
8 Telecommunications 6 04 3 4 8 % 4 2 % 5Ou tperformed
9 Ba sic Ma terials 2 59 2 1 06% 8 1 % 5Ou tperformed
Source: Bloomberg and PwC analysis(1) Industry index performance is based on the MSCI International ACWI Industry Price Index USD
37
38
Agenda
PwC | Global Top 100 companies by market capitalisation 38
Highlights and trends
Year-on-year comparison:
2018 vs. 2017
Value distributed to shareholders in calendar
year 2017
Post-financial crisis comparison: 2018 vs. 2009
Completeranking
Complete ranking

PwC | Global Top 100 companies by market capitalisation
Top 100 global companies 1-20
Com pa ny name Loca t ion Indu stry Ra nk +/- 31 Ma rch 2018 31 Ma rch 2009
Ra n k Ma rket Ca p ($bn) Ra n k Ma rket Ca p ($bn)
A pple Un ited States Technology 3 2 1 8 51 3 3 9 4
A lphabet Un ited States Technology 2 0 2 7 19 2 2 1 10
Micr osoft Un ited States Technology 3 3 7 03 6 1 63
A mazon.com Un ited States Con sumer Services - 4 7 01 N/A 3 1
Ten cent Ch ina Technology 7 5 4 96 N/A 1 3
Ber kshire Hathaway Un ited States Fin ancials 6 6 4 92 1 2 1 34
A libaba Ch ina Con sumer Services - 7 4 7 0 N/A -
Fa cebook Un ited States Technology - 8 4 64 N/A -
JPMor g an Chase Un ited States Fin ancials 1 9 9 3 7 5 2 8 1 00
Joh n son & Johnson Un ited States Hea lth Care -2 1 0 3 44 8 1 45
ICBC Ch ina Fin ancials -7 1 1 3 36 4 1 88
Ex x on Mobil Un ited States Oil & Ga s -1 1 1 2 3 16 1 3 37
Ba n k of America Un ited States Fin ancials 7 4 1 3 3 07 8 7 4 4
Sa m sung Electronics Sou th Korea Con sumer Goods 3 9 1 4 2 98 5 3 6 1
Roy al Du tch Shell Un ited Kingdom Oil & Ga s -6 1 5 2 63 9 1 39
Wa lm art Un ited States Con sumer Services -1 3 1 6 2 64 3 2 04
Ch ina Construction Bank Ch ina Fin ancials -4 17 2 59 1 3 1 33
Wells Fargo Un ited States Fin ancials 3 7 1 8 2 56 5 5 6 0
Nest le Sw itzerland Con sumer Goods -4 1 9 2 46 1 5 1 29
V isa Un ited States Fin ancials 5 8 2 0 2 46 7 8 4 2
Source: Bloomberg and PwC analysis
39
PwC | Global Top 100 companies by market capitalisation
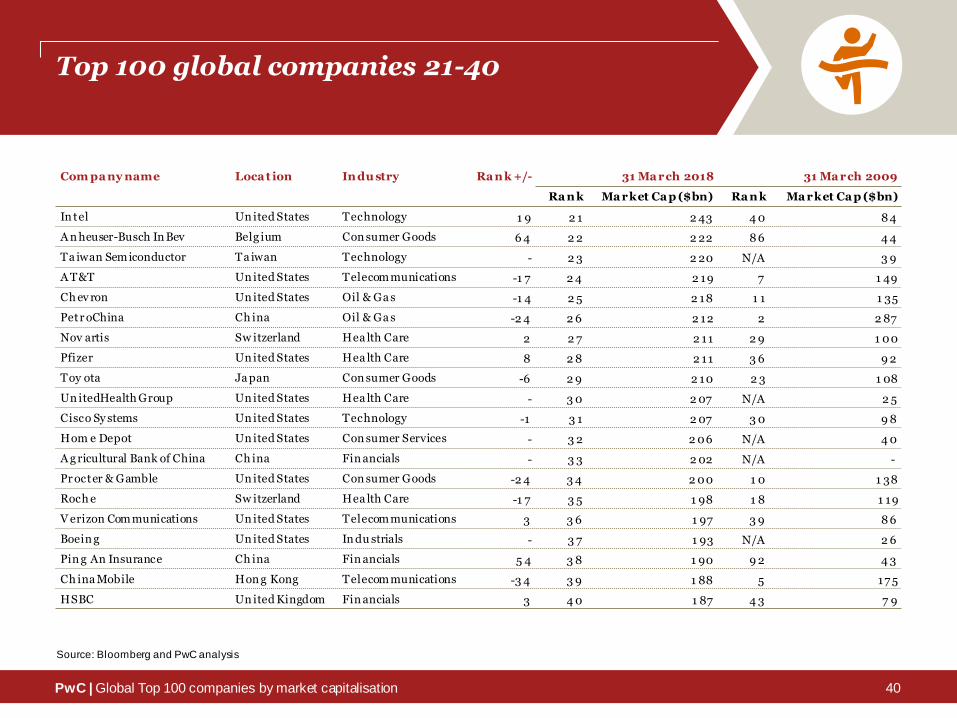
Top 100 global companies 21-40
Com pa ny name Loca t ion In du stry Ra nk +/- 31 Ma rch 2018 31 Ma rch 2009
Ra n k Ma rket Ca p ($bn) Ra n k Ma rket Ca p ($bn)
In tel Un ited States Technology 1 9 2 1 2 43 4 0 8 4
A n heuser-Busch In Bev Belg ium Con sumer Goods 6 4 2 2 2 22 8 6 4 4
Ta iwan Sem iconductor Ta iwan Technology - 2 3 2 20 N/A 3 9
A T&T Un ited States Telecommunications -1 7 2 4 2 19 7 1 49
Ch ev ron Un ited States Oil & Ga s -1 4 2 5 2 18 1 1 1 35
Petr oChina Ch ina Oil & Ga s -2 4 2 6 2 12 2 2 87
Nov artis Sw itzerland Hea lth Care 2 2 7 2 11 2 9 1 00
Pfizer Un ited States Hea lth Care 8 2 8 2 11 3 6 9 2
Toy ota Ja pan Con sumer Goods -6 2 9 2 10 2 3 1 08
Un itedHealth Group Un ited States Hea lth Care - 3 0 2 07 N/A 2 5
Cisco Sy stems Un ited States Technology -1 3 1 2 07 3 0 9 8
Hom e Depot Un ited States Con sumer Services - 3 2 2 06 N/A 4 0
A g ricultural Bank of China Ch ina Fin ancials - 3 3 2 02 N/A -
Pr octer & Gamble Un ited States Con sumer Goods -2 4 3 4 2 00 1 0 1 38
Roch e Sw itzerland Hea lth Care -1 7 3 5 1 98 1 8 1 19
V erizon Com munications Un ited States Telecom munications 3 3 6 1 97 3 9 8 6
Boein g Un ited States In du strials - 3 7 1 93 N/A 2 6
Pin g An Insurance Ch ina Fin ancials 5 4 3 8 1 90 9 2 4 3
Ch ina Mobile Hon g Kong Telecommunications -3 4 3 9 1 88 5 17 5
HSBC Un ited Kingdom Fin ancials 3 4 0 1 87 4 3 7 9
Source: Bloomberg and PwC analysis
40

PwC | Global Top 100 companies by market capitalisation
Top 100 global companies 41-60
Com pa ny name Loca t ion In du stry Ra nk +/- 31 Ma rch 2018 31 Ma rch 2009
Rank Ma rket Ca p ($bn) Ra n k Ma rket Ca p ($bn)
Or a cle Un ited States Technology -4 4 1 1 87 3 7 9 0
Coca Cola Un ited States Con sumer Goods -1 6 4 2 1 85 2 6 1 02
Ma stercard Un ited States Fin ancials - 4 3 1 84 N/A 2 2
Ba n k of China Ch ina Fin ancials -2 3 4 4 17 8 2 1 1 15
Cit igroup Un ited States Fin ancials - 4 5 17 3 N/A 1 4
Un ilever Neth erlands Con sumer Goods 1 4 4 6 1 65 6 0 5 8
Com cast Un ited States Con sumer Services - 4 7 1 59 N/A 3 9
LV MH Fr a nce Con sumer Goods - 4 8 1 56 N/A 3 1
PepsiCo Un ited States Con sumer Goods -7 4 9 1 55 4 2 8 0
Ph ilip Morris In ternational Un ited States Con sumer Goods - 5 0 1 55 5 0 7 1
Wa lt Disney Un ited States Con sumer Services - 5 1 1 51 N/A 3 4
A bbVie Un ited States Hea lth Care - 5 2 1 50 N/A -
Tota l Fr a nce Oil & Ga s -3 3 5 3 1 49 2 0 1 17
Dow Du Pont Un ited States Ba sic Ma terials - 5 4 1 48 N/A 8
Mer ck & Co Un ited States Hea lth Care 8 5 5 1 47 6 3 5 6
IBM Un ited States Technology -4 2 5 6 1 41 1 4 1 30
NV IDIA Un ited States Technology - 5 7 1 40 N/A 5
Kw eichow Moutai Ch ina Con sumer Goods - 5 8 1 37 N/A 1 6
BP Un ited Kingdom Oil & Ga s -4 3 5 9 1 34 1 6 1 26
Br it ish American Tobacco Un ited Kingdom Con sumer Goods 1 9 6 0 1 33 7 9 4 6
Source: Bloomberg and PwC analysis
41
PwC | Global Top 100 companies by market capitalisation
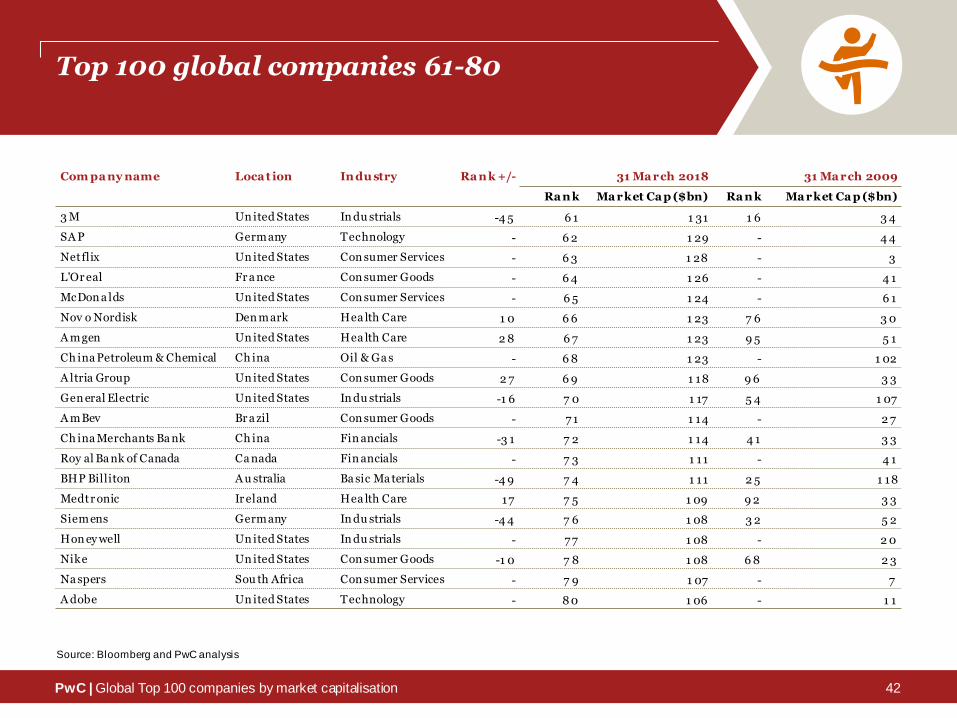
Top 100 global companies 61-80
Com pa ny name Loca t ion In du stry Ra n k +/- 31 Ma rch 2018 31 Ma rch 2009
Ra n k Ma rket Ca p ($bn) Ra n k Ma rket Ca p ($bn)
3 M Un ited States In du strials -4 5 6 1 1 31 1 6 3 4
SA P Germany Technology - 6 2 1 29 - 4 4
Netflix Un ited States Con sumer Services - 6 3 1 28 - 3
L'Or eal Fr a nce Con sumer Goods - 6 4 1 26 - 4 1
McDon a lds Un ited States Con sumer Services - 6 5 1 24 - 6 1
Nov o Nordisk Den mark Hea lth Care 1 0 6 6 1 23 7 6 3 0
A m gen Un ited States Hea lth Care 2 8 6 7 1 23 9 5 5 1
Ch ina Petroleum & Chemical Ch ina Oil & Ga s - 6 8 1 23 - 1 02
A ltria Group Un ited States Con sumer Goods 2 7 6 9 1 18 9 6 3 3
Gen eral Electric Un ited States In du strials -1 6 7 0 1 17 5 4 1 07
A mBev Br a zil Con sumer Goods - 7 1 1 14 - 2 7
Ch ina Merchants Ba nk Ch ina Fin ancials -3 1 7 2 1 14 4 1 3 3
Roy al Ba nk of Canada Ca nada Fin ancials - 7 3 1 11 - 4 1
BHP Billiton A u stralia Ba sic Ma terials -4 9 7 4 1 11 2 5 1 18
Medtr onic Ir eland Hea lth Care 17 7 5 1 09 9 2 3 3
Siem ens Germany In du strials -4 4 7 6 1 08 3 2 5 2
Hon ey well Un ited States In du strials - 7 7 1 08 - 2 0
Nike Un ited States Con sumer Goods -1 0 7 8 1 08 6 8 2 3
Na spers Sou th Africa Con sumer Services - 7 9 1 07 - 7
A dobe Un ited States Technology - 8 0 1 06 - 1 1
Source: Bloomberg and PwC analysis
42
PwC | Global Top 100 companies by market capitalisation
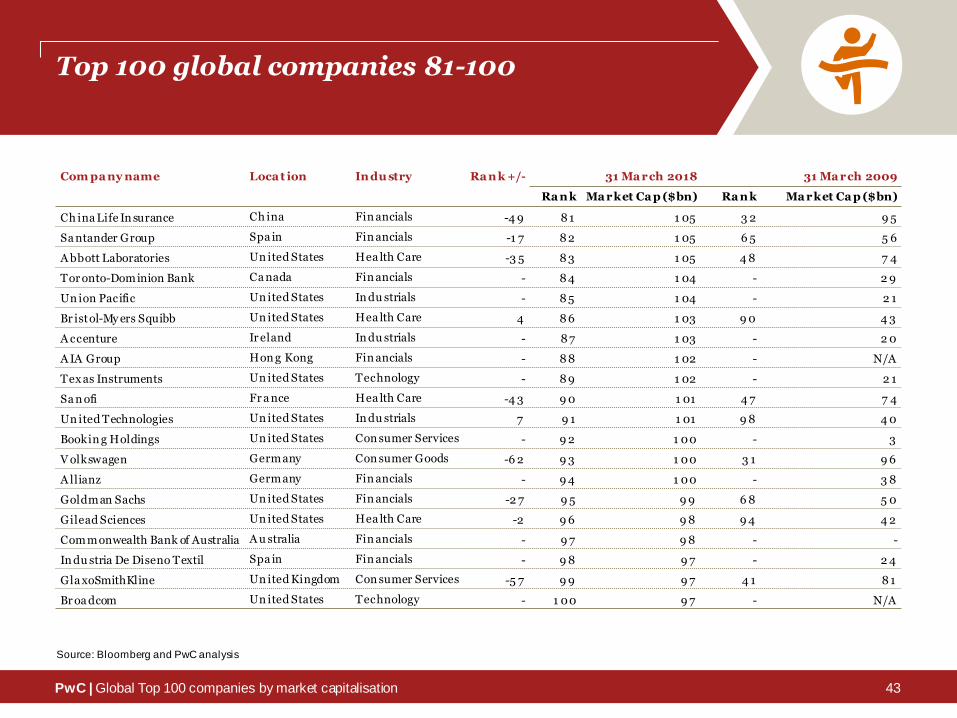
Top 100 global companies 81-100
Com pa ny name Loca t ion Indu stry Ra nk +/- 31 Ma rch 2018 31 Ma rch 2009
Ra nk Ma rket Ca p ($bn) Ra nk Ma rket Ca p ($bn)
Ch ina Life In surance Ch ina Fin ancials -4 9 8 1 1 05 3 2 9 5
Sa ntander Group Spa in Fin ancials -1 7 8 2 1 05 6 5 5 6
A bbott Laboratories Un ited States Hea lth Care -3 5 8 3 1 05 4 8 7 4
Tor onto-Dominion Bank Ca nada Fin ancials - 8 4 1 04 - 2 9
Un ion Pacific Un ited States In du strials - 8 5 1 04 - 2 1
Br istol-My ers Squibb Un ited States Hea lth Care 4 8 6 1 03 9 0 4 3
A ccenture Ir eland In du strials - 8 7 1 03 - 2 0
A IA Group Hon g Kong Fin ancials - 8 8 1 02 - N/A
Tex as Instruments Un ited States Technology - 8 9 1 02 - 2 1
Sa n ofi Fr a nce Hea lth Care -4 3 9 0 1 01 4 7 7 4
Un ited Technologies Un ited States In du strials 7 9 1 1 01 9 8 4 0
Bookin g Holdings Un ited States Con sumer Services - 9 2 1 00 - 3
V olkswagen Germ any Con sumer Goods -6 2 9 3 1 00 3 1 9 6
A llianz Germ any Fin ancials - 9 4 1 00 - 3 8
Goldman Sachs Un ited States Fin ancials -2 7 9 5 9 9 6 8 5 0
Gilead Sciences Un ited States Hea lth Care -2 9 6 9 8 9 4 4 2
Com m onwealth Bank of Australia A u stralia Fin ancials - 9 7 9 8 - -
In du stria De Diseno Textil Spa in Fin ancials - 9 8 9 7 - 2 4
Gla xoSmithKline Un ited Kingdom Con sumer Services -5 7 9 9 9 7 4 1 8 1
Br oa dcom Un ited States Technology - 1 00 9 7 - N/A
Source: Bloomberg and PwC analysis
43
PwC | Global Top 100 companies by market capitalisation
The ranking methodology
Methodology
• The Global Top 100 list ranks the largest public companies by their market capitalisation in US$ as at 31 March 2018 and compares this with the Top 100 list as at 31 March 2017 and 2009
• Data source is Bloomberg, with PwC analysis
• Industry classification is based on Industry Classification Benchmark (ICB)
• Exchange Traded Funds (ETFs) and closed end funds are excluded from the analysis
• We allocated dual-listed companies as follows: BHP Billiton (AUS), Royal Dutch Shell (UK) and Unilever (NL)
• The ranking does not compensate for changes in currency exchange rates
• The distribution of value is based on dividend payments and share repurchases in the calendar year 2017
44
AgendaContact
Mark Hughes
UK Capital Markets Leader
+44 773 659 9759
Kennedy Liu
China/Hong Kong Capital Markets Leader
Tel: +852 2289 1881
Ross Hunter
IPO Centre Leader
Tel: +44 780 291 8885
Nadja Picard
PwC Europe Capital Markets Leader
Tel: +49 211 981 2978
David Ethridge
US IPO Services Leader
Tel: +1 212 845 0739
This publication has been prepared for general guidance on matters of interest only, and does not constitute professional adv ice. You should not act upon the
information contained in this publication w ithout obtaining specif ic professional advice. No representation or w arranty (expr ess or implied) is given as to the
accuracy or completeness of the information contained in this publication, and, to the extent permitted by law , Pricew aterhouseCoopers LLP, its members,
employees and agents do not accept or assume any liability, responsibility or duty of care for any consequences of you or any one else acting, or refraining to
act, in reliance on the information contained in this publication or for any decision based on it.
© 2018 Pw C. All rights reserved. Pw C refers to the US member f irm or one of its subsidiaries or aff iliates, and may sometimes r efer to the Pw C netw ork. Each
member f irm is a separate legal entity. Please see w ww.pwc.com/structure for further details.45