Embed Size (px)
Citation preview
Global Tobacco Market: Analysis By Product (Cigarettes,
Smoking Tobacco, Cigar, Smokeless Tobacco, E-Cigarettes),
By Sub Product Type, By Region, By Country: Opportunities
and Forecast (2013-2023)
• By Sub Type– Machine Made Cigarettes, Roll Your Own
Cigarettes, Machine Made Cigars, Handmade Cigars,
Chewing Tobacco and Snuff
• By Region - North America, Europe, Asia Pacific, and Rest of the
World
• By Country – U.S, Canada, Mexico, Brazil, U.K., Germany,
France, China, India, Japan, Indonesia.
March 2019
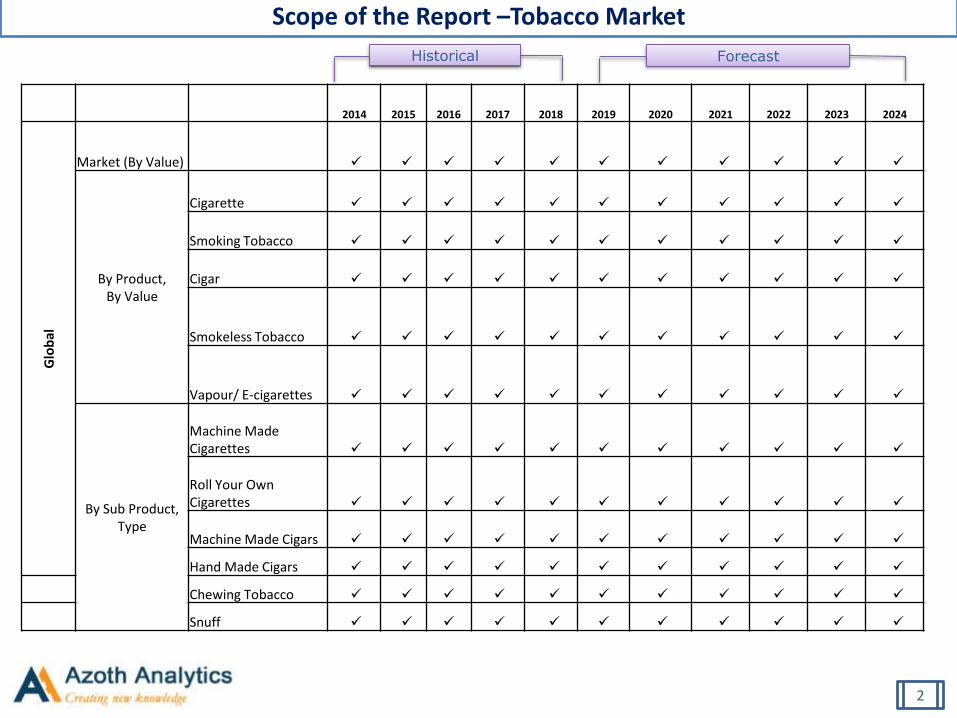
2014 2015 2016 2017 2018 2019 2020 2021 2022 2023 2024
Glo
bal
Market (By Value)
By Product, By Value
Cigarette
Smoking Tobacco
Cigar
Smokeless Tobacco
Vapour/ E-cigarettes
By Sub Product, Type
Machine Made Cigarettes
Roll Your Own Cigarettes
Machine Made Cigars
Hand Made Cigars
Chewing Tobacco
Snuff
Scope of the Report –Tobacco Market
Historical Forecast
2

2014 2015 2016 2017 2018 2019 2020 2021 2022 2023 2024
Re
gio
nal
Market (By Value)
By Product, By Value
Cigarette
Smoking Tobacco
Cigar
Smokeless Tobacco
Vapour/ E-cigarettes
By Sub Product, Type
Machine Made Cigarettes
Roll Your Own Cigarettes
Machine Made Cigars
Hand Made Cigars
Chewing Tobacco
Snuff
Scope of the Report –Tobacco Market
Historical Forecast
3
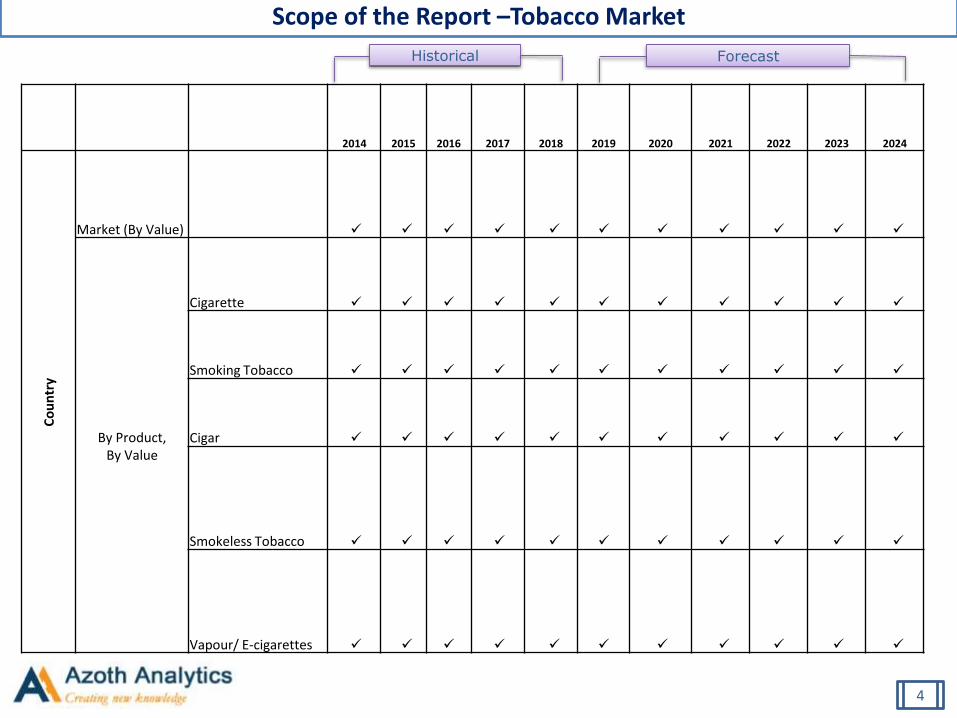
2014 2015 2016 2017 2018 2019 2020 2021 2022 2023 2024
Co
un
try
Market (By Value)
By Product, By Value
Cigarette
Smoking Tobacco
Cigar
Smokeless Tobacco
Vapour/ E-cigarettes
Scope of the Report –Tobacco Market
Historical Forecast
4
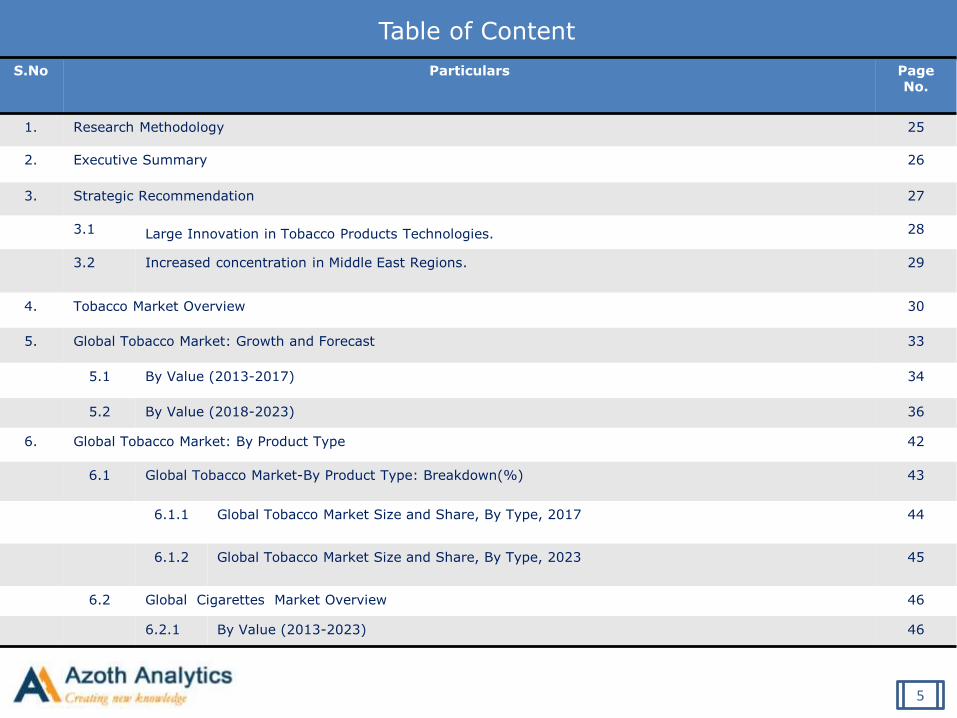
Table of Content
S.No Particulars Page No.
1. Research Methodology 25
2. Executive Summary 26
3. Strategic Recommendation 27
3.1 Large Innovation in Tobacco Products Technologies. 28
3.2 Increased concentration in Middle East Regions. 29
4. Tobacco Market Overview 30
5. Global Tobacco Market: Growth and Forecast 33
5.1 By Value (2013-2017) 34
5.2 By Value (2018-2023) 36
6. Global Tobacco Market: By Product Type 42
6.1 Global Tobacco Market-By Product Type: Breakdown(%) 43
6.1.1 Global Tobacco Market Size and Share, By Type, 2017 44
6.1.2 Global Tobacco Market Size and Share, By Type, 2023 45
6.2 Global Cigarettes Market Overview 46
6.2.1 By Value (2013-2023) 46
5
Table of Content
S. No Particulars Page No.
6.3 Global Machine Made Cigarettes Market Overview 47
6.3.1 By Value (2013-2023) 47
6.4 Global Roll Your Own Cigarettes Market Overview 47
6.4.1 By Value (2013-2023) 47
6.5 Global Cigars Market Overview 48
6.5.1 By Value (2013-2023) 49
6.6 Global Machine Made Cigar Market Overview 49
6.6.1 By Value (2013-2023) 49
6.7 Global Hand Made Cigars Market Overview 49
6.7.1 By Value (2013-2023) 50
6.8 Global Smokeless Tobacco Market Overview 50
6.8.1 By Value (2013-2023) 51
6.9 Global Chewing Tobacco Market Overview 51
6.9.1 By Value (2013-2023) 51
6.10 Global Snuff Tobacco Market Overview 51
6.10.1 By Value (2013-2023) 51
6.11 Global Vapour Tobacco Market Overview 52
6.11.1 By Value (2013-2023) 52
6
Table of Content
S. No Particulars Page No.
7.1 Americas Tobacco Market: An Analysis 54
7.1.1 By Value (2013-2017) 55
7.1.2 By Value (2018-2023 56
7.2 Americas Tobacco Market: Segment Analysis 58
7.2.1 Americas Tobacco Market: By Type, By Value(2013-2023) 59
7.2.2 Americas Tobacco Market: By Sub Type, By value (2013-2023) 60
7.3 Americas Respiratory Care Devices Market: Country Analysis (U.S., Canada, Mexico and Brazil) 68
7.3.1 U.S. Tobacco Market, By Value (2013-2023) 69
7.3.1 U.S. Tobacco Market, By Type, By Value (2013-2023) 70
7.3.2 Canada Tobacco Market, By Value (2013-2023) 76
7.3.2 Canada Tobacco Market, By Type, By Value (2013-2023) 77
7.3.3 Mexico Tobacco Market, By Value (2013-2023) 83
7.3.3 Mexico Tobacco Market, By Type, By Value (2013-2023) 84
7.3.4 Brazil Tobacco Market, By Value (2013-2023) 90
7.3.2 Brazil Tobacco Market, By Type, By Value (2013-2023) 91
7
Table of Content
S. No Particulars Page No.
8.1 Europe Tobacco Market: An Analysis 97
8.1.1 By Value (2013-2017) 98
8.1.2 By Value (2018-2023) 99
8.2 Europe Tobacco Market: Segment Analysis 100
8.2.1 Europe Tobacco Market: By Type, By Value(2013-2023) 104
8.2.2 Europe Tobacco Market: By Sub Type, By value (2013-2023) 105
8.3 Europe Respiratory Care Devices Market: Country Analysis (U.S., Canada, Mexico and Brazil) 114
8.3.1 U.K. Tobacco Market, By Value (2013-2023) 115
8.3.1 U.K. Tobacco Market, By Type, By Value (2013-2023) 116
8.3.2 Germany Tobacco Market, By Value (2013-2023) 122
8.3.2 Germany Tobacco Market, By Type, By Value (2013-2023) 123
8.3.3 France Tobacco Market, By Value (2013-2023) 129
8.3.3 France Tobacco Market, By Type, By Value (2013-2023) 130
8

Table of Content
S. No Particulars Page No.
9.1 APAC Tobacco Market: An Analysis 138
9.1.1 By Value (2013-2017) 139
9.1.2 By Value (2018-2023 139
9.2 APAC Tobacco Market: Segment Analysis 140
9.2.1 APAC Tobacco Market: By Type, By Value(2013-2023) 144
9.2.2 APAC Tobacco Market: By Sub Type, By value (2013-2023) 144
9.3 APAC Respiratory Care Devices Market: Country Analysis (U.S., Canada, Mexico and Brazil) 151
9.3.1 China Tobacco Market, By Value (2013-2023) 153
9.3.1 China Tobacco Market, By Type, By Value (2013-2023) 155
9.3.2 India Tobacco Market, By Value (2013-2023) 162
9.3.2 India Tobacco Market, By Type, By Value (2013-2023) 163
9.3.3 Japan Tobacco Market, By Value (2013-2023) 169
9.3.3 Japan Tobacco Market, By Type, By Value (2013-2023) 170
9.3.4 Indonesia Tobacco Market, By Value (2013-2023) 176
9.3.4 Indonesia Tobacco Market, By Type, By Value (2013-2023) 177
9
Table of Content
S. No
Particulars Page No.
10.1 Rest of APAC Tobacco Market: An Analysis 182
9.1.1 By Value (2013-2017) 183
9.1.2 By Value (2018-2023) 183
10.2 ROW Tobacco Market: Segment Analysis 184
10.2.1 ROW Tobacco Market: By Type, By Value(2013-2023) 185
10.2.2 ROW Tobacco Market: By Sub Type, By value (2013-2023) 186
14. Market Dynamics 187
11.1 Drivers 188
11.2 Challenges 195
15. Market Trends 200
16. SWOT Analysis – Respiratory Care Devices Market 202
17. Competitive Landscape 206
18. Company Profiling 208
18.1 ITC 209
18.2 Philip Morris International 212
18.3 Altria Group Inc 215
10
Table of Content
S. No Particulars Page No.
18.4 Korea Tobacco & Ginseng Corporation 218
18.5 British American Tobacco 222
18.6 Japan Tobacco International 225
18.7 China Tobacco Corporation 228
18.8 Gudang Garam Tbk 229
18.9 Imperial Brands 233
18.10 Scandinavian Tobacco Group 236
18.11 Turning Points Brands 239
19. About Us 242
11
List of Figures
Figure No. Figure Title Page No.
Figure 1: Tobacco Market Segmentation Flowchart 32
Figure 2: Global Tobacco Market Size, By Value, 2013-2017 (USD Billion) 34
Figure 3: Global Tobacco Market Size, By Value, 2018-2023 (USD Billion) 36
Figure 4: Tobacco Companies Worldwide, By Revenue, 2017 (USD Million) 38
Figure 5: Leading Brands in Global Tobacco market, By Brand 2017 (%) 39
Figure 6: GDP Per Capita PPP, By Select Countries, 2017 (USD) 40
Figure 7: GDP Per Capita PPP, By Select Countries, 2022F (USD) 40
Figure 8: Global Tobacco Market Size, By Segments, 2017(%) 44
Figure 9: Global Tobacco Market Size, By Segments, 2023 (%) 45
Figure 10: Global Cigarette Market, By Value, Historical 2013-2017 (USD Billion) 46
Figure 11: Global Cigarette Market, By Value, Forecast, 2018-2023 (USD Billion) 46
Figure 12: Global Cigarette Market, By Value, Historical 2013-2017 (USD Billion) 47
Figure 13: Global Cigarette Market, By Value, Forecast, 2018-2023(USD Billion) 47
Figure 14: Global Cigar Market, By Value, Historical 2013-2017 (USD Billion) 48
Figure 15: Global Cigar Market, By Value, Forecast, 2018-2023 (USD Billion) 48
Figure 16: Global Cigar Market, By Value, Historical 2013-2017 (USD Billion) 49
Figure 17: Global Cigar Market, By Value, Forecast, 2018-2023 (USD Billion) 49
Figure 18: Global Smokeless Tobacco Market, By Value, Historical 2013-2017 (USD Billion) 50
Figure 19: Global Smokeless Tobacco Market, By Value, Forecast, 2018-2023 (USD Billion) 50
Figure 20: Global Smokeless Tobacco Market, By Value, Historical 2013-2017 (USD Billion) 51
12
List of FiguresFigure No. Figure Title Page No.
Figure 21: Global Smokeless Tobacco Market, By Value, Forecast, 2018-2023 (USD Billion) 51
Figure 22: Global Vapor Market, By Value, Historical 2013-2017 (USD Billion) 52
Figure 23: Global Vapor Market, By Value, Forecast, 2018-2023 (USD Billion) 52
Figure 24: Americas Tobacco Market Size, By Value, 2013-2017 (USD Billion) 55
Figure 25: Americas Tobacco Market Size, By Value, Forecast, 2018-2023 (USD Billion) 56
Figure 26: Global Tobacco Market Share by Leading Brands 2017 (%) 57
Figure 27: Americas Cigarette Market, By Value, Historical 2013-2017 (USD Billion) 59
Figure 28: Americas Cigarette Market, By Value, Forecast, 2018-2023(USD Billion) 59
Figure 29: America’s Cigarette Market, By Value, Historical 2013-2017 (USD Billion) 60
Figure 30: America’s Cigarette Market, By Value, Forecast, 2018-2023(USD Billion) 60
Figure 31: America’s Smoking Tobacco Market, By Value, Historical 2013-2017 (USD Billion) 61
Figure 32: America’s Smoking Tobacco Market, By Value, Forecast, 2018-2023(USD Billion) 61
Figure 33: America’s Cigar Market, By Value, Historical 2013-2017 (USD Billion) 62
Figure 34: America’s Cigar Market, By Value, Forecast, 2018-2023(USD Billion) 62
Figure 35: America’s Cigar Market, By Value, Historical 2013-2017 (USD Billion) 63
Figure 36: America’s Cigars Market, By Value, Forecast, 2018-2023(USD Billion) 63
Figure 37: America’s Smokeless Tobacco Market, By Value, Historical 2013-2017 (USD Billion) 64
Figure 38: America’s Smokeless Tobacco Market, By Value, Forecast, 2018-2023(USD Billion) 64
Figure 39: America’s Smokeless tobacco Market, By Value, Historical 2013-2017 (USD Billion) 65
Figure 40: America’s Smokeless Tobacco Market, By Value, Forecast, 2018-2023(USD Billion) 65
13
List of Figures
Figure No. Figure Title Page No.
Figure 41: America’s Vapor Market, By Value, Historical 2013-2017 (USD Billion) 66
Figure 42: America’s Vapor Market, By Value, Forecast, 2018-2023(USD Billion) 66
Figure 43: U.S. Tobacco Market Size, By Value, 2013-2023 (USD Billion) 69
Figure 44: U.S. Cigarette Market, By Value, Historical, 2013-2017 (USD Billion) 70
Figure 45: U.S. Cigarette Market, By Value, Forecast, 2018-2023 (USD Billion) 70
Figure 46: US Smoking Tobacco Market, By Value, Historical 2013-2017 (USD Billion) 71
Figure 47: US Smoking Tobacco Market, By Value, Historical 2013-2017 (USD Billion) 71
Figure 48: US Cigar Market, By Value, Historical 2013-2017 (USD Billion) 72
Figure 49: US Cigar Market, By Value, Forecast, 2018-2023(USD Billion) 72
Figure 50: US Smokeless Tobacco Market, By Value, Historical 2013-2017 (USD Billion) 73
Figure 51: US Smokeless Tobacco Market, By Value, Forecast, 2018-2023(USD Billion) 73
Figure 52: US Vapor Market, By Value, Historical 2013-2017 (USD Billion) 74
Figure 53: US Vapor Market, By Value, Forecast, 2018-2023(USD Billion) 74
Figure 54: Canada Tobacco Market Size, By Value, 2013-2023 (USD Billion) 76
Figure 55: Canada Cigarette Market, By Value, Historical, 2013-2017 (USD Billion) 77
Figure 56: Canada Cigarette Market, By Value, Forecast, 2018-2023 (USD Billion) 77
Figure 57: Canada Smoking Tobacco Market, By Value, Historical 2013-2017 (USD Billion) 78
Figure 58: Canada Smoking Tobacco Market, By Value, Forecast, 2018-2023(USD Billion) 78
Figure 59: Canada Cigar Market, By Value, Historical 2013-2017 (USD Billion) 79
Figure 60: Canada Cigar Market, By Value, Forecast, 2018-2023(USD Billion) 79
14
List of Figures
Figure No. Figure Title Page No.
Figure 61: Canada Smokeless Tobacco Market, By Value, Historical 2013-2017 (USD Billion) 80
Figure 62: Canada Smokeless Tobacco Market, By Value, Forecast, 2018-2023(USD Billion) 80
Figure 63: Canada Vapor Market, By Value, Historical 2013-2017 (USD Billion) 81
Figure 64: Canada Vapor Market, By Value, Forecast, 2018-2023(USD Billion) 81
Figure 65: Mexico Tobacco Market Size, By Value, 2013-2023 (USD Billion) 83
Figure 66: Mexico Cigarette Market, By Value, Historical, 2013-2017 (USD Billion) 84
Figure 67: Mexico Cigarette Market, By Value, Forecast, 2018-2023 (USD Billion) 84
Figure 68: Mexico Smoking Tobacco Market, By Value, Historical 2013-2017 (USD Billion) 85
Figure 69: Mexico Smoking Tobacco Market, By Value, Forecast, 2018-2023(USD Billion) 85
Figure 70: Mexico Cigar Market, By Value, Historical 2013-2017 (USD Billion) 86
Figure 71: Mexico Cigar Market, By Value, Forecast, 2018-2023(USD Billion) 86
Figure 72: Mexico Smokeless Tobacco Market, By Value, Historical 2013-2017 (USD Billion) 87
Figure 73: Mexico Smokeless Tobacco Market, By Value, Forecast, 2018-2023(USD Billion) 87
Figure 74: Mexico Vapor Market, By Value, Historical 2013-2017 (USD Billion) 88
Figure 75: Mexico Vapor Market, By Value, Forecast, 2018-2023(USD Billion) 88
Figure 76: Brazil Tobacco Market Size, By Value, 2013-2023 (USD Billion) 90
Figure 77: Brazil Cigarette Market, By Value, Historical, 2013-2017 (USD Billion) 91
Figure 78: Brazil Cigarette Market, By Value, Forecast, 2018-2023 (USD Billion) 91
Figure 79: Brazil Smoking Tobacco Market, By Value, Historical 2013-2017 (USD Billion) 92
Figure 80: Brazil Smoking Tobacco Market, By Value, Forecast, 2018-2023(USD Billion) 92
15
List of Figures
Figure No. Figure Title Page No.
Figure 81: Brazil Cigar Market, By Value, Historical 2013-2017 (USD Billion) 93
Figure 82: Brazil Cigar Market, By Value, Forecast, 2018-2023(USD Billion) 93
Figure 83: Brazil Smokeless Tobacco Market, By Value, Historical 2013-2017 (USD Billion) 94
Figure 84: Brazil Smokeless Tobacco Market, By Value, Forecast, 2018-2023(USD Billion) 94
Figure 85: Rest of America Tobacco Market Size, By Value, 2013-2023 (USD Billion) 96
Figure 86: Europe Tobacco Market Size, By Value, 2013-2017 (USD Billion) 98
Figure 87: Europe Tobacco Market Size, By Value, Forecast, 2018-2023 (USD Billion) 99
Figure 88: Leading Brands in Global Tobacco market, By Brand 2017 (%) 101
Figure 89: Europe Tobacco Market Size, By Region, 2017 (%) 102
Figure 90: Europe Tobacco Market Size, By Region, 2023 (%) 103
Figure 91: Europe Cigarette Market, By Value, Historical 2013-2017 (USD Billion) 104
Figure 92: Europe Cigarette Market, By Value, Forecast, 2018-2023(USD Billion) 104
Figure 93: Europe Cigarette Market, By Value, Historical 2013-2017 (USD Billion) 105
Figure 94: Europe Cigarette Market, By Value, Forecast, 2018-2023(USD Billion) 105
Figure 95: Europe Smoking Tobacco Market, By Value, Historical 2013-2017 (USD Billion) 106
Figure 96: Europe Smoking Tobacco Market, By Value, Forecast, 2018-2023(USD Billion) 106
Figure 97: Europe Cigar Market, By Value, Historical 2013-2017 (USD Billion) 107
Figure 98: Europe Cigar Market, By Value, Forecast, 2018-2023(USD Billion) 107
Figure 99: Europe Cigar Market, By Value, Historical 2013-2017 (USD Billion) 108
Figure 100: Europe Cigars Market, By Value, Forecast, 2018-2023(USD Billion) 108
16
List of Figures
Figure No. Figure Title Page No.
Figure 101: Europe Smokeless Tobacco Market, By Value, Historical 2013-2017 (USD Billion) 109
Figure 102: Europe Smokeless Tobacco Market, By Value, Forecast, 2018-2023(USD Billion) 109
Figure 103: Europe Smokeless tobacco Market, By Value, Historical 2013-2017 (USD Billion) 110
Figure 104: Europe Smokeless Tobacco Market, By Value, Forecast, 2018-2023(USD Billion) 110
Figure 105: Europe Vapor Market, By Value, Historical 2013-2017 (USD Billion) 111
Figure 106: Europe Vapor Market, By Value, Forecast, 2018-2023(USD Billion) 111
Figure 107: Per Capita Health Expenditure, By Select Country, 2016 (USD) 112
Figure 108: European Union Population Size, 2013-2017 (% of total) 112
Figure 109: U.K Tobacco Market Size, By Value, 2013-2023 (USD Billion) 115
Figure 110: U.K Cigarette Market, By Value, Historical, 2013-2017 (USD Billion) 116
Figure 111: U.K Cigarette Market, By Value, Forecast, 2018-2023 (USD Billion) 116
Figure 112: U.K Smoking Tobacco Market, By Value, Historical 2013-2017 (USD Billion) 117
Figure 113: U.K Smoking Tobacco Market, By Value, Forecast, 2018-2023(USD Billion) 117
Figure 114: U.K Cigar Market, By Value, Historical 2013-2017 (USD Billion) 118
Figure 115: U.K Cigar Market, By Value, Forecast, 2018-2023 (USD Billion) 118
Figure 116: U.K Smokeless Tobacco Market, By Value, Historical 2013-2017 (USD Billion) 119
Figure 117: U.K Smokeless Tobacco Market, By Value, Forecast, 2018-2023(USD Billion) 119
Figure 118: U.K Vapor Market, By Value, Historical 2013-2017 (USD Billion) 120
Figure 119: U.K Vapor Market, By Value, Forecast, 2018-2023 (USD Billion) 120
Figure 120: Germany Tobacco Market Size, By Value, 2013-2023 (USD Billion) 122
17
List of Figures
Figure No. Figure Title Page No.
Figure 121: Germany Cigarette Market, By Value, Historical, 2013-2017 (USD Billion) 123
Figure 122: Germany Cigarette Market, By Value, Forecast, 2018-2023 (USD Billion) 123
Figure 123: Germany Smoking Tobacco Market, By Value, Historical 2013-2017 (USD Billion) 124
Figure 124: Germany Smoking Tobacco Market, By Value, Forecast, 2018-2023(USD Billion) 124
Figure 125: Germany Cigar Market, By Value, Historical 2013-2017 (USD Billion) 125
Figure 126: Germany Cigar Market, By Value, Forecast, 2018-2023(USD Billion) 125
Figure 127: Germany Smokeless Tobacco Market, By Value, Historical 2013-2017 (USD Billion) 126
Figure 128: Germany Smokeless Tobacco Market, By Value, Forecast, 2018-2023(USD Billion) 126
Figure 129: Germany Vapor Market, By Value, Historical 2013-2017 (USD Billion) 127
Figure 130: Germany Vapor Market, By Value, Forecast, 2018-2023(USD Billion) 127
Figure 131: France Tobacco Market Size, By Value, 2013-2023 (USD Billion) 129
Figure 132: France Cigarette Market, By Value, Historical, 2013-2017 (USD Billion) 130
Figure 133: France Cigarette Market, By Value, Forecast, 2018-2023 (USD Billion) 130
Figure 134: France Smoking Tobacco Market, By Value, Historical 2013-2017 (USD Billion) 131
Figure 135: France Smoking Tobacco Market, By Value, Forecast, 2018-2023(USD Billion) 131
Figure 136: France Cigar Market, By Value, Historical 2013-2017 (USD Billion) 132
Figure 137: France Cigar Market, By Value, Forecast, 2018-2023(USD Billion) 132
Figure 138: France Smokeless Tobacco Market, By Value, Historical 2013-2017 (USD Billion) 133
Figure 139: France Smokeless Tobacco Market, By Value, Forecast, 2018-2023(USD Billion) 133
Figure 140: France Vapor Market, By Value, Historical 2013-2017 (USD Billion) 134
18
List of Figures
Figure No. Figure Title Page No.
Figure 141: France Vapor Market, By Value, Forecast, 2018-2023(USD Billion) 134
Figure 142: France, Per Capita Health Expenditure, 2013-2017 (USD) 135
Figure 143: France, Health Expenditure, Share of GDP, 2013-2017 (In %) 135
Figure 144: Rest of Europe Tobacco Market Size, By Value, 2013-2023 (USD Billion) 137
Figure 145: APAC Tobacco Market, By Value, Historical 2013-2017 (USD Billion) 139
Figure 146: APAC Tobacco Market, By Value, Forecast, 2018-2023(USD Billion) 139
Figure 147: APAC Tobacco Market Size, By Region, 2017 (%) 141
Figure 148: APAC Tobacco Market Size, By Region, 2023 (%) 142
Figure 149: Leading Brands in Global Tobacco market, By Brand 2017 (%) 143
Figure 150: APAC Cigarette Market, By Value, Historical 2013-2017 (USD Billion) 144
Figure 151: APAC Cigarette Market, By Value, Forecast, 2018-2023(USD Billion) 144
Figure 152: APAC Cigarette Market, By Value, Historical 2013-2017 (USD Billion) 145
Figure 153: APAC Cigarette Market, By Value, Forecast, 2018-2023(USD Billion) 145
Figure 154: APAC Cigars Market, By Value, Historical 2013-2017 (USD Billion) 146
Figure 155: APAC Cigars Market, By Value, Forecast, 2018-2023(USD Billion 146
Figure 156: APAC Cigar Market, By Value, Historical 2013-2017 (USD Billion) 147
Figure 157: APAC Cigar Market, By Value, Forecast, 2018-2023 (USD Billion) 147
Figure 158: APAC Smokeless Tobacco Market, By Value, Historical 2013-2017 (USD Billion) 148
Figure 159: APAC Smokeless Tobacco Market, By Value, Historical 2013-2017 (USD Billion) 149
Figure 160: APAC Smokeless Tobacco Market, By Value, Forecast, 2018-2023(USD Billion) 149
19
List of Figures
Figure No. Figure Title Page No.
Figure 161: APAC Vapor Market, By Value, Historical 2013-2017 (USD Billion) 150
Figure 162: APAC Vapor Market, By Value, Forecast, 2018-2023(USD Billion) 150
Figure 163: India Tobacco Market Size, By Value, 2013-2023 (USD Billion) 153
Figure 164: India Cigarette Market, By Value, Historical, 2013-2017 (USD Billion) 155
Figure 165: India Cigarette Market, By Value, Forecast, 2018-2023 (USD Billion) 155
Figure 166: India Smoking Tobacco Market, By Value, Historical, 2013-2017 (USD Billion) 156
Figure 167: India Smoking Tobacco Market, By Value, Forecast, 2018-2023 (USD Billion) 156
Figure 168: India Cigar Market, By Value, Historical, 2013-2017 (USD Billion) 157
Figure 169: India Cigar Market, By Value, Forecast, 2018-2023 (USD Billion) 157
Figure 170: India Smokeless Tobacco Market, By Value, Historical, 2013-2017 (USD Billion) 158
Figure 171: India Smokeless Tobacco Market, By Value, Forecast, 2018-2023 (USD Billion) 158
Figure 172: India Vapor Market, By Value, Historical, 2013-2017 (USD Billion) 159
Figure 173: India Vapor Market, By Value, Forecast, 2018-2023 (USD Billion) 159
Figure 174: GDP Growth, India, 2013-2017 (In % ) 160
Figure 175: Prevalence of current tobacco use, GATS India, 2009-10 and 2016-17 (In %) 160
Figure 176: China Tobacco Market Size, By Value, 2013-2023 (USD Billion) 162
Figure 177: China Cigarette Market, By Value, Historical, 2013-2017 (USD Billion) 163
Figure 178: China Cigarette Market, By Value, Forecast, 2018-2023 (USD Billion) 163
Figure 179: China Smoking Tobacco Market, By Value, Historical, 2013-2017 (USD Billion) 164
Figure 180: China Smoking Tobacco Market, By Value, Forecast, 2018-2023 (USD Billion) 164
20
List of Figures
Figure No. Figure Title Page No.
Figure 181: China Cigar Market, By Value, Historical, 2013-2017 (USD Billion) 165
Figure 182: China Cigar Market, By Value, Forecast, 2018-2023 (USD Billion) 165
Figure 183: China Smokeless Tobacco Market, By Value, Historical, 2013-2017 (USD Billion) 166
Figure 184: China Smokeless Tobacco Market, By Value, Forecast, 2018-2023 (USD Billion) 166
Figure 185: China Vapor Market, By Value, Historical, 2013-2017 (USD Billion) 167
Figure 186: China Vapor Market, By Value, Forecast, 2018-2023 (USD Billion) 167
Figure 187: Japan Tobacco Market Size, By Value, 2013-2023 (USD Billion) 169
Figure 188: Japan Cigarette Market, By Value, Historical, 2013-2017 (USD Billion) 170
Figure 189: Japan Cigarette Market, By Value, Historical, 2013-2017 (USD Billion) 170
Figure 190: Japan Smoking Tobacco Market, By Value, Historical, 2013-2017 (USD Billion) 171
Figure 191: Japan Smoking Tobacco Market, By Value, Historical, 2013-2017 (USD Billion) 171
Figure 192: Japan Cigar Market, By Value, Historical, 2013-2017 (USD Billion) 172
Figure 193: Japan Cigar Market, By Value, Forecast, 2018-2023 (USD Billion) 172
Figure 194: Japan Cigar Market, By Value, Forecast, 2018-2023 (USD Billion 173
Figure 195: Japan Smokeless Tobacco Market, By Value, Forecast, 2018-2023 (USD Billion) 173
Figure 196: Japan Vapor Market, By Value, Historical, 2013-2017 (USD Billion) 174
Figure 197: Japan Vapor Market, By Value, Forecast, 2018-2023 (USD Billion) 174
Figure 198: Indonesia Tobacco Market Size, By Value, 2013-2023 (USD Billion) 176
Figure 199: Indonesia Cigarette Market, By Value, Historical, 2013-2017 (USD Billion) 177
Figure 200: Indonesia Cigarette Market, By Value, Historical, 2013-2017 (USD Billion) 177
21
List of FiguresFigure No. Figure Title Page No.
Figure 201: Indonesia Smoking Tobacco Market, By Value, Historical, 2013-2017 (USD Billion) 178
Figure 202: Indonesia Smoking Tobacco Market, By Value, Forecast, 2018-2023 (USD Billion) 178
Figure 203: Indonesia Cigar Market, By Value, Historical, 2013-2017 (USD Billion) 179
Figure 204: Indonesia Cigar Market, By Value, Forecast, 2018-2023 (USD Billion) 179
Figure 205: Indonesia Smokeless Tobacco Market, By Value, Historical, 2013-2017 (USD Billion) 180
Figure 206: Indonesia Smokeless Tobacco Market, By Value, Forecast, 2018-2023 (USD Billion) 180
Figure 207: Indonesia Vapor Market, By Value, Historical, 2013-2017 (USD Billion) 181
Figure 208: Indonesia Vapor Market, By Value, Forecast, 2018-2023 (USD Billion) 181
Figure 209: Rest of APAC Tobacco Market Size, By Value, 2013-2023 (USD Billion) 183
Figure 210: ROW Tobacco Market Size, By Value, 2013-2017 (USD Billion) 185
Figure 211: ROW Tobacco Market Size, By Value, Forecast, 2018-2023 (USD Billion) 186
Figure 212: Adults who currently use e-cigarettes, 2016 (in %) 190
Figure 213: Rising Global GDP per capita (USD) 194
Figure 214: Global Tobacco Market Size, By Company Share, 2017(%) 207
Figure 215: ITC, Revenue, 2013-2018 (USD Millions) 210
Figure 216: ITC, Revenue, By Business Segments, 2018 (%) 210
Figure 217: ITC, Revenue, By Geographic Region, 2018 (%) 211
Figure 218: ITC, Net Profit, 2013-2018 (in USD Million) 211
Figure 219: PMI, Revenue, 2013-2017 (USD Million) 213
Figure 220: PMI, Net Sales, By Product segment, 2017 (%) 213
22
List of FiguresFigure No. Figure Title Page No.
Figure 221: PMI, Net Profit,2013-2017,(USD Million) 214
Figure 222: PMI, Net Sales by Geographical Region,2013-17,(USD Million) 214
Figure 223: Altria Group, Revenue, 2013-2017 (USD Millions) 216
Figure 224: Altria, Net Profit, 2013-2017 ( In USD Million) 216
Figure 225: Altria Group, Revenue by Products, 2017,( In % ) 217
Figure 226: KT&G, Revenue, 2013-2017 (USD Millions) 219
Figure 227: KT&G, Revenue, By Overseas Geographical Region, 2017 (%) 219
Figure 228: KT&G, Net Profit, 2013-2017,(USD Millions) 220
Figure 229: KT&G, Revenue, By Product Segments, 2017, (in %) 220
Figure 230: KT&G, Revenue, By Product, 2017, (in %) 221
Figure 231: BAT, Revenue, 2013-2017 (USD Millions) 223
Figure 232: BAT, Revenue, By Overseas Geographical Region, 2017 (%) 223
Figure 233: BAT, Net Profit, 2013-2017 (USD Millions) 224
Figure 234: Japan Tobacco International, Revenue, 2013-2017 (USD Millions) 226
Figure 235: Japan Tobacco International, Revenue, By Geographical Region, 2017 (in %) 226
Figure 236: Japan Tobacco International, Net Profit, 2013-2017 (USD Millions) 227
Figure 237: Japan Tobacco International, Revenue By Product Segments, 2017, (in %) 227
Figure 238: Gudang Garam, Revenue, 2013-2017 (USD Millions) 230
Figure 239: Gudang Garam, Revenue, 2013-2017, (In USD Millions) 230
Figure 240: Gudang Garam, Net Profit, 2013-2017, (in USD millions) 231
23
List of FiguresFigure No. Figure Title Page No.
Figure 241: Gudang Garam, Regional Revenue, 2013-2017, (in %) 231
Figure 242: Gudang Garam, Product wise Revenue, 2017 (%) 232
Figure 243: Imperial Brands, Revenue, 2013-2017 (USD Millions) 234
Figure 244: Imperial Brands, Revenue, By Geographical Region, 2017 (In %) 234
Figure 245: Imperial Brands, Net Profit, By Segment ( USD Millions) 235
Figure 246: Imperial Brands, Revenue by brands, 2013-2017 (In %) 235
Figure 247: Scandinavian Tobacco Group’s, Revenue, 2013-2017 (USD Millions) 237
Figure 248: Scandinavian Tobacco Group’s, Revenue, By Region, 2016 (%) 237
Figure 249: Scandinavian Tobacco Group’s, Net Income, 2013-2017 (USD Millions) 238
Figure 250: Scandinavian Tobacco Group’s, Product wise Revenue, 2017 (In %) 238
Figure 251: Turning Point Brands, Revenue, 2013-2017 (USD Millions) 240
Figure 252: Turning Point Brands, Region wise Revenue, 2017 (in %) 240
Figure 253: Turning Point Brands, Net Profit, 2013-2017 (in USD millions) 241
Figure 254: Turning Point Brands, Product wise Revenue, 2017, (in %) 241
24
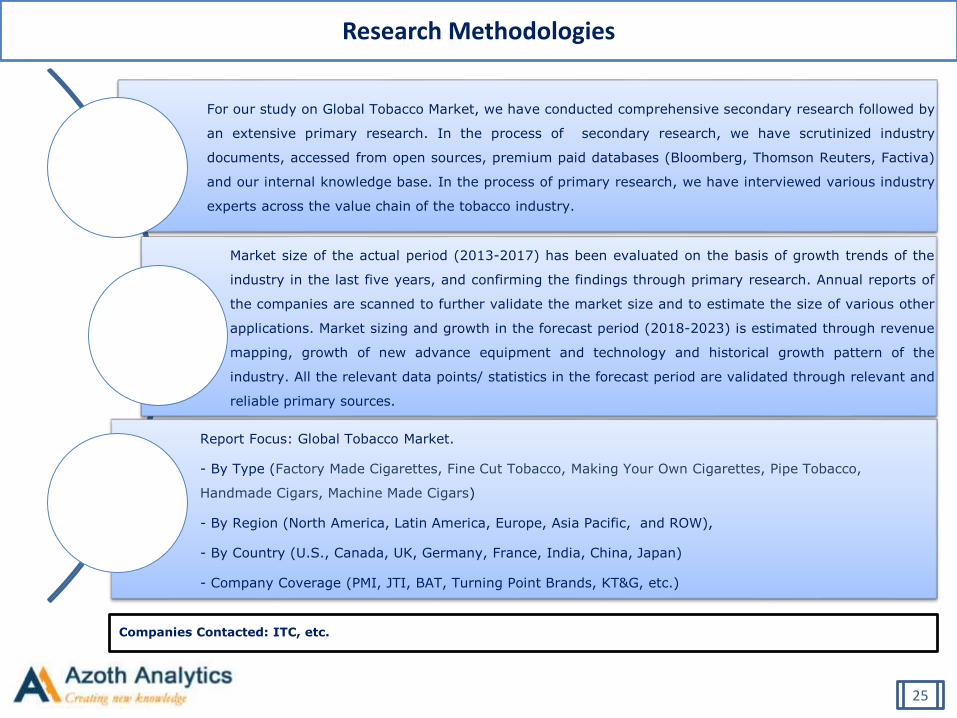
For our study on Global Tobacco Market, we have conducted comprehensive secondary research followed by
an extensive primary research. In the process of secondary research, we have scrutinized industry
documents, accessed from open sources, premium paid databases (Bloomberg, Thomson Reuters, Factiva)
and our internal knowledge base. In the process of primary research, we have interviewed various industry
experts across the value chain of the tobacco industry.
Market size of the actual period (2013-2017) has been evaluated on the basis of growth trends of the
industry in the last five years, and confirming the findings through primary research. Annual reports of
the companies are scanned to further validate the market size and to estimate the size of various other
applications. Market sizing and growth in the forecast period (2018-2023) is estimated through revenue
mapping, growth of new advance equipment and technology and historical growth pattern of the
industry. All the relevant data points/ statistics in the forecast period are validated through relevant and
reliable primary sources.
Report Focus: Global Tobacco Market.
- By Type (Factory Made Cigarettes, Fine Cut Tobacco, Making Your Own Cigarettes, Pipe Tobacco,
Handmade Cigars, Machine Made Cigars)
- By Region (North America, Latin America, Europe, Asia Pacific, and ROW),
- By Country (U.S., Canada, UK, Germany, France, India, China, Japan)
- Company Coverage (PMI, JTI, BAT, Turning Point Brands, KT&G, etc.)
Companies Contacted: ITC, etc.
Research Methodologies
25
Global Tobacco Market Overview
Source: Azoth Analytics Estimates
Xx
Xx
Xx
Xx
Xx
Xx
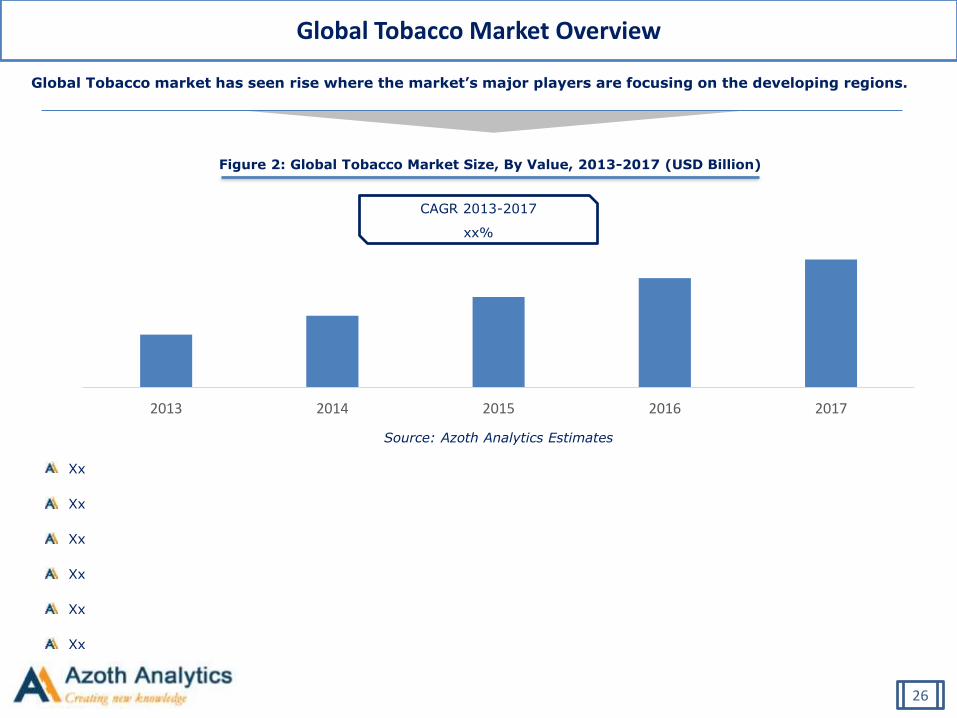
Global Tobacco market has seen rise where the market’s major players are focusing on the developing regions.
Figure 2: Global Tobacco Market Size, By Value, 2013-2017 (USD Billion)
CAGR 2013-2017
xx%
2013 2014 2015 2016 2017
26
Global Tobacco Market Overview
Source: Azoth Analytics Estimates
Xx
Xx
Xx
Xx
Xx
Xx
Xx
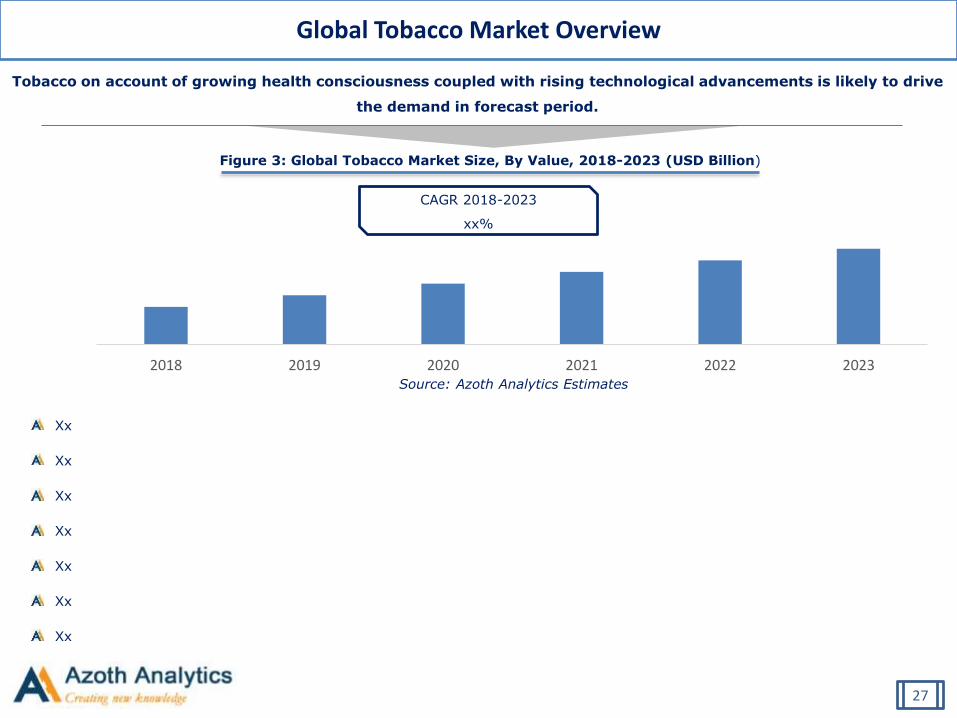
Tobacco on account of growing health consciousness coupled with rising technological advancements is likely to drive
the demand in forecast period.
Figure 3: Global Tobacco Market Size, By Value, 2018-2023 (USD Billion)
CAGR 2018-2023
xx%
2018 2019 2020 2021 2022 2023
27
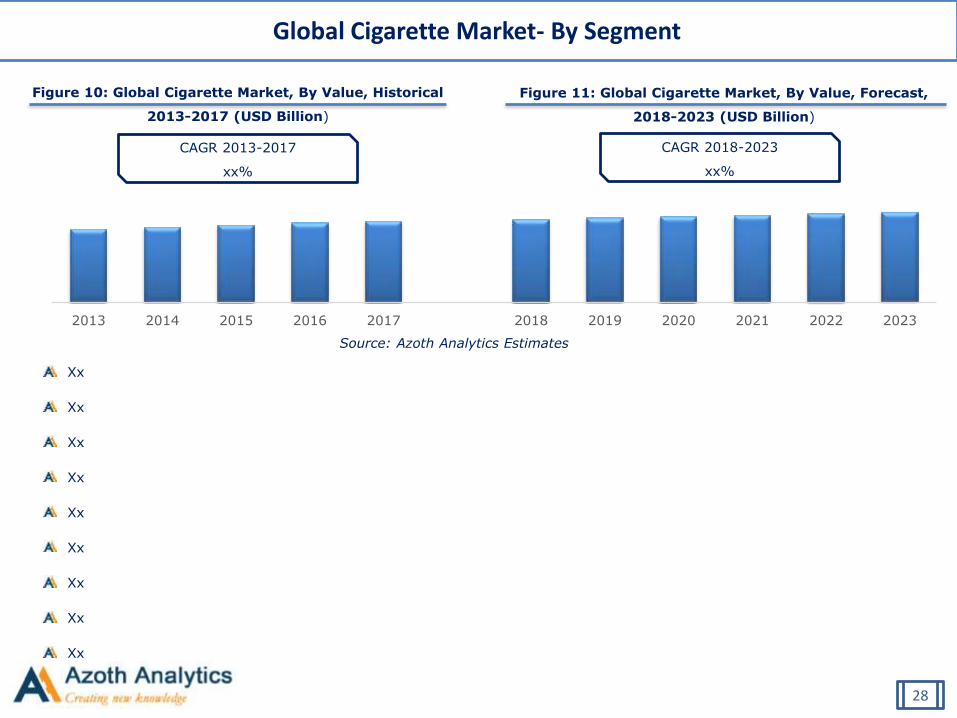
Figure 10: Global Cigarette Market, By Value, Historical
2013-2017 (USD Billion)
Source: Azoth Analytics Estimates
CAGR 2013-2017
xx%
CAGR 2018-2023
xx%
Figure 11: Global Cigarette Market, By Value, Forecast,
2018-2023 (USD Billion)
Global Cigarette Market- By Segment
Xx
Xx
Xx
Xx
Xx
Xx
Xx
Xx
Xx
2013 2014 2015 2016 2017 2018 2019 2020 2021 2022 2023
28
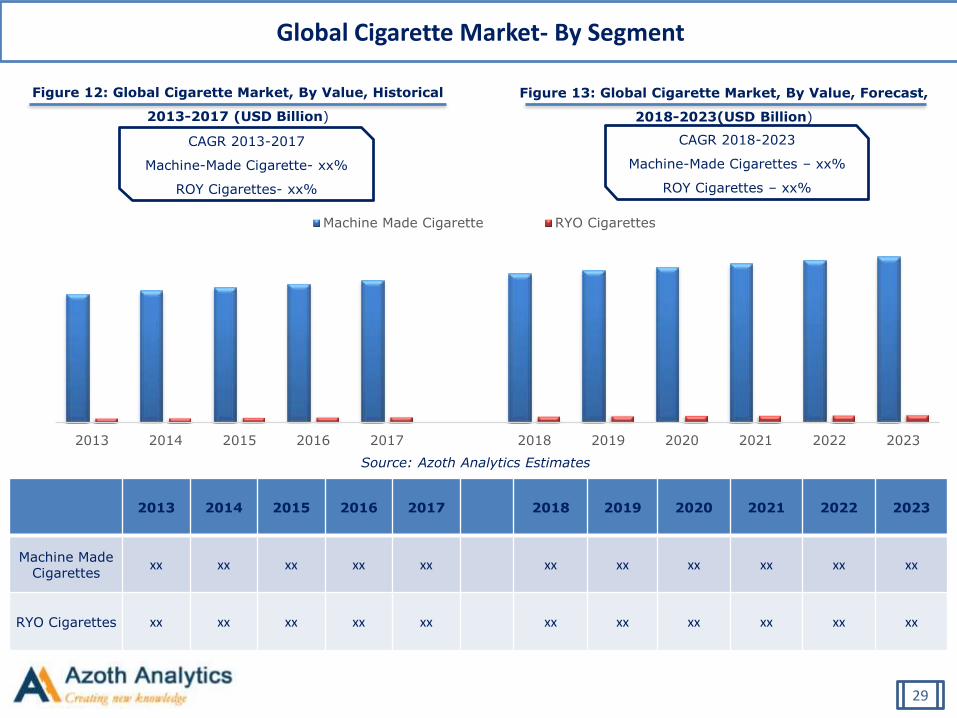
Figure 12: Global Cigarette Market, By Value, Historical
2013-2017 (USD Billion)
Source: Azoth Analytics Estimates
CAGR 2013-2017
Machine-Made Cigarette- xx%
ROY Cigarettes- xx%
CAGR 2018-2023
Machine-Made Cigarettes – xx%
ROY Cigarettes – xx%
Figure 13: Global Cigarette Market, By Value, Forecast,
2018-2023(USD Billion)
Global Cigarette Market- By Segment
2013 2014 2015 2016 2017 2018 2019 2020 2021 2022 2023
Machine Made Cigarette RYO Cigarettes
2013 2014 2015 2016 2017 2018 2019 2020 2021 2022 2023
Machine Made Cigarettes
xx xx xx xx xx xx xx xx xx xx xx
RYO Cigarettes xx xx xx xx xx xx xx xx xx xx xx
29
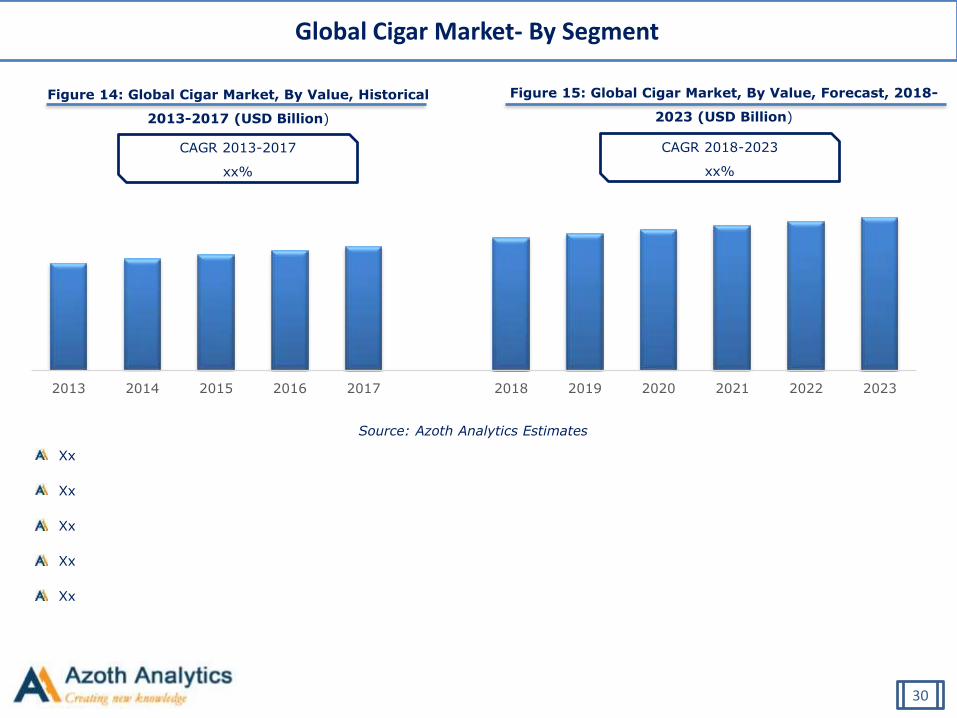
Figure 14: Global Cigar Market, By Value, Historical
2013-2017 (USD Billion)
Source: Azoth Analytics Estimates
CAGR 2013-2017
xx%
CAGR 2018-2023
xx%
Figure 15: Global Cigar Market, By Value, Forecast, 2018-
2023 (USD Billion)
Global Cigar Market- By Segment
Xx
Xx
Xx
Xx
Xx
2013 2014 2015 2016 2017 2018 2019 2020 2021 2022 2023
30
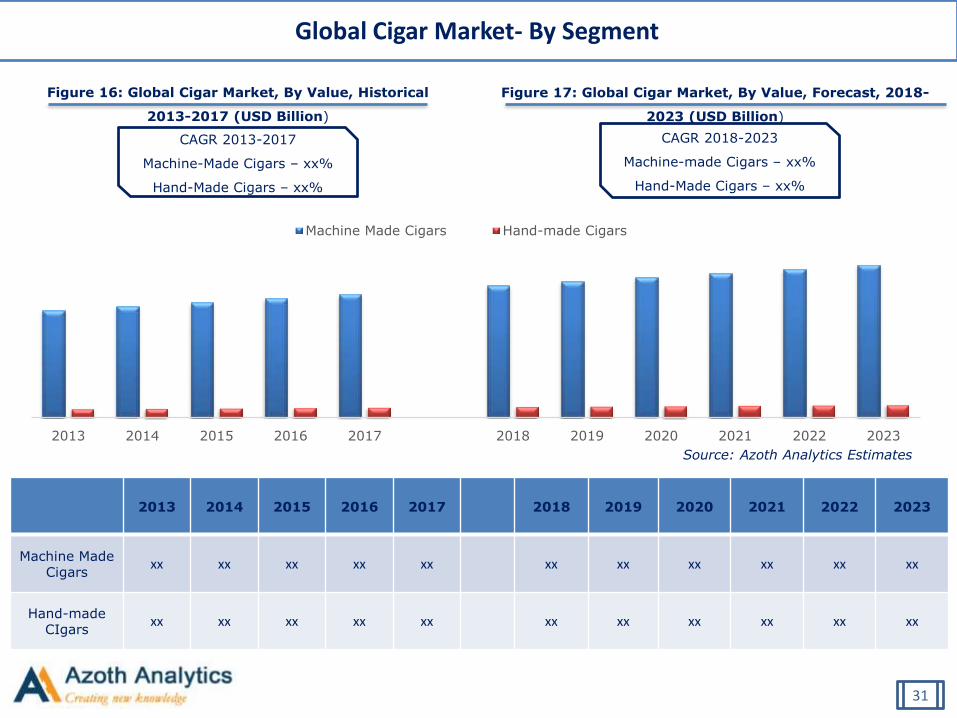
Figure 16: Global Cigar Market, By Value, Historical
2013-2017 (USD Billion)
Source: Azoth Analytics Estimates
CAGR 2013-2017
Machine-Made Cigars – xx%
Hand-Made Cigars – xx%
CAGR 2018-2023
Machine-made Cigars – xx%
Hand-Made Cigars – xx%
Figure 17: Global Cigar Market, By Value, Forecast, 2018-
2023 (USD Billion)
Global Cigar Market- By Segment
2013 2014 2015 2016 2017 2018 2019 2020 2021 2022 2023
Machine Made Cigars Hand-made Cigars
2013 2014 2015 2016 2017 2018 2019 2020 2021 2022 2023
Machine Made Cigars
xx xx xx xx xx xx xx xx xx xx xx
Hand-made CIgars
xx xx xx xx xx xx xx xx xx xx xx
31
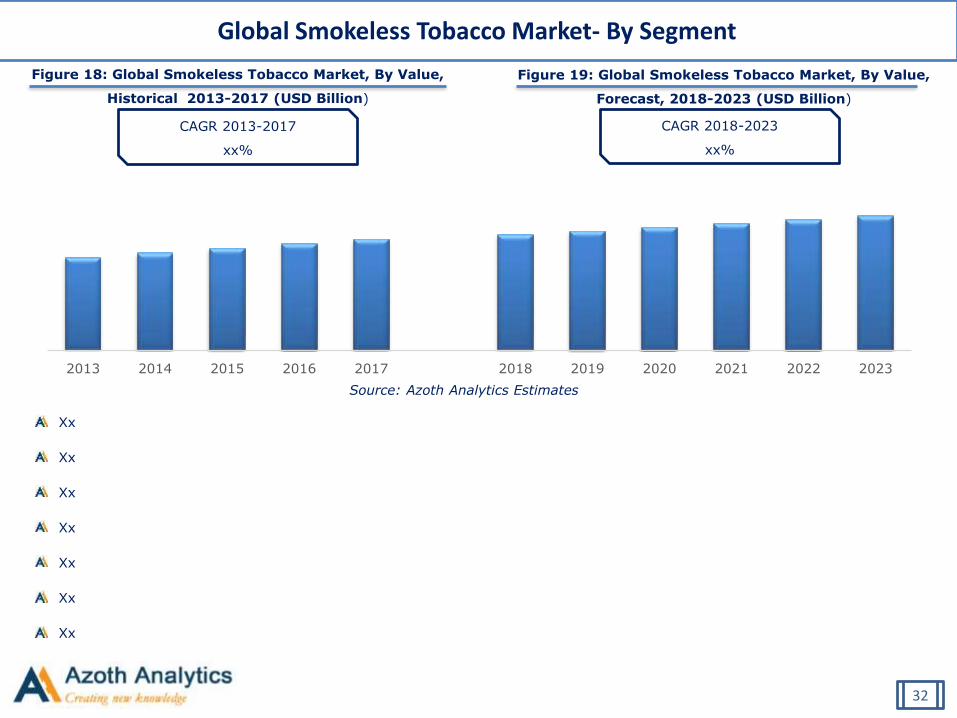
Figure 18: Global Smokeless Tobacco Market, By Value,
Historical 2013-2017 (USD Billion)
Source: Azoth Analytics Estimates
CAGR 2013-2017
xx%
CAGR 2018-2023
xx%
Figure 19: Global Smokeless Tobacco Market, By Value,
Forecast, 2018-2023 (USD Billion)
Global Smokeless Tobacco Market- By Segment
Xx
Xx
Xx
Xx
Xx
Xx
Xx
2013 2014 2015 2016 2017 2018 2019 2020 2021 2022 2023
32
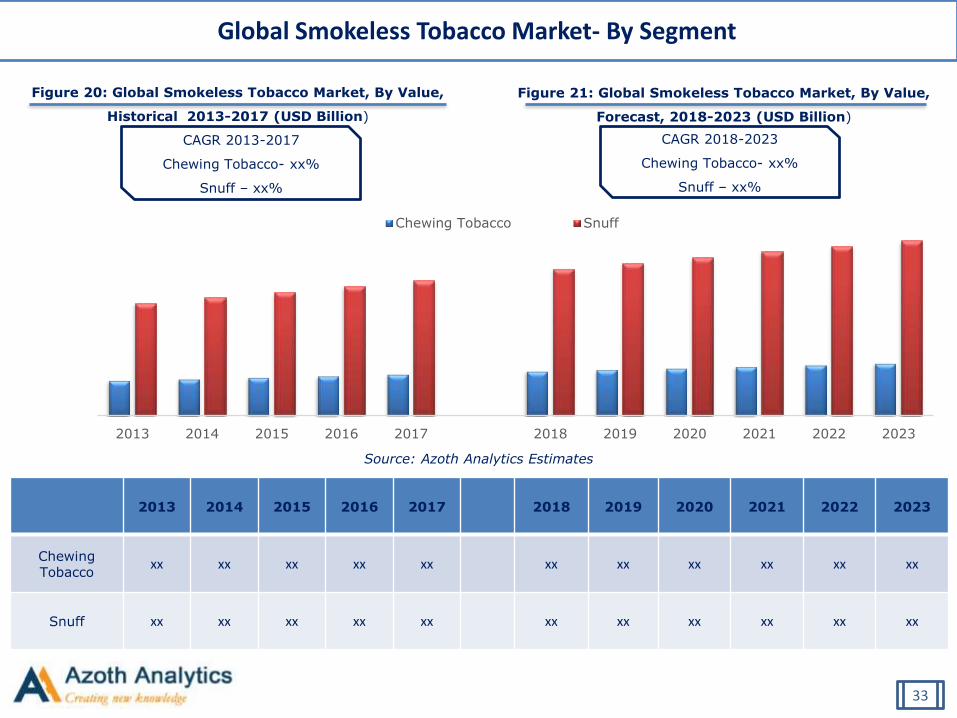
Figure 20: Global Smokeless Tobacco Market, By Value,
Historical 2013-2017 (USD Billion)
Source: Azoth Analytics Estimates
CAGR 2013-2017
Chewing Tobacco- xx%
Snuff – xx%
CAGR 2018-2023
Chewing Tobacco- xx%
Snuff – xx%
Figure 21: Global Smokeless Tobacco Market, By Value,
Forecast, 2018-2023 (USD Billion)
Global Smokeless Tobacco Market- By Segment
2013 2014 2015 2016 2017 2018 2019 2020 2021 2022 2023
Chewing Tobacco Snuff
2013 2014 2015 2016 2017 2018 2019 2020 2021 2022 2023
Chewing Tobacco
xx xx xx xx xx xx xx xx xx xx xx
Snuff xx xx xx xx xx xx xx xx xx xx xx
33
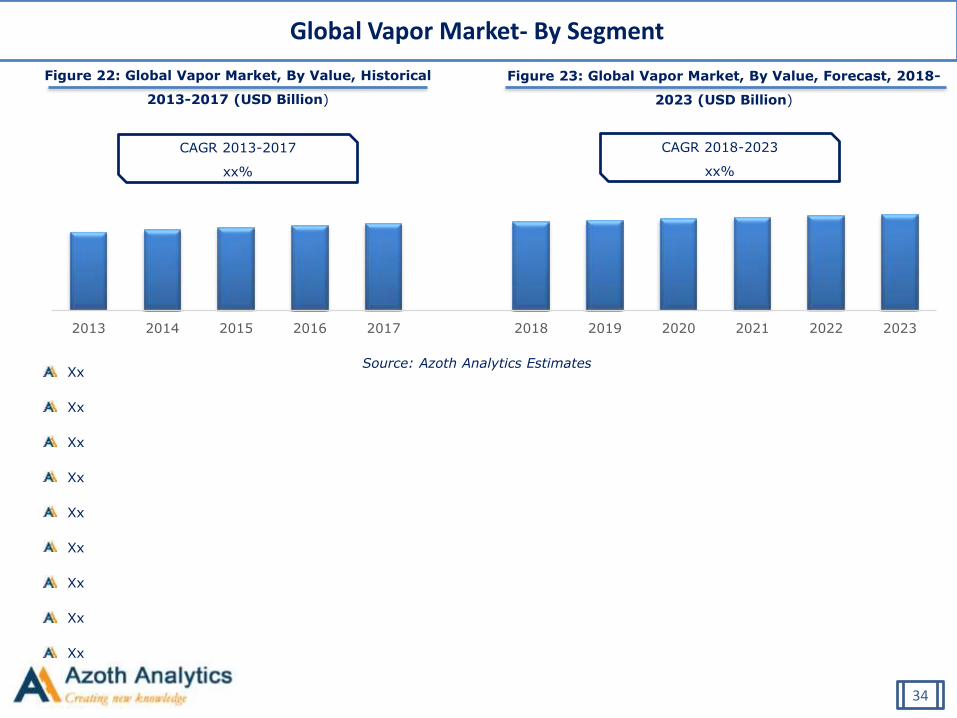
Figure 22: Global Vapor Market, By Value, Historical
2013-2017 (USD Billion)
Source: Azoth Analytics Estimates
Figure 23: Global Vapor Market, By Value, Forecast, 2018-
2023 (USD Billion)
Global Vapor Market- By Segment
34
CAGR 2013-2017
xx%
CAGR 2018-2023
xx%
Xx
Xx
Xx
Xx
Xx
Xx
Xx
Xx
Xx
2013 2014 2015 2016 2017 2018 2019 2020 2021 2022 2023
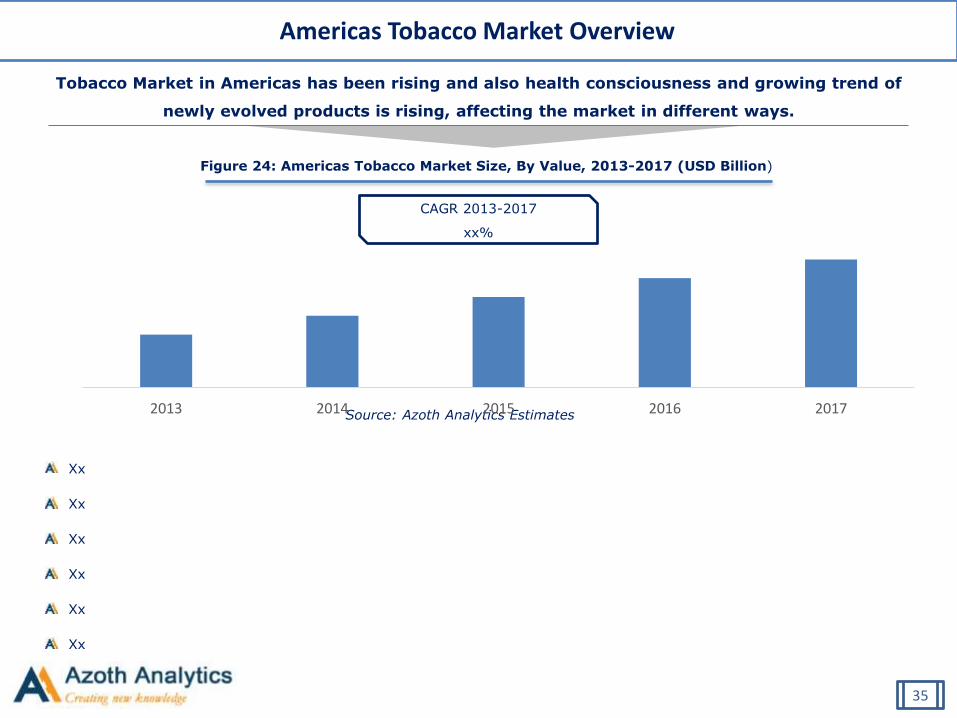
Americas Tobacco Market Overview
Source: Azoth Analytics Estimates
Tobacco Market in Americas has been rising and also health consciousness and growing trend of
newly evolved products is rising, affecting the market in different ways.
Figure 24: Americas Tobacco Market Size, By Value, 2013-2017 (USD Billion)
35
Xx
Xx
Xx
Xx
Xx
Xx
CAGR 2013-2017
xx%
2013 2014 2015 2016 2017

Americas Tobacco Market Overview
Noteworthy growth in the regional market is attributed to high focus on international sales and
pioneering of E-commerce sales
Source: Azoth Analytics Estimates
Figure 25: Americas Tobacco Market Size, By Value, Forecast, 2018-2023 (USD Billion)
36
Xx
Xx
Xx
Xx
Xx
Xx
Xx
CAGR 2018-2023
xx%
2018 2019 2020 2021 2022 2023
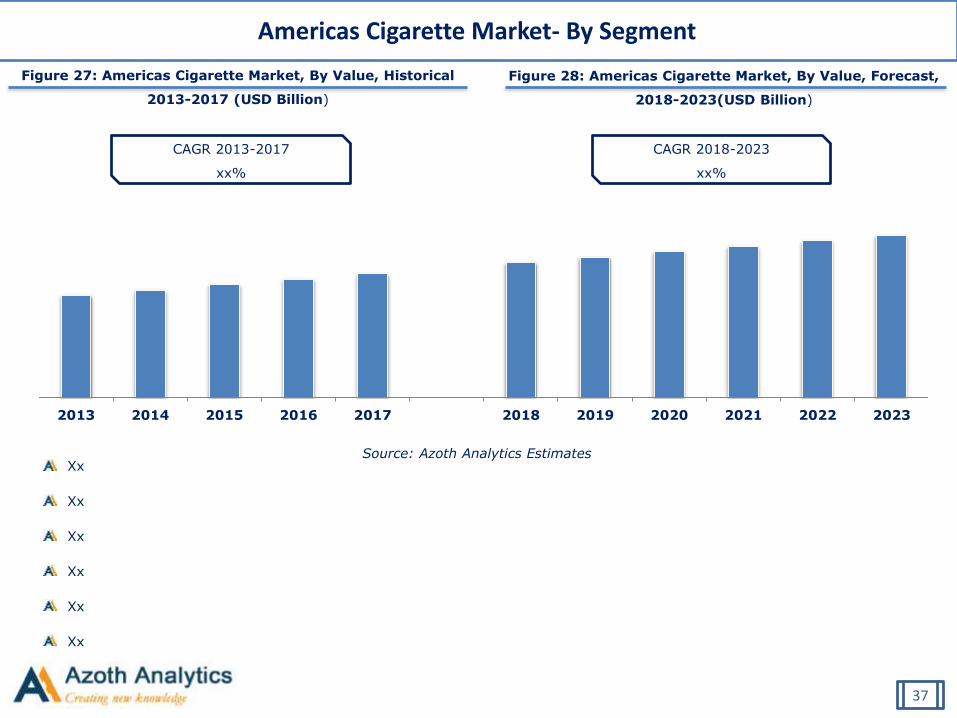
Figure 27: Americas Cigarette Market, By Value, Historical
2013-2017 (USD Billion)
Source: Azoth Analytics Estimates
Figure 28: Americas Cigarette Market, By Value, Forecast,
2018-2023(USD Billion)
Americas Cigarette Market- By Segment
37
CAGR 2013-2017
xx%
CAGR 2018-2023
xx%
2013 2014 2015 2016 2017 2018 2019 2020 2021 2022 2023
Xx
Xx
Xx
Xx
Xx
Xx
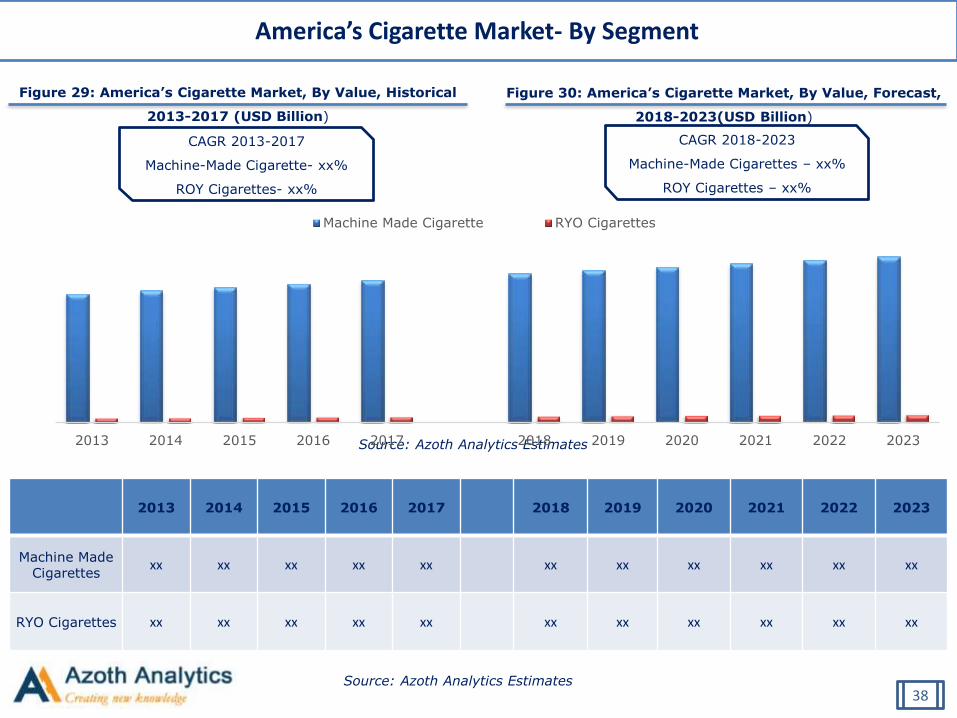
Figure 29: America’s Cigarette Market, By Value, Historical
2013-2017 (USD Billion)
Source: Azoth Analytics Estimates
Figure 30: America’s Cigarette Market, By Value, Forecast,
2018-2023(USD Billion)
America’s Cigarette Market- By Segment
Source: Azoth Analytics Estimates38
CAGR 2013-2017
Machine-Made Cigarette- xx%
ROY Cigarettes- xx%
CAGR 2018-2023
Machine-Made Cigarettes – xx%
ROY Cigarettes – xx%
2013 2014 2015 2016 2017 2018 2019 2020 2021 2022 2023
Machine Made Cigarette RYO Cigarettes
2013 2014 2015 2016 2017 2018 2019 2020 2021 2022 2023
Machine Made Cigarettes
xx xx xx xx xx xx xx xx xx xx xx
RYO Cigarettes xx xx xx xx xx xx xx xx xx xx xx
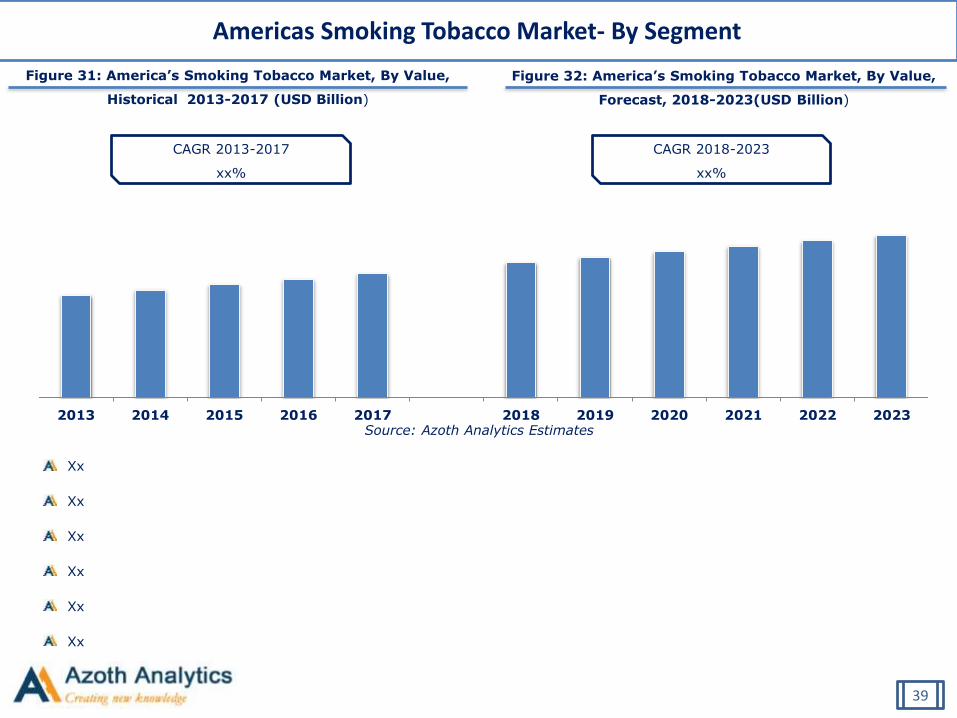
Figure 31: America’s Smoking Tobacco Market, By Value,
Historical 2013-2017 (USD Billion)
Source: Azoth Analytics Estimates
CAGR 2013-2017
xx%
CAGR 2018-2023
xx%
Figure 32: America’s Smoking Tobacco Market, By Value,
Forecast, 2018-2023(USD Billion)
2013 2014 2015 2016 2017 2018 2019 2020 2021 2022 2023
Americas Smoking Tobacco Market- By Segment
Xx
Xx
Xx
Xx
Xx
Xx
39

2013 2014 2015 2016 2017 2018 2019 2020 2021 2022 2023
Figure 33: America’s Cigar Market, By Value, Historical
2013-2017 (USD Billion)
Source: Azoth Analytics Estimates
Figure 34: America’s Cigar Market, By Value, Forecast,
2018-2023(USD Billion)
America’s Cigar Market- By Segment
40
CAGR 2013-2017
xx%
CAGR 2018-2023
xx%
Xx
Xx
Xx
Xx
Xx
Xx
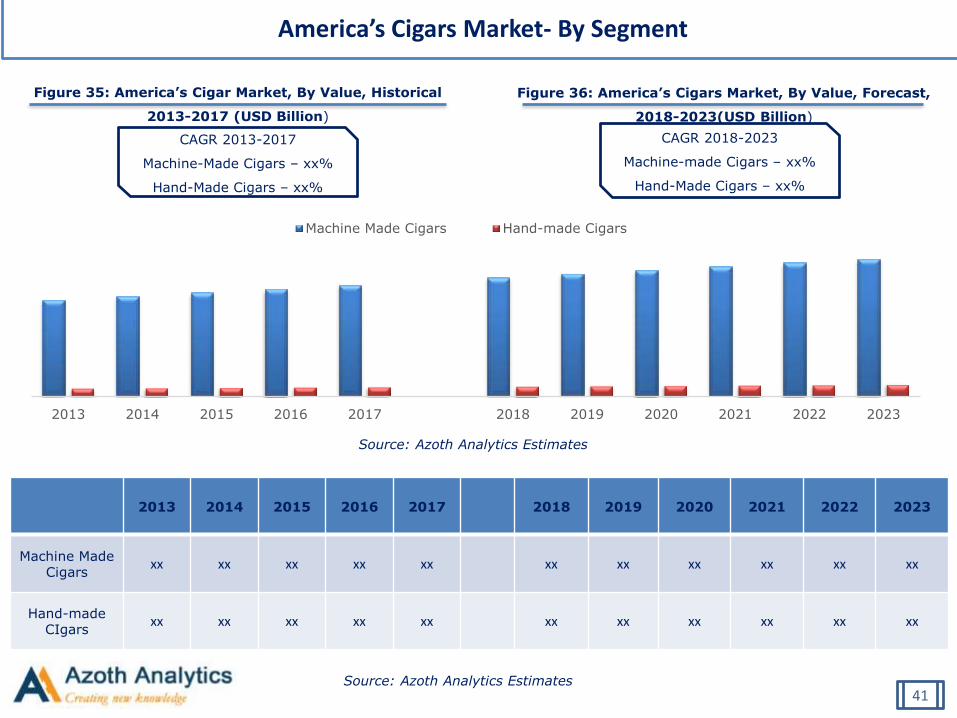
Figure 35: America’s Cigar Market, By Value, Historical
2013-2017 (USD Billion)
Source: Azoth Analytics Estimates
Figure 36: America’s Cigars Market, By Value, Forecast,
2018-2023(USD Billion)
America’s Cigars Market- By Segment
Source: Azoth Analytics Estimates41
CAGR 2013-2017
Machine-Made Cigars – xx%
Hand-Made Cigars – xx%
CAGR 2018-2023
Machine-made Cigars – xx%
Hand-Made Cigars – xx%
2013 2014 2015 2016 2017 2018 2019 2020 2021 2022 2023
Machine Made Cigars Hand-made Cigars
2013 2014 2015 2016 2017 2018 2019 2020 2021 2022 2023
Machine Made Cigars
xx xx xx xx xx xx xx xx xx xx xx
Hand-made CIgars
xx xx xx xx xx xx xx xx xx xx xx

2013 2014 2015 2016 2017 2018 2019 2020 2021 2022 2023
Figure 37: America’s Smokeless Tobacco Market, By Value,
Historical 2013-2017 (USD Billion)
Source: Azoth Analytics Estimates
Figure 38: America’s Smokeless Tobacco Market, By Value,
Forecast, 2018-2023(USD Billion)
Americas Smokeless Tobacco Market- By Segment
42
CAGR 2013-2017
xx%
CAGR 2018-2023
xx%
Xx
Xx
Xx
Xx
Xx
Xx
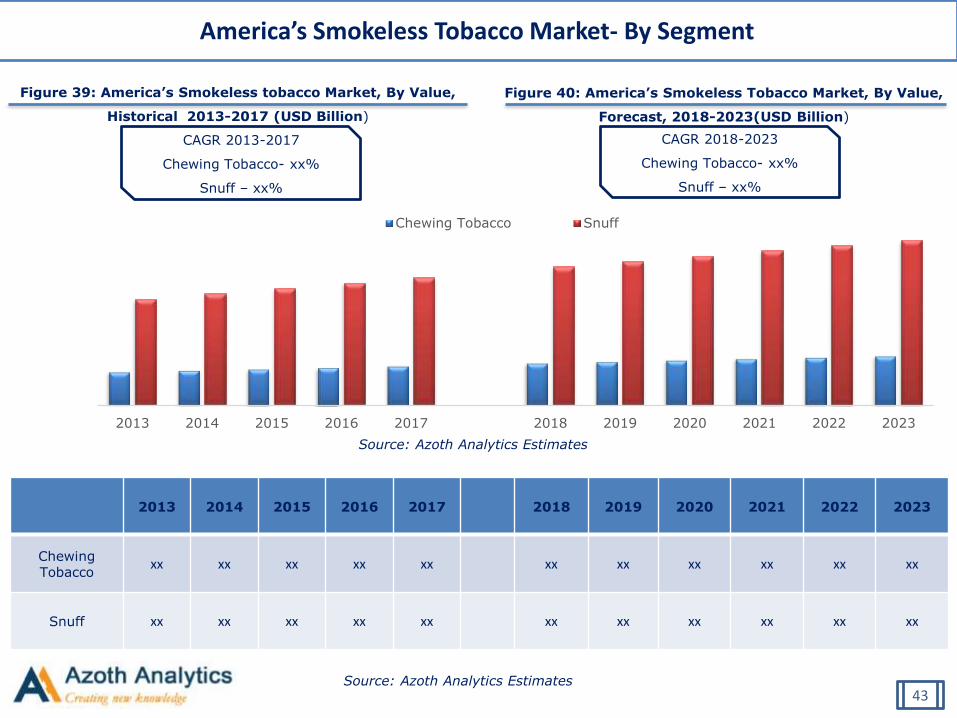
Figure 39: America’s Smokeless tobacco Market, By Value,
Historical 2013-2017 (USD Billion)
Source: Azoth Analytics Estimates
Figure 40: America’s Smokeless Tobacco Market, By Value,
Forecast, 2018-2023(USD Billion)
America’s Smokeless Tobacco Market- By Segment
Source: Azoth Analytics Estimates43
CAGR 2013-2017
Chewing Tobacco- xx%
Snuff – xx%
CAGR 2018-2023
Chewing Tobacco- xx%
Snuff – xx%
2013 2014 2015 2016 2017 2018 2019 2020 2021 2022 2023
Chewing Tobacco Snuff
2013 2014 2015 2016 2017 2018 2019 2020 2021 2022 2023
Chewing Tobacco
xx xx xx xx xx xx xx xx xx xx xx
Snuff xx xx xx xx xx xx xx xx xx xx xx
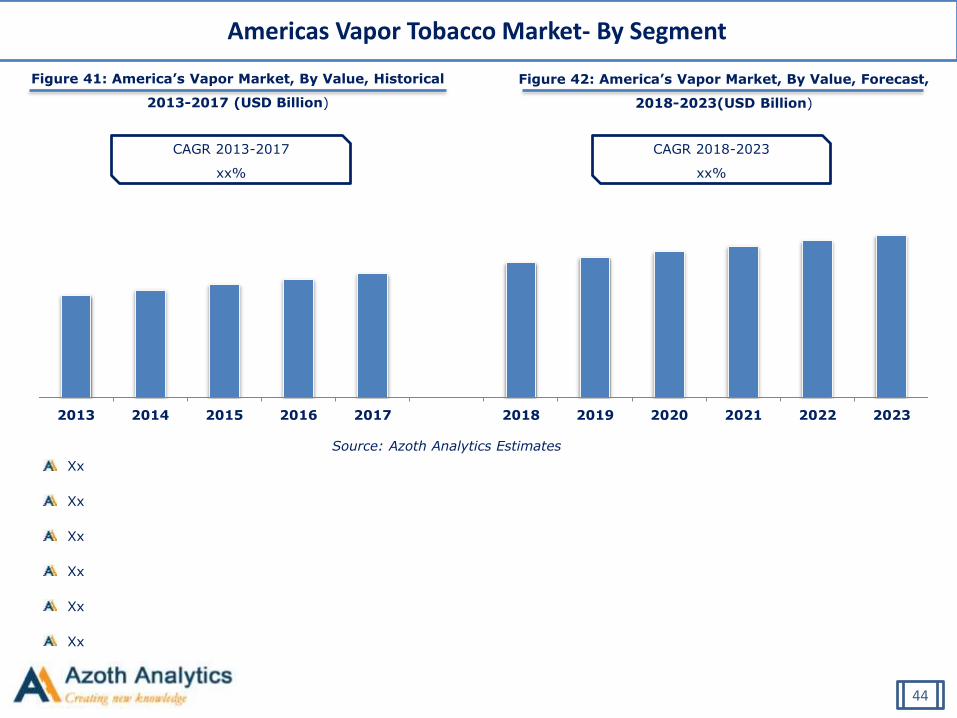
Figure 41: America’s Vapor Market, By Value, Historical
2013-2017 (USD Billion)
Source: Azoth Analytics Estimates
Figure 42: America’s Vapor Market, By Value, Forecast,
2018-2023(USD Billion)
Americas Vapor Tobacco Market- By Segment
44
CAGR 2013-2017
xx%
CAGR 2018-2023
xx%
2013 2014 2015 2016 2017 2018 2019 2020 2021 2022 2023
Xx
Xx
Xx
Xx
Xx
Xx
2013 2014 2015 2016 2017 2018 2019 2020 2021 2022 2023
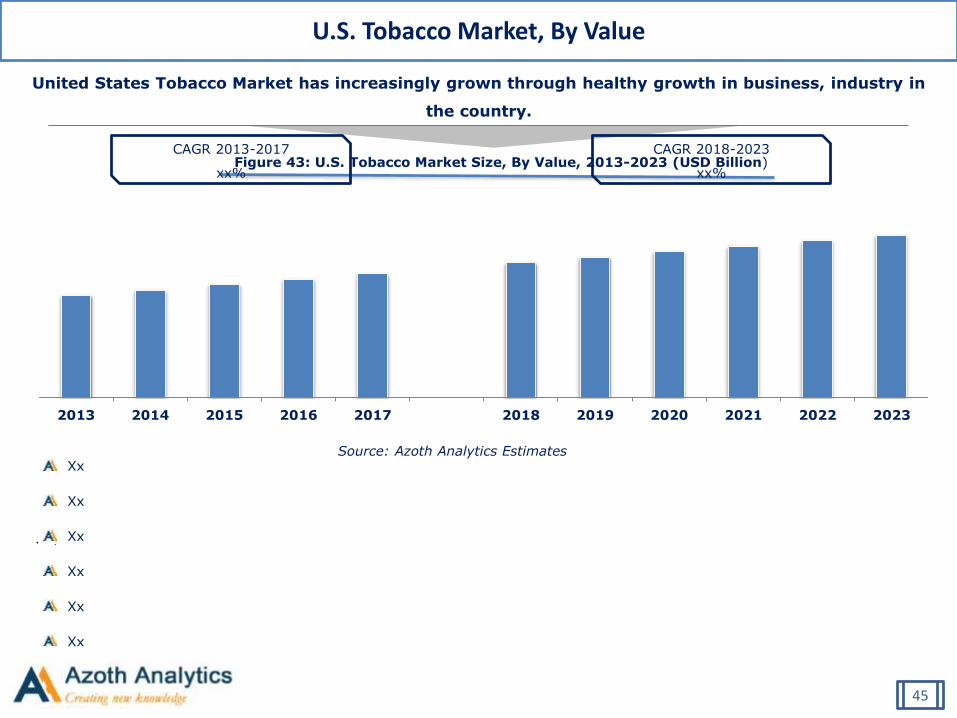
U.S. Tobacco Market, By Value
• .
Source: Azoth Analytics Estimates
United States Tobacco Market has increasingly grown through healthy growth in business, industry in
the country.
Figure 43: U.S. Tobacco Market Size, By Value, 2013-2023 (USD Billion)
45
CAGR 2013-2017
xx%
CAGR 2018-2023
xx%
Xx
Xx
Xx
Xx
Xx
Xx
Global Low Temperature Sterilization Market, By Value
• .
Figure 44: U.S. Cigarette Market, By Value, Historical,
2013-2017 (USD Billion)
Source: Azoth Analytics Estimates
Figure 45: U.S. Cigarette Market, By Value, Forecast,
2018-2023 (USD Billion)
U.S. Cigarette Market- By Segment
46
CAGR 2013-2017
xx%
CAGR 2018-2023
xx%
Xx
Xx
Xx
Xx
Xx
Xx
Xx
Xx
Xx
2013 2014 2015 2016 2017 2018 2019 2020 2021 2022 2023
Figure 46: US Smoking Tobacco Market, By Value,
Historical 2013-2017 (USD Billion)
Source: Azoth Analytics Estimates
Figure 47: US Smoking Tobacco Market, By Value,
Forecast, 2018-2023(USD Billion)
US Smoking Tobacco Market- By Segment
47
CAGR 2013-2017
xx%
CAGR 2018-2023
xx%
2013 2014 2015 2016 2017 2018 2019 2020 2021 2022 2023
Xx
Xx
Xx
Xx
Xx
Xx
Figure 48: US Cigar Market, By Value, Historical 2013-
2017 (USD Billion)
Source: Azoth Analytics Estimates
Figure 49: US Cigar Market, By Value, Forecast, 2018-
2023(USD Billion)
US Cigar Market- By Segment
48
CAGR 2013-2017
xx%
CAGR 2018-2023
xx%
Xx
Xx
Xx
Xx
Xx
Xx
Xx
Xx
Xx
2013 2014 2015 2016 2017 2018 2019 2020 2021 2022 2023
Figure 50: US Smokeless Tobacco Market, By Value,
Historical 2013-2017 (USD Billion)
Source: Azoth Analytics Estimates
Figure 51: US Smokeless Tobacco Market, By Value,
Forecast, 2018-2023(USD Billion)
US Smokeless Tobacco Market- By Segment
49
CAGR 2013-2017
xx%
CAGR 2018-2023
xx%
Xx
Xx
Xx
Xx
Xx
Xx
Xx
Xx
Xx
2013 2014 2015 2016 2017 2018 2019 2020 2021 2022 2023

Figure 52: US Vapor Market, By Value, Historical 2013-
2017 (USD Billion)
Source: Azoth Analytics Estimates
Figure 53: US Vapor Market, By Value, Forecast, 2018-
2023(USD Billion)
US Vapor Tobacco Market- By Segment
50
CAGR 2013-2017
xx%
CAGR 2018-2023
xx%
Xx
Xx
Xx
Xx
Xx
Xx
Xx
Xx
Xx
2013 2014 2015 2016 2017 2018 2019 2020 2021 2022 2023

(c) AZOTH Analytics
About Azoth Analytics Pvt Ltd.
Azoth Analytics (ISO 9001:2015) is a business research and analytics company that creates in-depth research reports and provides customized research
solutions and consulting services. An ISO 9001:2015 certified company, Azoth Analytics adheres to international quality management standard and has strong
commitment to a culture of continuous improvement. The business research and market analysis of Azoth Analytics helps organizations across different
industry verticals solve their business problems. Strategic market sizing and data dredging techniques include secondary research, and primary research
(interviews with management personnel and industry experts). Azoth Analytics provide syndicated and customized market research reports on different
verticals including pharmaceutical and healthcare, oil and gas and power, chemicals, automotive, technology, FMCG, food & beverages and media sectors.
51