Embed Size (px)
Citation preview

www.pwc.com/globaltechipo
Global TechnologyIPO ReviewQ3 2015
Technology Institute
A quarterly look at global trendsin the technology IPO marketOctober 2015
Global Technology IPO Review – Q3 2015 2
Table of contents
Global capital markets volatility leads to slowest technology IPO pace in five years* 3
Executive summary 4
Asia and Europe display resilience 5
Average proceeds rise but number of deals decline 6
Year-to-date 2015 reported 70 IPOs, surpassing the same period in 2011, 2012 and 2013 7
Geographic IPO trends – Q3 2015 8
United States 11
China 12
Europe 13
Japan 14
Stock exchange distribution – Q3 2015 15
Cross-border technology IPOs – Q3 2015 18
Subsector distribution – Q3 2015 19
Key financials – Q3 2015 20
Technology IPOs’ valuation metrics – Q3 2015 25
Top three subsectors – Q3 2015 27
Software 27
Internet Software & Services 271
Communications Equipment 35
Methodology 39
For more information 40
Global Technology IPO Review – Q3 2015 3
Global capital markets volatility leads to slowesttechnology IPO pace in five years*
Raman ChitkaraPartner and Global TechnologyIndustry LeaderPricewaterhouseCoopers [email protected]
Welcome to the third-quarter 2015 issue of PwC’s Global Technology IPO Review. Technology IPOs experienced a steepdecline in the third quarter, with just 11 offerings raising US$4.1 billion as compared to 18 offerings raising US$24.8 billionin the third quarter of 2014. The decline was due in large part to lackluster IPOs in the US and China – the traditionalincubators of technology IPOs – each of which produced only two IPOs during the quarter.
Historically the summer quarter is the slowest of the year, but this year with the regulatory suspension of IPOs on China’sShenzhen and Shanghai exchanges, ongoing market uncertainty and volatility in the global capital markets, the third quartersaw fewer IPOs than any other year since 2010 (except 2012 which also posted eleven offerings). Compared to the secondquarter of 2015, proceeds declined 34% and the number of offerings fell off 69%.
Europe and Asia contributed 82% to the number of listings and 96% of the total third-quarter proceeds. Asia led with sixIPOs raising US$2.3 billion, followed by Europe with three IPOs raising US$1.6 billion.
In spite of the tough IPO market, two companies were successful in raising over US$1 billion each in their IPOs.
Although the third quarter slowed significantly from prior quarters, the first nine months of 2015 surpassed the same periodin 2011, 2012 and 2013.
Please reach out to me or any member of our global technology team listed at the back of this document if you would like todiscuss how these findings may impact your business.
Sincerely,
* Issue size greater than US$40 million(includes overallotment) and based on tradedate
Global Technology IPO Review – Q3 2015 4
Executive summary
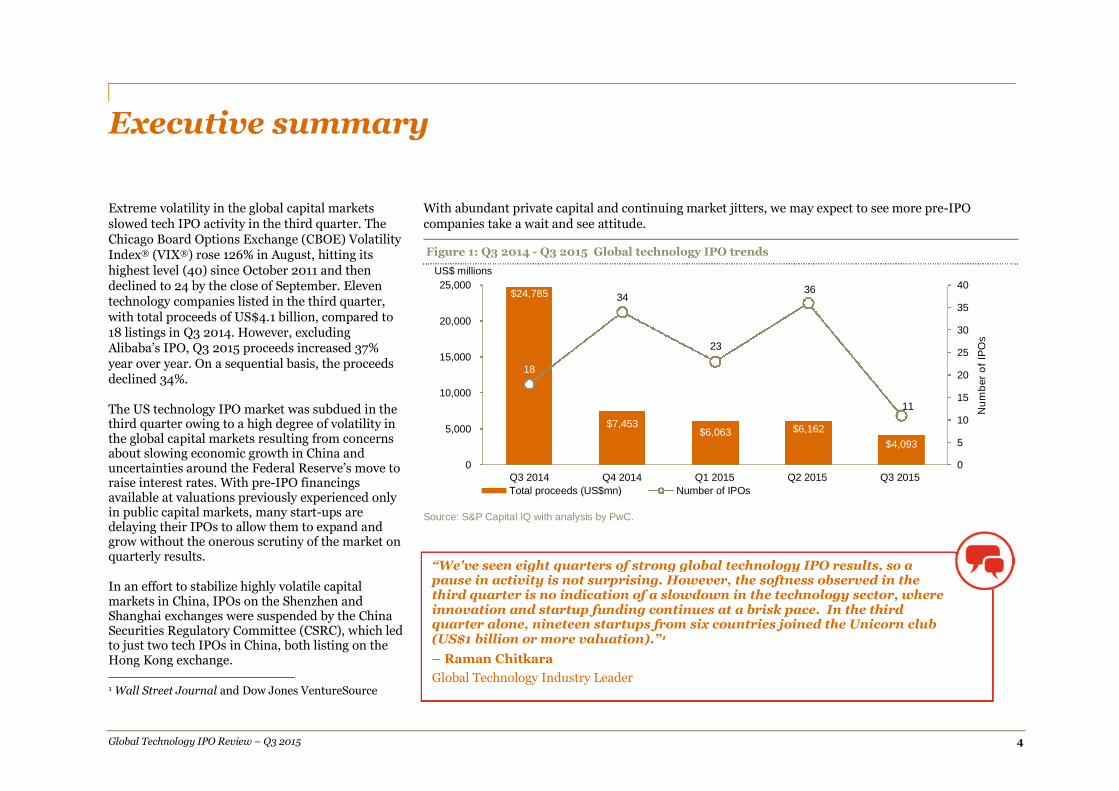
Extreme volatility in the global capital marketsslowed tech IPO activity in the third quarter. TheChicago Board Options Exchange (CBOE) VolatilityIndex® (VIX®) rose 126% in August, hitting itshighest level (40) since October 2011 and thendeclined to 24 by the close of September. Eleventechnology companies listed in the third quarter,with total proceeds of US$4.1 billion, compared to18 listings in Q3 2014. However, excludingAlibaba’s IPO, Q3 2015 proceeds increased 37%year over year. On a sequential basis, the proceedsdeclined 34%.
The US technology IPO market was subdued in thethird quarter owing to a high degree of volatility inthe global capital markets resulting from concernsabout slowing economic growth in China anduncertainties around the Federal Reserve’s move toraise interest rates. With pre-IPO financingsavailable at valuations previously experienced onlyin public capital markets, many start-ups aredelaying their IPOs to allow them to expand andgrow without the onerous scrutiny of the market onquarterly results.
In an effort to stabilize highly volatile capitalmarkets in China, IPOs on the Shenzhen andShanghai exchanges were suspended by the ChinaSecurities Regulatory Committee (CSRC), which ledto just two tech IPOs in China, both listing on theHong Kong exchange. 1
1 Wall Street Journal and Dow Jones VentureSource
With abundant private capital and continuing market jitters, we may expect to see more pre-IPOcompanies take a wait and see attitude.
Figure 1: Q3 2014 - Q3 2015 Global technology IPO trends
;s
Source: S&P Capital IQ with analysis by PwC.
“We've seen eight quarters of strong global technology IPO results, so apause in activity is not surprising. However, the softness observed in thethird quarter is no indication of a slowdown in the technology sector, whereinnovation and startup funding continues at a brisk pace. In the thirdquarter alone, nineteen startups from six countries joined the Unicorn club(US$1 billion or more valuation).”1
– Raman Chitkara
Global Technology Industry Leader
$24,785
$7,453$6,063 $6,162
$4,093
18
34
23
36
11
0
5
10
15
20
25
30
35
40
0
5,000
10,000
15,000
20,000
25,000
Q3 2014 Q4 2014 Q1 2015 Q2 2015 Q3 2015
Nu
mb
er
of
IPO
s
Total proceeds (US$mn) Number of IPOs
US$ millions

Global Technology IPO Review – Q3 2015 5
Asia and Europe display resilience
Asia and Europe contributed nine out of the elevenIPOs and 96% of the total proceeds in the thirdquarter. Asia contributed six IPOs, three of whichwere from Japan, totaling US$759 million inproceeds. A billion-dollar-plus IPO, China RailwaySignal & Communication Corporation Limited,listed on the Hong Kong stock exchange. Europehad three IPOs and the largest IPO of the quarter,Scout24 AG, a German company that raisedUS$1.5 billion dollars.
Figure 2: Q3 2015 Geographic distribution of technology IPOs
Source: S&P Capital IQ with analysis by PwC
$168
$2,298
$1,627
2
6
3
0
1
2
3
4
5
6
7
0
500
1,000
1,500
2,000
2,500
North America Asia Europe
Nu
mb
er
of
IPO
s
Total proceeds (US$mn) Number of deals
US$ millions
“Japan had a buoyant IPO market this quarter with three IPOs and proceeds of US$759 million. The Bank of Japan'sdecision to continue its asset purchase program has increased economic momentum as has the awarding of the 2020Olympics which is expected to increase inbound demand and improve Japan’s economy.”
– Masaru Koshida,
Market & Solutions IPO Solution Group Leader, PwC Japan

Global Technology IPO Review – Q3 2015 6
Average proceeds rise but number of deals decline
Average proceeds for Q3 2015 were US$372.1million, considerably higher than the prior fivequarters, excepting Q3 2014 when the US$21.8billion Alibaba IPO pushed average proceeds toUS$1,376.9.
The higher average proceeds this quarter were alsofavorably impacted by two US$1 billion-plus IPOs.
Figure 3: Q3 2015 global tech IPO trends
Source: S&P Capital IQ with analysis by PwC
$4,833
$1,572
$994$1,270
$24,785
$4,093
$372 $1,377$106 $90 $112 $186
26
14
1112
18
11
0
5
10
15
20
25
30
35
40
45
0
500
1,000
1,500
2,000
2,500
3,000
3,500
4,000
4,500
5,000
5,500
6,000
6,500
Q3 2010 Q3 2011 Q3 2012 Q3 2013 Q3 2014 Q3 2015
Nu
mb
er
of
IPO
s
Total proceeds (US$mn) Average proceeds (US$mn) Number of deals
US$ millions

Global Technology IPO Review – Q3 2015 7
Year-to-date 2015 reported 70 IPOs, surpassing the same period in 2011, 2012 and 2013
A total of 70 technology companies went public inthe first nine months of 2015, more than thenumber of IPOs in the full year of 2013 as well asnine-month totals for 2011 and 2012 too. The totalproceeds raised in the first nine months of 2015was US$16.3 billion, a 179% increase from the sameperiod in 2013.
Technology IPO results in 2014 were heavilyskewed by the third-quarter mega IPO of Alibaba(US$21.8 billion). Comparing nine months Q3 2015to nine months Q3 2014, the number of IPOs fell by17% and the proceeds declined by 63% in 2015.
Figure 4: Global technology IPO trends (9 months ended)
Source: S&P Capital IQ with analysis by PwC
$10,282
$21,811
$5,858
$43,740
$16,318
67
61
39
84
70
0
10
20
30
40
50
60
70
80
90
0
5,000
10,000
15,000
20,000
25,000
30,000
35,000
40,000
45,000
50,000
9 months 2011 9 months 2012 9 months 2013 9 months 2014 9 months 2015
Nu
mb
er
of
IPO
s
US$ millions
Total proceeds (US$mn) Number of deals
Global Technology IPO Review – Q3 2015 8
Geographic IPO trends – Q3 2015
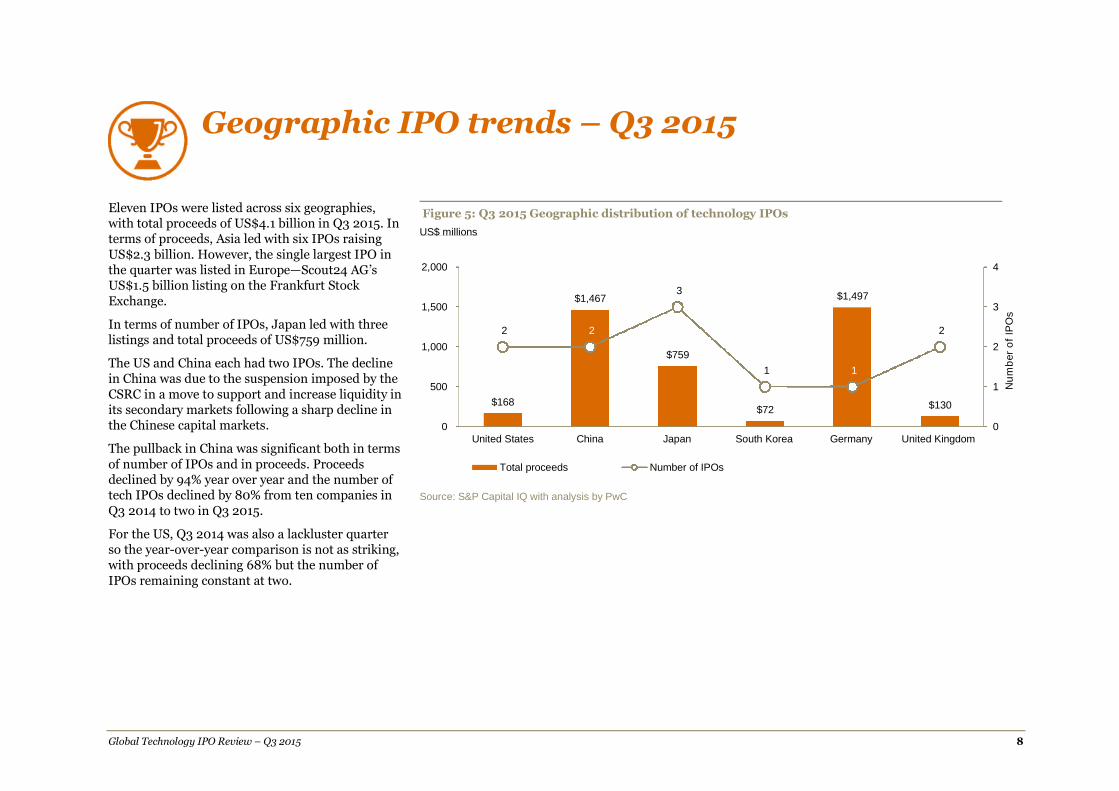
Eleven IPOs were listed across six geographies,with total proceeds of US$4.1 billion in Q3 2015. Interms of proceeds, Asia led with six IPOs raisingUS$2.3 billion. However, the single largest IPO inthe quarter was listed in Europe—Scout24 AG’sUS$1.5 billion listing on the Frankfurt StockExchange.
In terms of number of IPOs, Japan led with threelistings and total proceeds of US$759 million.
The US and China each had two IPOs. The declinein China was due to the suspension imposed by theCSRC in a move to support and increase liquidity inits secondary markets following a sharp decline inthe Chinese capital markets.
The pullback in China was significant both in termsof number of IPOs and in proceeds. Proceedsdeclined by 94% year over year and the number oftech IPOs declined by 80% from ten companies inQ3 2014 to two in Q3 2015.
For the US, Q3 2014 was also a lackluster quarterso the year-over-year comparison is not as striking,with proceeds declining 68% but the number ofIPOs remaining constant at two.
Figure 5: Q3 2015 Geographic distribution of technology IPOs
Source: S&P Capital IQ with analysis by PwC
$168
$1,467
$759
$72
$1,497
$130
2 2
3
1 1
2
0
1
2
3
4
0
500
1,000
1,500
2,000
United States China Japan South Korea Germany United Kingdom
Nu
mb
er
of
IPO
s
Total proceeds Number of IPOs
US$ millions
Global Technology IPO Review – Q3 2015 9
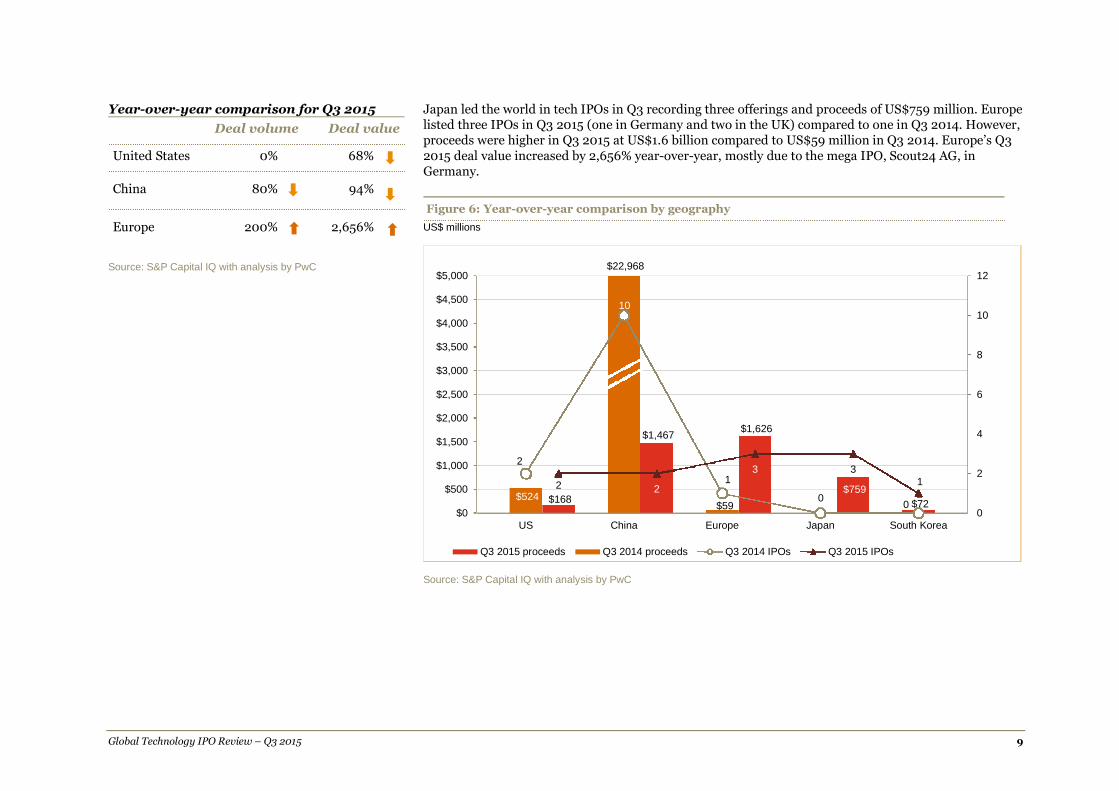
Year-over-year comparison for Q3 2015
Deal volume Deal value
United States 0% 68%
China 80% 94%
Europe 200% 2,656%
Source: S&P Capital IQ with analysis by PwC
Japan led the world in tech IPOs in Q3 recording three offerings and proceeds of US$759 million. Europelisted three IPOs in Q3 2015 (one in Germany and two in the UK) compared to one in Q3 2014. However,proceeds were higher in Q3 2015 at US$1.6 billion compared to US$59 million in Q3 2014. Europe’s Q32015 deal value increased by 2,656% year-over-year, mostly due to the mega IPO, Scout24 AG, inGermany.
Source: S&P Capital IQ with analysis by PwC
$524
$22,968
$59$168
$1,467$1,626
$759
$72
2
10
1
00
2 2
3 31
0
2
4
6
8
10
12
$0
$500
$1,000
$1,500
$2,000
$2,500
$3,000
$3,500
$4,000
$4,500
$5,000
US China Europe Japan South Korea
Q3 2015 proceeds Q3 2014 proceeds Q3 2014 IPOs Q3 2015 IPOs
Figure 6: Year-over-year comparison by geography
US$ millions

Global Technology IPO Review – Q3 2015 10
Regional comparison
Asia led in terms of proceeds with six IPOs raising US$2.3 billion. Europe came second with three IPOs and proceeds of US$1.6 billion. North America reportedthe sharpest decline quarter over quarter with US$168 million in proceeds and only two IPOs compared to US$3.0 billion in proceeds and 13 IPOs listed in Q22015. Choppy global markets and uncertainty over Fed rates led to a slow-down in the US IPO market. In addition, many tech companies, not only the Unicorns,are finding favorable private funding opportunities, reducing their motivation to go public. Further, in volatile market environments technology companies withonly revenue growth and no profitability are not as confident that they will generate demand and achieve a high valuation.
Figure 7: Q3 2015 regional analysis – Proceeds
Figure 8: Q3 2015 regional analysis – Number of listings
Source: S&P Capital IQ with analysis by PwC
2 1
12
3
9
4
20
14 5
14
0
13
5
18
02 3
6
00
5
10
15
20
25
North America Europe Asia RoW
Q3 2014 Q4 2014 Q1 2015 Q2 2015 Q3 2015
$524$59
$50$1,715
$2,192
$3,501
$1051$1,421
$3,014
$1,630 $0
3030
12711861
$168
$1,626$2,298
0
2,000
4,000
6,000
8,000
10,000
North America Europe Asia RoW
Q3 2014 Q4 2014 Q1 2015 Q2 2015 Q3 2015
$23,153
US$ millions
Number of IPOs

Global Technology IPO Review – Q3 2015 11
United States
The US recorded only two IPOs with total proceedsof US$168 million. The sharp 94% decline inproceeds and 82% drop in number of IPOs from Q22015 can be attributed to the high degree ofvolatility in the global capital markets that began inJune with concern over slowing economic growth inChina as well as the US Federal Reserve’s decisionto raise interest rates.
We have also observed significantly highervaluations from private financings and this has ledto companies delaying their IPO in order to scaleand expand globally without the bright light of WallStreet scrutinizing quarterly results.
In fact, in Q3 2015, the number of US start-upsvalued at over US$1 billion dollars (known asUnicorns) has increased by 40% over Q2 2015. 2
Furthermore, many tech companies have negativeEBITDA and earnings. In a stable market, listingsfor these companies would not be much of an issue,but with market volatility tech companies mustdemonstrate the ability to make money, not justshow revenue growth, before going public.2
2 Wall Street Journal and Dow Jones VentureSource
Figure 9: US technology IPO trends
Source: S&P Capital IQ with analysis by PwC
$524
$1,715$1,421
$2,765
$168
2
9
4
11
2
0
2
4
6
8
10
12
14
16
0
500
1,000
1,500
2,000
2,500
3,000
3,500
Q3 2014 Q4 2014 Q1 2015 Q2 2015 Q3 2015
Nu
mb
er
of
IPO
s
Total proceeds Number of IPOs
US$ millions
“The combination of recent market volatility along with global economicuncertainty, and a very favorable private funding universe, led to a significantslowdown in U.S. tech IPO activity in the third quarter. In the tech industry, withsubstantial access to venture capital funding, private companies are stayingprivate longer and focusing on building scale and market leadership. However,there’s still a healthy pipeline of tech companies looking to launch and those thatare prepared to go out when the IPO window is open will be best positioned forlong-term success.”
– Alan Jones
Deals Partner, PwC US

Global Technology IPO Review – Q3 2015 12
China
In Q3 2015, China listed two IPOs with proceeds ofUS$1.5 billion compared to 14 IPOs in the previousquarter. However, proceeds were up by 46% fromUS$1.02 billion in the second quarter to US$1.5billion this quarter due to a US$1.4 billion listing byChina Railway Signal & CommunicationCorporation, a communications equipmentprovider of control systems, and systemsintegration for railways in China.
Historically we’ve seen a limited number of billion-dollar-plus IPOs from China. The last two Chinesecompanies with billion dollar plus listings wereAlibaba in Q3 2014 and JD.com in Q2 2014.
Year over year, the number of IPOs and totalproceeds declined 80% and 94%, respectively. InQ3 2014, ten IPOs were listed for total proceeds ofUS$23.0 billion, while in Q3 2015 only twocompanies went public with US$1.5 billionin proceeds.
Given the CSRC suspension of IPOs on theShanghai and Shenzhen stock exchanges, it is notsurprising that the two IPOs from China listed onthe Hong Kong Stock Exchange. When Chineseexchanges were suspended in 2014 we observed aninflux of Chinese companies listing on USexchanges. At the time the development of E-business companies were at the mature stage.Given that the remaining private E-businesscompanies in China are small-scale, we expect themto list domestically.
Figure 10: Chinese technology IPO trends
Source: S&P Capital IQ with analysis by PwC
$22,968
$1,435 $1,055 $1,002 $1,467
1011
8
14
2
0
3
6
9
12
15
0
5,000
10,000
15,000
20,000
25,000
Q3 2014 Q4 2014 Q1 2015 Q2 2015 Q3 2015
Nu
mb
er
of
IPO
s
Total proceeds Number of IPOs
US$ millions
“Owing to the volatility of the global markets and the suspension of IPOs on theChinese domestic exchanges, the Chinese Technology IPO market slowed in thethird quarter of 2015. The tidal wave of Chinese offerings on US exchanges hasalso passed after the flood in 2014. However, we still remain optimistic aboutthe development of domestic exchanges in the long run, in view of the reform ofthe financial market in China that has put in place the new registration-basedsystem as well as the introduction of the new board of Strategic EmergingMarket on the Shanghai Stock Exchange ("SSE").”
– Jianbin Gao,
Technology Industry Leader, PwC China

Global Technology IPO Review – Q3 2015 13
Europe
Europe maintained a healthy level of activity,seeing three technology IPOs and US$1.6 billion inproceeds in Q3 2015.
Though Europe listed three IPOs compared to fiveIPOs in the previous quarter, the proceeds were28% higher at US$1.6 billion compared to US$1.3billion in Q2. Year over year, Q3 2015 was up2,656% from US$59 million in Q3 2014.
Germany issued the largest IPO for the quarter,Scout24 AG, with US$1.5 billion in proceeds. Therewere two other smaller IPOs in the UK with totalproceeds of US$129.7 million.
Figure 11: European technology IPO trends
Source: S&P Capital IQ with analysis by PwC
$59
$2,192
$3,014
$1,271
$1,626
1
4
5 5
3
0
2
4
6
8
0
500
1,000
1,500
2,000
2,500
3,000
3,500
4,000
4,500
Q3 2014 Q4 2014 Q1 2015 Q2 2015 Q3 2015
Nu
mb
er
of
IPO
s
Total proceeds Number of IPOs
US$ millions
"Despite market volatility, the successful IPO of Scout 24 gives us a sign that the recent pick -up in IPO activity in Germany islikely to continue. Megatrends, like Industry 4.0 and energy transformation, with strong support from government provide ahealthy basis for new technologies and start-ups.
–Werner Ballhaus,
Technology Industry Leader, PwC Germany
“The UK IPO market continues its momentum. Particularly pleasing is the diverse nature of those companies coming tomarket ranging from the larger, more mature PE-backed companies to those smaller companies commercializing theirinnovative technology.”
– Jass Sarai
Technology Industry Leader, PwC UK

Global Technology IPO Review – Q3 2015 14
Japan
Japan performed quite well in Q3, with three IPOsand proceeds of US$759.5 million as compared tojust one in each of the last three quarters and nonein Q3 2014. In fact, aggregate proceeds for theprior four quarters were US$457 million, far shortof the proceeds in this quarter.
Figure 12: Japanese technology IPO trends
Source: S&P Capital IQ with analysis by PwC
$328
$42$87
$759
01 1
1
3
0
2
4
6
8
10
12
0
100
200
300
400
500
600
700
800
900
1,000
Q3 2014 Q4 2014 Q1 2015 Q2 2015 Q3 2015
Nu
mb
er
of
IPO
s
Total proceeds Number of IPOs
US$ millions
Global Technology IPO Review – Q3 2015 15
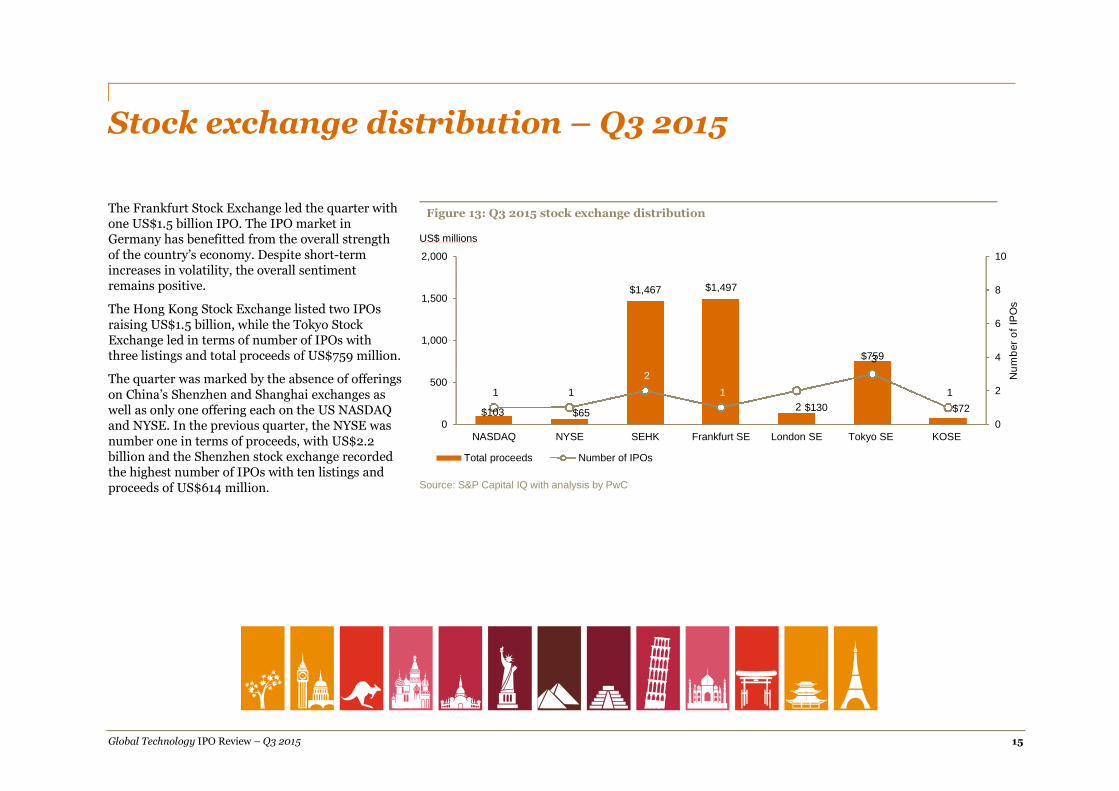
Stock exchange distribution – Q3 2015
The Frankfurt Stock Exchange led the quarter withone US$1.5 billion IPO. The IPO market inGermany has benefitted from the overall strengthof the country’s economy. Despite short-termincreases in volatility, the overall sentimentremains positive.
The Hong Kong Stock Exchange listed two IPOsraising US$1.5 billion, while the Tokyo StockExchange led in terms of number of IPOs withthree listings and total proceeds of US$759 million.
The quarter was marked by the absence of offeringson China’s Shenzhen and Shanghai exchanges aswell as only one offering each on the US NASDAQand NYSE. In the previous quarter, the NYSE wasnumber one in terms of proceeds, with US$2.2billion and the Shenzhen stock exchange recordedthe highest number of IPOs with ten listings andproceeds of US$614 million.
Figure 13: Q3 2015 stock exchange distribution
Source: S&P Capital IQ with analysis by PwC
$103 $65
$1,467 $1,497
$130
$759
$72
1 1
2
1
2
3
1
0
2
4
6
8
10
0
500
1,000
1,500
2,000
NASDAQ NYSE SEHK Frankfurt SE London SE Tokyo SE KOSE
Nu
mb
er
of
IPO
s
Total proceeds Number of IPOs
US$ millions

Global Technology IPO Review – Q3 2015 16
Table 1: Q3 2015 IPOs by region – North America (NASDAQ, NYSE)*
Issue date Company Subsector Proceeds(in US$ millions)
Primary exchange Domicile nation
07/16/2015 Rapid7 Inc Software 103.2 NASDAQ United States
07/16/2015 Ooma Inc Software 65.0 NYSE United States
*IPOs have been classified based on the exchange where capital was raised.
Source: S&P Capital IQ with analysis by PwC
Table 2: Q3 2015 IPOs by region – Asia including Australia
(Shanghai, Shenzhen, Tokyo Stock Exchange, Taiwan Stock Exchange, Hong Kong Stock Exchange, Australian Stock Exchange)*
Issue date Company Subsector Proceeds(in US$ millions)
Primary exchange Domicile nation
07/07/2015 China Railway Signal & CommunicationCorporation Limited
Communication Equipment 1,422.4 Stock Exchange of HongKong (SEHK)
China
07/07/2015 China Parenting Network Holdings Limited Internet Software and Services 44.8 Stock Exchange of HongKong (SEHK)
China
07/15/2015 Dexerials Corporation Electronic Components 639.3 Tokyo Stock Exchange Japan
07/29/2015 Itokuro Inc Internet Software and Services 45.5 Tokyo Stock Exchange Japan
08/17/2015 I Controls Inc Semiconductor 71.9 Korean Stock Exchange South Korea
08/27/2015 Metaps Inc Software 74.6 Tokyo Stock Exchange Japan
*IPOs have been classified based on the exchange where capital was raised.
Source: S&P Capital IQ with analysis by PwC

Global Technology IPO Review – Q3 2015 17
Table 3: Q3 2015 IPOs by region– Europe (London, Frankfurt SE, Warsaw SE, Nordic Exchange Stockholm)
Issue date Company Subsector Proceeds(in US$ millions)
Primary exchange Domicile nation
07/09/2015 Kainos Group Plc IT Consulting & Services 83.1 London SE United Kingdom
07/21/2015 Gloo Networks Plc Software 46.6 London SE United Kingdom
09/30/2015 Scout24 AG Internet Software and Services 1,496.6 Frankfurt SE Germany
*IPOs have been classified based on the exchange where capital was raised.
Source: S&P Capital IQ with analysis by PwC

Global Technology IPO Review – Q3 2015 18
Cross-border technology IPOs – Q3 2015
There were no cross-border listings in Q3 2015, which has only occurred once (in Q1 2013) in the past five years. Cross-border IPOs were more common in Q32014, where a third of the IPOs were cross-border listings. The decline in cross-border IPOs may be attributed to the recent volatility in the Chinese and USstock markets.
Figure 14: Cross-border IPOs
Source: S&P Capital IQ with analysis by PwC
63 3 4
12
31
20
32
11
0
5
10
15
20
25
30
35
40
Q3 2014 Q4 2014 Q1 2015 Q2 2015 Q3 2015
Nu
mb
er
of
IPO
s
Cross-border IPOs Domestic IPOs
33%
9%11%
13%
0%
Global Technology IPO Review – Q3 2015 19
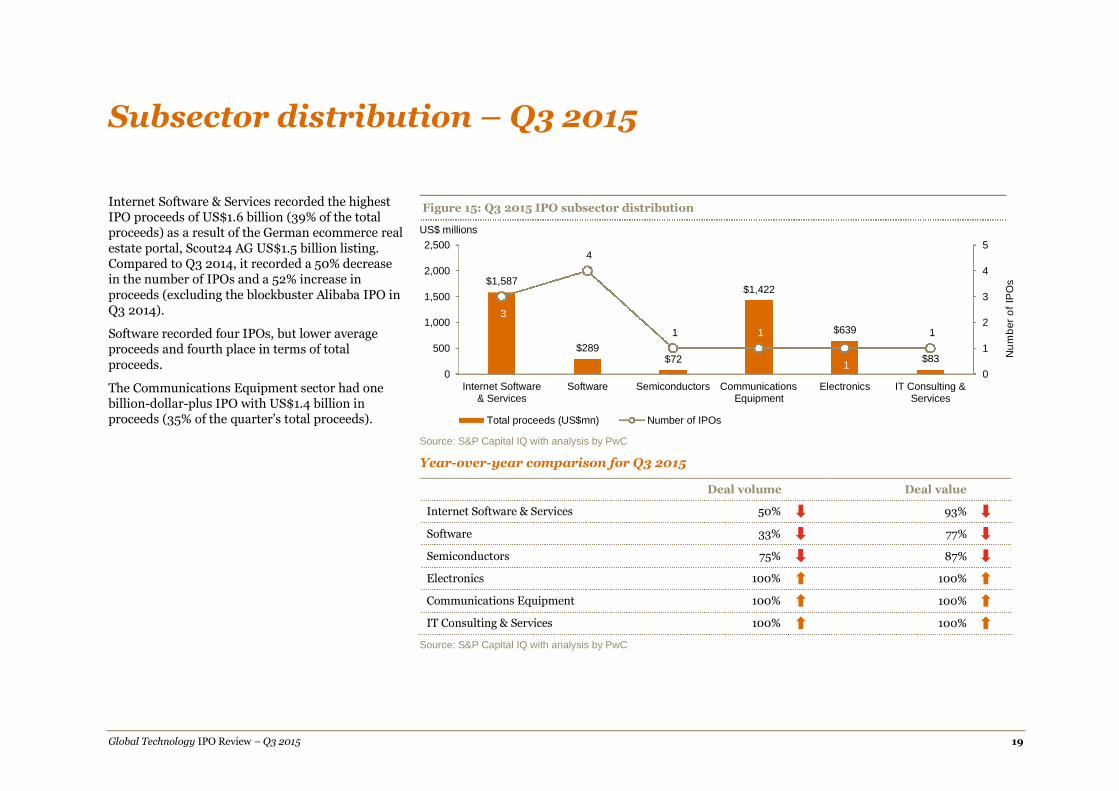
Subsector distribution – Q3 2015
Internet Software & Services recorded the highestIPO proceeds of US$1.6 billion (39% of the totalproceeds) as a result of the German ecommerce realestate portal, Scout24 AG US$1.5 billion listing.Compared to Q3 2014, it recorded a 50% decreasein the number of IPOs and a 52% increase inproceeds (excluding the blockbuster Alibaba IPO inQ3 2014).
Software recorded four IPOs, but lower averageproceeds and fourth place in terms of totalproceeds.
The Communications Equipment sector had onebillion-dollar-plus IPO with US$1.4 billion inproceeds (35% of the quarter’s total proceeds).
Figure 15: Q3 2015 IPO subsector distribution
Source: S&P Capital IQ with analysis by PwC
Year-over-year comparison for Q3 2015
Deal volume Deal value
Internet Software & Services 50% 93%
Software 33% 77%
Semiconductors 75% 87%
Electronics 100% 100%
Communications Equipment 100% 100%
IT Consulting & Services 100% 100%
Source: S&P Capital IQ with analysis by PwC
$1,587
$289$72
$1,422
$639
$83
3
4
1 1
1
1
0
1
2
3
4
5
0
500
1,000
1,500
2,000
2,500
Internet Software& Services
Software Semiconductors CommunicationsEquipment
Electronics IT Consulting &Services
Nu
mb
er
of
IPO
s
Total proceeds (US$mn) Number of IPOs
US$ millions

Global Technology IPO Review – Q3 2015 20
Key financials – Q3 2015
Figure 16: Global technology IPOs – Net income
Source: S&P Capital IQ with analysis by PwC
The number of technology IPOs in Q3 2015 decreased 69% quarter over quarter, seeing 11 deals comparedto 36 in Q2 2015. Year over year, the decline was 39% from 18 IPOs listed in Q3 2014.
Out of eleven tech IPOs in Q3 2015, 45% recorded net losses in the last twelve months; while in Q2 2015, outof total 36 IPOs, 43% recorded net losses. Software was the major contributor with all four listings recordingnet losses in the last twelve months.
57%
43%
Q2 2015
Positive net income
55%
45%
Q3 2015
Negative net income

Global Technology IPO Review – Q3 2015 21
Communications Equipment had the highestaverage LTM revenue, LTM EBITDA and LTM netincome at US$3.2 billion, US$390.3 million andUS$366.0 million, respectively. This subsectorentered the billion-dollar listing category after along time with the US$1.4 billion public issue ofChina Railway Signal & CommunicationCorporation Limited.
Electronics came second with average LTMrevenue, LTM EBITDA and LTM net income atUS$444.6 million, US$49.6 million and US$23.7million, respectively. Dexerials Corporation was theonly company listed in this subsector.
Internet Software & Services was at distant third,with US$142.8 million and US$44.3 million LTMrevenue and LTM EBITDA, respectively.
The average LTM debt levels were the highest forthe Internet Software & Services subsector atUS$235.3 million. Communications Equipmentwas a distant second with US$50.0 million in debt.All the other subsectors had average LTM debt lessthan US$20 million.
The average enterprise value for theCommunications Equipment and Internet Software& Services subsectors were US$6.8 billion andUS$1.6 billion, respectively, in Q3 2015. The twolarge IPOs, Scout24 AG (US$1.5 billion) in theInternet Software & Services subsector and ChinaRailway Signal & Communication CorporationLimited (US$1.4 billion) in the CommunicationsEquipment subsector, contributed to the rise inenterprise value.

Global Technology IPO Review – Q3 2015 22
Figure 17: Q3 2015 Average LTM revenue
Source: S&P Capital IQ with analysis by PwC
Figure 18: Q3 2015 Average LTM EBITDA
Source: S&P Capital IQ with analysis by PwC
$453
$3,244
$135$143 $92 $445 $64
11
1 1
3
1 1
4
0
2
4
6
8
10
12
0
500
1000
1500
2000
2500
3000
3500
All sectors CommunicationsEquipment
Semiconductors Internet Software &Services
IT Consulting & Services Electronics Software
Nu
mb
er
of
IPO
s
US$ millions
LTM revenue Number of IPOs
$65
$390
$10$44
$19$50
-$17
11
1 1
31 1
4
-8
-6
-4
-2
0
2
4
6
8
10
12
-50
0
50
100
150
200
250
300
350
400
450
All sectors CommunicationsEquipment
Semiconductors Internet Software &Services
IT Consulting & Services Electronics Software
Nu
mb
er
of
IPO
s
US$ millions
LTM EBITDA Number of IPOs

Global Technology IPO Review – Q3 2015 23
Figure 19: Q3 2015 Average LTM net income
Source: S&P Capital IQ with analysis by PwC
Figure 20: Q3 2015 Average total debt
Source: S&P Capital IQ with analysis by PwC
$35
$366
$9
-$7
$15 $24
-$13
11
1 1
3
1 14
-6
-4
-2
0
2
4
6
8
10
12
(50)
0
50
100
150
200
250
300
350
400
All sectors CommunicationsEquipment
Semiconductors Internet Software &Services
IT Consulting & Services Electronics Software
Nu
mb
er
of
IPO
s
US$ millions
LTM net income Number of IPOs
$73$50
$17
$235
$-$11 $6
11
1 1
3
1 1
4
0
2
4
6
8
10
12
0
50
100
150
200
250
All sectors CommunicationsEquipment
Semiconductors Internet Software &Services
IT Consulting & Services Electronics Software
Nu
mb
er
of
IPO
s
US$ millions
LTM debt Number of IPOs

Global Technology IPO Review – Q3 2015 24
Figure 21: Q3 2015 Average enterprise value
Source: S&P Capital IQ with analysis by PwC
$1,351
$6,796
$263$1,569
$346 $351
11
1 1
3
1 1
4
0
2
4
6
8
10
12
0
1,000
2,000
3,000
4,000
5,000
6,000
7,000
8,000
All sectors CommunicationsEquipment
Semiconductors Internet Software &Services
IT Consulting & Services Electronics Software
Nu
mb
er
of
IPO
s
US$ millions
Enterprise value Number of IPOs

Global Technology IPO Review – Q3 2015 25
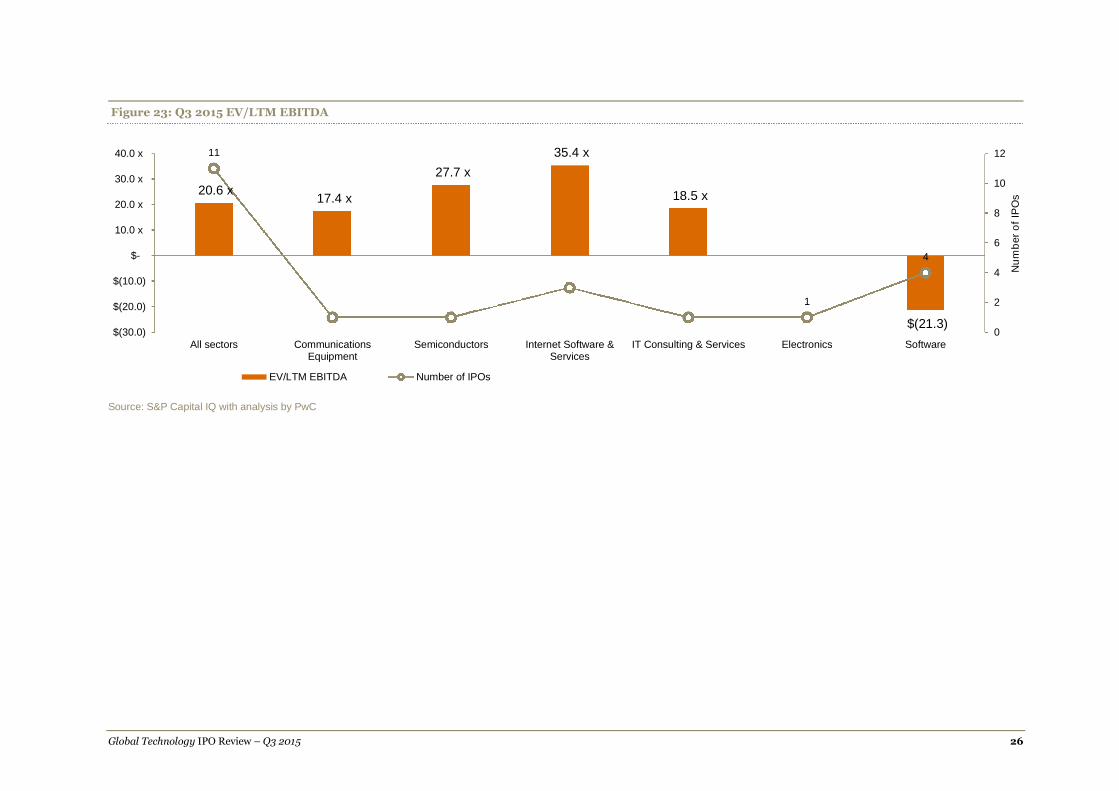
Technology IPOs’ valuation metrics – Q3 2015
The technology industry usually has a higher valuation compared to other industries. However, the valuation in Q3 2015 was rather low, reflecting the subduedsentiment in the market as well as rational investor behavior. The EV/LTM revenue multiple of this sector was 3.0x in Q3 2015 compared to 5.5x in the lastquarter. This is attributed to significant price corrections in major markets such as China and the US. Also, technology companies were significantly overvaluedin the previous few quarters.
China Parenting Network Holdings Limited, listed on the Hong Kong Stock Exchange, recorded the highest EV/LTM revenue multiple of 25.7x, in Q3 2015.Even this multiple is significantly lower than Xun You Network Technology Co Ltd.’s 52.6x multiple in Q2 2015.
Internet Software & Services had the highest EV/LTM revenue multiple of 11.0x, followed by Software with 8.1x and IT Consulting & Services with 3.8x. InternetSoftware & Services reported the highest EV/EBITDA multiple of 35.4x in Q3 2015 compared to 112.9x in Q2. Semiconductors’ EV/EBITDA multiple, at 27.7x,was lower than the 112.5x of the previous quarter.
Figure 22: Q3 2015 EV/LTM revenue
Source: S&P Capital IQ with analysis by PwC
3.0 x2.1 x 2.0 x
11.0 x
3.8 x
5.5 x
11
1 1
3
2 1
4
0
2
4
6
8
10
12
$-
2.0 x
4.0 x
6.0 x
8.0 x
10.0 x
12.0 x
All sectors CommunicationsEquipment
Semiconductors Internet Software &Services
IT Consulting & Services Electronics Software
Nu
mb
er
of
IPO
s
EV/LTM revenue Number of IPOs
Global Technology IPO Review – Q3 2015 26
Figure 23: Q3 2015 EV/LTM EBITDA
Source: S&P Capital IQ with analysis by PwC
20.6 x17.4 x
27.7 x
35.4 x
18.5 x
$(21.3)
11
1 1
3
2 1
4
0
2
4
6
8
10
12
$(30.0)
$(20.0)
$(10.0)
$-
10.0 x
20.0 x
30.0 x
40.0 x
All sectors CommunicationsEquipment
Semiconductors Internet Software &Services
IT Consulting & Services Electronics Software
Nu
mb
er
of
IPO
s
EV/LTM EBITDA Number of IPOs

Global Technology IPO Review – Q3 2015 27
Top three subsectors – Q3 2015
SoftwareThe Software subsector had four IPOs in Q3 2015, a 33% decline for both year over year and quarter over quarter. Q3 2014 and Q2 2015 had six IPOs each.
The average LTM revenue was US$63.5 million, a 76% decline from last quarter and a 31% decline year over year. For the first time in the last seven quarters,average LTM EBITDA was negative US$16.5 million.
Software did not report any big-ticket IPOs this quarter. The highest offering was US$103.2 million by Rapid7, Inc, one of the two US tech listing in Q3 2015.
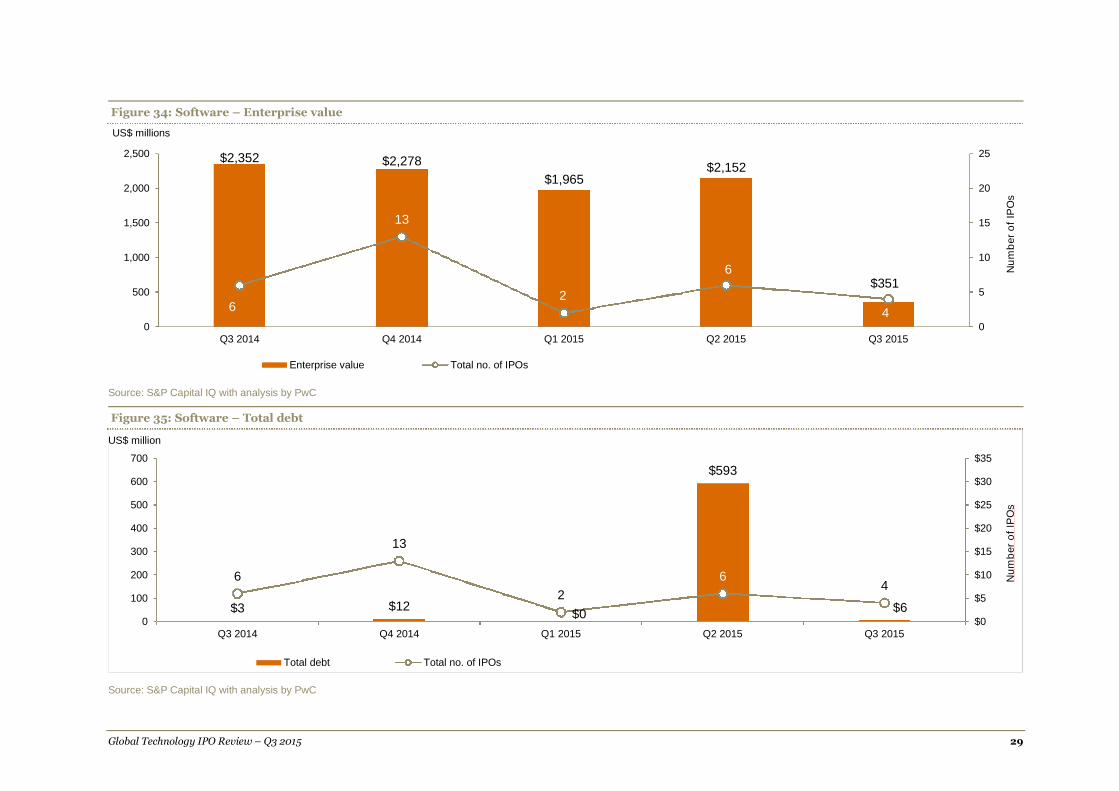
In terms of valuation, average EV was at US$350.8 million, which was 84% lower than Q2 2015 and 85% lower than Q3 2014. The average EV/LTM revenuemultiple was 5.5x. The revenue multiple was both below the high point of 25.5x in Q3 2014 and 8.2x reported in Q2 2015.
Figure 31: Software – LTM revenue
Source: S&P Capital IQ with analysis by PwC
$92
$664
$185
$263
$64
6
13
2
6
40
5
10
15
20
25
30
35
0
100
200
300
400
500
600
700
Q3 2014 Q4 2014 Q1 2015 Q2 2015 Q3 2015
Nu
mb
er
of
IPO
s
US$ millions
LTM revenue Total no. of IPOs

Global Technology IPO Review – Q3 2015 28
Figure 32: Software – LTM EBITDA
Source: S&P Capital IQ with analysis by PwC
Figure 33: Software – LTM net income
Source: S&P Capital IQ with analysis by PwC
$9
$64
$36
$71
$176
13
2
6
4
-3
0
3
6
9
12
15
-40
-20
0
20
40
60
80
Q3 2014 Q4 2014 Q1 2015 Q2 2015 Q3 2015
Nu
mb
er
of
IPO
s
US$ millions
LTM EBITDA Total no. of IPOs
$5$10
$34
-$29
-$13
6
13
2
64
-16
-12
-8
-4
0
4
8
12
16
-40
-30
-20
-10
0
10
20
30
40
Q3 2014 Q4 2014 Q1 2015 Q2 2015 Q3 2015
Nu
mb
er
of
IPO
s
US$ millions
LTM net income Total no. of IPOs
Global Technology IPO Review – Q3 2015 29
Figure 34: Software – Enterprise value
Source: S&P Capital IQ with analysis by PwC
Figure 35: Software – Total debt
Source: S&P Capital IQ with analysis by PwC
$2,352 $2,278
$1,965$2,152
$351
6
13
2
6
40
5
10
15
20
25
0
500
1,000
1,500
2,000
2,500
Q3 2014 Q4 2014 Q1 2015 Q2 2015 Q3 2015
Nu
mb
er
of
IPO
s
US$ millions
Enterprise value Total no. of IPOs
$3 $12$0
$593
$6
6
13
2
64
$0
$5
$10
$15
$20
$25
$30
$35
0
100
200
300
400
500
600
700
Q3 2014 Q4 2014 Q1 2015 Q2 2015 Q3 2015
Total debt Total no. of IPOs
US$ million
Nu
mb
er
of
IPO
s

Global Technology IPO Review– Q1 15 30
Figure 36: Software – EV/LTM revenue
Source: S&P Capital IQ with analysis by PwC
Figure 37: Software – EV/LTM EBITDA
Source: S&P Capital IQ with analysis by PwC
25.5 x
3.4 x
10.6 x8.2 x
5.5 x
6
13
2
6
4
0
2
4
6
8
10
12
14
0.00x
5.00x
10.00x
15.00x
20.00x
25.00x
30.00x
Q3 2014 Q4 2014 Q1 2015 Q2 2015 Q3 2015
EV/LTM revenue Total no. of IPOs
Nu
mb
er
of
IPO
s
258.0 x
35.8 x54.5 x
30.2 x
6
13
2
64
0
5
10
15
20
25
30
0.00x
50.00x
100.00x
150.00x
200.00x
250.00x
300.00x
Q3 2014 Q4 2014 Q1 2015 Q2 2015 Q3 2015
Nu
mb
er
of
IPO
s
EV/LTM EBITDA Total no. of IPOs
Global Technology IPO Review– Q1 15 31
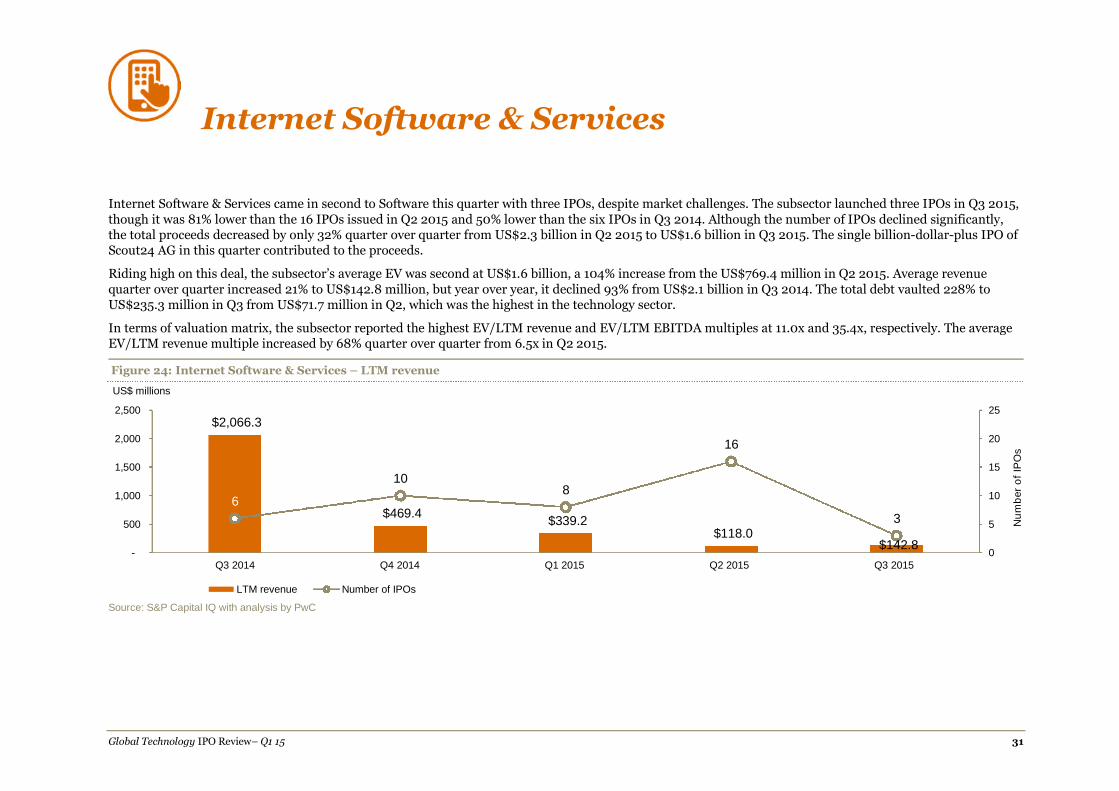
Internet Software & Services
Internet Software & Services came in second to Software this quarter with three IPOs, despite market challenges. The subsector launched three IPOs in Q3 2015,though it was 81% lower than the 16 IPOs issued in Q2 2015 and 50% lower than the six IPOs in Q3 2014. Although the number of IPOs declined significantly,the total proceeds decreased by only 32% quarter over quarter from US$2.3 billion in Q2 2015 to US$1.6 billion in Q3 2015. The single billion-dollar-plus IPO ofScout24 AG in this quarter contributed to the proceeds.
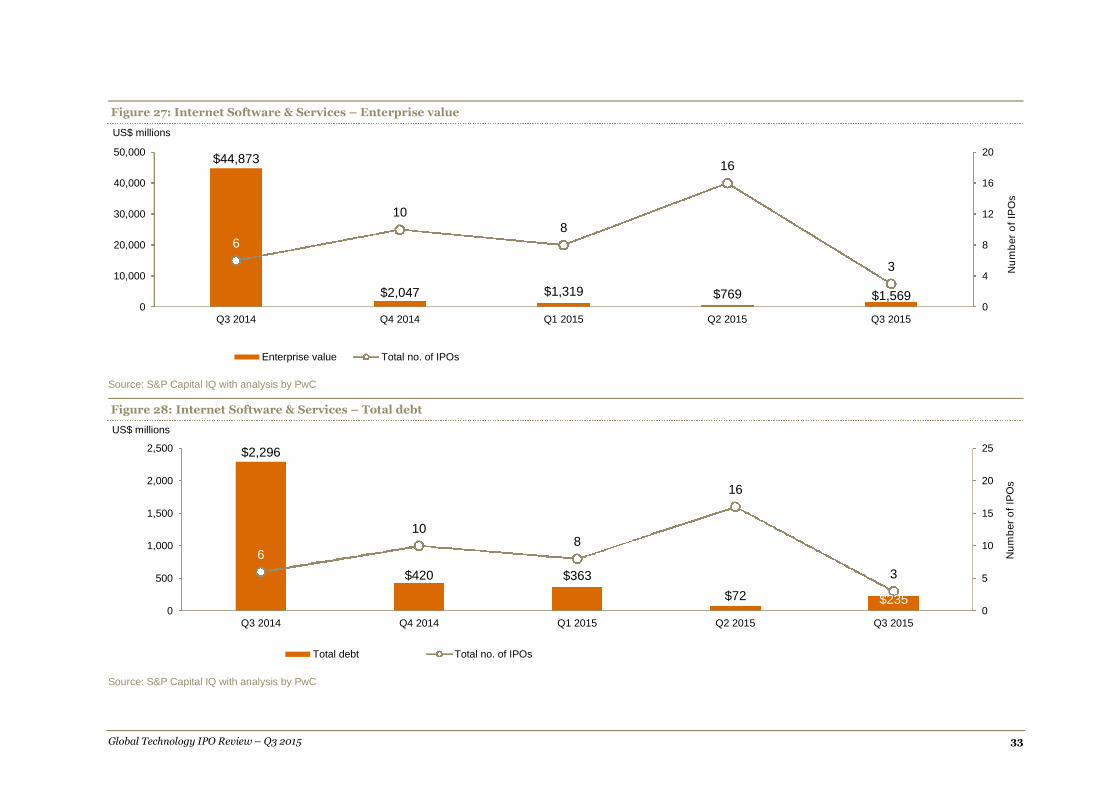
Riding high on this deal, the subsector’s average EV was second at US$1.6 billion, a 104% increase from the US$769.4 million in Q2 2015. Average revenuequarter over quarter increased 21% to US$142.8 million, but year over year, it declined 93% from US$2.1 billion in Q3 2014. The total debt vaulted 228% toUS$235.3 million in Q3 from US$71.7 million in Q2, which was the highest in the technology sector.
In terms of valuation matrix, the subsector reported the highest EV/LTM revenue and EV/LTM EBITDA multiples at 11.0x and 35.4x, respectively. The averageEV/LTM revenue multiple increased by 68% quarter over quarter from 6.5x in Q2 2015.
Figure 24: Internet Software & Services – LTM revenue
Source: S&P Capital IQ with analysis by PwC
$2,066.3
$469.4$339.2
$118.0$142.8
6
108
16
3
0
5
10
15
20
25
-
500
1,000
1,500
2,000
2,500
Q3 2014 Q4 2014 Q1 2015 Q2 2015 Q3 2015
Nu
mb
er
of
IPO
s
US$ millions
LTM revenue Number of IPOs

Global Technology IPO Review – Q3 2015 32
Figure 25: Internet Software & Services – LTM EBITDA
Source: S&P Capital IQ with analysis by PwC
Figure 26: Internet Software & Services – LTM net income
Source: S&P Capital IQ with analysis by PwC
$896
-$7
$34
-$3
$44
6
10
8
16
3
0
2
4
6
8
10
12
14
16
18
-200
0
200
400
600
800
1,000
Q3 2014 Q4 2014 Q1 2015 Q2 2015 Q3 2015
Nu
mb
er
of
IPO
s
US$ millions
LTM EBITDA Total no. of IPOs
$828
-$1
-$19
-$20 -$7
6
10
10
16
3
0
4
8
12
16
20
-100
0
100
200
300
400
500
600
700
800
900
Q3 2014 Q4 2014 Q1 2015 Q2 2015 Q3 2015
Nu
mb
er
of
IPO
s
US$ millions
LTM net Income Total no. of IPOs
Global Technology IPO Review – Q3 2015 33
Figure 27: Internet Software & Services – Enterprise value
Source: S&P Capital IQ with analysis by PwC
Figure 28: Internet Software & Services – Total debt
Source: S&P Capital IQ with analysis by PwC
$44,873
$2,047 $1,319 $769 $1,569
6
108
16
3
0
4
8
12
16
20
0
10,000
20,000
30,000
40,000
50,000
Q3 2014 Q4 2014 Q1 2015 Q2 2015 Q3 2015
Nu
mb
er
of
IPO
s
US$ millions
Enterprise value Total no. of IPOs
$2,296
$420 $363
$72 $235
6
108
16
3
0
5
10
15
20
25
0
500
1,000
1,500
2,000
2,500
Q3 2014 Q4 2014 Q1 2015 Q2 2015 Q3 2015
Nu
mb
er
of
IPO
s
US$ millions
Total debt Total no. of IPOs

Global Technology IPO Review – Q3 2015 34
Figure 29: Internet Software & Services – EV/LTM revenue
Source: S&P Capital IQ with analysis by PwC
Figure 30: Internet Software & Services – EV/LTM EBITDA
Source: S&P Capital IQ with analysis by PwC
21.7 x
4.4 x 3.9 x
6.5 x
11.0 x
6
108
16
3
0
5
10
15
20
25
$-
5.0 x
10.0 x
15.0 x
20.0 x
25.0 x
Q3 2014 Q4 2014 Q1 2015 Q2 2015 Q3 2015
EV/LTM revenue Total no. of IPOs
US$ millions
Nu
mb
er
of
IPO
s
50.1 x
38.5 x35.4 x
6
108
16
3
0
6
12
18
24
30
36
$-
10.0 x
20.0 x
30.0 x
40.0 x
50.0 x
60.0 x
Q3 2014 Q4 2014 Q1 2015 Q2 2015 Q3 2015
EV/LTM EBITDA Total no. of IPOs
Nu
mb
er
of
IPO
s

Global Technology IPO Review – Q3 2015 35
Communications Equipment
Communications Equipment, along withSemiconductors, IT Consulting & Services and theElectronics subsectors, issued one IPO each.However, Communications Equipment had abillion-dollar-plus listing of China Railway Signal& Communication Corporation Limited withUS$1.4 billion.
The IPO resulted in high LTM revenue and LTMEBITDA of US$3.2 billion and US$390.3 million,respectively.
The EV/LTM revenue multiple for the subsectorwas 2.1x, which was the second lowest of all thesubsectors. It also recorded the quarter’s lowestEV/LTM EBITDA multiple of 17.4x.
Figure 38: Communications Equipment – LTM revenue
Source: S&P Capital IQ with analysis by PwC
$562
$423
$0
$3,244
3
2
0
1
0
1
2
3
4
5
6
0
500
1000
1500
2000
2500
3000
3500
Q3 2014 Q4 2014 Q1 2015 Q2 2015 Q3 2015
Nu
mb
er
of
IPO
s
US$ millions
LTM revenue Total no. of IPOs

Global Technology IPO Review – Q3 2015 36
Figure 39: Communications Equipment – LTM EBITDA
Source: S&P Capital IQ with analysis by PwC
Figure 40: Communications Equipment – LTM net income
$66.90$26.80
$390.30
0
3
2
0
1
0
1
2
3
4
5
0
50
100
150
200
250
300
350
400
450
Q3 2014 Q4 2014 Q1 2015 Q2 2015 Q3 2015
LTM EBITDA Total no. of IPOs
US$ millions
Nu
mb
er
of
IPO
s
$41.55 $21
$366.00
3
2
1
0
1
2
3
4
5
$0.00
$50.00
$100.00
$150.00
$200.00
$250.00
$300.00
$350.00
$400.00
Q3 2014 Q4 2014 Q1 2015 Q2 2015 Q3 2015LTM net income Total no. of IPOs
US$ millions
Nu
mb
er
of
IPO
s
Source: S&P Capital IQ with analysis by PwC

Global Technology IPO Review – Q3 2015 37
Source: S&P Capital IQ with analysis by PwC
Figure 42: Communications Equipment – Total debt
Source: S&P Capital IQ with analysis by PwC
$557.80$1,104.25
$6,796.10
0
3
2
0
1
0
1
2
3
4
5
0
1000
2000
3000
4000
5000
6000
7000
8000
Q3 2014 Q4 2014 Q1 2015 Q2 2015 Q3 2015
Enterprise value Total no. of IPOs
US$ millions
Nu
mb
er
of
IPO
s
$173.25
$43.00$50.00
3
2
0
1
0
1
2
3
4
5
0
100
200
300
400
500
Q3 2014 Q4 2014 Q1 2015 Q2 2015 Q3 2015
Total debt Total no. of IPOs
US$ millions
Nu
mb
er
of
IPO
s
Figure 41: Communications Equipment – Enterprise value

Global Technology IPO Review – Q3 2015 38
Figure 43: Communications Equipment – EV/LTM revenue
Source: S&P Capital IQ with analysis by PwC
Figure 44: Communications Equipment – EV/LTM EBITDA
Source: S&P Capital IQ with analysis by PwC
1.0 x
2.6 x
2.1 x
0
3
2
0
1
0
1
2
3
4
5
6
7
0.00x
0.50x
1.00x
1.50x
2.00x
2.50x
3.00x
Q3 2014 Q4 2014 Q1 2015 Q2 2015 Q3 2015
EV/LTM revenue Total no. of IPOs
Nu
mb
er
of
IPO
s
8.3 x
41.2 x
17.4 x
0
3
2
0
1
0
1
2
3
4
5
6
7
0.00x
5.00x
10.00x
15.00x
20.00x
25.00x
30.00x
35.00x
40.00x
45.00x
Q3 2014 Q4 2014 Q1 2015 Q2 2015 Q3 2015
EV/LTM EBITDA Total no. of IPOs
Nu
mb
er
of
IPO
s

Global Technology IPO Review – Q3 2015 39
Methodology
The Global Technology IPO Review for Q3 2015 is based on PwC’s analysis of transaction data extracted from S&P Capital IQ. The analysis considers IPOsacross all countries worldwide during the period 1 July 2015 to 30 September 2015 (Q3). Financial data was also obtained from S&P Capital IQ.
The definition of the Technology sector is based on the S&P Capital IQ database industry classifications and includes the following subsectors:
Internet Software & Services
IT Consulting & Services
Professional Services (e.g., Application Software, Software Solutions)
Semiconductors
Software
Computers & Peripherals
– Computers, Computers Peripheral Equipment– Computers, Storage Device Manufacturing
Electronic Computers Manufacturing
Communications Equipment
Only IPOs with issue size greater than US$40 million were included in the analysis.
All monetary amounts are in US dollars unless otherwise indicated.
LTM – Last twelve months
Figures are rounded to one decimal.
Global Technology IPO Review – Q3 2015 40
For more information
If you would like to discuss how these findings might impact your business or your future strategy, please reach out to any of our technology industry leaderslisted below.
Raman ChitkaraGlobal Technology LeaderPhone: 1 408 817 3746Email: [email protected]
Rod Dring – AustraliaPhone: 61 2 8266 7865Email: [email protected]
Estela Vieira – BrazilPhone: 55 1 3674 3802Email: [email protected]
Christopher Dulny – CanadaPhone: 1 416 869 2355Email: [email protected]
Jianbin Gao – ChinaPhone: 86 21 2323 3362Email: [email protected]
Pierre Marty – FrancePhone: 33 1 5657 58 15Email: [email protected]
Werner Ballhaus – GermanyPhone: 49 211 981 5848Email: [email protected]
Sandeep Ladda – IndiaPhone: 91 22 6689 1444Email: [email protected]
Masahiro Ozaki– JapanPhone: 81 3 5326 9090Email: [email protected]
Hoonsoo Yoon – KoreaPhone: 82 2 709 0201Email: [email protected]
Ilja Linnemeijer – The NetherlandsPhone: 31 88 792 4956Email: [email protected]
Yury Pukha – RussiaPhone: 7 495 223 5177Email: [email protected]
Mark Jansen – SingaporePhone: 65 6236 7388Email: [email protected]
Philip Shepherd – UAEPhone: 97 1 43043501Email: [email protected]
Jass Sarai – UKPhone: 44 0 1895 52 2206Email: [email protected]
Pierre-Alain Sur – USPhone: 1 646 471 6973Email: [email protected]
Alan Jones – US (Deals Partner)Phone: 1 415 498 7398Email: [email protected]
Global Technology IPO Review – Q3 2015 41
www.pwc.com
© 2015 PwC. All rights reserved. PwC refers to the PwC network and/or one or more of its member firms, each of which is a separate legal entity. Please see http://www.pwc.com/structure for further details. This content is forgeneral information purposes only, and should not be used as a substitute for consultation with professional advisors.
About PwC’s Technology Institute
The Technology Institute is PwC’s global research network that studies the business of technology and the technology of business with the purpose of creatingthought leadership that offers both fact-based analysis and experience-based perspectives. Technology Institute insights and viewpoints originate from activecollaboration between our professionals across the globe and their first-hand experiences working in and with the technology industry.
About PwC
PwC firms help organisations and individuals create the value they’re looking for. We’re a network of firms in 157 countries with more than 195,000 people whoare committed to delivering quality in assurance, tax and advisory services. Tell us what matters to you and find out more by visiting us at www.pwc.com/