Embed Size (px)
Citation preview

GLOBALSYNDICATEDLOANSLEAGUE TABLES
1st 3Qtrs 2014

CONTENTS
1. Global market review
2. U.S. market review
3. Canada market review
4. Latin America market review
5. EMEA market review
6. Asia market review
7. Table criteria
DATA SUBMISSIONS AND QUERIES
Contact Phone Email
North America Paul Bandong +1 609 279 5187 [email protected]
Latin America Olov Widen +55 11 2395 9122 [email protected]
Europe Charlotte Howell +44 20 7330 7326 [email protected]
Africa Robyn Smith +27 21 818 0042 [email protected]
Asia Pacific Hung Truong +65 6212 1326 [email protected]
Bloomberg’s global syndicated loans database consists of more than 54,000 active loan tranches (and approximately 160,000 replaced or retired loans), covering nearly 40,000 unique borrowers across more than 200 countries and 100 different currencies.
LEAG<GO> for a full range of league tables
NI LEAG CRL<GO> or www.bloomberg.com for a full range of market-specific league
table publications
LOAN<GO> for Bloomberg’s syndicated loans product
Due to the dynamic nature of the Professional Service product, league table rankings may vary between this release and data found on the Bloomberg Professional Service.
1st 3Qtrs 2014
MANAGER RANKINGS
GLOBAL SYNDICATED LOANS
© 2014 Bloomberg Finance L.P. All rights reserved.

Glo
bal
Loa
ns R
evie
w |
1st
3Q
20
14
GLOBAL LOANS VOLUME
Global Loans Review
USD 1 - 300 Mln
USD 301 - 600 Mln
USD 601 - 1,000 Mln
USD 1,001 - 2,000 Mln
USD 2,001 - 4,000 Mln
USD 4,001 - 8,000 Mln
USD 8,001 - 16,000 Mln
USD 16,001 - 32,000 Mln
USD 32,001- 64,000 Mln
USD 64,000 Mln -
U.S. LOANSUSD 1,371.6 billion (-11.9%)
1. JP Morgan 16.8%2. BAML 15.2%3. Wells Fargo 9.3%
EMEA MLAUSD 869.6 billion (+34.3%)
1. BNP Paribas 5.6%2. HSBC 5.4%3. RBS 4.4%
CANADA LOANSUSD 153.3 billion (+4.2%)
1. RBC 18.5%2. CIBC 15.9%3. TD Securities 14.9%
A{L! EX-JP MLAUSD 272.4 billion (+18.2%)
1. State Bank of India 11.5%2. Bank of China 6.9%3. HSBC 5.0%
MENAUSD 38.4 billion (-2.2%)
1. HSBC 6.2%2. Samba Capital 4.7%3. Citi 4.4%
LATIN AMERICA MLAUSD 25 billion (-28%)
1. HSBC 8.2%2. Mizuho 8.1%3. MUFJ 8.1%
SUB-SAHARAN AFRICAUSD 21.6 billion (+16.1%)
1. Barclays 9.6%2. Standard Chartered 8.4%3. Standard Bank 7.5%
AUS/N ZEALAND MLAUSD 86.3 billion (+15.5%)
1. ANZ 18.7%2. NAB 16.0%3. CBA 15.4%
GLOBAL LOANS VOLUME
USD 32,001- 64,000 Mln
USD 64,000 Mln -
USD 1 - 300 Mln
USD 301 - 600 Mln
USD 601 - 1,000 Mln
USD 1,001 - 2,000 Mln
USD 2,001 - 4,000 Mln
USD 4,001 - 8,000 Mln
USD 8,001 - 16,000 Mln
USD 16,001 - 32,000 Mln

Glo
bal
Loa
ns R
evie
w |
1st
3Q
20
14
DATE DEAL TYPE INDUSTRY
AMOUNT
(USD MLN)
Number of deals 2,680 04/06/2014 Facility Cons, Cyclical 16,898.0
Volume (USD Mln) 1,371,580.0 Arrangers:
Avg Deal size (USD Mln) 511.8 13/05/2014 Revolver Financial 15,365.0
Arrangers:
30/04/2014 Facility Cons, Cyclical 12,160.0
JP Morgan Arrangers: BAML, BARCS, BNP, CACIB, CITI, CS, DB, GS, HSBCL, JPM, MS, MUFG, RBCCM, RBS, SUMI
Number of deals 806 11/09/2014 Facility Industrial 10,500.0
Volume (USD Mln) 229,935.0 Arrangers:
Avg Deal size (USD Mln) 285.3 18/09/2014 Revolver Cons, Non-cyclical 10,000.0
Arrangers:
297,643.0 21.7% -7.2%
223,044.0 16.3% -9.7%
206,178.0 15.0% -22.8%
167,980.0 12.2% -2.2%
165,431.0 12.1% 0.3%
104,193.0 7.6% -49.1%
73,044.0 5.3% -8.2%
62,227.0 4.5% -9.6%
51,309.0 3.7% -45.6%
11,510.0 0.8% -10.5%
U.S. LEVERAGED DEBT QUARTERLY VOLUME
U.S. LOANS INDUSTRY BREAKDOWN
Technology
Basic Materials
Utilities
RAISED
(USD MLN)
% OF
TOTAL
% CHNG
YOY
Consumer, Non-cyclical
Financial
Consumer, Cyclical
Industrial
Energy
DEPOSITORY TRUST COMPANY INC
BAML, BARCS, BOC, DB, JPM, MUFG
SUMMARY
• For the first three quarters of 2014, total volume for U.S. loans was USD 1,372 billion, a decrease of 12% for the same period in 2013,
including refinanced debt. Issuance totaled 95% of the same period in 2013 with 2,680 deals closing during the period.
• U.S. leveraged loan volume for the first three quarters of 2014 was USD 693 billion, a decrease of 15% from the same period 2013,
including refinanced debt. 1,578 deals were issued in the leveraged loan market in the first three quarters of 2014, a decrease of 12%
from the same period in 2013.
• The top two industries in the US were consumer non-cyclical, and financial, which collectively accounted for 38% of total deal activity
year to date in 2014. The consumer non-cyclical sector was the largest contributor, accounting for more than $297 billion of US deal
activity.
TOP ARRANGER
Deal Activity
U.S. Loans Review
Diversified
Communications
INDUSTRY
ISSUER
WAL-MART STORES INC
BAML, BARCS, CITI, HSBCL, JPM, WFC
FORD MOTOR COMPANY
CATERPILLAR INC
BAML, CITI, JPM
JOHNSON & JOHNSON
CITI, JPM
U.S. LOANS QUARTERLY VOLUME AND SPREAD
U.S. LOANS: LARGEST DEALS OF 1ST 3Q 2014
0
100
200
300
400
500
$0
$100
$200
$300
$400
$500
$600
$700
Q32009
Q32010
Q32011
Q32012
Q32013
Q32014
Bas
is P
oin
ts
USD
Bln
Leveraged Non-leveraged Leveraged Loans Spread at Close (basis points)
$0
$100
$200
$300
$400
$500
Q32009
Q32010
Q32011
Q32012
Q32013
Q32014
USD
Bln
Leveraged Loans High Yield Bonds
Consumer, Non-cyclical
22%
Financial16%
Consumer, Cyclical
15%
Industrial12%
Energy…
Communications8%
Other15%

Glo
bal
Loa
ns R
evie
w |
1st
3Q
20
14
U.S. Loans U.S. Loans - New Money
JP Morgan 1 16.8 229,935 806 1 17.1 -0.3 JP Morgan 1 15.1 70,839 512 1 18.9 -3.8
Bank of America Merrill Lynch 2 15.2 207,894 845 2 15.2 - Bank of America Merrill Lynch 2 13.7 64,494 526 2 14.4 -0.7
Wells Fargo & Co 3 9.3 127,852 566 3 9.1 0.2 Wells Fargo & Co 3 7.1 33,360 338 4 7.6 -0.5
Citi 4 8.4 115,742 336 4 8 0.4 Credit Suisse 4 5.9 27,685 227 7 3.9 2
Deutsche Bank AG 5 5 68,788 276 8 4.1 0.9 Citi 5 5.9 27,664 192 6 5.7 0.2
Barclays 6 4.7 64,308 262 5 6.6 -1.9 Deutsche Bank AG 6 5.2 24,313 187 8 3.2 2
Credit Suisse 7 4.2 57,630 306 6 4.3 -0.1 Barclays 7 5.1 23,971 172 3 9 -3.9
Morgan Stanley 8 3.2 43,993 221 7 4.2 -1 Goldman Sachs & Co 8 3.7 17,336 152 10 2.7 1
RBC Capital Markets 9 3.1 42,068 232 10 2.4 0.7 Morgan Stanley 9 3.6 16,973 151 5 5.9 -2.3
Goldman Sachs & Co 10 2.9 39,715 211 9 3.4 -0.5 RBC Capital Markets 10 3.4 15,910 176 9 2.8 0.6
RBS 11 2.2 30,453 181 11 2.3 -0.1 UBS 11 2.4 11,214 99 20 1.2 1.2
Mitsubishi UFJ Financial 12 2.2 30,395 119 12 1.9 0.3 SunTrust Robinson Humphrey 12 2.2 10,286 124 17 1.4 0.8
BNP Paribas SA 13 1.9 25,424 94 14 1.6 0.3 Jefferies LLC 13 2 9,291 93 19 1.3 0.7
SunTrust Robinson Humphrey 14 1.9 25,384 194 16 1.4 0.5 RBS 14 1.8 8,490 106 16 1.4 0.4
US Bancorp 15 1.8 25,025 156 13 1.8 - US Bancorp 15 1.8 8,396 97 12 1.8 -
HSBC Bank PLC 16 1.7 23,606 75 18 1.4 0.3 General Electric Capital Corp 16 1.8 8,260 136 11 2.2 -0.4
PNC Bank 17 1.5 20,617 174 19 1.4 0.1 BMO Capital Markets 17 1.7 8,160 118 14 1.5 0.2
UBS 18 1.4 19,133 133 17 1.4 - KeyBanc Capital Markets 18 1.7 7,927 107 21 1.2 0.5
KeyBanc Capital Markets 19 1.2 17,123 139 20 1 0.2 Mitsubishi UFJ Financial 19 1.6 7,654 66 15 1.5 0.1
General Electric Capital Corp 20 1.2 16,140 169 15 1.5 -0.3 PNC Bank 20 1.6 7,383 117 18 1.4 0.2
TOTAL 100% 1,371,580 2,680 1,557,020 100% TOTAL 100% 469,706 1,804 505,080 100%
U.S. Leveraged Loans U.S. Loans - Institutional
Bank of America Merrill Lynch 1 12.9 89,058 450 1 13 -0.1 Bank of America Merrill Lynch 1 10.5 44,958 252 2 11.1 -0.6
JP Morgan 2 10.8 74,590 363 2 12.6 -1.8 Credit Suisse 2 10.4 44,610 256 3 9.9 0.5
Wells Fargo & Co 3 7.8 54,001 254 3 7.9 -0.1 Deutsche Bank AG 3 9.6 41,128 197 6 7.7 1.9
Credit Suisse 4 7.4 51,042 287 4 7.4 - JP Morgan 4 8.3 35,544 212 1 11.3 -3
Deutsche Bank AG 5 7.2 49,546 229 7 6.2 1 Barclays 5 7.6 32,766 166 4 8.1 -0.5
Barclays 6 6.2 42,730 199 6 6.7 -0.5 Morgan Stanley 6 6.6 28,374 163 7 6.7 -0.1
Citi 7 5.7 39,146 162 5 6.7 -1 Goldman Sachs & Co 7 6.4 27,494 167 5 7.7 -1.3
Morgan Stanley 8 5.2 35,879 188 9 5 0.2 Citi 8 6.1 26,043 120 8 6.6 -0.5
Goldman Sachs & Co 9 4.9 33,973 190 8 5.9 -1 RBC Capital Markets 9 4.8 20,537 146 10 3.6 1.2
RBC Capital Markets 10 4.6 31,600 179 10 3.7 0.9 UBS 10 3.4 14,841 112 11 3.3 0.1
UBS 11 2.5 17,026 128 12 2.5 - Wells Fargo & Co 11 3.4 14,799 108 9 4.4 -1
General Electric Capital Corp 12 2.2 15,170 160 11 2.8 -0.6 Jefferies LLC 12 3.2 13,721 102 13 2.5 0.7
Jefferies LLC 13 2.2 14,956 110 14 1.7 0.5 General Electric Capital Corp 13 2.1 8,985 97 12 2.9 -0.8
SunTrust Robinson Humphrey 14 2 14,011 126 13 1.8 0.2 SunTrust Robinson Humphrey 14 1.7 7,384 85 14 1.3 0.4
RBS 15 1.7 11,996 96 18 1.1 0.6 BMO Capital Markets 15 1.2 5,351 71 15 1.1 0.1
BMO Capital Markets 16 1.5 10,425 114 15 1.6 -0.1 RBS 16 1.2 5,260 65 22 0.5 0.7
KeyBanc Capital Markets 17 1.4 9,400 81 16 1.2 0.2 HSBC Bank PLC 17 1.2 5,165 30 21 0.6 0.6
HSBC Bank PLC 18 1.2 8,175 40 21 0.7 0.5 Macquarie Group Ltd 18 1.1 4,920 45 19 0.7 0.4
PNC Bank 19 1 7,187 62 17 1.1 -0.1 Kohlberg Kravis Roberts & Co 19 0.9 4,021 26 20 0.7 0.2
BNP Paribas SA 20 1 7,009 44 20 0.8 0.2 BNP Paribas SA 20 0.9 3,801 35 18 0.7 0.2
TOTAL 100% 692,720 1,578 810,235 100% TOTAL 100% 430,210 1,024 526,153 100%
FIRM
2014 2013
MKT SHARE
CHG (%) FIRM
2014 2013
DEAL
COUNT
FIRM
RANK MKT SHARE
VOLUME
USD (Mln)
DEAL
COUNT RANK MKT SHARE RANK MKT SHARE
VOLUME
USD (Mln) RANK MKT SHARE
2013
MKT SHARE
CHG (%)RANK MKT SHARE
VOLUME
USD (Mln)
DEAL
COUNT RANK MKT SHARE RANK
2014 2013
MKT SHARE
CHG (%) FIRM
2014
MKT SHARE
VOLUME
USD (Mln)
DEAL
COUNT RANK MKT SHARE
MKT SHARE
CHG (%)

Glo
bal
Loa
ns R
evie
w |
1st
3Q
20
14
Canada Loans
RBC Capital Markets 18.5 28,326 77 1 21.9 -3.4
CIBC 15.9 24,338 81 3 15 0.9
TD Securities 14.9 22,821 78 4 13.2 1.7
Scotiabank 14 21,511 62 2 15.5 -1.5
BMO Capital Markets 10 15,348 58 5 11.4 -1.4
National Bank Financial Inc 8.4 12,916 64 6 6.2 2.2
Citi 2.9 4,402 10 8 2 0.9
JP Morgan 2.6 3,985 10 9 1.6 1
HSBC Bank PLC 2.1 3,170 17 10 1.4 0.7
Desjardins Capital Markets 2 2,551 12 11 1.2 0.5
153,341 344 147,190 100%
Canada Loans - New Money
RBC Capital Markets 18.2 7,106 41 3 12.7 5.5
Scotiabank 12.6 4,927 33 2 14.8 -2.2
CIBC 12 4,685 35 5 8.8 3.2
TD Securities 11.9 4,649 44 4 9.1 2.8
BMO Capital Markets 11.2 4,379 24 1 16.8 -5.6
National Bank Financial Inc 9.9 3,856 37 6 8.3 1.6
JP Morgan 4.6 1,792 8 11 1.9 2.7
HSBC Bank PLC 3.6 1,401 13 14 1.6 2
Desjardins Capital Markets 1.6 631 3 10 2.6 -1
General Electric Capital Corp 1.6 616 4 24 0.2 1.4
39,094 196 34,906 100%
CANADA LOANS MARKET SHARE
CANADA LOANS INDUSTRY BREAKDOWN
2013
MKT SHARE
CHG (%)RANK
7
FIRM MKT SHARE
TOTAL
2014 2013
RANK
1
2
3
4
5
RANK MKT SHARE
6
MKT SHARERANK
8
9
10
FIRM MKT SHARE
VOLUME CAD
(Mln) DEAL COUNT
2014
CANADA LOANS QUARTERLY VOLUME
MKT SHARE
CHG (%)
• The first three quarters of 2014 saw a total volume of USD 153 billion in Canadian loans, an increase of 4% for the same period in
2013. 344 deals closed in the first three quarters of 2014.
• The top five arrangers by number of deals were CIBC, TD Securities, RBC Capital Markets, National Bank Financial, and Scotiabank.
Deal Activity
Canada Loans Review
TOTAL
2
3
4
5
6
1
8
9
10
7
100%
100%
VOLUME CAD
(Mln) DEAL COUNT
0
20
40
60
80
100
120
140
160
180
$0
$10
$20
$30
$40
$50
$60
$70
$80
Q32009
Q32010
Q32011
Q32012
Q32013
Q32014
Dea
l co
un
t
USD
Mln
s
Volume Deal Count
Energy 34%
Industrial 14%
Basic Materials
13%
Financial 11%
Utilities 8%
Consumer, Non-…
Other 12%
0%
5%
10%
15%
20%
25%
RBC CapitalMarkets
CIBC TD Securities Scotiabank BMO CapitalMarkets
2014 2013 2012

Glo
bal
Loa
ns R
evie
w |
1st
3Q
20
14
Latin America Loan Mandated Arranger
HSBC Bank 8.2 2,045 18 4 9.5 -1.3
Mizuho Financial 8.1 2,017 22 2 11.4 -3.3
Mitsubishi UFJ Financial 8.1 2,013 20 1 12 -3.9
BNP Paribas 7.5 1,867 14 22 0.8 6.7
Bank of America Merrill Lynch 6 1,492 10 10 2.4 3.6
JP Morgan 5.6 1,402 9 11 2.2 3.4
Sumitomo Mitsui Financial 5.5 1,384 14 5 6.5 -1
Citi 5 1,249 12 8 4 1
BBVA 3.9 965 9 3 10.5 -6.6
Banco Santander 3.8 942 10 12 1.8 2
24,975 63 34,674 100%
Latin America Loans Book Runner
Mitsubishi UFJ Financial 14.2 3,353 15 1 15.3 -1.1
HSBC Bank 9.1 2,146 13 8 4.9 4.2
Citi 9 2,127 12 6 6 3
BNP Paribas 9 2,123 10 18 1.2 7.8
Mizuho Financial 8 1,876 17 2 13.3 -5.3
JP Morgan 6.7 1,571 8 12 1.9 4.8
Bank of America Merrill Lynch 5 1,184 7 11 2 3
BBVA 4.1 973 3 3 11.3 -7.2
Banco Santander 4 948 5 15 1.4 2.6
Banco Itau BBA 3.3 768 14 10 2.4 0.9
23,566 56 31,541 100%
2014 2013
MKT SHARE
CHG (%)
Deal Activity
FIRM MKT SHARE
VOLUME USD
(Mln) DEAL COUNT
FIRM MKT SHARE
VOLUME USD
(Mln) DEAL COUNT
Latin America Loans Review
TOTAL
LATIN AMERICA LOANS QUARTERLY VOLUME
RANK MKT SHARERANK
LATIN AMERICA LOANS INDUSTRY BREAKDOWN
LATIN AMERICA LOANS MARKET SHARE
100%
8
9
10
1
2
TOTAL
3
4
5
6
7
RANK RANK MKT SHARE
100%
• The first 3 quarters of 2014 saw a total volume of USD 24.975 billion in Latin American loans, a decrease of 28% from the same period
in 2013. 18 loans were closed in the current Q3 period, representing a 36% year-on-year decrease.
2014 2013
MKT SHARE
CHG (%)
0
10
20
30
40
50
$0
$5
$10
$15
$20
$25
Q32011
Q32012
Q32013
Q32014
Dea
l Co
un
t
USD
Mln
s
Amount Deal Count
Financial23%
Basic Materials18%
Energy17%
Consumer, Non-cyclical
16%
Communications10%
Utilities10%
Other6%
0%
2%
4%
6%
8%
10%
12%
14%
HSBC Bank PLC Mizuho FinancialGroup Inc
Mitsubishi UFJFinancial
BNP Paribas SA Bank of AmericaMerrill Lynch
2014 2013 2012

Glo
bal
Loa
ns R
evie
w |
1st
3Q
20
14
DATE DEAL TYPE INDUSTRY
AMOUNT
(USD MLN)
Number of deals 1123 06/06/2014 Revolver Basic Materials 15,300.0
Volume (USD Mln) 869,583
Avg Deal size (USD Mln) 774.3
18/06/2014 Bridge-Term Cons, Non-cyclical 14,200.0
BNP Paribas SA
Number of deals 371 15/07/2014 Facility Cons, Non-cyclical 13,160.4
Volume (USD Mln) 48,519.7
Avg Deal size (USD Mln) 130.8
201,430.0 23.2% 112.3%
129,851.0 14.9% 32.4%
111,107.0 12.8% 33.6%
94,627.0 10.9% -3.9%
88,476.0 10.2% 48.2%
79,063.0 9.1% 20.4%
71,872.0 8.3% 24.4%
57,836.0 6.7% -13.7%
17,341.0 2.0% 7.4%
12,728.0 1.5% 15.9%
EMEA Loans Review EMEA LEVERAGED DEBT QUARTERLY VOLUME
EMEA LOANS INDUSTRY BREAKDOWN
• EMEA syndicated loan volume for the first three quarters of 2014 was USD 869.6 billion, representing a 34.3% increase from the same
period in 2013. A total of 1123 deals were signed, compared to 1012 during the same period last year. There were 248 individual deals
issued for an amount greater than USD 1 billion compared to 179 for the the first three quarters of 2013.
• Many of the notable syndicated loans in Q3 have been driven by acquisitions, with the largest deal of US$ 13 billion pertaining to
Imperial Tobacco's purchase of several brands from Reynolds. The second- and third-largest deals respectively are the US$ 11.6 billion
bridge loan issued by Merck KGaA to fund its acquisition of Sigma-Aldrich, and the GBP 6.5 billion loans for BSKYB to acquire controlling
interests in SKY Italia and SKY Deutschland.
• The leveraged market in Q3 has been particularly strong with the largest leverage deal being Formula 1's amendment of its loan
package to include a USD 3.1 billion 1st lien loan, with a small EUR 40 million 1st lien TLB alongside, and a USD 1 billion second lien loan.
IDC, Endemol & Spie were also contributors to high levels of issuance in Q3 for the leveraged market.
% OF
TOTAL
% CHNG
YOY
IMPERIAL TOBACCO GROUP PLC
EMEA LOANS QUARTERLY VOLUME AND SPREAD
LARGEST EMEA DEALS OF 1ST 3Q 2014
Arrangers:
Arrangers:BAML/BARCS/BBVA/BNPPAR/BOC/BSSA/CACIB/COBA/HSBCL/INTES/MIZUHO/MUFG/R
BS/SG/SMFGRP/UNICRD
RAISED
(USD MLN)
Utilities
Diversified
Technology
INDUSTRY
SUMMARY
ABN, ANZ, BAML, BARCS, BBVA, BMO, BNPPAR, BSSA, CACIB, CBA, CITI, COBA, CS, DB,
DBS, HSBCL, ING, JPM, LLOYDS, MIZUHO, MS, MUFG, NAB, RABO, RBCCM, RBS, SCOTIA,
SG, SMFGRP, STANDC, TDSECS, UBS, UNICRD
Basic Materials
Energy
Industrial
Consumer, Cyclical
Financial
Communications
Consumer, Non-cyclical
Deal Activity
ISSUER
GLENCORE PLC
TOP ARRANGER
BAYER AG
BAML, BARCS, BBVA, BNPPAR, BSSA, CACIB, CITI, COBA, CS, DB, GS, HSBCL, JPM,
MIZUHO, MUFG, RBS, SG, SMFGRP, UNICRDArrangers:
0.00
100.00
200.00
300.00
400.00
500.00
600.00
$0$50
$100$150$200$250$300$350$400$450
Q32009
Q32010
Q32011
Q32012
Q32013
Q32014
Bas
is P
oin
ts
USD
Bln
Investment Grade Leveraged Other Lev Loans Spread at Close (bps) IG Loans Spread at Close (bps)
$0
$20
$40
$60
$80
$100
$120
$140
Q32009
Q32010
Q32011
Q32012
Q32013
Q32014
USD
Bln
Leveraged Loans High Yield Bonds
Consumer, Non-cyclical
23%
Industrial15%
Consumer, Cyclical
13%Financial
11%
Communications10%
Basic Materials9%
Other19%

Glo
bal
Loa
ns R
evie
w |
1st
3Q
20
14
EMEA Loans Mandated Arranger EMEA Loans Book Runner
BNP Paribas SA 1 5.6 48,520 371 1 6.1 -0.5 BNP Paribas SA 1 7.5 51,472 250 1 7.2 0.3
HSBC Bank PLC 2 5.4 47,112 373 2 5.1 0.3 Credit Agricole CIB 2 4.9 33,517 145 3 4.8 0.1
RBS 3 4.4 38,295 265 6 3.7 0.7 HSBC Bank PLC 3 4.9 33,436 225 4 4.7 0.2
Societe Generale 4 4.2 36,715 253 5 3.9 0.3 RBS 4 4.8 33,263 152 6 4.5 0.3
Credit Agricole CIB 5 4.2 36,096 235 7 3.5 0.7 Barclays 5 4.4 30,341 163 11 3.2 1.2
Barclays 6 4 34,823 272 8 3.3 0.7 JP Morgan 6 4.3 29,258 102 8 3.8 0.5
Deutsche Bank AG 7 3.9 34,211 211 3 4.9 -1 Bank of America Merrill Lynch 7 4.1 28,109 88 14 2.8 1.3
JP Morgan 8 3.9 34,127 156 9 3.2 0.7 ING Groep NV 8 4 27,164 148 12 3.1 0.9
ING Groep NV 9 3.4 29,493 237 12 3 0.4 Commerzbank AG 9 3.9 26,879 164 10 3.5 0.4
Commerzbank AG 10 3.4 29,225 236 11 3 0.4 UniCredit 10 3.9 26,847 135 7 4 -0.1
UniCredit 11 3.3 28,959 214 4 4 -0.7 Citi 11 3.8 26,113 122 9 3.7 0.1
Bank of America Merrill Lynch 12 3.2 27,913 138 13 2.5 0.7 Societe Generale 12 3.8 25,922 156 5 4.7 -0.9
Citi 13 3.1 27,107 169 10 3.2 -0.1 Deutsche Bank AG 13 3.7 25,464 136 2 6 -2.3
Banco Santander SA 14 2.5 21,741 176 16 2 0.5 Banco Santander SA 14 2.8 19,043 91 18 1.8 1
Mitsubishi UFJ Financial 15 2.4 20,636 140 17 1.8 0.6 Nordea 15 2.3 16,103 76 20 1.6 0.7
Lloyds Bank PLC 16 2.3 19,732 165 15 2 0.3 Natixis 16 2.1 14,604 106 13 2.9 -0.8
Nordea 17 1.9 16,589 106 18 1.7 0.2 Morgan Stanley 17 2.1 14,331 36 27 1.1 1
Natixis 18 1.8 15,465 150 14 2.1 -0.3 Lloyds Bank PLC 18 2 13,810 82 17 1.9 0.1
Sumitomo Mitsui Financial Group Inc 19 1.7 14,678 98 22 1.4 0.3 Mitsubishi UFJ Financial 19 2 13,655 71 15 2.1 -0.1
Mizuho Financial Group Inc 20 1.6 14,099 94 27 1.1 0.5 Mizuho Financial Group Inc 20 1.8 12,320 48 32 0.9 0.9
TOTAL 100% 869,583 1123 647,337 100% TOTAL 100% 687,307 821 508,401 100%
EMEA Loans Facility Agent
RBS 1 7.2 62,290 55 5 5.2 2
Commerzbank AG 2 6.8 58,776 66 2 7.8 -1
Barclays 3 6.5 56,146 49 4 5.9 0.6
BNP Paribas SA 4 5.9 50,765 77 7 4.6 1.3
Deutsche Bank AG 5 5.8 50,423 49 1 10.6 -4.8
ING Groep NV 6 5 43,471 46 11 2.8 2.2
UniCredit 7 5 43,093 64 6 4.7 0.3
HSBC Bank PLC 8 4.9 41,965 54 10 3.8 1.1
Societe Generale 9 4.2 36,315 37 9 4 0.2
Credit Agricole CIB 10 4 34,477 45 8 4.3 -0.3
Citi 11 3.6 30,926 33 3 7.1 -3.5
Nordea 12 3.5 29,912 42 13 2.8 0.7
Bank of America Merrill Lynch 13 3 25,596 27 20 1.4 1.6
Lloyds Bank PLC 14 2.7 23,069 46 12 2.8 -0.1
JP Morgan 15 2.6 22,338 15 18 1.8 0.8
Natixis 16 2.3 20,074 25 26 0.9 1.4
DnB ASA 17 2.2 19,286 35 17 1.8 0.4
Danske Markets 18 1.9 16,763 12 50 0.2 1.7
Rabobank Nederland 19 1.7 14,907 19 16 1.9 -0.2
BayernLB 20 1.3 11,237 12 37 0.4 0.9
TOTAL 100% 864,032 1,127 617,914 100%
FIRM
2014 2013
MKT SHARE
CHG (%)RANK MKT SHARE
VOLUME
USD (Mln)
DEAL
COUNT RANK MKT SHARE
RANK MKT SHARE
VOLUME
USD (Mln)
DEAL
COUNT RANK MKT SHARE RANK MKT SHARE
DEAL
COUNT RANK MKT SHAREFIRM
2014 2013
MKT SHARE
CHG (%) FIRM
2014 2013
VOLUME
USD (Mln)
MKT SHARE
CHG (%)

Glo
bal
Loa
ns R
evie
w |
1st
3Q
20
14
EMEA High Yield Loans Mandated Arranger EMEA High Yield Loans Book Runner
JP Morgan 1 8.1 10,464 32 3 5.9 2.2 JP Morgan 1 8.7 9,839 28 3 6.9 1.8
Deutsche Bank AG 2 7.6 9,743 53 1 8 -0.4 Deutsche Bank AG 2 8.6 9,789 45 1 8.2 0.4
Bank of America Merrill Lynch 3 6.9 8,910 21 8 3.4 3.5 Bank of America Merrill Lynch 3 7.8 8,885 19 8 4.1 3.7
BNP Paribas SA 4 6.5 8,369 55 2 7.4 -0.9 BNP Paribas SA 4 6.6 7,499 40 2 7 -0.4
Goldman Sachs & Co 5 5.4 7,005 38 7 3.9 1.5 Goldman Sachs & Co 5 6.2 7,073 32 7 4.3 1.9
Morgan Stanley 6 5.2 6,644 17 17 2.3 2.9 Morgan Stanley 6 5.6 6,380 16 14 2.9 2.7
RBS 7 4.4 5,700 23 5 4.9 -0.5 Credit Agricole CIB 7 5.5 6,251 24 9 3.6 1.9
Credit Agricole CIB 8 4.3 5,509 34 11 3.2 1.1 RBS 8 4.9 5,526 16 4 5.8 -0.9
Nomura Holdings Inc 9 3.9 5,076 18 20 1.7 2.2 Nomura Holdings Inc 9 4.1 4,621 16 18 2 2.1
ING Groep NV 10 3.7 4,797 35 14 2.7 1 Barclays 10 3.8 4,332 27 12 3.2 0.6
UniCredit 11 3.7 4,727 29 6 4.3 -0.6 ING Groep NV 11 3.6 4,138 23 16 2.4 1.2
HSBC Bank PLC 12 3.4 4,377 45 4 5.7 -2.3 HSBC Bank PLC 12 3.6 4,129 32 5 5.1 -1.5
Barclays 13 3.4 4,330 33 9 3.3 0.1 Credit Suisse 13 3.3 3,713 23 17 2.1 1.2
Societe Generale 14 3 3,916 37 10 3.3 -0.3 UniCredit 14 3.2 3,591 20 6 4.4 -1.2
Credit Suisse 15 2.9 3,771 30 18 1.9 1 Societe Generale 15 2.9 3,274 22 13 3.1 -0.2
UBS 16 2.3 2,942 17 16 2.4 -0.1 UBS 16 2.5 2,819 14 15 2.7 -0.2
Natixis 17 2 2,608 26 15 2.4 -0.4 Natixis 17 2.2 2,526 21 10 3.3 -1.1
Citi 18 1.6 2,118 20 12 2.9 -1.3 Nordea 18 1.9 2,203 6 22 1.5 0.4
Lloyds Bank PLC 19 1.3 1,714 19 21 1.7 -0.4 Citi 19 1.7 1,943 17 11 3.2 -1.5
Nordea 20 1.3 1,656 7 22 1.6 -0.3 Commerzbank AG 20 1.5 1,667 13 19 2 -0.5
TOTAL 100% 128,604 200 158,741 100% TOTAL 100% 113,668 163 140,803 100%
EMEA Sponsor-led Lev Loans Mandated Arranger EMEA Sponsor-led Leveraged Loans Book Runner
JP Morgan 1 9.1 8,360 22 4 7.2 1.9 JP Morgan 1 9.6 7,605 19 2 8.4 1.2
Bank of America Merrill Lynch 2 8 7,296 15 9 3.6 4.4 Bank of America Merrill Lynch 2 9.2 7,311 14 9 4 5.2
Deutsche Bank AG 3 7 6,435 34 1 10.7 -3.7 Deutsche Bank AG 3 8.2 6,524 28 1 12 -3.8
BNP Paribas SA 4 5.4 4,986 42 2 7.9 -2.5 Morgan Stanley 4 5.8 4,611 9 12 2.7 3.1
Morgan Stanley 5 5 4,593 9 13 2.5 2.5 Credit Agricole CIB 5 5.7 4,496 18 13 2.7 3
Credit Agricole CIB 6 4.7 4,279 28 11 2.9 1.8 Nomura Holdings Inc 6 5.3 4,221 14 10 3.4 1.9
Nomura Holdings Inc 7 4.6 4,176 15 10 3.1 1.5 BNP Paribas SA 7 4.9 3,911 29 3 8.1 -3.2
UniCredit 8 4.5 4,085 24 5 5.8 -1.3 RBS 8 4.8 3,844 10 7 5.1 -0.3
RBS 9 4.4 4,010 16 7 4.7 -0.3 Goldman Sachs & Co 9 4.8 3,840 24 4 7.8 -3
Goldman Sachs & Co 10 4.4 3,990 29 3 7.4 -3 UniCredit 10 4.2 3,306 18 5 6.9 -2.7
ING Groep NV 11 4.3 3,936 29 16 2.3 2 HSBC Bank PLC 11 3.9 3,114 24 6 5.6 -1.7
HSBC Bank PLC 12 3.5 3,195 34 6 5.2 -1.7 ING Groep NV 12 3.9 3,063 18 17 2.1 1.8
Societe Generale 13 3.4 3,098 30 19 2 1.4 Societe Generale 13 3.5 2,755 20 20 1.8 1.7
Credit Suisse 14 2.5 2,325 23 15 2.3 0.2 Natixis 14 2.8 2,189 19 21 1.3 1.5
Barclays 15 2.2 1,977 19 12 2.5 -0.3 Credit Suisse 15 2.7 2,157 17 15 2.3 0.4
Natixis 16 2 1,874 21 21 1.3 0.7 Nordea 16 2.4 1,876 4 19 1.9 0.5
UBS 17 1.6 1,503 12 8 4.5 -2.9 Barclays 17 2.2 1,727 13 11 2.8 -0.6
Lloyds Bank PLC 18 1.5 1,378 15 17 2.2 -0.7 UBS 18 1.8 1,416 10 8 4.7 -2.9
Commerzbank AG 19 1.5 1,357 15 14 2.4 -0.9 Lloyds Bank PLC 19 1.7 1,336 8 14 2.5 -0.8
Nordea 20 1.5 1,330 5 18 2.1 -0.6 RBC Capital Markets 20 1.6 1,261 11 16 2.1 -0.5
TOTAL 100% 91,650 148 75,997 100% TOTAL 100% 79,545 121 70,000 100%
MKT SHARE
CHG (%) FIRM
2014 2013
MKT SHARE
CHG (%)RANK MKT SHARE
VOLUME
USD (Mln)
DEAL
COUNT RANK MKT SHARE RANK MKT SHARE
VOLUME
USD (Mln)
DEAL
COUNT RANK MKT SHARE
FIRM
2014 2013
MKT SHARE
CHG (%) FIRM
2014 2013
MKT SHARE
CHG (%)RANK MKT SHARE
VOLUME
USD (Mln)
DEAL
COUNT RANK MKT SHARE RANK MKT SHARE
VOLUME
USD (Mln)
DEAL
COUNT RANK MKT SHARE
FIRM
2014 2013

Glo
bal
Loa
ns R
evie
w |
1st
3Q
20
14
EMEA Investment Grade Loans Mandated Arranger EMEA Investment Grade Loans Book Runner
BNP Paribas SA 1 5.5 17,951 112 1 6.2 -0.7 BNP Paribas SA 1 8.5 23,073 82 1 7 1.5
JP Morgan 2 5.2 16,914 65 11 3.3 1.9 RBS 2 5.6 15,363 62 7 4.1 1.5
HSBC Bank PLC 3 5.1 16,572 109 4 4.5 0.6 Bank of America Merrill Lynch 3 5.6 15,313 44 10 3.8 1.8
Societe Generale 4 5.1 16,553 79 6 4.4 0.7 Barclays 4 5.4 14,775 65 6 4.2 1.2
Barclays 5 4.8 15,686 98 5 4.4 0.4 JP Morgan 5 4.9 13,425 43 13 3.3 1.6
RBS 6 4.7 15,208 95 7 3.9 0.8 HSBC Bank PLC 6 4.7 12,894 75 5 4.4 0.3
Citi 7 4.6 14,955 80 3 5.5 -0.9 Citi 7 4.6 12,496 56 2 5.8 -1.2
Deutsche Bank AG 8 4.6 14,881 65 2 5.5 -0.9 Commerzbank AG 8 4.6 12,436 57 9 4 0.6
Commerzbank AG 9 4.4 14,328 80 12 3.2 1.2 Banco Santander SA 9 4.3 11,611 38 15 2.7 1.6
Bank of America Merrill Lynch 10 3.8 12,306 62 8 3.7 0.1 Societe Generale 10 4 10,881 62 4 4.9 -0.9
Mitsubishi UFJ Financial 11 3.5 11,431 68 10 3.5 - Mizuho Financial Group Inc 11 3.6 9,775 33 18 2.4 1.2
UniCredit 12 3.5 11,349 58 13 3 0.5 ING Groep NV 12 3.3 9,137 49 14 2.9 0.4
Banco Santander SA 13 3.4 11,166 63 15 2.4 1 UniCredit 13 3.3 9,015 39 12 3.4 -0.1
Credit Agricole CIB 14 3.3 10,735 63 9 3.7 -0.4 Credit Agricole CIB 14 3.2 8,736 45 8 4.1 -0.9
ING Groep NV 15 2.9 9,563 69 14 2.9 - Mitsubishi UFJ Financial 15 3.2 8,713 45 11 3.7 -0.5
Mizuho Financial Group Inc 16 2.9 9,285 52 17 2.3 0.6 Deutsche Bank AG 16 3.1 8,521 42 3 5.5 -2.4
Sumitomo Mitsui Financial Group Inc 17 2.6 8,378 48 16 2.4 0.2 Morgan Stanley 17 2.1 5,685 13 32 0.9 1.2
Lloyds Bank PLC 18 2.4 7,778 47 22 1.7 0.7 Lloyds Bank PLC 18 1.5 4,198 23 22 1.4 0.1
Banco Bilbao Vizcaya Argentaria 19 2 6,413 32 19 1.9 0.1 Banco Bilbao Vizcaya Argentaria 19 1.5 4,013 18 17 2.4 -0.9
Intesa Sanpaolo SpA 20 1.7 5,583 28 24 1.5 0.2 Sumitomo Mitsui Financial Group Inc 20 1.5 3,977 25 16 2.6 -1.1
TOTAL 100% 325,227 176 205,730 100% TOTAL 100% 272,920 135 168,241 100%
Western Europe Loans Mandated Arranger Western Europe Loans Book Runner
BNP Paribas SA 1 5.7 44,201 335 1 6.7 -1 BNP Paribas SA 1 7.5 46,792 229 1 7.4 0.1
HSBC Bank PLC 2 5.5 42,180 322 3 5.2 0.3 Credit Agricole CIB 2 5.3 33,127 142 4 5 0.3
RBS 3 4.8 36,949 250 4 4.4 0.4 RBS 3 5.2 32,743 145 3 5.1 0.1
Credit Agricole CIB 4 4.3 33,172 214 6 3.9 0.4 HSBC Bank PLC 4 4.9 30,791 200 5 4.8 0.1
Societe Generale 5 4.2 32,442 209 7 3.9 0.3 Barclays 5 4.4 27,692 146 11 3.1 1.3
JP Morgan 6 4.1 31,853 135 10 3.2 0.9 Bank of America Merrill Lynch 6 4.4 27,667 82 13 2.9 1.5
Deutsche Bank AG 7 4.1 31,705 185 2 5.6 -1.5 JP Morgan 7 4.4 27,439 88 10 3.5 0.9
Barclays 8 4.1 31,639 245 9 3.4 0.7 Commerzbank AG 8 4.1 25,647 147 8 3.9 0.2
Commerzbank AG 9 3.6 27,502 208 8 3.4 0.2 UniCredit 9 4 25,189 126 7 4.1 -0.1
Bank of America Merrill Lynch 10 3.5 26,620 123 13 2.6 0.9 ING Groep NV 10 3.9 24,129 128 12 3 0.9
UniCredit 11 3.4 26,367 185 5 4.2 -0.8 Societe Generale 11 3.8 23,807 139 6 4.8 -1
ING Groep NV 12 3.3 25,266 196 12 2.9 0.4 Deutsche Bank AG 12 3.8 23,760 122 2 6.4 -2.6
Citi 13 2.9 22,158 135 11 3.2 -0.3 Citi 13 3.3 20,713 95 9 3.5 -0.2
Banco Santander SA 14 2.7 21,118 170 15 2.5 0.2 Banco Santander SA 14 3 18,816 90 17 2.1 0.9
Lloyds Bank PLC 15 2.5 19,596 163 14 2.5 - Nordea 15 2.4 15,221 71 20 1.6 0.8
Mitsubishi UFJ Financial 16 2.3 17,417 109 20 1.6 0.7 Morgan Stanley 16 2.3 14,256 35 25 1.3 1
Nordea 17 2 15,291 97 19 1.8 0.2 Natixis 17 2.2 13,906 100 14 2.9 -0.7
Natixis 18 1.8 13,946 134 16 2.1 -0.3 Lloyds Bank PLC 18 2.2 13,734 81 16 2.2 -
SEB 19 1.7 13,384 89 17 1.8 -0.1 Mitsubishi UFJ Financial 19 1.9 12,129 61 19 1.7 0.2
Morgan Stanley 20 1.7 12,825 46 22 1.5 0.2 Mizuho Financial Group Inc 20 1.9 11,730 40 36 0.8 1.1
TOTAL 100% 769,132 939 503,857 100% TOTAL 100% 626,177 705 437,215 100%
MKT SHARE
CHG (%)RANK MKT SHARE
VOLUME
USD (Mln)
DEAL
COUNT RANK MKT SHARE RANK MKT SHARE
VOLUME
USD (Mln)
DEAL
COUNT RANK MKT SHARE
MKT SHARE
CHG (%) FIRM
2014 2013
FIRM
2014 2013
MKT SHARE
CHG (%) FIRM
2014 2013
MKT SHARE
CHG (%)RANK MKT SHARE
VOLUME
USD (Mln)
DEAL
COUNT RANK MKT SHARE RANK MKT SHARE
VOLUME
USD (Mln)
DEAL
COUNT RANK MKT SHARE
FIRM
2014 2013

Glo
bal
Loa
ns R
evie
w |
1st
3Q
20
14
Benelux Loans Mandated Arranger Benelux Loans Book Runner
Deutsche Bank AG 1 7.6 5,856 35 4 6.5 1.1 Bank of America Merrill Lynch 1 7.9 5,725 15 12 2.5 5.4
Bank of America Merrill Lynch 2 7.2 5,521 14 24 1.5 5.7 BNP Paribas SA 2 7.7 5,567 37 4 7.2 0.5
ING Groep NV 3 6.7 5,143 58 1 7.9 -1.2 ING Groep NV 3 7.5 5,420 45 2 9.1 -1.6
BNP Paribas SA 4 6.6 5,110 47 2 7.4 -0.8 Deutsche Bank AG 4 7.4 5,380 26 5 7 0.4
RBS 5 5.5 4,206 23 3 7.4 -1.9 RBS 5 6.1 4,402 20 1 10.2 -4.1
JP Morgan 6 5.3 4,099 20 14 2.1 3.2 JP Morgan 6 5.3 3,883 16 18 1.7 3.6
Citi 7 5 3,824 19 5 6.2 -1.2 Citi 7 5 3,634 16 6 7 -2
Commerzbank AG 8 4.3 3,314 19 9 3.9 0.4 Commerzbank AG 8 4.9 3,554 14 8 4.9 -
Morgan Stanley 9 4.2 3,272 8 13 2.3 1.9 Rabobank Nederland 9 4.7 3,385 30 3 8.3 -3.6
Rabobank Nederland 10 3.5 2,688 32 6 5.4 -1.9 Morgan Stanley 10 4.5 3,289 7 10 2.9 1.6
HSBC Bank PLC 11 3.1 2,353 26 10 3 0.1 ABN Amro Bank NV 11 3.3 2,415 23 9 4 -0.7
ABN Amro Bank NV 12 2.9 2,259 29 7 4.7 -1.8 UniCredit 12 2.9 2,096 12 29 0.6 2.3
Societe Generale 13 2.6 2,003 23 8 4.1 -1.5 Credit Agricole CIB 13 2.7 1,990 13 16 2 0.7
Credit Agricole CIB 14 2.5 1,923 20 12 2.5 - Societe Generale 14 2.7 1,968 15 7 5 -2.3
UniCredit 15 2.4 1,820 16 16 1.9 0.5 HSBC Bank PLC 15 2.3 1,647 16 22 1.2 1.1
Barclays 16 2.3 1,765 24 29 0.9 1.4 Goldman Sachs & Co 16 2.2 1,624 10 13 2.3 -0.1
Credit Suisse 17 2.1 1,633 15 22 1.7 0.4 Barclays 17 2.1 1,540 20 26 0.9 1.2
Goldman Sachs & Co 18 2.1 1,621 11 11 2.9 -0.8 Lloyds Bank PLC 18 1.8 1,273 8 17 1.7 0.1
Mitsubishi UFJ Financial 19 2 1,505 16 19 1.8 0.2 Credit Suisse 19 1.7 1,216 11 28 0.7 1
UBS 20 1.6 1,252 6 17 1.9 -0.3 UBS 20 1.7 1,211 5 14 2.2 -0.5
TOTAL 100% 77,113 111 45,605 100% TOTAL 100% 72,722 100 40,704 100%
Central & Eastern Europe Loans Mandated Arranger Central & Eastern Europe Loans Book Runner
ING Groep NV 1 7.1 1,760 24 7 4 3.1 ING Groep NV 1 11.9 1,620 14 8 4.5 7.4
UniCredit 2 6.2 1,530 23 6 4.1 2.1 UniCredit 2 8.5 1,153 8 18 1.8 6.7
Societe Generale 3 5.6 1,397 23 10 2.9 2.7 Citi 3 6.5 883 10 2 7.2 -0.7
BNP Paribas SA 4 5.1 1,273 16 11 2.8 2.3 Societe Generale 4 6 809 10 11 3.4 2.6
Sberbank CIB 5 4.1 1,030 4 12 2.8 1.3 Mitsubishi UFJ Financial 5 5.7 773 3 28 1.2 4.5
HSBC Bank PLC 6 3.9 960 17 8 3.6 0.3 BNP Paribas SA 6 5.3 720 9 1 7.2 -1.9
Mitsubishi UFJ Financial 7 3.6 897 11 27 1.3 2.3 Standard Chartered Bank 7 5.3 718 11 9 4.2 1.1
Citi 8 3.5 881 13 13 2.7 0.8 HSBC Bank PLC 8 4 536 8 12 3 1
Standard Chartered Bank 9 3.2 791 17 16 2.5 0.7 PKO Bank Polski SA 9 3 406 2 - - -
Deutsche Bank AG 10 2.9 731 12 19 2.1 0.8 Commerzbank AG 10 2.9 388 8 19 1.7 1.2
Credit Agricole CIB 11 2.9 713 6 33 0.9 2 Deutsche Bank AG 11 2.7 369 7 5 6.2 -3.5
Commerzbank AG 12 2.6 646 13 14 2.5 0.1 Wells Fargo & Co 11 2.7 369 7 13 2.6 0.1
Wells Fargo & Co 13 2.5 613 12 21 1.9 0.6 Intesa Sanpaolo SpA 13 2.6 347 2 - - -
Barclays 14 2.1 517 11 20 1.9 0.2 Barclays 14 2.3 310 6 16 2.3 -
Erste Group Bank 15 1.9 466 10 15 2.5 -0.6 BayernLB 15 2.3 308 3 44 0.1 2.2
Turkiye Garanti Bankasi AS 16 1.8 435 5 2 6 -4.2 JP Morgan 16 2 266 5 3 6.8 -4.8
JP Morgan 17 1.7 431 9 17 2.2 -0.5 Goldman Sachs & Co 17 1.9 257 5 20 1.7 0.2
RBS 18 1.7 411 7 29 1.1 0.6 Mizuho Financial Group Inc 18 1.7 224 4 27 1.3 0.4
Mizuho Financial Group Inc 19 1.6 398 8 23 1.6 - Sumitomo Mitsui Financial Group Inc 19 1.5 201 4 33 0.7 0.8
Banco Santander SA 20 1.6 396 5 61 0.2 1.4 European Bank for Reconstruct & Dev 20 1.5 199 4 10 3.6 -2.1
TOTAL 100% 24,813 56 37,812 100% TOTAL 100% 13,559 31 13,292 100%
FIRM
MKT SHARE
CHG (%)
2013
MKT SHARE
CHG (%)RANK MKT SHARE
VOLUME
EUR (Mln)
DEAL
COUNT RANK MKT SHARE RANK MKT SHARE
2014 2013
MKT SHARE
CHG (%) FIRM
2014
VOLUME
EUR (Mln)
DEAL
COUNT RANK MKT SHARE
RANK MKT SHARE
VOLUME
EUR (Mln)
DEAL
COUNT RANK MKT SHARE RANK MKT SHARE
VOLUME
EUR (Mln)
DEAL
COUNTFIRM
2014 2013
MKT SHARE
CHG (%) FIRM RANK MKT SHARE
2014 2013

Glo
bal
Loa
ns R
evie
w |
1st
3Q
20
14
Russia & CIS Loans Mandated Arranger Russia & CIS Loans Book Runner
Citi 1 13.3 657 5 8 4.4 8.9 ING Groep NV 1 23.8 552 5 4 6.9 16.9
ING Groep NV 2 13.1 647 11 2 6.1 7 Societe Generale 2 18.4 426 3 5 6.4 12
Societe Generale 3 12 595 9 4 5.1 6.9 Deutsche Bank AG 3 16.5 381 2 18 2.1 14.4
JP Morgan 4 7.8 385 2 15 3.6 4.2 Citi 4 10.7 249 3 11 4.7 6
UniCredit 5 6.6 325 5 1 6.6 - Nordea 5 9.3 216 2 12 4.6 4.7
Raiffeisen Bank International Group 6 6.3 312 8 16 3.4 2.9 European Bank for Reconstruct & Dev 6 5.3 122 4 27 0.2 5.1
Nordea 7 5.7 281 5 10 4.4 1.3 Commerzbank AG 7 3.3 77 3 19 1 2.3
Credit Agricole CIB 8 5.5 273 3 13 3.9 1.6 Raiffeisen Bank International Group 8 2.6 60 2 24 0.4 2.2
HSBC Bank PLC 9 3.7 181 3 20 2.2 1.5 Alfa Bank 9 2.6 60 3 20 0.8 1.8
Sberbank CIB 9 3.7 181 3 18 2.5 1.2 VTB Capital 10 2.5 57 2 25 0.3 2.2
Mitsubishi UFJ Financial 11 3.3 165 1 7 4.5 -1.2 HSBC Bank PLC 11 1.8 41 1 17 2.2 -0.4
Deutsche Bank AG 12 3 146 2 22 2 1 Sberbank CIB 11 1.8 41 1 - - -
European Bank for Reconstruct & Dev 13 2.9 144 5 42 0.2 2.7 JP Morgan 13 0.8 19 1 14 4.3 -3.5
Commerzbank AG 14 2.9 144 5 23 1.3 1.6 Vnesheconombank 14 0.7 16 1 - - -
BNP Paribas SA 15 1.7 83 1 3 5.3 -3.6
Credit Suisse 15 1.7 83 1 25 1.1 0.6
Alfa Bank 17 1.5 76 5 26 1.1 0.4
VTB Capital 18 1.4 70 3 17 3.3 -1.9
Industrial & Comm Bank of China 19 1.2 58 1 - - -
Vnesheconombank 20 0.6 29 2 30 0.5 0.1
TOTAL 100% 4,948 24 26,710 100% TOTAL 100% 2,317 13 18,092 100%
MENA Loans Mandated Arranger MENA Loans Book Runner
HSBC Bank PLC 1 6.2 2,370 23 1 9 -2.8 Citi 1 11.5 2,629 7 5 4.6 6.9
Samba Capital 2 4.7 1,805 11 6 3.5 1.2 National Bank of Egypt 2 8.2 1,865 7 8 4 4.2
Citi 3 4.4 1,697 9 7 3.5 0.9 HSBC Bank PLC 3 6.9 1,581 12 2 8.5 -1.6
National Bank of Abu Dhabi 4 4.2 1,599 12 10 2.7 1.5 First Gulf Bank PJSC 4 5.2 1,187 6 22 1.7 3.5
First Gulf Bank PJSC 5 4 1,529 10 34 1 3 Mashreqbank PSC 5 4.9 1,109 6 26 1.5 3.4
Abu Dhabi Commercial Bank 6 3.5 1,333 10 5 3.9 -0.4 Emirates NBD PJSC 6 4.5 1,020 7 3 7.7 -3.2
Banque Saudi Fransi 7 3.2 1,223 5 18 1.8 1.4 National Bank of Abu Dhabi 7 4.1 925 5 20 1.8 2.3
Emirates NBD PJSC 8 3 1,158 9 4 4.3 -1.3 Barclays 8 3.7 843 5 16 2.4 1.3
Mitsubishi UFJ Financial 9 2.8 1,075 11 13 2.4 0.4 Samba Capital 9 3.7 839 2 22 1.7 2
Mashreqbank PSC 10 2.8 1,065 8 9 2.9 -0.1 Standard Chartered Bank 10 3.5 800 4 4 5.4 -1.9
Sumitomo Mitsui Financial Group Inc 11 2.7 1,040 10 30 1.2 1.5 Noor Islamic Bank 11 3.5 799 4 21 1.8 1.7
National Commercial Bank 12 2.4 922 4 31 1.2 1.2 Dubai Islamic Bank 12 3.1 717 4 19 2 1.1
Deutsche Bank AG 13 2.3 871 8 12 2.6 -0.3 Banque Saudi Fransi 13 2.8 640 1 12 2.6 0.2
Standard Chartered Bank 14 2.3 869 8 3 5 -2.7 National Commercial Bank 13 2.8 640 1 - - -
BNP Paribas SA 15 2.3 867 10 8 2.9 -0.6 BNP Paribas SA 15 2.1 469 5 30 0.9 1.2
Dubai Islamic Bank 16 2.2 862 6 39 0.8 1.4 Banque Misr SAE 16 1.9 422 5 11 2.8 -0.9
Mizuho Financial Group Inc 17 2.1 794 9 59 0.3 1.8 Union National Bank 17 1.7 391 3 18 2 -0.3
National Bank of Egypt 18 2 763 8 17 1.9 0.1 Arab Banking Corp 18 1.5 352 3 46 0.1 1.4
Credit Agricole CIB 19 2 752 8 15 2.2 -0.2 Societe Generale 19 1.5 348 3 15 2.4 -0.9
Qatar National Bank 20 1.9 712 8 21 1.4 0.5 Deutsche Bank AG 20 1.5 348 3 24 1.6 -0.1
TOTAL 100% 38,424 24 39,280 100% TOTAL 100% 22,791 15 21,862 100%
FIRM
2014 2013
MKT SHARE
CHG (%) FIRM
2014 2013
MKT SHARE
CHG (%)RANK MKT SHARE
VOLUME
USD (Mln)
DEAL
COUNT RANK MKT SHARE RANK MKT SHARE
VOLUME
USD (Mln)
DEAL
COUNT RANK MKT SHARE
MKT SHARE
CHG (%)RANK MKT SHARE
VOLUME
EUR (Mln)
DEAL
COUNT RANK MKT SHARE RANK MKT SHARE
DEAL
COUNT RANK MKT SHAREFIRM
2014 2013
MKT SHARE
CHG (%) FIRM
2014 2013
VOLUME
EUR (Mln)

Glo
bal
Loa
ns R
evie
w |
1st
3Q
20
14
Sub-Sahara Loans Mandated Arranger Sub-Sahara Loans Book Runner
Barclays 1 9.6 2,075 11 7 4.3 5.3 BNP Paribas SA 1 19.3 3,230 7 3 9.2 10.1
Standard Chartered Bank 2 8.4 1,814 12 3 6.4 2 Standard Chartered Bank 2 19.2 3,212 7 5 7.8 11.4
Standard Bank of South Africa 3 7.5 1,624 11 5 5.4 2.1 Barclays 3 8.3 1,389 6 9 4 4.3
BNP Paribas SA 4 7.4 1,608 9 4 5.6 1.8 Citi 4 7.3 1,226 7 13 2.9 4.4
Citi 5 5.3 1,151 7 18 1.9 3.4 JP Morgan 5 6.6 1,111 5 25 0.4 6.2
HSBC Bank PLC 6 4.7 1,012 8 8 3.8 0.9 Standard Bank of South Africa 6 6.3 1,053 5 6 7.4 -1.1
Firstrand Bank Ltd 7 4.6 1,003 9 2 6.6 -2 Nordea 7 3.5 590 3 - - -
Societe Generale 8 4.3 940 5 6 4.9 -0.6 SEB 7 3.5 590 3 23 0.6 2.9
Credit Agricole CIB 9 3.8 830 4 24 1.1 2.7 Credit Suisse 9 2.9 480 1 - - -
JP Morgan 10 3.4 734 5 40 0.6 2.8 Firstrand Bank Ltd 10 2 336 5 1 10.1 -8.1
Nedbank Capital 11 3.3 710 5 25 1.1 2.2 Deutsche Bank AG 11 2 334 2 7 6.8 -4.8
Mitsubishi UFJ Financial 12 3.2 685 8 22 1.5 1.7 Commerzbank AG 12 1.9 314 3 25 0.4 1.5
ING Groep NV 13 3.1 672 4 15 2.4 0.7 Natixis 13 1.9 313 2 4 8.8 -6.9
SEB 14 2.6 566 4 52 0.2 2.4 HSBC Bank PLC 14 1.7 283 4 16 1.9 -0.2
Sumitomo Mitsui Financial Group Inc 15 2.6 555 6 12 2.8 -0.2 Mitsubishi UFJ Financial 15 1.6 262 4 2 10 -8.4
Nordea 16 2.4 523 3 56 0.1 2.3 Sumitomo Mitsui Financial Group Inc 15 1.6 262 4 22 0.7 0.9
Deutsche Bank AG 17 2.1 447 4 21 1.7 0.4 DZ Bank AG 17 1.4 243 1 - - -
Commerzbank AG 18 1.9 421 6 20 1.7 0.2 Ghana International Bank 17 1.4 243 1 - - -
African Export-Import Bank 19 1.6 343 3 33 0.7 0.9 Kreditanstalt fuer Wiederaufbau 17 1.4 243 1 - - -
Natixis 20 1.6 342 3 13 2.8 -1.2 Mizuho Financial Group Inc 20 0.8 140 2 - - -
TOTAL 100% 21,616 39 18,621 100% TOTAL 100% 16,758 26 7,402 100%
EMEA Islamic Loans Mandated Arranger EMEA Islamic Loans Book Runner
National Commercial Bank 1 9.9 855 3 16 2.6 7.3 Noor Islamic Bank 1 11.9 869 5 2 9.5 2.4
Samba Capital 1 9.9 855 3 10 3.3 6.6 Mashreqbank PSC 2 9.9 726 3 18 1.6 8.3
Banque Saudi Fransi 3 9.4 811 2 7 4.4 5 Dubai Islamic Bank 3 9 658 4 10 3.2 5.8
Noor Islamic Bank 4 8.9 766 5 2 6.7 2.2 Banque Saudi Fransi 4 8.7 640 1 3 8.5 0.2
Dubai Islamic Bank 5 8.5 729 5 21 2 6.5 National Commercial Bank 4 8.7 640 1 - - -
Mashreqbank PSC 6 7.2 620 3 15 2.8 4.4 Samba Capital 4 8.7 640 1 23 0.9 7.8
First Gulf Bank PJSC 7 6.8 587 4 18 2.5 4.3 First Gulf Bank PJSC 7 7.1 516 3 23 0.9 6.2
Citi 8 4.8 417 2 29 0.8 4 Citi 8 5.7 417 2 16 1.6 4.1
Barwa Bank 9 3.8 330 3 4 6 -2.2 Barwa Bank 9 4.5 330 3 14 2.2 2.3
National Bank of Abu Dhabi 10 3.6 313 2 33 0.7 2.9 National Bank of Abu Dhabi 10 4.3 313 2 22 0.9 3.4
Commercial Bank of Dubai 11 2.8 237 3 25 1.5 1.3 Standard Chartered Bank 11 4.1 303 3 8 6.4 -2.3
Standard Chartered Bank 12 2.3 196 3 9 3.6 -1.3 Commercial Bank of Dubai 12 2.3 167 2 11 2.5 -0.2
Arab Banking Corp 13 2 172 4 19 2.4 -0.4 Abu Dhabi Islamic Bank/Egypt 13 2.1 157 3 15 1.6 0.5
HSBC Bank PLC 14 2 171 1 1 6.8 -4.8 Abu Dhabi Islamic Bank 14 2.1 155 2 1 11.8 -9.7
Riyad Bank 14 2 171 1 - - - Emirates NBD PJSC 15 2.1 151 3 7 7.4 -5.3
Saudi Investment Bank/The 14 2 171 1 - - - Arab Banking Corp 16 1.9 139 3 9 3.7 -1.8
Abu Dhabi Islamic Bank/Egypt 17 1.8 157 3 36 0.6 1.2 Al Hilal Bank 17 1.6 113 2 13 2.4 -0.8
Abu Dhabi Islamic Bank 18 1.8 155 2 6 4.5 -2.7 Abu Dhabi Commercial Bank 18 1.1 84 2 16 1.6 -0.5
Emirates NBD PJSC 19 1.7 151 3 5 4.7 -3 Bank Audi SAL 19 1 72 1 - - -
Abu Dhabi Commercial Bank 20 1 84 2 17 2.6 -1.6 Banque Misr SAE 19 1 72 1 - - -
TOTAL 100% 8,611 19 8,830 100% TOTAL 100% 7,320 17 6,778 100%
MKT SHARE
CHG (%) FIRM
2014 2013
MKT SHARE
CHG (%)RANK MKT SHARE
VOLUME
USD (Mln)
DEAL
COUNT RANK MKT SHARE RANK MKT SHARE
VOLUME
USD (Mln)
DEAL
COUNT RANK MKT SHARE
FIRM
2014 2013
MKT SHARE
CHG (%) FIRM
2014 2013
MKT SHARE
CHG (%)RANK MKT SHARE
VOLUME
USD (Mln)
DEAL
COUNT RANK MKT SHARE RANK MKT SHARE
VOLUME
USD (Mln)
DEAL
COUNT RANK MKT SHARE
FIRM
2014 2013

Glo
bal
Loa
ns R
evie
w |
1st
3Q
20
14
DATE DEAL TYPE INDUSTRY
AMOUNT
(USD MLN)
Number of deals 1,026 20/03/2014 Facility Basic Materials 7,600.0
Volume (USD Mln) 359,074.0
Avg Deal size (USD Mln) 350.0
18/03/2014 Facility Energy 5,509.2
State Bank of India
Number of deals 75 31/03/2014 Bridge-Term Financial 4,990.8
Volume (USD Mln) 31,210.3
Avg Deal size (USD Mln) 416.1
ROY HILL HOLDINGS PTY LTD
COFCO CORP
HK ELECTRIC INVESTMENT
PEGATRON CORP
TATA STEEL LTD
YOUNGCHUN-SANGJU HIGHWAY
OVERSEA-CHINESE BANKING
SAPURAKENCANA TMC SDN BHD
TRANS RETAIL PT
ROY HILL HOLDINGS PTY LTD
DATE
ASIA PACIFIC EX-JAPAN LOANS INDUSTRY BREAKDOWN
Thailand
04/07/2014
10/01/2014
05/08/2014
10/07/2014
CP ALL PCL 25/03/2014
20/03/2014
India
Hong Kong
Taiwan
2,514.6
BAML, HSBCL, JPM
Australia
China
DEAL SIZE USD MLN
7,600.0
3,200.0
CNTRY
LARGEST ASIA PACIFIC EX-JAPAN DEALS OF 1ST 3Q 2014 BY COUNTRY
LARGEST ASIA PACIFIC EX-JAPAN DEALS OF 1ST 3Q 2014
ASIA PACIFIC EX-JAPAN LOANS QUARTERLY VOLUME
ASIA PACIFIC EX-JAPAN LOANS MARKET SHARE
4,771.6
1,300.0
3,787.1
1,401.1
4,990.8
5,500.0
1,275.0
Asia Pacific ex-Japan Loans Review
BORROWERSUMMARY
BORROWER
20/06/2014
31/03/2014
18/03/2014
Deal Activity
20/03/2014
Indonesia
Korea
Singapore
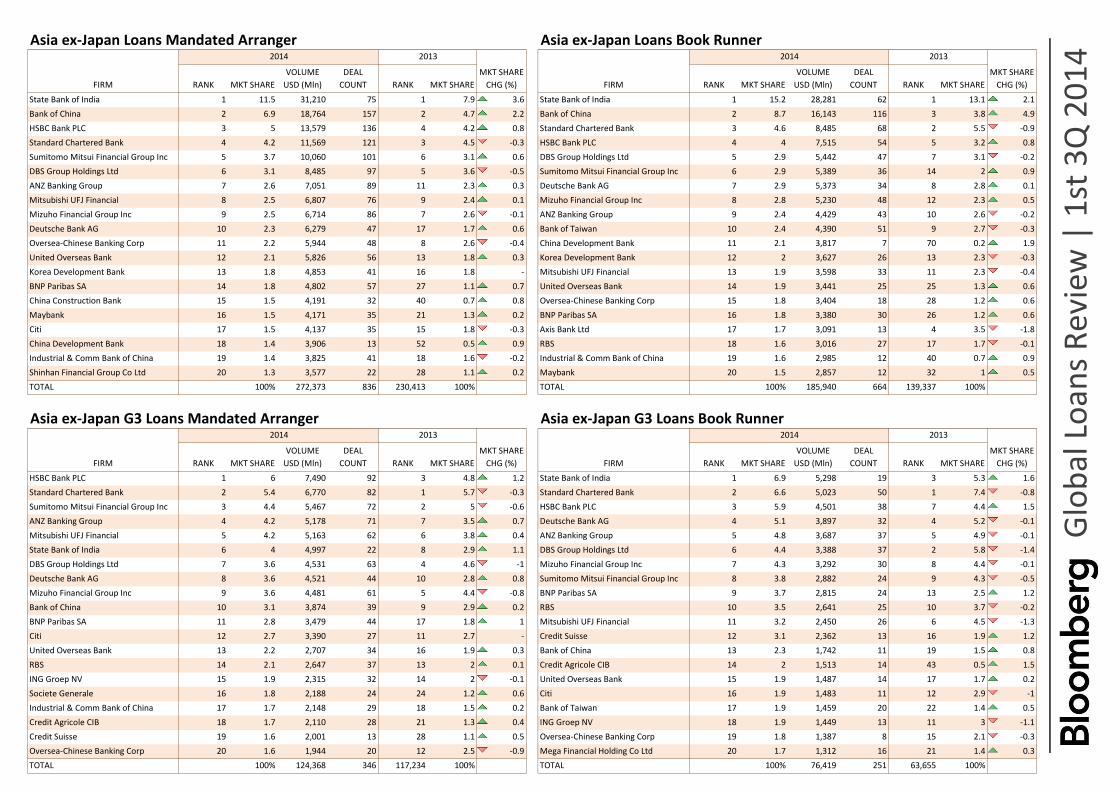
• Asia Pacific ex-Japan syndicated loans volume for the first three quarters of 2014 increased by 17%, totaling USD 359.1 billion
compared to the same period in 2013. A total of 1,026 deals were signed, a decrease of 41 deals compared to the same period last year.
• Australia & New Zealand syndicated loans volume totaled USD 86.3 billion for the first three quarters of 2014, an increase of 16% from
same period in 2013.
• The largest deal in the Asia Pacific ex-Japan region was the USD 7.6 billion project finance facility for Roy Hill Iron Ore Project. The deal
includes USD 5.5 billion from commercial banks and USD 2.1 billion from five export credit agencies.
• State Bank of India topped the Asia Pacific ex-Japan syndicated loan league table with 8.7%. ANZ Banking Group & Bank of China
ranked second and third with 6.5% and 5.4% market share respectively.
Malaysia
Arrangers:ANZ, BNPPAR, BOC, CBA, HSBCL, ICBKC, ING, KOFINA, MIZUHO, MUFG, NAB, OVCHBC,
SG, SMFGRP, WESTPC
SAPURAKENCANA TMC SDN BHD
Arrangers:ABN, AMINVB, CIMB, EXIMMY, GS, HSBCL, ING, MAYBAN, MUFG, NBAD, RHB, SMFGRP,
STANDC, UOB
OVERSEA-CHINESE BANKING CORP
Arrangers:
TOP ARRANGER
0
50
100
150
200
250
300
350
400
450
$0
$20
$40
$60
$80
$100
$120
$140
$160
Q32009
Q32010
Q32011
Q32012
Q32013
Q32014
Dea
l Co
un
t
USD
Bln
Volume Deal Count
Financial 26%
Industrial 17%
Energy 9%
Consumer, Cyclical 9%
Consumer, Non-cyclical 9%
Basic Materials 9%
Other 21%
0%
1%
2%
3%
4%
5%
6%
7%
8%
9%
10%
State Bankof India
ANZ Bank ofChina
HSBC CBA
2014 2013 2012
Glo
bal
Loa
ns R
evie
w |
1st
3Q
20
14
Asia ex-Japan Loans Mandated Arranger Asia ex-Japan Loans Book Runner
State Bank of India 1 11.5 31,210 75 1 7.9 3.6 State Bank of India 1 15.2 28,281 62 1 13.1 2.1
Bank of China 2 6.9 18,764 157 2 4.7 2.2 Bank of China 2 8.7 16,143 116 3 3.8 4.9
HSBC Bank PLC 3 5 13,579 136 4 4.2 0.8 Standard Chartered Bank 3 4.6 8,485 68 2 5.5 -0.9
Standard Chartered Bank 4 4.2 11,569 121 3 4.5 -0.3 HSBC Bank PLC 4 4 7,515 54 5 3.2 0.8
Sumitomo Mitsui Financial Group Inc 5 3.7 10,060 101 6 3.1 0.6 DBS Group Holdings Ltd 5 2.9 5,442 47 7 3.1 -0.2
DBS Group Holdings Ltd 6 3.1 8,485 97 5 3.6 -0.5 Sumitomo Mitsui Financial Group Inc 6 2.9 5,389 36 14 2 0.9
ANZ Banking Group 7 2.6 7,051 89 11 2.3 0.3 Deutsche Bank AG 7 2.9 5,373 34 8 2.8 0.1
Mitsubishi UFJ Financial 8 2.5 6,807 76 9 2.4 0.1 Mizuho Financial Group Inc 8 2.8 5,230 48 12 2.3 0.5
Mizuho Financial Group Inc 9 2.5 6,714 86 7 2.6 -0.1 ANZ Banking Group 9 2.4 4,429 43 10 2.6 -0.2
Deutsche Bank AG 10 2.3 6,279 47 17 1.7 0.6 Bank of Taiwan 10 2.4 4,390 51 9 2.7 -0.3
Oversea-Chinese Banking Corp 11 2.2 5,944 48 8 2.6 -0.4 China Development Bank 11 2.1 3,817 7 70 0.2 1.9
United Overseas Bank 12 2.1 5,826 56 13 1.8 0.3 Korea Development Bank 12 2 3,627 26 13 2.3 -0.3
Korea Development Bank 13 1.8 4,853 41 16 1.8 - Mitsubishi UFJ Financial 13 1.9 3,598 33 11 2.3 -0.4
BNP Paribas SA 14 1.8 4,802 57 27 1.1 0.7 United Overseas Bank 14 1.9 3,441 25 25 1.3 0.6
China Construction Bank 15 1.5 4,191 32 40 0.7 0.8 Oversea-Chinese Banking Corp 15 1.8 3,404 18 28 1.2 0.6
Maybank 16 1.5 4,171 35 21 1.3 0.2 BNP Paribas SA 16 1.8 3,380 30 26 1.2 0.6
Citi 17 1.5 4,137 35 15 1.8 -0.3 Axis Bank Ltd 17 1.7 3,091 13 4 3.5 -1.8
China Development Bank 18 1.4 3,906 13 52 0.5 0.9 RBS 18 1.6 3,016 27 17 1.7 -0.1
Industrial & Comm Bank of China 19 1.4 3,825 41 18 1.6 -0.2 Industrial & Comm Bank of China 19 1.6 2,985 12 40 0.7 0.9
Shinhan Financial Group Co Ltd 20 1.3 3,577 22 28 1.1 0.2 Maybank 20 1.5 2,857 12 32 1 0.5
TOTAL 100% 272,373 836 230,413 100% TOTAL 100% 185,940 664 139,337 100%
Asia ex-Japan G3 Loans Mandated Arranger Asia ex-Japan G3 Loans Book Runner
HSBC Bank PLC 1 6 7,490 92 3 4.8 1.2 State Bank of India 1 6.9 5,298 19 3 5.3 1.6
Standard Chartered Bank 2 5.4 6,770 82 1 5.7 -0.3 Standard Chartered Bank 2 6.6 5,023 50 1 7.4 -0.8
Sumitomo Mitsui Financial Group Inc 3 4.4 5,467 72 2 5 -0.6 HSBC Bank PLC 3 5.9 4,501 38 7 4.4 1.5
ANZ Banking Group 4 4.2 5,178 71 7 3.5 0.7 Deutsche Bank AG 4 5.1 3,897 32 4 5.2 -0.1
Mitsubishi UFJ Financial 5 4.2 5,163 62 6 3.8 0.4 ANZ Banking Group 5 4.8 3,687 37 5 4.9 -0.1
State Bank of India 6 4 4,997 22 8 2.9 1.1 DBS Group Holdings Ltd 6 4.4 3,388 37 2 5.8 -1.4
DBS Group Holdings Ltd 7 3.6 4,531 63 4 4.6 -1 Mizuho Financial Group Inc 7 4.3 3,292 30 8 4.4 -0.1
Deutsche Bank AG 8 3.6 4,521 44 10 2.8 0.8 Sumitomo Mitsui Financial Group Inc 8 3.8 2,882 24 9 4.3 -0.5
Mizuho Financial Group Inc 9 3.6 4,481 61 5 4.4 -0.8 BNP Paribas SA 9 3.7 2,815 24 13 2.5 1.2
Bank of China 10 3.1 3,874 39 9 2.9 0.2 RBS 10 3.5 2,641 25 10 3.7 -0.2
BNP Paribas SA 11 2.8 3,479 44 17 1.8 1 Mitsubishi UFJ Financial 11 3.2 2,450 26 6 4.5 -1.3
Citi 12 2.7 3,390 27 11 2.7 - Credit Suisse 12 3.1 2,362 13 16 1.9 1.2
United Overseas Bank 13 2.2 2,707 34 16 1.9 0.3 Bank of China 13 2.3 1,742 11 19 1.5 0.8
RBS 14 2.1 2,647 37 13 2 0.1 Credit Agricole CIB 14 2 1,513 14 43 0.5 1.5
ING Groep NV 15 1.9 2,315 32 14 2 -0.1 United Overseas Bank 15 1.9 1,487 14 17 1.7 0.2
Societe Generale 16 1.8 2,188 24 24 1.2 0.6 Citi 16 1.9 1,483 11 12 2.9 -1
Industrial & Comm Bank of China 17 1.7 2,148 29 18 1.5 0.2 Bank of Taiwan 17 1.9 1,459 20 22 1.4 0.5
Credit Agricole CIB 18 1.7 2,110 28 21 1.3 0.4 ING Groep NV 18 1.9 1,449 13 11 3 -1.1
Credit Suisse 19 1.6 2,001 13 28 1.1 0.5 Oversea-Chinese Banking Corp 19 1.8 1,387 8 15 2.1 -0.3
Oversea-Chinese Banking Corp 20 1.6 1,944 20 12 2.5 -0.9 Mega Financial Holding Co Ltd 20 1.7 1,312 16 21 1.4 0.3
TOTAL 100% 124,368 346 117,234 100% TOTAL 100% 76,419 251 63,655 100%
MKT SHARE
CHG (%)RANK MKT SHARE
VOLUME
USD (Mln)
DEAL
COUNT RANK MKT SHARE RANK MKT SHARE
VOLUME
USD (Mln)
DEAL
COUNT RANK MKT SHARE
MKT SHARE
CHG (%) FIRM
2014 2013
FIRM
2014 2013
MKT SHARE
CHG (%) FIRM
2014 2013
MKT SHARE
CHG (%)RANK MKT SHARE
VOLUME
USD (Mln)
DEAL
COUNT RANK MKT SHARE RANK MKT SHARE
VOLUME
USD (Mln)
DEAL
COUNT RANK MKT SHARE
FIRM
2014 2013

Glo
bal
Loa
ns R
evie
w |
1st
3Q
20
14
Asia-Pac ex-Japan Loans Mandated Arranger Asia-Pac ex-Japan Loans Book Runner
State Bank of India 1 8.7 31,210 75 1 5.9 2.8 State Bank of India 1 12.6 28,281 62 1 10.6 2
ANZ Banking Group 2 6.5 23,221 225 2 5.8 0.7 Bank of China 2 7.3 16,425 117 4 3.4 3.9
Bank of China 3 5.4 19,533 163 3 4.1 1.3 ANZ Banking Group 3 6.5 14,478 86 2 5.7 0.8
HSBC Bank PLC 4 4.7 16,888 171 4 3.8 0.9 HSBC Bank PLC 4 4 8,974 62 6 3.1 0.9
Commonwealth Bank Australia 5 4.1 14,841 120 5 3.8 0.3 Standard Chartered Bank 5 3.9 8,690 69 3 4.5 -0.6
National Australia Bank Ltd 6 4.1 14,687 108 8 3.3 0.8 National Australia Bank Ltd 6 3.8 8,407 31 10 2.6 1.2
Westpac Banking 7 4 14,287 125 7 3.4 0.6 Westpac Banking 7 3 6,791 36 7 2.9 0.1
Sumitomo Mitsui Financial Group Inc 8 3.5 12,658 122 9 3.2 0.3 Sumitomo Mitsui Financial Group Inc 8 2.6 5,929 39 12 2.5 0.1
Standard Chartered Bank 9 3.4 12,133 129 6 3.4 - Mizuho Financial Group Inc 9 2.6 5,894 52 14 2.3 0.3
Mitsubishi UFJ Financial 10 2.7 9,779 107 11 2.5 0.2 Commonwealth Bank Australia 10 2.5 5,611 26 5 3.3 -0.8
DBS Group Holdings Ltd 11 2.5 8,884 101 10 3.1 -0.6 DBS Group Holdings Ltd 11 2.5 5,595 48 9 2.7 -0.2
Mizuho Financial Group Inc 12 2.4 8,488 106 12 2.5 -0.1 Deutsche Bank AG 12 2.4 5,373 34 15 2.3 0.1
Deutsche Bank AG 13 1.9 6,800 54 22 1.3 0.6 Mitsubishi UFJ Financial 13 2 4,436 38 13 2.5 -0.5
Oversea-Chinese Banking Corp 14 1.9 6,775 54 13 2.3 -0.4 Bank of Taiwan 14 2 4,390 51 16 2.2 -0.2
United Overseas Bank 15 1.7 6,246 60 16 1.6 0.1 United Overseas Bank 15 1.7 3,840 27 31 1 0.7
BNP Paribas SA 16 1.7 5,957 69 29 1 0.7 China Development Bank 16 1.7 3,817 7 75 0.2 1.5
Citi 17 1.6 5,687 49 14 1.9 -0.3 RBS 17 1.6 3,691 29 19 1.6 -
Credit Agricole CIB 18 1.5 5,465 52 24 1 0.5 Korea Development Bank 18 1.6 3,627 26 18 1.9 -0.3
Korea Development Bank 19 1.4 4,853 41 19 1.4 - Oversea-Chinese Banking Corp 19 1.5 3,404 18 26 1.2 0.3
Industrial & Comm Bank of China 20 1.2 4,300 43 18 1.5 -0.3 BNP Paribas SA 20 1.5 3,380 30 22 1.3 0.2
TOTAL 100% 359,074 1,026 305,762 100% TOTAL 100% 223,947 748 172,211 100%
ASEAN Loans Mandated Arranger ASEAN Loans Book Runner
Sumitomo Mitsui Financial Group Inc 1 7.5 5,636 46 3 6 1.5 Standard Chartered Bank 1 10.8 4,413 29 1 10.3 0.5
Standard Chartered Bank 2 6.4 4,845 50 2 6.7 -0.3 Deutsche Bank AG 2 7.6 3,087 15 20 1.7 5.9
Oversea-Chinese Banking Corp 3 5.7 4,287 33 1 7.9 -2.2 Sumitomo Mitsui Financial Group Inc 3 7.5 3,069 15 13 3.1 4.4
HSBC Bank PLC 4 5.6 4,209 42 5 5.4 0.2 DBS Group Holdings Ltd 4 7 2,862 19 2 7.2 -0.2
DBS Group Holdings Ltd 5 5.4 4,048 40 4 5.9 -0.5 Maybank 5 7 2,857 12 10 3.8 3.2
Maybank 6 5 3,763 28 8 3.7 1.3 Oversea-Chinese Banking Corp 6 7 2,840 14 3 5.3 1.7
United Overseas Bank 7 4.3 3,244 28 7 4.3 - United Overseas Bank 7 4.4 1,815 11 7 4.2 0.2
Deutsche Bank AG 8 3.9 2,905 20 30 1 2.9 ANZ Banking Group 8 3.9 1,586 16 11 3.6 0.3
Mitsubishi UFJ Financial 9 3.6 2,696 28 6 4.6 -1 BNP Paribas SA 9 3.5 1,441 12 8 4.1 -0.6
ANZ Banking Group 10 3.5 2,639 35 12 2.4 1.1 HSBC Bank PLC 10 3.3 1,333 13 6 4.6 -1.3
RHB 11 3.2 2,389 11 23 1.2 2 Mizuho Financial Group Inc 11 3.1 1,273 12 14 2.6 0.5
Mizuho Financial Group Inc 12 3.1 2,358 33 9 3.4 -0.3 Credit Suisse 12 3.1 1,263 7 34 0.7 2.4
Bank of America Merrill Lynch 13 2.7 2,043 8 37 0.7 2 CIMB 13 2.8 1,145 6 19 1.8 1
CIMB 14 2.7 2,023 13 16 1.9 0.8 Mitsubishi UFJ Financial 14 2.4 982 11 5 5.1 -2.7
JP Morgan 15 2.5 1,906 4 43 0.5 2 ING Groep NV 15 2.4 978 9 12 3.5 -1.1
ING Groep NV 16 2.2 1,689 22 13 2.1 0.1 RHB 16 2.1 856 1 - - -
BNP Paribas SA 17 2 1,537 20 15 2 - BDO Capital & Investment Corp 17 1.8 751 3 4 5.3 -3.5
Credit Agricole CIB 18 1.6 1,179 14 32 0.8 0.8 Westpac Banking 18 1.6 651 3 35 0.7 0.9
Credit Suisse 19 1.4 1,057 7 39 0.6 0.8 Rabobank Nederland 19 1.2 500 4 24 1.2 -
ABN Amro Bank NV 20 1.3 980 13 35 0.8 0.5 Citi 20 1.2 482 6 30 0.9 0.3
TOTAL 100% 75,449 157 63,383 100% TOTAL 100% 40,847 97 30,675 100%
FIRM
MKT SHARE
CHG (%)
2013
MKT SHARE
CHG (%)RANK MKT SHARE
VOLUME
USD (Mln)
DEAL
COUNT RANK MKT SHARE RANK MKT SHARE
2014 2013
MKT SHARE
CHG (%) FIRM
2014
VOLUME
USD (Mln)
DEAL
COUNT RANK MKT SHARE
RANK MKT SHARE
VOLUME
USD (Mln)
DEAL
COUNT RANK MKT SHARE RANK MKT SHARE
VOLUME
USD (Mln)
DEAL
COUNTFIRM
2014 2013
MKT SHARE
CHG (%) FIRM RANK MKT SHARE
2014 2013

Glo
bal
Loa
ns R
evie
w |
1st
3Q
20
14
Australia/NZ Loans Mandated Arranger Australia/NZ Loans Book Runner
ANZ Banking Group 1 18.7 16,140 135 1 16.5 2.2 ANZ Banking Group 1 26.7 10,049 43 1 19.2 7.5
National Australia Bank Ltd 2 16 13,814 99 4 12.4 3.6 National Australia Bank Ltd 2 21.8 8,184 29 4 12.7 9.1
Commonwealth Bank Australia 3 15.4 13,312 99 2 13 2.4 Westpac Banking 3 15.4 5,781 28 3 14.5 0.9
Westpac Banking 4 14 12,107 103 3 13 1 Commonwealth Bank Australia 4 13.3 4,991 21 2 15.2 -1.9
HSBC Bank PLC 5 3.8 3,309 35 7 2.8 1 HSBC Bank PLC 5 3.9 1,459 8 9 2.9 1
Mitsubishi UFJ Financial 6 3.4 2,942 30 6 2.8 0.6 Mitsubishi UFJ Financial 6 2.2 838 5 7 3.1 -0.9
Sumitomo Mitsui Financial Group Inc 7 3 2,598 21 5 3.5 -0.5 Citi 7 1.9 731 3 8 3.1 -1.2
Credit Agricole CIB 8 2.4 2,083 13 14 1.6 0.8 RBS 8 1.8 675 2 17 1.1 0.7
Mizuho Financial Group Inc 9 2.1 1,774 20 12 2 0.1 Mizuho Financial Group Inc 9 1.8 664 4 10 2.5 -0.7
Citi 10 1.8 1,551 14 10 2.1 -0.3 Sumitomo Mitsui Financial Group Inc 10 1.4 541 3 5 4.4 -3
BNP Paribas SA 11 1.3 1,124 11 32 0.5 0.8 Bank of America Merrill Lynch 11 1.4 515 4 12 1.6 -0.2
RBS 12 1.3 1,107 7 23 0.9 0.4 United Overseas Bank 12 1.1 399 2 - - -
Scotiabank 13 1.3 1,081 11 19 1.3 - RBC Capital Markets 13 0.8 296 2 18 0.9 -0.1
ING Groep NV 14 1.2 994 7 30 0.6 0.6 Bank of China 14 0.8 282 1 14 1.5 -0.7
Bank of America Merrill Lynch 15 1 842 10 8 2.3 -1.3 First Gulf Bank PJSC 15 0.5 205 1 - - -
Oversea-Chinese Banking Corp 16 1 831 6 17 1.4 -0.4 National Bank of Abu Dhabi 15 0.5 205 1 - - -
RBC Capital Markets 17 0.9 817 7 16 1.4 -0.5 Natixis 15 0.5 205 1 - - -
Bank of China 18 0.9 769 6 9 2.2 -1.3 Standard Chartered Bank 15 0.5 205 1 - - -
Rabobank Nederland 19 0.8 717 8 25 0.7 0.1 UBS 19 0.5 196 1 15 1.2 -0.7
Societe Generale 20 0.8 664 5 54 0.1 0.7 Credit Agricole CIB 20 0.5 196 2 16 1.2 -0.7
TOTAL 100% 86,321 188 74,719 100% TOTAL 100% 37,627 82 32,244 100%
Australia Loans Mandated Arranger Australia Loans Book Runner
ANZ Banking Group 1 17.1 12,220 103 1 14.1 3 ANZ Banking Group 1 25.4 8,297 36 1 16.1 9.3
Westpac Banking 2 14.9 10,669 84 2 12.7 2.2 National Australia Bank Ltd 2 20.3 6,650 24 4 13.1 7.2
National Australia Bank Ltd 3 14.8 10,588 74 4 11.8 3 Westpac Banking 3 17.7 5,781 28 3 15 2.7
Commonwealth Bank Australia 4 14.5 10,319 74 3 12 2.5 Commonwealth Bank Australia 4 11.8 3,857 18 2 15.2 -3.4
Sumitomo Mitsui Financial Group Inc 5 3.6 2,598 21 5 3.9 -0.3 HSBC Bank PLC 5 4.5 1,459 8 9 3.1 1.4
HSBC Bank PLC 6 3.6 2,559 26 7 2.6 1 Mitsubishi UFJ Financial 6 2.6 838 5 7 3.3 -0.7
Mitsubishi UFJ Financial 7 3.4 2,395 25 6 2.9 0.5 Citi 7 2.2 731 3 8 3.2 -1
Credit Agricole CIB 8 2.9 2,083 13 14 1.8 1.1 RBS 8 2.1 675 2 17 1.2 0.9
Mizuho Financial Group Inc 9 2.5 1,774 20 10 2.2 0.3 Mizuho Financial Group Inc 9 2 664 4 10 2.7 -0.7
Citi 10 1.8 1,286 10 11 2.1 -0.3 Sumitomo Mitsui Financial Group Inc 10 1.7 541 3 5 4.6 -2.9
BNP Paribas SA 11 1.6 1,124 11 31 0.5 1.1 Bank of America Merrill Lynch 11 1.6 515 4 12 1.7 -0.1
RBS 12 1.6 1,107 7 23 1 0.6 RBC Capital Markets 12 0.9 296 2 18 1 -0.1
Scotiabank 13 1.2 887 10 19 1.4 -0.2 Bank of China 13 0.9 282 1 14 1.6 -0.7
ING Groep NV 14 1.2 869 6 30 0.6 0.6 First Gulf Bank PJSC 14 0.6 205 1 - - -
Bank of America Merrill Lynch 15 1.2 842 10 8 2.6 -1.4 National Bank of Abu Dhabi 14 0.6 205 1 - - -
Oversea-Chinese Banking Corp 16 1.2 831 6 17 1.6 -0.4 Natixis 14 0.6 205 1 - - -
RBC Capital Markets 17 1.1 817 7 16 1.6 -0.5 Standard Chartered Bank 14 0.6 205 1 - - -
Bank of China 18 1.1 769 6 9 2.6 -1.5 United Overseas Bank 14 0.6 205 1 - - -
Standard Chartered Bank 19 0.8 564 8 - - - UBS 19 0.6 196 1 15 1.3 -0.7
Societe Generale 20 0.8 543 3 54 0.1 0.7 Credit Agricole CIB 20 0.6 196 2 16 1.2 -0.6
TOTAL 100% 71,401 143 65,413 100% TOTAL 100% 32,694 67 30,482 100%
FIRM
2014 2013
MKT SHARE
CHG (%) FIRM
2014 2013
MKT SHARE
CHG (%)RANK MKT SHARE
VOLUME
USD (Mln)
DEAL
COUNT RANK MKT SHARE RANK MKT SHARE
VOLUME
USD (Mln)
DEAL
COUNT RANK MKT SHARE
MKT SHARE
CHG (%)RANK MKT SHARE
VOLUME
USD (Mln)
DEAL
COUNT RANK MKT SHARE RANK MKT SHARE
DEAL
COUNT RANK MKT SHAREFIRM
2014 2013
MKT SHARE
CHG (%) FIRM
2014 2013
VOLUME
USD (Mln)

Glo
bal
Loa
ns R
evie
w |
1st
3Q
20
14
China Loans Mandated Arranger China Loans Book Runner
Bank of China 1 31 13,372 106 1 18.9 12.1 Bank of China 1 40.9 12,981 94 1 19.6 21.3
China Development Bank 2 8.7 3,752 9 33 0.8 7.9 China Development Bank 2 11.8 3,755 6 - - -
China Construction Bank 3 4.2 1,807 5 14 2 2.2 Industrial & Comm Bank of China 3 6.2 1,958 6 19 1 5.2
HSBC Bank PLC 4 3.9 1,671 21 11 2.3 1.6 China Construction Bank 4 4.7 1,490 2 17 1.7 3
Standard Chartered Bank 5 3.6 1,557 18 8 2.7 0.9 Standard Chartered Bank 5 3.7 1,189 10 4 6 -2.3
Industrial & Comm Bank of China 6 3.4 1,476 11 6 3.1 0.3 China Citic Bank 6 3.4 1,073 18 - - -
Deutsche Bank AG 7 3.1 1,336 8 4 3.9 -0.8 Mizuho Financial Group Inc 7 3 941 9 6 4.7 -1.7
China Citic Bank 8 2.8 1,196 23 2 10 -7.2 HSBC Bank PLC 8 2.9 912 10 8 3.9 -1
Citi 9 2.6 1,135 5 15 1.9 0.7 ANZ Banking Group 9 2.1 680 7 11 3.5 -1.4
Sumitomo Mitsui Financial Group Inc 10 2.4 1,025 14 13 2.1 0.3 Deutsche Bank AG 10 1.9 602 5 3 8.8 -6.9
ANZ Banking Group 11 2.3 973 11 9 2.6 -0.3 Credit Agricole CIB 11 1.9 587 6 - - -
Shanghai Automotive Group Finance Co Ltd 12 2.2 965 1 - - - Shanghai Pudong Development Bank 12 1.3 418 2 2 11.2 -9.9
Morgan Stanley 13 1.9 836 2 22 1.4 0.5 Sumitomo Mitsui Financial Group Inc 13 1.3 416 5 18 1.4 -0.1
JP Morgan 14 1.9 821 2 28 1.2 0.7 RBS 14 1.2 396 5 10 3.6 -2.4
Mitsubishi UFJ Financial 15 1.7 749 8 29 1.2 0.5 Bank of Taiwan 15 1.2 372 3 - - -
Mizuho Financial Group Inc 16 1.7 726 11 5 3.1 -1.4 BNP Paribas SA 16 1.1 363 4 24 0.5 0.6
Westpac Banking 17 1.6 699 5 46 0.3 1.3 Mitsubishi UFJ Financial 17 1.1 339 5 21 0.7 0.4
Commonwealth Bank Australia 18 1.5 652 6 24 1.3 0.2 Citi 18 0.9 273 2 12 3.1 -2.2
DBS Group Holdings Ltd 19 1.5 630 8 10 2.5 -1 Credit Suisse 19 0.8 251 2 9 3.7 -2.9
Bank of Communications 20 1.4 617 4 12 2.3 -0.9 DBS Group Holdings Ltd 20 0.8 250 4 7 4 -3.2
TOTAL 100% 43,184 195 34,336 100% TOTAL 100% 31,721 177 20,087 100%
Hong Kong Loans Mandated Arranger Hong Kong Loans Book Runner
HSBC Bank PLC 1 13.2 6,919 55 1 10.1 3.1 HSBC Bank PLC 1 18.7 4,967 23 2 10.4 8.3
Bank of China 2 8 4,218 37 3 6.4 1.6 Bank of China 2 9.8 2,590 17 7 4.5 5.3
Standard Chartered Bank 3 7.3 3,851 32 2 7.6 -0.3 Standard Chartered Bank 3 6.1 1,619 14 1 13.5 -7.4
DBS Group Holdings Ltd 4 4 2,107 24 4 5.7 -1.7 Mitsubishi UFJ Financial 4 5.4 1,428 10 6 5.1 0.3
China Construction Bank 5 4 2,093 23 16 2.1 1.9 Mizuho Financial Group Inc 5 5.2 1,383 11 11 2.8 2.4
Sumitomo Mitsui Financial Group Inc 6 3.9 2,033 24 9 3.1 0.8 Sumitomo Mitsui Financial Group Inc 6 3.9 1,030 8 5 5.2 -1.3
Mitsubishi UFJ Financial 7 3.8 2,006 20 10 2.9 0.9 BNP Paribas SA 7 3.5 927 9 33 0.7 2.8
ANZ Banking Group 8 3.8 1,985 21 7 3.2 0.6 Credit Agricole CIB 8 3.5 918 6 - - -
Mizuho Financial Group Inc 9 3.6 1,876 21 13 2.3 1.3 United Overseas Bank 9 3.4 894 9 15 1.9 1.5
BNP Paribas SA 10 3.3 1,740 17 35 0.7 2.6 Agricultural Bank of China Ltd 10 3.2 846 5 12 2.5 0.7
United Overseas Bank 11 3.1 1,649 17 11 2.7 0.4 ANZ Banking Group 11 3.2 836 6 4 5.6 -2.4
Industrial & Comm Bank of China 12 3.1 1,615 19 5 4.6 -1.5 RBS 12 2.9 758 6 16 1.8 1.1
Oversea-Chinese Banking Corp 13 2.6 1,357 13 17 1.9 0.7 DBS Group Holdings Ltd 13 2.7 707 7 3 5.7 -3
Credit Agricole CIB 14 2.5 1,316 11 31 0.9 1.6 China Construction Bank 14 2.5 651 7 14 2.1 0.4
RBS 15 1.9 996 9 24 1.2 0.7 Industrial & Comm Bank of China 15 2.4 643 4 13 2.5 -0.1
Agricultural Bank of China Ltd 16 1.8 933 7 12 2.5 -0.7 ING Groep NV 16 2 526 4 19 1.3 0.7
Fubon Financial Holding Co Ltd 17 1.7 875 10 22 1.3 0.4 Fubon Financial Holding Co Ltd 17 1.8 475 4 18 1.3 0.5
ING Groep NV 18 1.7 871 8 26 1.1 0.6 China Merchants Bank 18 1.6 420 4 9 3.5 -1.9
Westpac Banking 19 1.5 788 7 36 0.6 0.9 Bank of Taiwan 19 1.5 403 5 17 1.7 -0.2
Bank of East Asia Ltd 20 1.3 690 11 6 3.8 -2.5 Natixis 20 1.4 359 3 44 0.4 1
TOTAL 100% 52,575 102 46,282 100% TOTAL 100% 26,524 61 18,406 100%
MKT SHARE
CHG (%) FIRM
2014 2013
MKT SHARE
CHG (%)RANK MKT SHARE
VOLUME
USD (Mln)
DEAL
COUNT RANK MKT SHARE RANK MKT SHARE
VOLUME
USD (Mln)
DEAL
COUNT RANK MKT SHARE
FIRM
2014 2013
MKT SHARE
CHG (%) FIRM
2014 2013
MKT SHARE
CHG (%)RANK MKT SHARE
VOLUME
USD (Mln)
DEAL
COUNT RANK MKT SHARE RANK MKT SHARE
VOLUME
USD (Mln)
DEAL
COUNT RANK MKT SHARE
FIRM
2014 2013
Glo
bal
Loa
ns R
evie
w |
1st
3Q
20
14
Hong Kong/Macau Loans Mandated Arranger Hong Kong/Macau Loans Book Runner
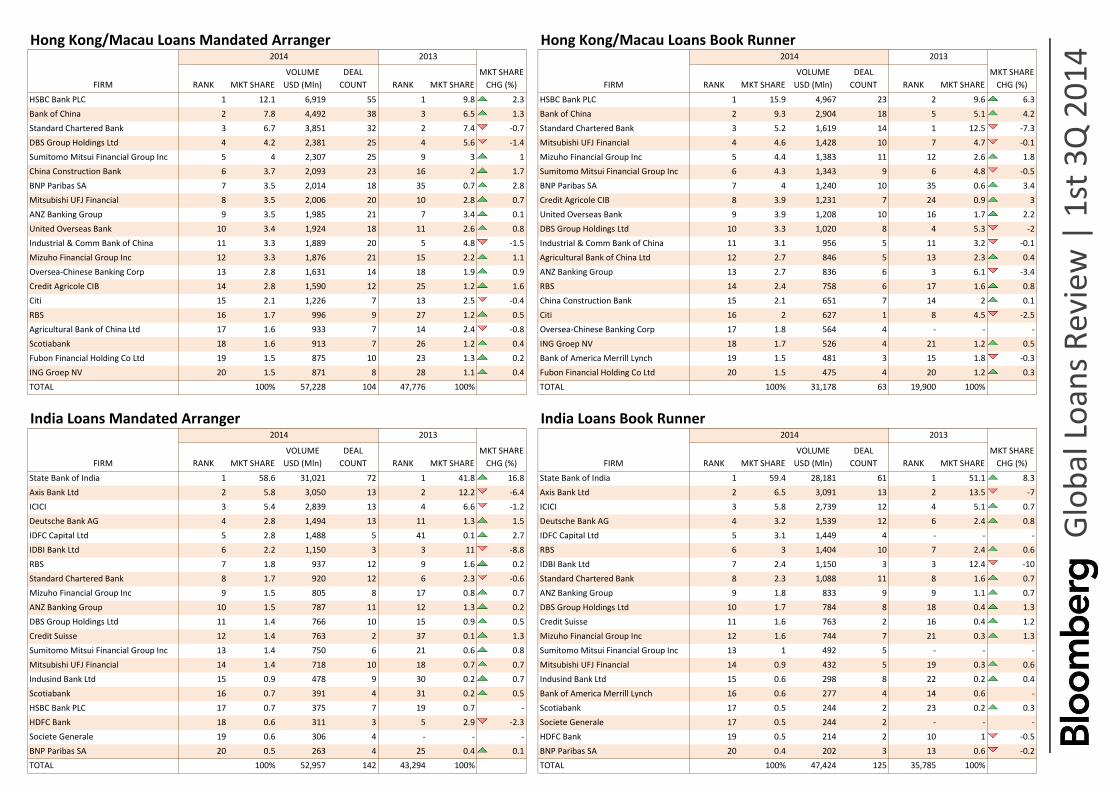
HSBC Bank PLC 1 12.1 6,919 55 1 9.8 2.3 HSBC Bank PLC 1 15.9 4,967 23 2 9.6 6.3
Bank of China 2 7.8 4,492 38 3 6.5 1.3 Bank of China 2 9.3 2,904 18 5 5.1 4.2
Standard Chartered Bank 3 6.7 3,851 32 2 7.4 -0.7 Standard Chartered Bank 3 5.2 1,619 14 1 12.5 -7.3
DBS Group Holdings Ltd 4 4.2 2,381 25 4 5.6 -1.4 Mitsubishi UFJ Financial 4 4.6 1,428 10 7 4.7 -0.1
Sumitomo Mitsui Financial Group Inc 5 4 2,307 25 9 3 1 Mizuho Financial Group Inc 5 4.4 1,383 11 12 2.6 1.8
China Construction Bank 6 3.7 2,093 23 16 2 1.7 Sumitomo Mitsui Financial Group Inc 6 4.3 1,343 9 6 4.8 -0.5
BNP Paribas SA 7 3.5 2,014 18 35 0.7 2.8 BNP Paribas SA 7 4 1,240 10 35 0.6 3.4
Mitsubishi UFJ Financial 8 3.5 2,006 20 10 2.8 0.7 Credit Agricole CIB 8 3.9 1,231 7 24 0.9 3
ANZ Banking Group 9 3.5 1,985 21 7 3.4 0.1 United Overseas Bank 9 3.9 1,208 10 16 1.7 2.2
United Overseas Bank 10 3.4 1,924 18 11 2.6 0.8 DBS Group Holdings Ltd 10 3.3 1,020 8 4 5.3 -2
Industrial & Comm Bank of China 11 3.3 1,889 20 5 4.8 -1.5 Industrial & Comm Bank of China 11 3.1 956 5 11 3.2 -0.1
Mizuho Financial Group Inc 12 3.3 1,876 21 15 2.2 1.1 Agricultural Bank of China Ltd 12 2.7 846 5 13 2.3 0.4
Oversea-Chinese Banking Corp 13 2.8 1,631 14 18 1.9 0.9 ANZ Banking Group 13 2.7 836 6 3 6.1 -3.4
Credit Agricole CIB 14 2.8 1,590 12 25 1.2 1.6 RBS 14 2.4 758 6 17 1.6 0.8
Citi 15 2.1 1,226 7 13 2.5 -0.4 China Construction Bank 15 2.1 651 7 14 2 0.1
RBS 16 1.7 996 9 27 1.2 0.5 Citi 16 2 627 1 8 4.5 -2.5
Agricultural Bank of China Ltd 17 1.6 933 7 14 2.4 -0.8 Oversea-Chinese Banking Corp 17 1.8 564 4 - - -
Scotiabank 18 1.6 913 7 26 1.2 0.4 ING Groep NV 18 1.7 526 4 21 1.2 0.5
Fubon Financial Holding Co Ltd 19 1.5 875 10 23 1.3 0.2 Bank of America Merrill Lynch 19 1.5 481 3 15 1.8 -0.3
ING Groep NV 20 1.5 871 8 28 1.1 0.4 Fubon Financial Holding Co Ltd 20 1.5 475 4 20 1.2 0.3
TOTAL 100% 57,228 104 47,776 100% TOTAL 100% 31,178 63 19,900 100%
India Loans Mandated Arranger India Loans Book Runner
State Bank of India 1 58.6 31,021 72 1 41.8 16.8 State Bank of India 1 59.4 28,181 61 1 51.1 8.3
Axis Bank Ltd 2 5.8 3,050 13 2 12.2 -6.4 Axis Bank Ltd 2 6.5 3,091 13 2 13.5 -7
ICICI 3 5.4 2,839 13 4 6.6 -1.2 ICICI 3 5.8 2,739 12 4 5.1 0.7
Deutsche Bank AG 4 2.8 1,494 13 11 1.3 1.5 Deutsche Bank AG 4 3.2 1,539 12 6 2.4 0.8
IDFC Capital Ltd 5 2.8 1,488 5 41 0.1 2.7 IDFC Capital Ltd 5 3.1 1,449 4 - - -
IDBI Bank Ltd 6 2.2 1,150 3 3 11 -8.8 RBS 6 3 1,404 10 7 2.4 0.6
RBS 7 1.8 937 12 9 1.6 0.2 IDBI Bank Ltd 7 2.4 1,150 3 3 12.4 -10
Standard Chartered Bank 8 1.7 920 12 6 2.3 -0.6 Standard Chartered Bank 8 2.3 1,088 11 8 1.6 0.7
Mizuho Financial Group Inc 9 1.5 805 8 17 0.8 0.7 ANZ Banking Group 9 1.8 833 9 9 1.1 0.7
ANZ Banking Group 10 1.5 787 11 12 1.3 0.2 DBS Group Holdings Ltd 10 1.7 784 8 18 0.4 1.3
DBS Group Holdings Ltd 11 1.4 766 10 15 0.9 0.5 Credit Suisse 11 1.6 763 2 16 0.4 1.2
Credit Suisse 12 1.4 763 2 37 0.1 1.3 Mizuho Financial Group Inc 12 1.6 744 7 21 0.3 1.3
Sumitomo Mitsui Financial Group Inc 13 1.4 750 6 21 0.6 0.8 Sumitomo Mitsui Financial Group Inc 13 1 492 5 - - -
Mitsubishi UFJ Financial 14 1.4 718 10 18 0.7 0.7 Mitsubishi UFJ Financial 14 0.9 432 5 19 0.3 0.6
Indusind Bank Ltd 15 0.9 478 9 30 0.2 0.7 Indusind Bank Ltd 15 0.6 298 8 22 0.2 0.4
Scotiabank 16 0.7 391 4 31 0.2 0.5 Bank of America Merrill Lynch 16 0.6 277 4 14 0.6 -
HSBC Bank PLC 17 0.7 375 7 19 0.7 - Scotiabank 17 0.5 244 2 23 0.2 0.3
HDFC Bank 18 0.6 311 3 5 2.9 -2.3 Societe Generale 17 0.5 244 2 - - -
Societe Generale 19 0.6 306 4 - - - HDFC Bank 19 0.5 214 2 10 1 -0.5
BNP Paribas SA 20 0.5 263 4 25 0.4 0.1 BNP Paribas SA 20 0.4 202 3 13 0.6 -0.2
TOTAL 100% 52,957 142 43,294 100% TOTAL 100% 47,424 125 35,785 100%
MKT SHARE
CHG (%)RANK MKT SHARE
VOLUME
USD (Mln)
DEAL
COUNT RANK MKT SHARE RANK MKT SHARE
VOLUME
USD (Mln)
DEAL
COUNT RANK MKT SHARE
MKT SHARE
CHG (%) FIRM
2014 2013
FIRM
2014 2013
MKT SHARE
CHG (%) FIRM
2014 2013
MKT SHARE
CHG (%)RANK MKT SHARE
VOLUME
USD (Mln)
DEAL
COUNT RANK MKT SHARE RANK MKT SHARE
VOLUME
USD (Mln)
DEAL
COUNT RANK MKT SHARE
FIRM
2014 2013

Glo
bal
Loa
ns R
evie
w |
1st
3Q
20
14
Korea Loans Mandated Arranger Korea Loans Book Runner
Korea Development Bank 1 19.6 4,009 30 1 18.1 1.5 Korea Development Bank 1 27.8 3,494 24 1 23.5 4.3
Shinhan Financial Group Co Ltd 2 17.5 3,577 22 3 11.5 6 Hana Financial Group Inc 2 17.2 2,165 12 3 14.5 2.7
KB Financial Group 3 10.6 2,173 10 4 8.4 2.2 Shinhan Financial Group Co Ltd 3 15 1,883 12 2 19.4 -4.4
Woori Finance Holdings Co Ltd 4 9.1 1,859 9 5 6.4 2.7 Woori Finance Holdings Co Ltd 4 12.6 1,582 7 5 7 5.6
Hana Financial Group Inc 5 9 1,852 14 2 12 -3 KB Financial Group 5 3.5 439 3 4 10.9 -7.4
Citi 6 3.9 802 8 13 1.8 2.1 NH Capital Co Ltd 6 3.2 401 2 - - -
Mizuho Financial Group Inc 7 2.1 440 5 6 4.9 -2.8 Meritz Securities Co Ltd 7 2.9 365 1 - - -
NH Capital Co Ltd 8 2 401 2 - - - Bookook Securities 8 2.9 364 1 - - -
Industrial Bank of Korea 9 1.9 393 3 24 0.8 1.1 Industrial Bank of Korea 9 2.7 337 2 12 1.2 1.5
Meritz Securities Co Ltd 10 1.8 365 1 - - - Mizuho Financial Group Inc 10 2.3 283 2 6 4.4 -2.1
Kyobo Life Insurance Co Ltd 11 1.7 357 2 35 0.4 1.3 Korea Investment & Securities Co 11 1.9 240 1 - - -
BNP Paribas SA 12 1.5 299 6 18 1.1 0.4 Mitsubishi UFJ Financial 12 1.6 200 1 9 2.2 -0.6
Sumitomo Mitsui Financial Group Inc 13 1.3 263 7 7 3.2 -1.9 I'm Investment & Securities Co Ltd 13 1.6 195 1 - - -
Mitsubishi UFJ Financial 14 1.2 252 5 15 1.6 -0.4 Hyundai Securities 14 1.1 135 1 - - -
Commerzbank AG 15 1.2 250 6 17 1.3 -0.1 Woori Investment & Securities Co Ltd 15 0.8 101 1 8 2.6 -1.8
Korea Investment & Securities Co 16 1.2 240 1 - - - Macquarie Group Ltd 16 0.7 93 1 - - -
HSBC Bank PLC 17 1.1 231 5 20 0.9 0.2 Deutsche Bank AG 17 0.6 72 1 - - -
I'm Investment & Securities Co Ltd 18 1 195 1 - - - DZ Bank AG 17 0.6 72 1 - - -
Bookook Securities 19 0.9 182 1 - - - Darby Hana Infrafund Asset Management 19 0.4 48 1 - - -
Standard Chartered Bank 20 0.8 174 4 8 2.9 -2.1 Citi 20 0.3 40 1 23 0.5 -0.2
TOTAL 100% 20,470 96 21,372 100% TOTAL 100% 12,557 65 13,553 100%
Taiwan Loans Mandated Arranger Taiwan Loans Book Runner
Bank of Taiwan 1 11.6 2,554 45 1 11.2 0.4 Bank of Taiwan 1 16.7 3,615 43 1 18 -1.3
Land Bank of Taiwan 2 11.3 2,494 44 3 8.1 3.2 Taiwan Cooperative Financial Holding Co 2 9.7 2,092 39 5 7 2.7
Mega Financial Holding Co Ltd 3 9.9 2,181 43 2 10.7 -0.8 Mega Financial Holding Co Ltd 3 9.5 2,068 28 2 10.2 -0.7
Taiwan Cooperative Financial Holding Co 4 9.3 2,052 55 7 5.5 3.8 Taishin Financial Holding Co Ltd 4 7.8 1,700 20 3 9.2 -1.4
Taishin Financial Holding Co Ltd 5 7.2 1,578 26 4 8 -0.8 Land Bank of Taiwan 5 7.7 1,672 31 7 6.2 1.5
CTBC Financial Holding Co Ltd 6 5.6 1,234 32 5 7.7 -2.1 Fubon Financial Holding Co Ltd 6 7.2 1,564 31 4 7.9 -0.7
First Commercial Bank 7 5.6 1,234 35 8 4.4 1.2 First Commercial Bank 7 5.6 1,204 28 8 5.1 0.5
Fubon Financial Holding Co Ltd 8 5.2 1,150 31 6 6.8 -1.6 CTBC Financial Holding Co Ltd 8 5.4 1,165 26 6 6.8 -1.4
Chang Hwa Commercial Bank 9 5.2 1,139 37 10 3.7 1.5 Chang Hwa Commercial Bank 9 3.4 730 21 12 1.7 1.7
DBS Group Holdings Ltd 10 2.8 620 14 18 1.2 1.6 Mizuho Financial Group Inc 10 2.8 607 7 16 1.5 1.3
Hua Nan Commercial Bank 11 2.3 517 13 17 1.3 1 DBS Group Holdings Ltd 11 2.4 526 9 29 0.5 1.9
Mizuho Financial Group Inc 12 2.3 510 8 14 1.7 0.6 ANZ Banking Group 12 2.3 493 5 23 0.8 1.5
ANZ Banking Group 13 2 442 6 26 0.8 1.2 United Overseas Bank 13 1.7 372 3 - - -
Mitsubishi UFJ Financial 14 1.8 386 5 21 1.1 0.7 Taiwan Business Bank 14 1.6 348 6 13 1.7 -0.1
Taiwan Business Bank 15 1.5 321 10 13 1.7 -0.2 E.Sun Financial Holding Co Ltd 15 1.4 312 14 11 2.4 -1
United Overseas Bank 16 1.4 304 3 - - - Hua Nan Commercial Bank 16 1.4 299 7 14 1.5 -0.1
E.Sun Financial Holding Co Ltd 17 1.3 298 16 9 4 -2.7 Industrial Bank of Taiwan 17 1.1 240 6 21 0.9 0.2
Industrial Bank of Taiwan 18 1.1 240 6 19 1.2 -0.1 Cathay United Bank Co Ltd 18 1 220 3 9 3.3 -2.3
Bank of Communications 19 1 217 1 - - - Bank of Communications 19 1 217 1 - - -
Scotiabank 19 1 217 1 - - - Mitsubishi UFJ Financial 19 1 217 1 20 1.2 -0.2
TOTAL 100% 22,072 138 19,830 100% TOTAL 100% 21,677 134 18,943 100%
FIRM
MKT SHARE
CHG (%)
2013
MKT SHARE
CHG (%)RANK MKT SHARE
VOLUME
USD (Mln)
DEAL
COUNT RANK MKT SHARE RANK MKT SHARE
2014 2013
MKT SHARE
CHG (%) FIRM
2014
VOLUME
USD (Mln)
DEAL
COUNT RANK MKT SHARE
RANK MKT SHARE
VOLUME
USD (Mln)
DEAL
COUNT RANK MKT SHARE RANK MKT SHARE
VOLUME
USD (Mln)
DEAL
COUNTFIRM
2014 2013
MKT SHARE
CHG (%) FIRM RANK MKT SHARE
2014 2013

Glo
bal
Loa
ns R
evie
w |
1st
3Q
20
14
Singapore Loans Mandated Arranger Singapore Loans Book Runner
Standard Chartered Bank 1 8 3,060 22 8 3.4 4.6 Standard Chartered Bank 1 15.3 3,277 14 3 7.5 7.8
HSBC Bank PLC 2 8 3,029 19 4 5.3 2.7 Sumitomo Mitsui Financial Group Inc 2 10.2 2,197 5 11 3.3 6.9
DBS Group Holdings Ltd 3 7.7 2,929 26 1 11.4 -3.7 DBS Group Holdings Ltd 3 9.4 2,022 10 1 11.4 -2
Oversea-Chinese Banking Corp 4 7.2 2,753 16 2 10.8 -3.6 Oversea-Chinese Banking Corp 4 9.4 2,013 6 9 3.6 5.8
Sumitomo Mitsui Financial Group Inc 5 6.2 2,357 14 5 5.1 1.1 Maybank 5 7 1,497 5 25 1.4 5.6
United Overseas Bank 6 5.3 2,012 14 3 7.8 -2.5 Deutsche Bank AG 6 6.7 1,439 7 13 3.2 3.5
Bank of America Merrill Lynch 7 5 1,886 4 32 0.7 4.3 United Overseas Bank 7 6.1 1,306 5 5 6.1 -
JP Morgan 8 4.9 1,849 2 28 0.7 4.2 BNP Paribas SA 8 5.2 1,122 8 2 8.9 -3.7
Maybank 9 4.2 1,616 11 10 2.9 1.3 HSBC Bank PLC 9 4.3 933 8 4 6.9 -2.6
ANZ Banking Group 10 3.8 1,457 17 15 2.5 1.3 ING Groep NV 10 4.1 880 8 6 4.9 -0.8
Deutsche Bank AG 11 3.4 1,310 8 34 0.6 2.8 ANZ Banking Group 11 3.1 674 7 10 3.5 -0.4
Credit Agricole CIB 12 2.7 1,038 9 26 1 1.7 Westpac Banking 12 3 651 3 23 1.5 1.5
BNP Paribas SA 13 2.2 840 11 11 2.8 -0.6 Rabobank Nederland 13 1.8 381 2 15 2.3 -0.5
Bank of China 14 2.2 821 10 6 3.9 -1.7 Mizuho Financial Group Inc 14 1.7 356 1 - - -
CIMB 15 2.1 790 4 20 1.3 0.8 ABN Amro Bank NV 15 1.3 270 3 20 1.7 -0.4
ING Groep NV 16 2 779 13 12 2.8 -0.8 DZ Bank AG 16 1.2 261 2 24 1.5 -0.3
Rabobank Nederland 17 1.9 715 9 24 1 0.9 Bank of China 17 1 217 3 26 1.1 -0.1
Mitsubishi UFJ Financial 18 1.6 592 8 7 3.9 -2.3 Commonwealth Bank Australia 18 0.8 170 1 8 4.7 -3.9
ABN Amro Bank NV 19 1.4 515 11 35 0.6 0.8 National Australia Bank Ltd 18 0.8 170 1 17 2.1 -1.3
Mizuho Financial Group Inc 20 1.3 499 6 17 2.3 -1 DnB ASA 20 0.7 150 2 27 0.7 -
TOTAL 100% 38,075 64 24,362 100% TOTAL 100% 21,478 38 13,027 100%
Indonesia Loans Mandated Arranger Indonesia Loans Book Runner
Sumitomo Mitsui Financial Group Inc 1 6.7 980 13 9 4.3 2.4 Credit Suisse 1 9.6 988 5 23 0.9 8.7
Credit Suisse 2 6.7 970 5 37 0.5 6.2 Standard Chartered Bank 2 8.4 865 10 4 7.4 1
Mitsubishi UFJ Financial 3 6.5 948 12 6 4.8 1.7 Mitsubishi UFJ Financial 3 7.3 752 7 8 4.3 3
Mizuho Financial Group Inc 4 6.4 938 11 8 4.5 1.9 DBS Group Holdings Ltd 4 7.1 726 7 3 8.7 -1.6
ANZ Banking Group 5 5.9 863 12 10 4 1.9 Deutsche Bank AG 5 6.5 673 7 16 1.7 4.8
DBS Group Holdings Ltd 6 5.6 811 11 4 5.3 0.3 ANZ Banking Group 6 6 616 5 12 3.5 2.5
Standard Chartered Bank 7 4.8 703 13 3 5.3 -0.5 Mizuho Financial Group Inc 7 5.7 590 6 7 4.6 1.1
HSBC Bank PLC 8 4.4 641 12 5 5.1 -0.7 Sumitomo Mitsui Financial Group Inc 8 5.3 546 5 13 3.3 2
Oversea-Chinese Banking Corp 9 3.8 559 8 1 9.2 -5.4 Oversea-Chinese Banking Corp 9 4.3 437 4 1 11.6 -7.3
Deutsche Bank AG 10 3.7 545 8 27 1.3 2.4 Citi 10 4.2 432 5 28 0.7 3.5
United Overseas Bank 11 3.3 481 7 14 2.5 0.8 HSBC Bank PLC 11 3.9 400 5 6 5.2 -1.3
BNP Paribas SA 12 3.2 471 7 19 1.9 1.3 RBS 12 3.9 398 5 9 4.2 -0.3
Societe Generale 13 2.6 382 3 22 1.5 1.1 United Overseas Bank 13 3.3 335 3 15 2.2 1.1
ING Groep NV 14 2.5 371 4 15 2.4 0.1 BNP Paribas SA 14 2.8 287 3 17 1.6 1.2
Citi 15 2.5 365 6 13 2.7 -0.2 Bank Negara Indonesia (Persero) Tbk PT 15 2.6 263 3 2 10.2 -7.6
RBS 16 2.4 356 6 16 2.3 0.1 Maybank 16 2.3 234 3 23 0.9 1.4
Maybank 17 2.4 347 7 12 2.9 -0.5 Bank CIMB Niaga Tbk PT 17 1.4 143 2 22 1.5 -0.1
CTBC Financial Holding Co Ltd 18 2.2 324 8 20 1.9 0.3 Societe Generale 18 1.4 143 1 - - -
Bank CIMB Niaga Tbk PT 19 2 287 5 11 2.9 -0.9 Commerzbank AG 19 1.3 131 1 20 1.5 -0.2
Bank Negara Indonesia (Persero) Tbk PT 20 1.6 234 4 2 5.7 -4.1 Bank Mandiri 20 1.3 130 1 11 3.6 -2.3
TOTAL 100% 14,567 42 11,184 100% TOTAL 100% 10,283 29 6,463 100%
FIRM
2014 2013
MKT SHARE
CHG (%) FIRM
2014 2013
MKT SHARE
CHG (%)RANK MKT SHARE
VOLUME
USD (Mln)
DEAL
COUNT RANK MKT SHARE RANK MKT SHARE
VOLUME
USD (Mln)
DEAL
COUNT RANK MKT SHARE
MKT SHARE
CHG (%)RANK MKT SHARE
VOLUME
USD (Mln)
DEAL
COUNT RANK MKT SHARE RANK MKT SHARE
DEAL
COUNT RANK MKT SHAREFIRM
2014 2013
MKT SHARE
CHG (%) FIRM
2014 2013
VOLUME
USD (Mln)

Glo
bal
Loa
ns R
evie
w |
1st
3Q
20
14
Malaysia Loans Mandated Arranger Malaysia Loans Book Runner
RHB 1 14.2 2,043 7 6 6.4 7.8 Deutsche Bank AG 1 18.5 975 1 - - -
Maybank 2 11.6 1,670 7 1 12.4 -0.8 Maybank 2 18.4 972 2 1 20.7 -2.3
Sumitomo Mitsui Financial Group Inc 3 7 1,012 9 10 4.2 2.8 CIMB 3 16.9 894 3 9 3.3 13.6
Deutsche Bank AG 4 6.8 975 1 - - - RHB 4 16.2 856 1 - - -
Oversea-Chinese Banking Corp 5 6.8 975 9 4 10.7 -3.9 Oversea-Chinese Banking Corp 5 7.4 390 4 4 11 -3.6
CIMB 6 6.6 947 4 7 5.6 1 ANZ Banking Group 6 5 265 3 - - -
Standard Chartered Bank 7 5.3 759 6 3 10.9 -5.6 Natixis 7 3.4 179 1 - - -
United Overseas Bank 8 5 713 5 9 4.3 0.7 United Overseas Bank 8 3.3 175 3 7 5.6 -2.3
Mitsubishi UFJ Financial 9 4.3 615 2 5 7.1 -2.8 Mizuho Financial Group Inc 9 2.5 133 2 - - -
Export-Import Bank of Malaysia Bhd 10 3.8 546 2 21 0.9 2.9 AmInvestment Bank Bhd 10 1.7 92 2 6 8.3 -6.6
AmInvestment Bank Bhd 11 3.5 506 3 2 11 -7.5 DBS Group Holdings Ltd 11 1.6 83 1 - - -
ABN Amro Bank NV 12 2.9 421 1 14 2.2 0.7 Scotiabank 11 1.6 83 1 - - -
Goldman Sachs & Co 12 2.9 421 1 - - - Standard Chartered Bank 13 0.9 50 1 2 19.4 -18.5
ING Groep NV 12 2.9 421 1 - - - Wells Fargo & Co 13 0.9 50 1 - - -
National Bank of Abu Dhabi 12 2.9 421 1 - - - Hong Leong Investment Bank Bhd 15 0.8 42 1 - - -
Mizuho Financial Group Inc 16 2.6 369 4 17 1.2 1.4 Sumitomo Mitsui Financial Group Inc 15 0.8 42 1 - - -
HSBC Bank PLC 17 2.6 369 6 11 4.1 -1.5
DBS Group Holdings Ltd 18 1.9 276 2 15 1.7 0.2
BNP Paribas SA 19 1.3 194 1 12 3.4 -2.1
ANZ Banking Group 20 1.3 191 3 - - -
TOTAL 100% 14,397 21 9,439 100% TOTAL 100% 5,279 11 3,672 100%
Thailand Loans Mandated Arranger Thailand Loans Book Runner
Krung Thai Bank 1 25.6 891 2 2 13.9 11.7 Kasikornbank PCL 1 28.7 99 2 2 30.3 -1.6
Sumitomo Mitsui Financial Group Inc 2 25.6 888 2 3 10.5 15.1 Mega Financial Holding Co Ltd 2 22.6 78 2 - - -
Siam Commercial Bank PCL 3 24.8 863 2 1 17.8 7 E.Sun Financial Holding Co Ltd 3 10.4 36 1 - - -
Mizuho Financial Group Inc 4 3 103 2 9 3.2 -0.2 Far Eastern International Bank 3 10.4 36 1 - - -
Kasikornbank PCL 5 2.6 91 2 8 7.9 -5.3 Taishin Financial Holding Co Ltd 3 10.4 36 1 - - -
Mega Financial Holding Co Ltd 6 2 68 2 - - - Taiwan Cooperative Financial Holding Co 3 10.4 36 1 - - -
Bank of Ayudhya PCL 7 1.5 53 1 - - - Siam Commercial Bank PCL 7 7 24 1 1 69.7 -62.7
Government Savings Bank 7 1.5 53 1 - - -
Tisco Bank PCL 7 1.5 53 1 - - -
ANZ Banking Group 10 1.4 50 1 - - -
HSBC Bank PLC 10 1.4 50 1 5 9.2 -7.8
Rabobank Nederland 10 1.4 50 1 - - -
Standard Chartered Bank 10 1.4 50 1 5 9.2 -7.8
UBS 10 1.4 50 1 5 9.2 -7.8
E.Sun Financial Holding Co Ltd 15 0.7 26 1 - - -
Far Eastern International Bank 15 0.7 26 1 - - -
Land Bank of Taiwan 15 0.7 26 1 - - -
Taishin Financial Holding Co Ltd 15 0.7 26 1 - - -
Taiwan Cooperative Financial Holding Co 15 0.7 26 1 - - -
Yuanta Financial Holding Co Ltd 15 0.7 26 1 - - -
TOTAL 100% 3,475 8 9,340 100% TOTAL 100% 346 5 1,296 100%
FIRM
2014 2013
MKT SHARE
CHG (%) FIRM
2014 2013
MKT SHARE
CHG (%)
FIRM RANK MKT SHARE
VOLUME
USD (Mln)
DEAL
COUNT RANK MKT SHARE RANK MKT SHARE
MKT SHARE
CHG (%) FIRM
2014
VOLUME
USD (Mln)
DEAL
COUNT
RANK MKT SHARE
VOLUME
USD (Mln)
DEAL
COUNT RANK MKT SHARE RANK MKT SHARE
VOLUME
USD (Mln)
DEAL
COUNT RANK MKT SHARE
2014 2013
RANK MKT SHARE
2013
MKT SHARE
CHG (%)

Bloomberg Syndicated Loans - League Tables Criteria
General Guidelines
For a signed, syndicated loan transaction to receive credit in Bloomberg league tables, Bloomberg must be notified of the following information:
Agent
Borrower’s country of origin
Borrower’s industry
Borrower’s name
Capital structure rank
Currency
Execution/Funding date
Fees
Maturity date/Tenor
Parent name
Pricing
Syndicate list with titles
Total deal amount
Tranche amounts
Tranche types
Credit is awarded as of the credit agreement’s signing date, regardless of subsequent events related to the transaction; with the exception of Asia-Pacific transactions signed in senior syndication (documentation required); for which credit is awarded only on the syndication completion date.
Regional and local tables are based upon the principal borrower’s country of incorporation, with the exception of Asia-Pacific and Latin American tables, which are based upon the principal borrower’s country of risk.
Treatment of Cross-Border Deals:
Any cross-border deals must be accompanied by documentation disclosing:
Majority market of syndication of the lenders
Base currency
Location of the bank meeting
Domicile of the primary borrower
Guarantor(s) location
Additional borrowers & their locations
Primary borrower’s principal operations & locations
Market of syndication is the primary consideration for any challenge decision. Bloomberg reserves the right on final decisions on any cross border transaction.
I. Amendments / Amended and Restated Agreements
Credit is allocated to amended or amended and restated transactions, where each modification is 100% at the lender’s option and not as a result of events already built into the original credit agreement. Credit is awarded for the following structural changes only:
Maturity is extended for a period of 90 days or more. A limitation of one amended maturity update is allowed full credit per loan, per year.*
Credit is allocated on incremental basis for increases in deal size.
Reduction in pricing.
Full release of collateral.

Bloomberg Syndicated Loans - League Tables Criteria
Eligible Roles and Credit Allocation
Full credit is awarded to the sole bank satisfying the highest of the titles as detailed below. Credit will be awarded equally among multiple banks that share the highest title. Arrangers or bookrunners under the same parent are treated as one bank. There is no limit on the number of arranger or bookrunner titles on any syndicated loan.
Note: U.S./Canada underwriter tables are driven by the bookrunner(s). If there is no bookrunner(s) title given on a deal, all league credit is then awarded to the bank(s) holding the highest arranger title.
Bookrunner Tables
Asia-Pacific/EMEA/Latin America: Bookrunner
U.S./Canada: Bookrunner, joint bookrunner Arranger Tables
Asia-Pacific/EMEA/Latin America: Mandated lead arranger
U.S./Canada: Lead arranger, joint lead arranger Table Types Leveraged: Eligible loans will be considered for credit in the leverage tables in three instances only:
All eligible loans with non-investment grade ratings from both Moody’s and S&P (Moody’s: Ba1 and below, S&P: BB+ and below) will automatically be considered., or
Loans not specifically rated non-investment grade, but where the borrowing entity is, then loans for borrowers with Corporate Family Ratings of Ba1 or lower from Moody’s and Issuer Ratings of BB+ or lower from S&P will also be considered for leveraged tables; or
Loans will also be considered leveraged if both the loan and specific borrower are not rated but: a. The primary use of proceeds is either LBO, MBO, recapitalization, secondary buyout; or b. The loan has an equity sponsor; or c. (Margin at close) + (Higher of LIBOR Floor or current index value) + ((100.0 – OID)/4 year average life) * 100 >= 300 BPS (U.S. only).
Exclusions
Bilateral transactions.
Transactions with a maturity of less than 90 days.
Cancelled or withdrawn transactions that are not signed prior to the deal’s cancellation or withdrawal. Full versions of Bloomberg’s League Tables Standards & Guidelines can be accessed on Bloomberg Professional:
{IDOC 2065648 <GO>}: Syndicated Loans {IDOC 2016701 <GO>}: Equity {IDOC 2016703 <GO>}: Fixed Income DISCLAIMER Bloomberg L.P. Syndicated Loans League Tables represent transactions that are executed and for which Bloomberg has been notified. Bloomberg L.P. reserves the right of final decision concerning league eligibility and requires adequate documentation for the same. Bloomberg L.P. and its suppliers believe the information herein was obtained from reliable sources, but they do not guarantee its accuracy. Neither the information nor the opinion expressed constitutes a solicitation of the purchase or sale of securities or commodities. Due to the dynamic nature of the Professional Service product, League Table rankings may vary between the quarterly/year-end publications and data found on the Bloomberg Professional Service. Accuracy Claims & Inquiries: All League Table participants have the right to examine the accuracy of League Table data as published on the Bloomberg Professional Service. All accuracy claims and inquiries must be submitted in writing and with adequate explanation and documentation. Bloomberg will investigate all accuracy claims and inquiries in a timely manner, but cannot assure completion of its investigation by the respective League Table deadline.