Embed Size (px)
Citation preview

Division of Cancer Prevention and Control
National Center for Chronic Disease Prevention and Health Promotion
Global Surveillance of Cancer Survival
(CONCORD-2 Study)
Hannah K Weir, Michel P Coleman, Benard Rachet,
Claudia Allemani on behalf of the CONCORD Working Group

Outline
• History of the CONCORD Programme
• The first CONCORD Study
• The CONCORD-2 Study
• Future Plans

Outline
• History of the CONCORD Programme
• London School of Hygiene and Tropical Medicine
• Michel P Coleman and Benard Rachet (co-PIs)
• The first CONCORD Study
• The CONCORD-2 Study
• Future Plans

EUROCARE
http://www.eurocare.it/

EUROCARE
Diagnosis Years Countries Registries
EUROCARE 1 1978 - 84 11 30
EUROCARE 2 1985 - 89 17 48
EUROCARE 3 1990 - 94 21 70
EUROCARE 4 1995 - 99 23 93
EUROCARE 5 2000 - 07 29 116

The Role of Population-based Survival in Evaluating Health Care
Clinical trials highest achievable survival
Population-based average survival achieved
Coleman, 1999
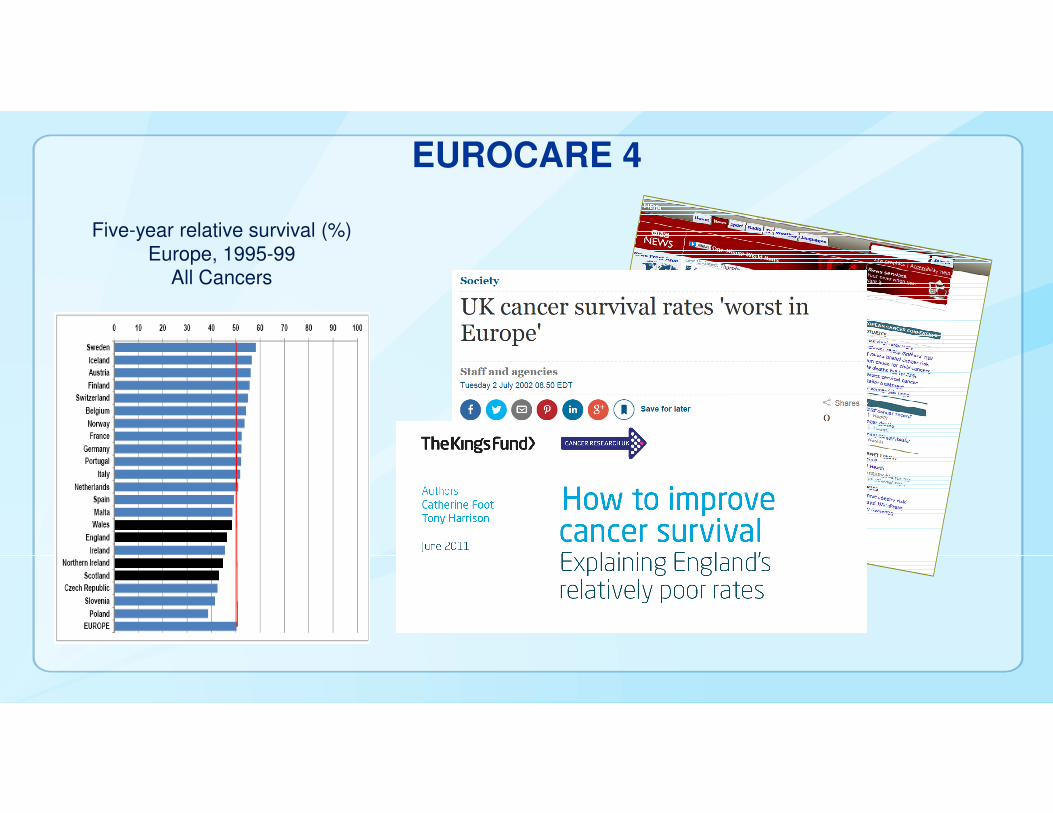
EUROCARE 4
Five-year relative survival (%)
Europe, 1995-99All Cancers

UK National Cancer Strategies: response to poor UK cancer survival (EUROCARE 4)

Cancer survival (5-years) in EUROCARE 2 and SEER-9: patients diagnosed 1985-89
Gatta G, Capocaccia R, Coleman MP, Ries LA, et al. Toward a comparison
of survival in American and European cancer patients.
Cancer. 2000 Aug 15;89(4):893-900.
0 20 40 60 80 100
Stomach
Colon
Rectum
Lung
Breast
Melanoma
Cervix
Uterus
Ovary
Prostate
Hodgkins
NHL
Europe SEER

Outline
• History of the CONCORD Programme
• The first CONCORD Study
• The CONCORD-2 Study
• Future Plans
CONCORD
Long-term trends, 4 common cancers
– Patients diagnosed 1990-1995
– Follow-up to 1999
– Colorectum, lung, breast (women), prostate

Population-based Cancer Survival in High Income Countries
EUROCARE
Patients
diagnosed Countries
Cancer
registries Year
1 1978 – 1984 11 30 1995
2 1985 – 1989 17 48 1999
3 1990 – 1994 20 66 2003
CONCORD 1990 – 1994 31 101 2008

North American Coverage


CONCORD Study
Coleman MP, Quaresma M, Berrino F, Lutz JM, De
Angelis R, Capocaccia R, Baili P, Rachet B, Gatta
G, Hakulinen T, Micheli A, Sant M, Weir HK, Elwood
JM, Tsukuma H, Koifman S, E Silva GA, Francisci S,
Santaquilani M, Verdecchia A, Storm HH, Young JL;
CONCORD Working Group. Cancer survival in five continents: a worldwide population-based study (CONCORD). Lancet Oncol. 2008
Aug;9(8):730-56

Five-year relative survival (%) -breast cancer, women (15-99 years)
50.7
41.7
5.6
1.0
0 20 40 60 80 100
CUBA
USA
CANADA
SWEDEN
JAPAN
AUSTRALIA
FINLAND
FRANCE
ITALY
ICELAND
SPAIN
NETHERLANDS
NORWAY
SWITZERLAND
GERMANY
AUSTRIA
DENMARK
MALTA
PORTUGAL
N IRELAND
SCOTLAND
ENGLAND
IRELAND
WALES
SLOVENIA
POLAND
CZECH REP.
ESTONIA
BRAZIL
SLOVAKIA
ALGERIA BREAST (F)
*

Five-year relative survival (%) -prostate cancer, (15-99 years)
65.6
26.3
7.0
0 20 40 60 80 100
USA
AUSTRIA
CANADA
AUSTRALIA
GERMANY
FRANCE
ICELAND
CUBA
NETHERLANDS
SWEDEN
ITALY
NORWAY
FINLAND
IRELAND
SPAIN
ESTONIA
SCOTLAND
N IRELAND
ENGLAND
CZECH REP.
JAPAN
BRAZIL
WALES
PORTUGAL
SLOVAKIA
MALTA
SLOVENIA
DENMARK
POLAND
ALGERIA PROSTATE
*

Five-year relative survival (%) -colon cancer, women (15-99 years)
50
40.2
6.9
2.1
0 20 40 60 80 100
CUBA
FRANCE
USA
AUSTRIA
CANADA
MALTA
AUSTRALIA
JAPAN
SPAIN
GERMANY
NETHERLANDS
ICELAND
SWEDEN
FINLAND
NORWAY
ITALY
N IRELAND
DENMARK
IRELAND
SCOTLAND
PORTUGAL
ENGLAND
SLOVAKIA
SLOVENIA
ESTONIA
WALES
CZECH REP.
BRAZIL
POLAND
ALGERIA COLON (F)
*

Five-year relative survival (%) -colon cancer, men (15-99 years)
50
39.4
7.0
0 20 40 60 80 100
JAPAN
USA
CUBA
AUSTRALIA
FRANCE
AUSTRIA
CANADA
FINLAND
SPAIN
NETHERLANDS
SWEDEN
ITALY
GERMANY
NORWAY
IRELAND
PORTUGAL
ICELAND
N IRELAND
SCOTLAND
DENMARK
ENGLAND
SLOVAKIA
WALES
ESTONIA
MALTA
CZECH REP.
SLOVENIA
BRAZIL
POLAND
ALGERIA COLON (M)
*

Five-year relative survival (%) -rectum cancer, women (15-99 years)
39.9
49.3
7.4
2.4
0 20 40 60 80 100
FRANCE
CUBA
USA
AUSTRALIA
CANADA
SWEDEN
JAPAN
NORWAY
NETHERLANDS
FINLAND
MALTA
IRELAND
GERMANY
SPAIN
ITALY
ICELAND
SCOTLAND
DENMARK
ENGLAND
AUSTRIA
PORTUGAL
N IRELAND
WALES
CZECH REP.
BRAZIL
SLOVENIA
SLOVAKIA
ESTONIA
POLAND
ALGERIA RECTUM (F)
*

Five-year relative survival (%) -rectum cancer, men (15-99 years)
38.5
49.7
8.2
2.9
0 20 40 60 80 100
CUBA
JAPAN
USA
NETHERLANDS
AUSTRALIA
CANADA
SWEDEN
FRANCE
ICELAND
NORWAY
SPAIN
FINLAND
BRAZIL
N IRELAND
GERMANY
ITALY
AUSTRIA
DENMARK
PORTUGAL
SCOTLAND
IRELAND
ENGLAND
WALES
MALTA
SLOVENIA
ESTONIA
CZECH REP.
POLAND
SLOVAKIA
ALGERIA RECTUM (M)
*

Five-year relative survival (%) -breast cancer,women (15-99 years):USA, by race
0 20 40 60 80 100
NEW YORK CITY NY
NEW YORK STATE
MICHIGAN
NEW JERSEY
LOUISIANA
WYOMING
NEW MEXICO
FLORIDA
LOS ANGELES CA
RHODE ISLAND
CALIFORNIA
NEBRASKA
DETROIT MI
UTAH
IDAHO
CONNECTICUT
IOWA
COLORADO
SAN FRANCISCO CA
SEATTLE WA
ATLANTA
HAWAII

Five-year relative survival (%) -prostate cancer,(15-99 years):USA, by race
0 20 40 60 80 100
NEW YORK CITY NY
NEW YORK STATE
FLORIDA
SAN FRANCISCO CA
CALIFORNIA
NEW JERSEY
LOUISIANA
RHODE ISLAND
IDAHO
WYOMING
LOS ANGELES CA
CONNECTICUT
HAWAII
IOWA
NEW MEXICO
COLORADO
NEBRASKA
UTAH
DETROIT MI
SEATTLE WA
ATLANTA
MICHIGAN *

Five-year relative survival (%) -colon cancer,women (15-99 years):USA, by race
0 20 40 60 80 100
NEW YORK CITY NY
NEW YORK STATE
WYOMING
UTAH
LOS ANGELES CA
CALIFORNIA
MICHIGAN
LOUISIANA
DETROIT MI
SAN FRANCISCO CA
NEW MEXICO
HAWAII
FLORIDA
NEW JERSEY
COLORADO
IDAHO
RHODE ISLAND
ATLANTA
SEATTLE WA
CONNECTICUT
IOWA
NEBRASKA

Five-year relative survival (%) -colon cancer,men (15-99 years):USA, by race
0 20 40 60 80 100
NEW YORK CITY NY
NEW YORK STATE
MICHIGAN
NEBRASKA
SAN FRANCISCO CA
WYOMING
FLORIDA
CALIFORNIA
UTAH
IOWA
IDAHO
NEW JERSEY
LOS ANGELES CA
LOUISIANA
NEW MEXICO
COLORADO
DETROIT MI
CONNECTICUT
SEATTLE WA
RHODE ISLAND
ATLANTA
HAWAII
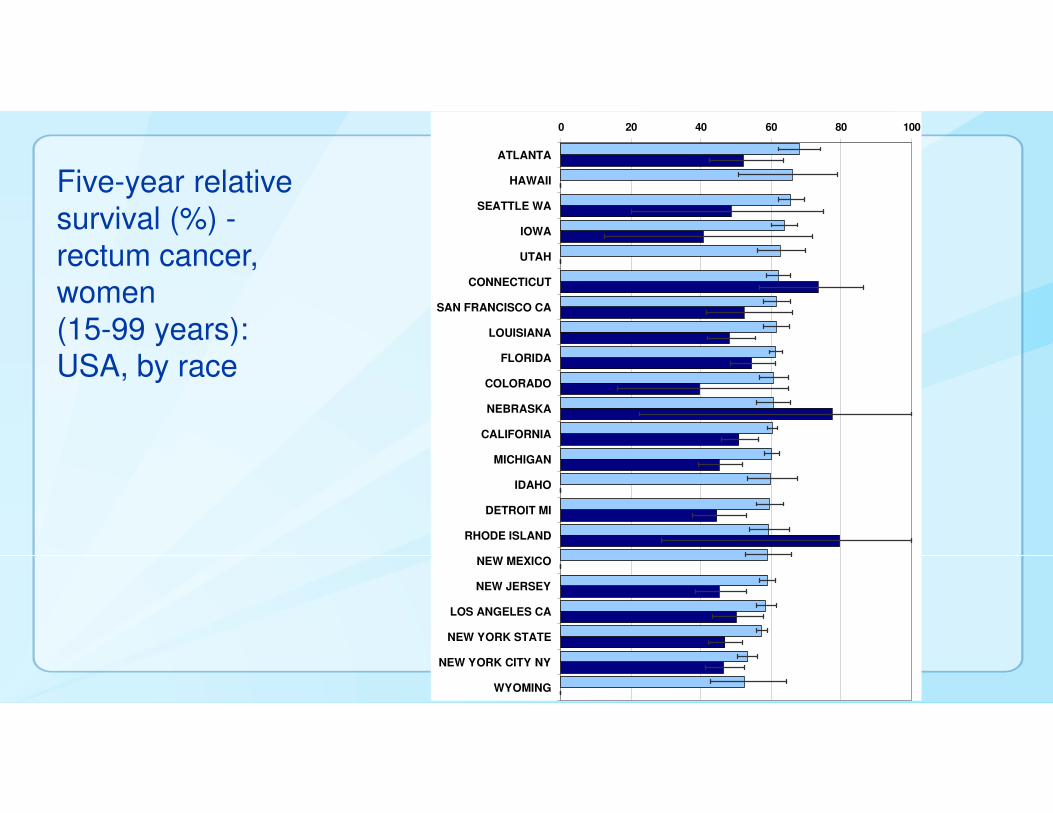
Five-year relative survival (%) -rectum cancer,women (15-99 years):USA, by race
0 20 40 60 80 100
WYOMING
NEW YORK CITY NY
NEW YORK STATE
LOS ANGELES CA
NEW JERSEY
NEW MEXICO
RHODE ISLAND
DETROIT MI
IDAHO
MICHIGAN
CALIFORNIA
NEBRASKA
COLORADO
FLORIDA
LOUISIANA
SAN FRANCISCO CA
CONNECTICUT
UTAH
IOWA
SEATTLE WA
HAWAII
ATLANTA

Five-year relative survival (%) -rectum cancer,men (15-99 years):USA, by race
0 20 40 60 80 100
WYOMING
NEW YORK CITY NY
NEW MEXICO
HAWAII
COLORADO
LOS ANGELES CA
NEW YORK STATE
MICHIGAN
NEW JERSEY
SAN FRANCISCO CA
DETROIT MI
CALIFORNIA
NEBRASKA
FLORIDA
LOUISIANA
IOWA
ATLANTA
UTAH
RHODE ISLAND
CONNECTICUT
SEATTLE WA
IDAHO

Funnel plot
More reliableLess reliable
Ca
nc
er
su
rviv
al
(%)
Indicator

Target
More reliableLess reliable
Funnel plot
Ca
nc
er
su
rviv
al
(%)
Indicator

Control limits
More reliableLess reliable
??? Truly different ???
OK
Funnel plot
Ca
nc
er
su
rviv
al
(%)
Target
Indicator

All-cancers survival index: 1-year survival, PCT
PCT outliers for 1996 are tracked (red dots)
Data points: 151 Primary Care Trusts
National average

National average
Individual PCT survival

Five-year relative survival (%), breast (F)USA, 1990-99, by race and program area

Five-year relative survival (%), prostateUSA, 1990-99, by race and program area

Five-year relative survival (%), colon (F)USA, 1990-99, by race and program area

Five-year relative survival (%), colon (M)USA, 1990-99, by race and program area

Five-year relative survival (%), rectum (F)USA, 1990-99, by race and program area
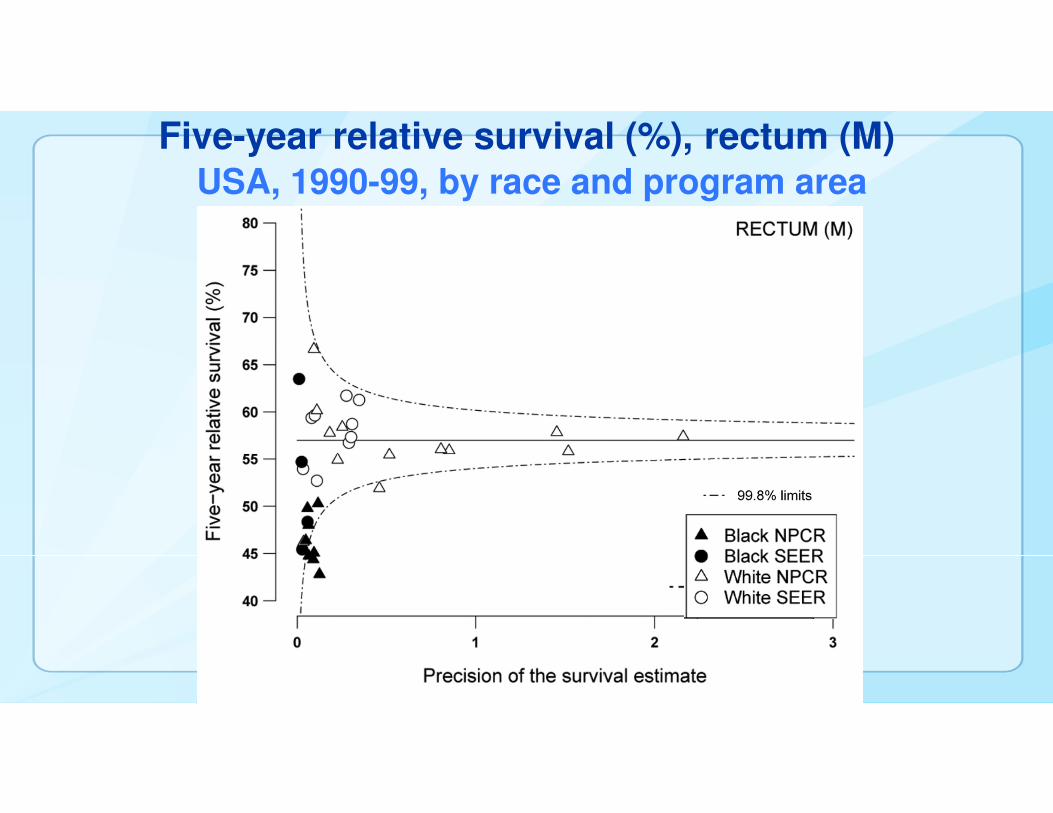
Five-year relative survival (%), rectum (M)USA, 1990-99, by race and program area


Outline
• History of the CONCORD Programme
• The CONCORD Study
• The CONCORD-2 Study
• Future Plans

Participants
– 279 cancer registries
– 67 countries
Long-term trends, 10 common cancers
– Patients diagnosed 1995-2009
– Follow-up to 2009
– Stomach, colon, rectum, liver, lung, breast (women), cervix, ovary, prostate, leukaemia
– Acute lymphoblastic leukaemia in children
Global surveillance of cancer survival

Population-based Cancer Survival in High Income Countries
EUROCARE
Patients
diagnosed Countries
Cancer
registries Year
1 1978 – 1984 11 30 1995
2 1985 – 1989 17 48 1999
3 1990 – 1994 20 66 2003
4 1995 – 2002 23 83 2007
5 2003 – 2007 - - 2013
CONCORD-2 1995 – 2009 69 292 2013

SepJun Dec JunMar2012
Mar2013
JunMar2014
Sep Dec
Cancer registries: participation

Cancer registries: data transfers 2014
SepJun Dec JunMar2012
Mar2013
JunMar2014
Sep Dec

Cancer registries, data sets
Signed up Submitted Data sets
Africa 16 10 71
America C+S 31 27 187
America N 61 57 570
Asia 59 50 472
Europe 132 128 1,157
Oceania 7 7 70
306 279 2,527

7
4
21
10
10

North America - United States
83.2% population coverage

Number of cancer patients
Africa 24,213
America C+S 459,964
America N 13,579,666
Asia 3,804,259
Europe 11,132,170
Oceania 1,050,246
Note: provisional figures, February 2014

Centralised quality control3 steps
1. Protocol adherenceIs each variable correctly coded?
2. ExclusionsIs each tumour record logically coherent?
3. EditorialAre the distributions in the data plausible?

Quality control of survival data
Excluded
• Vital status unknown
• Sex unknown
• Sex site error
• Site-morphology inconsistency
• Age-site inconsistency
• Age-morphology inconsistency
• Age-site-morphology inconsistency
• Duplicate registration
• Synchronous tumour
• Death-certificate-only (DCO)
Included – multiple primary tumours


Cancer patients submitted and includedSubmitted Included
Africa 23,325 12,509
America C+S 453,035 349,052
America N 12,421,143 11,282,731
Asia 3,581,339 3,274,733
Europe 11,449,869 10,086,145
Oceania 930,199 837,995
28,685,445 25,676,887

Life table report
Life tables: all-cause mortality
rates by age, sex, (race), geographical area (country,
state, region) and single calendar year
Life tables

Net survival: Pohar Perme approach (stns)
Cohort approach 1995-99, 2000-04
Period approach 2005-09
Age-standardisation: International Cancer Survival Standard (ICSS) weights
Methods


www.ncbi.nlm.nih.gov/pubmed/
25467588
All 496 co-authors
are indexed in PubMed
New Zealand *
Australia
Russia
Latvia *
Slovakia *
Lithuania *
Estonia *
Bulgaria *
Poland *
Romania
Malta *
Croatia *
Czech Republic *
Ireland *
Slovenia *
United Kingdom *
Denmark *
Austria *
Portugal *
Spain
Gibraltar *
Netherlands *
Germany
Iceland *
Belgium *
Switzerland
Norway *
Italy
Sweden *
Finland *
France
§ Saudi Arabia *
Jordan *
Mongolia *
India
Malaysia
Thailand
Indonesia
Turkey
China
Taiwan *
Korea *
Japan
Qatar *
Israel *
Cyprus *
Canada *
United States
Colombia
Argentina
Chile
Cuba *
Puerto Rico *
Ecuador
Brazil
Mali
§ † The Gambia *
South Africa
§ Algeria
§ Tunisia
Libya
Mauritius *
0 10 20 30 40 50 60 70 80 90 100
1995-1999
New Zealand *
Australia
Russia
Latvia *
Slovakia *
Lithuania *
Estonia *
Bulgaria *
Poland *
Romania
Malta *
Croatia *
Czech Republic *
Ireland *
Slovenia *
United Kingdom *
Denmark *
Austria *
Portugal *
Spain
Gibraltar *
Netherlands *
Germany
Iceland *
Belgium *
Switzerland
Norway *
Italy
Sweden *
Finland *
France
§ Saudi Arabia *
§ Jordan *
Mongolia *
India
Malaysia
Thailand
Indonesia
Turkey
China
Taiwan *
Korea *
Japan
Qatar *
Israel *
Cyprus *
Canada *
United States
Colombia
Argentina
Chile
Cuba *
Puerto Rico *
Ecuador
Brazil
§ † Mali
The Gambia *
South Africa
§ Algeria
§ Tunisia
Libya
Mauritius *
0 10 20 30 40 50 60 70 80 90 100
2000-2004
New Zealand *
Australia
Russia
Latvia *
Slovakia *
Lithuania *
Estonia *
Bulgaria *
Poland *
Romania
Malta *
Croatia *
Czech Republic *
Ireland *
Slovenia *
United Kingdom *
Denmark *
Austria *
Portugal *
Spain
Gibraltar *
Netherlands *
Germany
Iceland *
Belgium *
Switzerland
Norway *
Italy
Sweden *
Finland *
France
Saudi Arabia *
§ Jordan *
Mongolia *
India
Malaysia
Thailand
Indonesia
Turkey
China
Taiwan *
Korea *
Japan
Qatar *
Israel *
Cyprus *
Canada *
United States
Colombia
Argentina
Chile
Cuba *
Puerto Rico *
Ecuador
Brazil
Mali
The Gambia *
South Africa
§ Algeria
§ Tunisia
Libya
Mauritius *
0 10 20 30 40 50 60 70 80 90 100
2005-2009
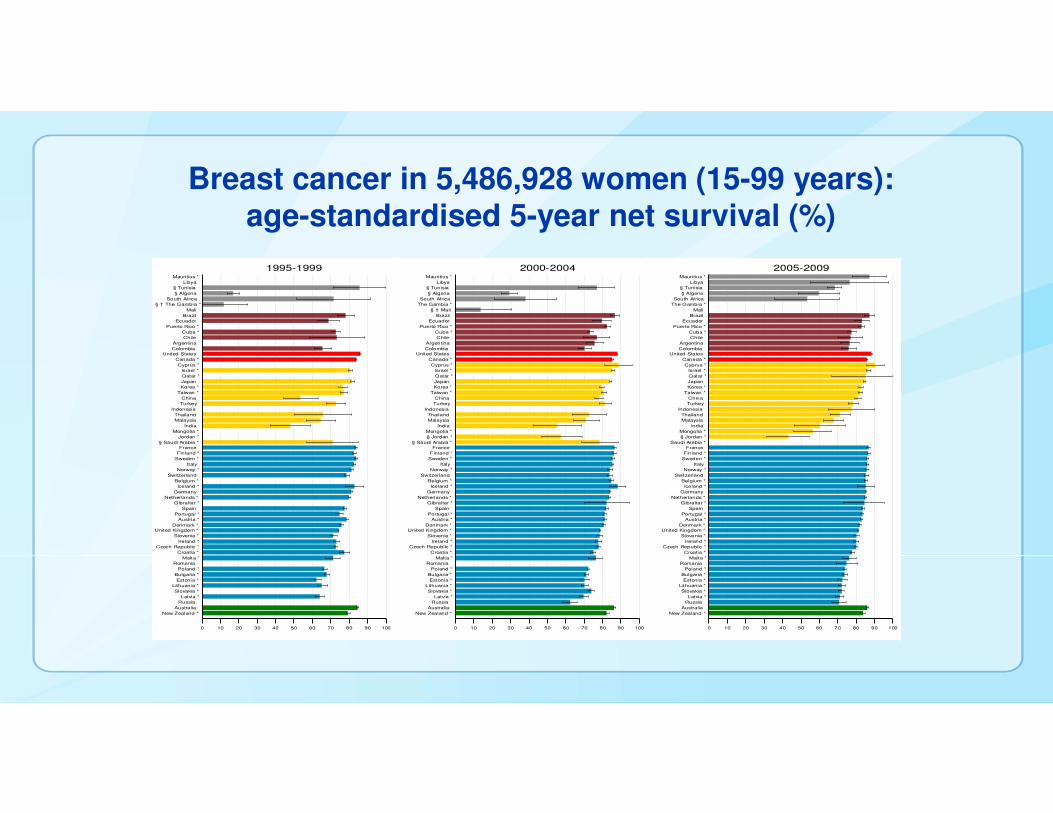
Breast cancer in 5,486,928 women (15-99 years):age-standardised 5-year net survival (%)

Trends in 5-year age-standardised net survival (%) for women diagnosed with breast cancer during1995-1999, 2000-2004 and 2005-2009
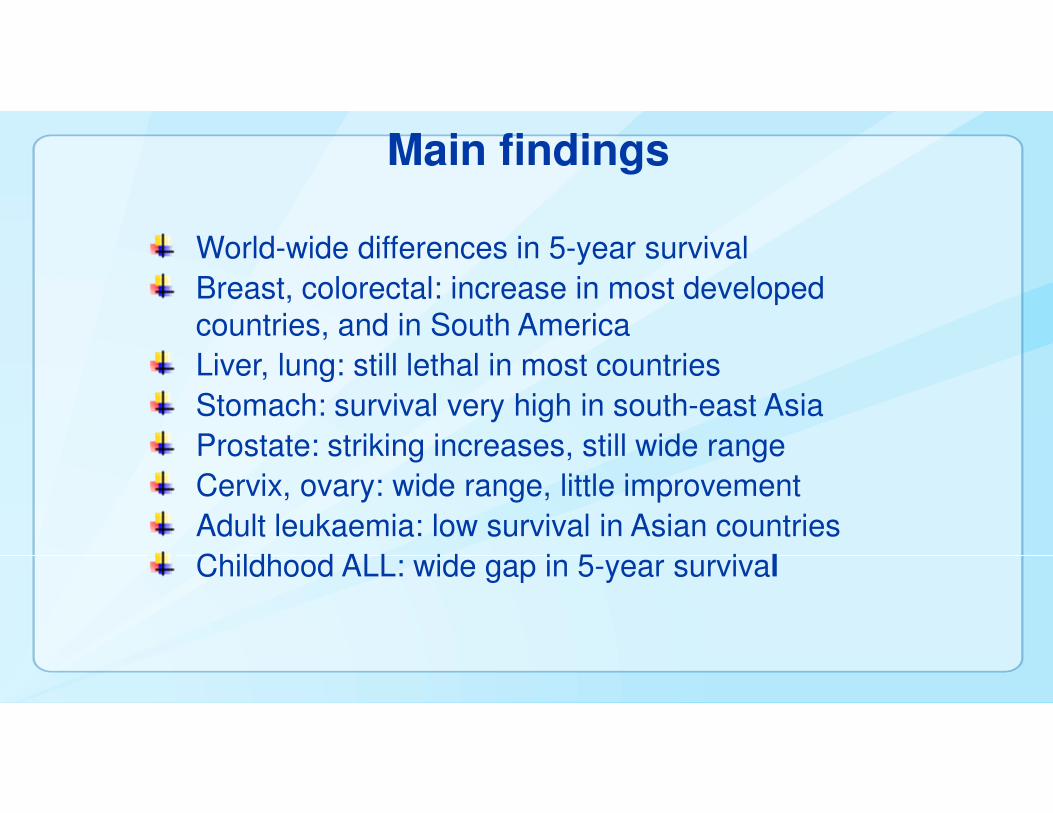
World-wide differences in 5-year survival
Breast, colorectal: increase in most developed countries, and in South America
Liver, lung: still lethal in most countries
Stomach: survival very high in south-east Asia
Prostate: striking increases, still wide range
Cervix, ovary: wide range, little improvement
Adult leukaemia: low survival in Asian countries
Childhood ALL: wide gap in 5-year survival
Main findings

Some key messages
Cancer survival for 67 countries, home to 2/3 of world population
Fits overarching goal of UICC World Cancer Declaration 2013
Wide range in survival – inequity in diagnosis and treatment
Differences in survival suggest lessons can be learnt
Raises questions for further research
World-wide surveillance is crucial for cancer control policy
Cancer registries need political, legislative and financial stability

The article is OPEN ACCESS
Allemani et al., The Lancet 2015
Main article (34 pages)
http://www.thelancet.com/journals/lancet/article/PIIS0140-6736(14)62038-9/fulltext
Supplementary appendix (175 pages)
http://download.thelancet.com/mmcs/journals/lancet/PIIS0140673614620389/mmc1.pdf?id=eaa6KPWwDrwIJ-q3s0sOu

Outline
• History of the CONCORD Programme
• The CONCORD Study
• The CONCORD-2 Study
• Future Plans
• Site specific analyses including population cure, avoidable deaths
• US Survival monograph – using survival to inform cancer control
• US – Canada SE

1. Allemani C, Weir HK, Carreira H, Harewood R, Spika D, Wang XS, et al. Global surveillance of cancer survival 1995-2009: analysis of
individual data for 25,676,887 patients from 279 population-based registries in 67 countries (CONCORD-2). Lancet 2015;385(9972):977-
1010.
2. Weir HK, Johnson CJ, Mariotto AB, Turner D, Wilson RJ, Nishri D, et al. Evaluation of North American Association of Central Cancer
Registries' (NAACCR) data for use in population-based cancer survival studies. J Natl Cancer Inst Monogr 2014;2014(49):198-209.
3. Johnson CJ, Weir HK, Fink AK, German RR, Finch JL, Rycroft RK, et al. The impact of National Death Index linkages on
population-based cancer survival rates in the United States. Cancer Epidemiol 2013;37(1):20-8.4. Johnson CJ, Weir HK, Yin D, Niu X. The impact of patient follow-up on population-based survival rates. J Registry Manag
2010;37(3):86-103.5. Coleman MP, Quaresma M, Berrino F, Lutz JM, De Angelis R, Capocaccia R, et al. Cancer survival in five continents: a worldwide
population-based study (CONCORD). Lancet Oncol 2008;9(8):730-56.6. Baili P, Micheli A, De Angelis R, Weir HK, Francisci S, Santaquilani M, Hakulinen T, Quaresma M, Coleman MP, CONCORD
Working Group. Life tables for world-wide comparison of relative survival for cancer (CONCORD study). Tumori 2008 94; 658-668.
7. Quaresma M, Coleman MP, Rachet B. Funnel plots for population-based cancer survival: principles, methods and applications. Stat Med. 2014 Mar 15;33(6):1070-80.
8. Quaresma M, Coleman MP, Rachet B. 40-year trends in an index of survival for all cancers combined and survival adjusted for age and sex for each cancer in England and Wales, 1971-2011. Lancet. 2015 Mar 28;385(9974):1206-18
References

Thank You
Hannah K. Weir, PhD
Division of Cancer Prevention and Control Centers for Disease Control and Prevention
[email protected] 488-3006
The findings and conclusions in this presentation
are those of the presenter and do not necessarily representthe official position of the
Centers for Disease Control and Prevention.

10 December
2015