Embed Size (px)
Citation preview

Global Strategic SourcingSelection of CRO Service Providers
Mary Kachinsky
Associate Director, Procurement
Pfizer, Inc
September 20, 2004

2
Today’s Objectives
• Provide a CRO Market Profile: Trends in the Industry
• Introduce a Strategic Global Sourcing Methodology

3
Agenda
• CRO Market Profile/Outsourcing Trends
• Seven Step Global Strategic Sourcing Process
• Service Provider Performance Management

Agenda
CRO Market Profile - Outsourcing Trends
The Strategic Global Sourcing Process
Service Provider Performance Management

5
R&D Outsourcing Trends Support CRO Market Growth: Worldwide CRO Revenue to Grow to $14B+ by 2007
5.966.73
7.788.79
9.97
11.26
12.71
14.37
0
5
10
15
2000 2001 2002 2003 2004 2005 2006 2007
Worldwide CRO Revenue(2000–2007) Key Growth DriversKey Growth DriversKey Growth DriversKey Growth Drivers
• Need for cost containment and speed to market
• Increased globalization of Pharma/Biotech companies
• Increased technological demands
• Use of suppliers for additional pieces of R&D supply chain (e.g., labs, preclinical)
• Need for cost containment and speed to market
• Increased globalization of Pharma/Biotech companies
• Increased technological demands
• Use of suppliers for additional pieces of R&D supply chain (e.g., labs, preclinical)
Key Growth ConstraintsKey Growth ConstraintsKey Growth ConstraintsKey Growth Constraints
• More stringent regulatory standards
• Project cancellations/delays
• CRO size/service tradeoff and expansion potential
• More stringent regulatory standards
• Project cancellations/delays
• CRO size/service tradeoff and expansion potential
CAGR 13.1%
Sources: Frost & Sullivan, 2003; Reuters; Data Monitor.

6
Key Driver: Pharma/Biotech Need for Cost Containment and Increased Speed to Market Will Drive Growth
Cost Pressures for Pharma/Biotech
Cost Pressures for Pharma/Biotech
• Patent expirations/generic competition impacting more of large pharma company portfolios
• Increase prescription competition
• Price regulation in Europe & Asia, with threats of reimportation in US
• Increased regulatory pressure leads to increasing R&D costs
– Clinical testing expenses rising by 11% annually
– Need for longer/more comprehensive testing (e.g. chronic/complicated conditions)
– Request for more detailed safety/efficacy data for specific population groups (e.g. children, seniors)
• Lower R&D productivity (spend per compound increasing; sales increasing at slower rates)
CROs Can Deliver Quicker and More Efficient Trials
CROs Can Deliver Quicker and More Efficient Trials
• Specialized in clinical research and can generate economies of scale
• Utilize latest data management tools & technologies as well as other technologies (e.g., patient recruitment)
• Can conduct trials in lower cost regions
• Reduce time to complete trials*– CROs complete trials 30% faster than pharma
companies*
– CROs complete trials in less time across phases
* Benchmarking study by KMR Consulting of 2,800 Phase III trials in 2000.Sources: Frost & Sullivan, 2003; Reuters; Data Monitor.
14013989 978166
Phase I Phase II Phase IIISponsor CRO
Number of Weeks

7
CRO Market Growth Driver: Global Pharma R&D Outsourcing Expected to Almost Double by 2010
18.3%19.2%
20.3%21.7%
23.1%24.7%
26.4%28.3%
17.4%16.6%
0%
5%
10%
15%
20%
25%
30%
2001 2002 2003 2004 2005 2006 2007 2008 2009 2010
Global Pharmaceutical R&D Outsourcing Market(2001–2010)
Source: Reuters Business Insight.

8
Growth Projections: U.S. Will Make Up An Increasingly Large Share of CRO Revenue
51.5% 52.0% 53.7% 54.7% 55.9% 57.2% 58.5% 59.8%
34.8% 34.5% 33.4% 32.8% 32.1% 31.3% 30.5% 29.7%
10.7% 10.8% 10.3% 10.0% 9.7% 9.4% 9.1% 8.8%3.0% 2.8% 2.6% 2.4% 2.2% 2.0% 1.9% 1.7%
$5.96 $6.73 $7.78 $8.79 $9.97 $11.26 $12.71 $14.37
0%
25%
50%
75%
100%
2000 2001 2002 2003 2004 2005 2006 2007
Others
Asia
Europe
US
World CRO Revenues by Region (2000–2007)
U.S. CRO Share GrowingU.S. CRO Share Growing
• U.S. will continue to comprise largest percentage of market with U.S. share growing from 51% in 2000 to nearly 60% in 2007
• Europe and Asia shares both fall between 2000 and 2007Reasons include:– R&D spend remains largest in US
given largest pharmaceutical market
– R&D spend in Europe/Asia more limited given– Price Controls And Other Regulatory
Factors – Lower Rates Of Outsourcing (Especially
In Asia)– Still Emerging Asia Market
– Activity will increase in Europe/Asia but revenues will not grow proportionally given lower pricing
Source: Frost & Sullivan, 2003.

9
Biotech Firms Rapidly Growing in Importance in the CRO Market Space
70% 68% 66% 64% 62% 60%
30% 32% 34% 36% 38%
77% 73%
40%
23% 26%
0%
25%
50%
75%
100%
2000 2001 2002 2003 2004 2005 2006 2007
Biotech
Pharma
% ofExpenditure
CRO R&D Expenditure Forecast(2000–2007)
Source: Frost & Sullivan, 2003.

10
CRO Revenues Expected to Trend Lower in Phase III as Phase IV Revenues To Continue Higher
19.4% 19.7% 20.0% 20.2% 20.4% 20.6%
24.7% 24.3% 23.9% 23.4% 22.8% 22.2%
41.3% 39.3% 38.7% 37.2% 35.7% 34.2% 32.6% 31.1%
14.7% 15.5% 17.2% 18.8% 20.5% 22.2% 24.1% 26.1%
18.7% 19.0%
25.3% 26.2%
0%
25%
50%
75%
100%
2000 2001 2002 2003 2004 2005 2006 2007
Phase IV
Phase III
Phase II
Phase I
% of Revenue
CRO Revenues by Clinical PhasePharmaceutical Companies
(2000–2007)
Shift in Phases Mostly Due to Pharmaceuticals Pursuing New Applications of Already Developed Drugs
Shift in Phases Mostly Due to Pharmaceuticals Pursuing New Applications of Already Developed Drugs
Source: Frost & Sullivan, 2003.

11
Lower Cost Is Driving European Clinical Work From Western to Eastern Europe
• Lower costs as well as availability of services and patients is driving clinical activity into Eastern Europe
• Top players such as Covance, Quintiles, PPDI, and Ingenix have locations in Eastern Europe; others have begun to follow suit
• Lower costs as well as availability of services and patients is driving clinical activity into Eastern Europe
• Top players such as Covance, Quintiles, PPDI, and Ingenix have locations in Eastern Europe; others have begun to follow suit
Western EuropeWestern EuropeWestern EuropeWestern Europe
Critical markets for new drugs
Experience/credibility for development work
Cultural similarities with U.S. allow cross-regional trials
Eastern EuropeEastern EuropeEastern EuropeEastern Europe
Much lower cost; particularly patient and physician compensation levels
Charges are typically for only costs incurred over and above standard operating expenses
Reputation for quick and effective recruitment
Fewer patients on medications which could disqualify them from trials
– Research costs approaching U.S. levels (patent and physician compensation increasing)
– Charges are for all expenses incurred
– Untested
– Cultural dissimilarities with West and among Eastern European nations (i.e., Language, Demographics, etc.)
StrengthsStrengths
WeaknessesWeaknesses
Clin
ica
l A
ctiv
ity
Source: Frost & Sullivan, 2003.
12
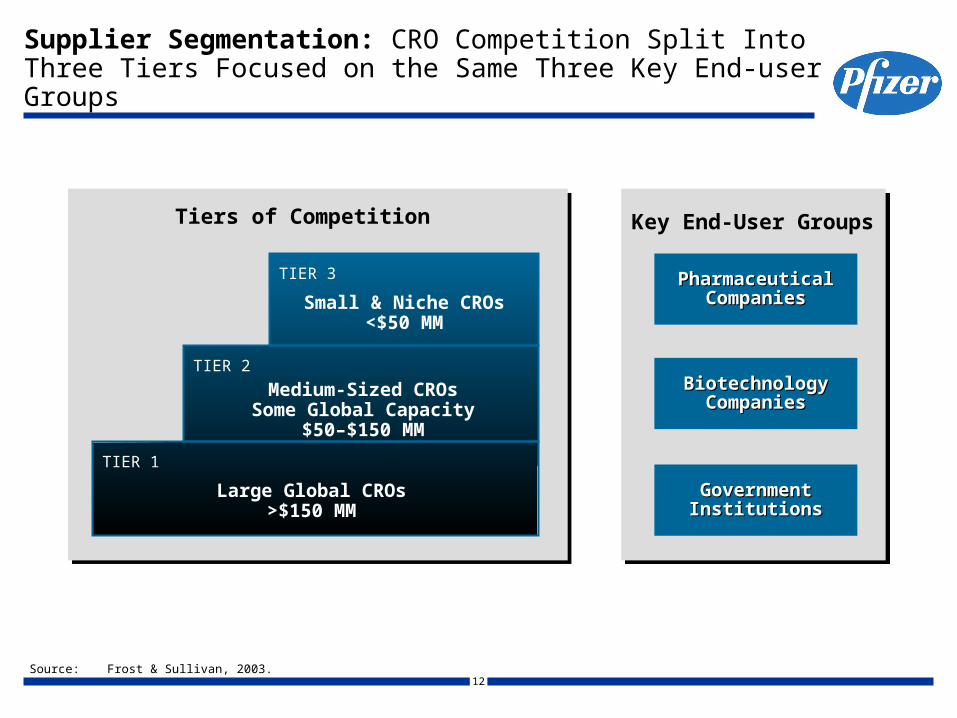
Supplier Segmentation: CRO Competition Split Into Three Tiers Focused on the Same Three Key End-user Groups
Tiers of Competition
TIER 3
TIER 2
TIER 1
Large Global CROs>$150 MM
Medium-Sized CROsSome Global Capacity
$50–$150 MM
Small & Niche CROs<$50 MM
Biotechnology Biotechnology CompaniesCompanies
Pharmaceutical Pharmaceutical CompaniesCompanies
Government Government InstitutionsInstitutions
Key End-User Groups
Source: Frost & Sullivan, 2003.
13
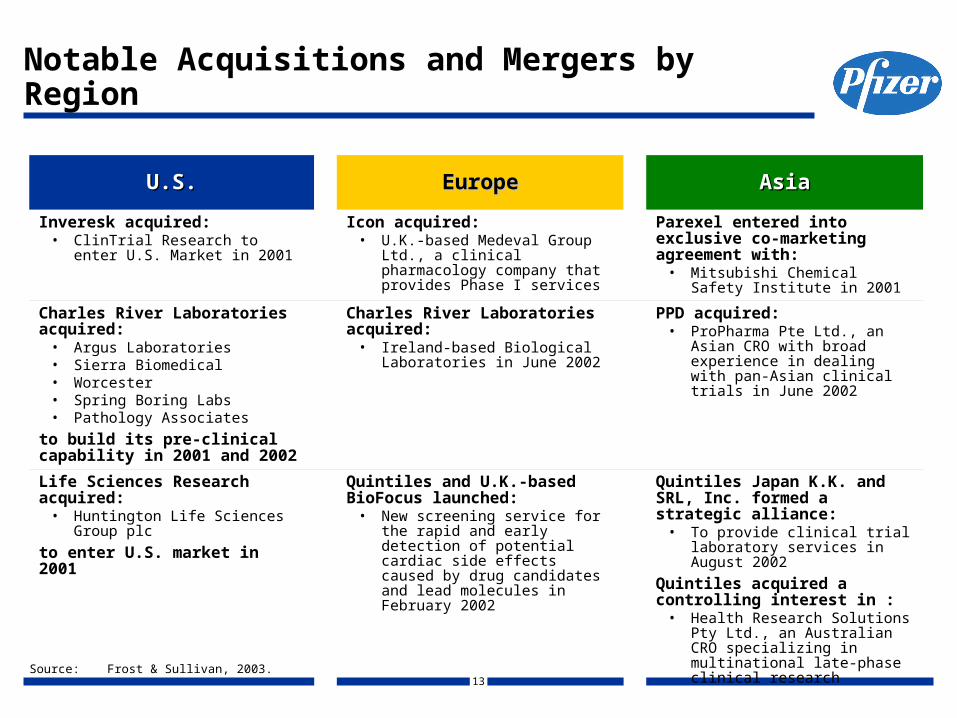
Notable Acquisitions and Mergers by Region
U.S.U.S. EuropeEurope AsiaAsia
Inveresk acquired:• ClinTrial Research to enter U.S.
Market in 2001
Icon acquired:• U.K.-based Medeval Group Ltd., a
clinical pharmacology company that provides Phase I services
Parexel entered into exclusive co-marketing agreement with:
• Mitsubishi Chemical Safety Institute in 2001
Charles River Laboratoriesacquired:
• Argus Laboratories• Sierra Biomedical• Worcester• Spring Boring Labs• Pathology Associates
to build its pre-clinical capability in 2001 and 2002
Charles River Laboratories acquired:
• Ireland-based Biological Laboratories in June 2002
PPD acquired:• ProPharma Pte Ltd., an Asian
CRO with broad experience in dealing with pan-Asian clinical trials in June 2002
Life Sciences Research acquired:• Huntington Life Sciences Group plc
to enter U.S. market in 2001
Quintiles and U.K.-based BioFocus launched:
• New screening service for the rapid and early detection of potential cardiac side effects caused by drug candidates and lead molecules in February 2002
Quintiles Japan K.K. and SRL, Inc. formed a strategic alliance:
• To provide clinical trial laboratory services in August 2002
Quintiles acquired a controlling interest in :
• Health Research Solutions Pty Ltd., an Australian CRO specializing in multinational late-phase clinical research
Source: Frost & Sullivan, 2003.

14
Strategic Responses to Key Market Challenges
Market ChallengesMarket Challenges Strategic ResponsesStrategic Responses
Lack of appropriately trained and experienced staff
Loss of contract work for CRO
• Evaluate full-time versus temporary and contract staffing– Enhance workforce expertise – Reduce volatility in staffing levels
Difficult to maintaining close relationships with sponsors
Rising client pressures and expectations
• Implement client communication procedures to evaluate its services– Continuously evaluate their services
against client expectations– Allows for improvements– Maintains continuous communication
Consolidation within CRO industry
Shortage of partners and acquisition targets to fuel future growth
• Exploit M&A opportunities in the
short-term
• Plan for long-term organic growth
Greater employment stability in pharmaceutical and biotechnology companies lures CRO employees
High turnover rates • Develop innovative programs to
attract and retain experienced personnel
Potential OutcomesPotential Outcomes
Sources: Frost & Sullivan, 2003.

Agenda
CRO Market Profile – Industry Trends
The Strategic Global Sourcing Process
Service Provider Performance Management

16
Strategic Global Sourcing – 7 Step ProcessProject Initiation
Stage
Implementation
andManagement
Stage
StrategyStage
7. Measure,Monitor
andReport
Performance
5.Formulate
Strategies & DevelopImplementation Plans
4.Perform StrategicAnalysis & Identify
Opportunities
3.Collect
Internal &External
Data
2.Define Project
and Form Cross-Functional Team
6.PerformSupplier Selection
1.Identify Need
and Pre-ProjectPlanning

17
Types of Procurement ActivitiesTypes of Procurement Activities
Supplier Sourcing Includes Far More than Cost Reduction
DataCollection
DataAnalysis
Benchmarking
IndustryBest
Practices
Negotiation
GlobalResources
CompetitiveIntelligence
MarketIntelligence
KnowledgeSharing
Process &Technology
ProjectManagement
ProcessFacilitation
ChangeManagement
StrategicStrategic OperationalOperational
• Category Management • Quality
• Outsourcing • Supplier Performance Management
• Total Cost of Ownership • Order Fulfillment
• Process Mapping/ Improvement • Client Relationship Management
• Supplier Management • Contract Negotiation and Administration
• Quality • Preferred and Improved Payment Methods
• Sourcing • Supply Chain Efficiency
Toolkit

18
Pfizer Current State:
• Wide variety of CROs being used by Sponsor company
• Lack of standardized approach across sites
• Multiple independent relationships between some CROs and different parts of Sponsor company
• Lack of leverage of Sponsor’s scale in negotiations with top CROs
CR04
CR01
CR01
CR01
CR04 CR06
CRO5
CR06
Pfizer
Pfizer
Pfizer
19
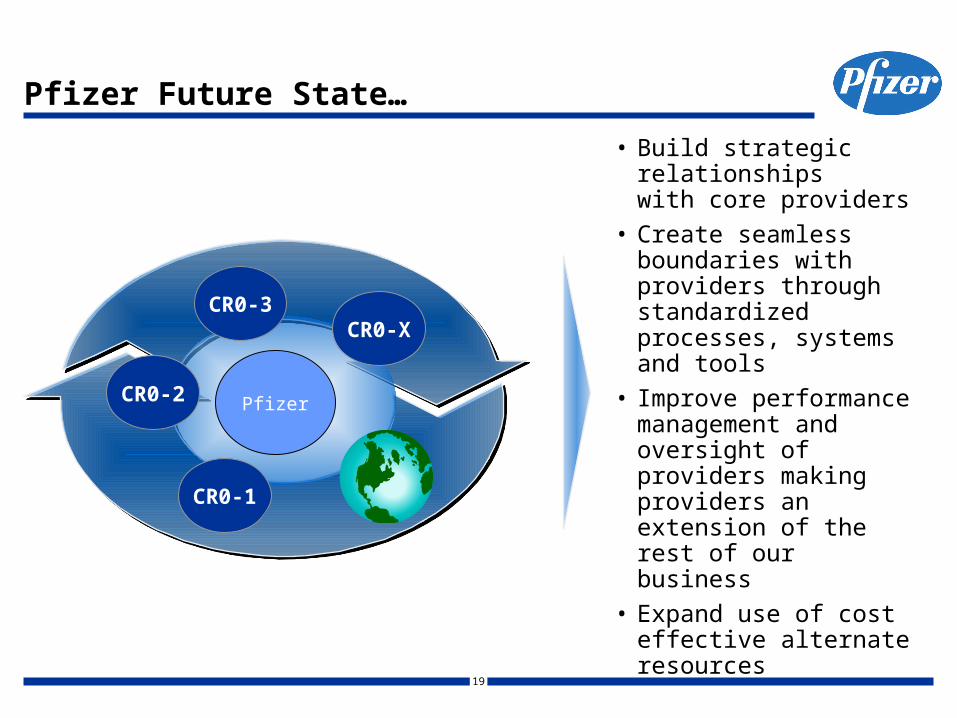
Pfizer Future State…
CR0-1
CR0-XCR0-3
CR0-2
• Build strategic relationships with core providers
• Create seamless boundaries with providers through standardized processes, systems and tools
• Improve performance management and oversight of providers making providers an extension of the rest of our business
• Expand use of cost effective alternate resources
Pfizer

20
Sponsor BenefitsSponsor Benefits
• Increased productivity
• Increased speed of engagement
• Standardized outsourcing processes across divisions, sites and regions
• Better visibility/reporting into performance of outsourced activities
• More stability in outsourced workforce
Strategic Relationships Offer Mutual Benefits
Service Provider BenefitsService Provider Benefits
• Increased productivity
• Better visibility into customer’s outsourcing needs
• More efficient use of resources
• Reduced oversight from Pfizer
• Reduced rework

21
Strategic Global Sourcing – 7 Step ProcessProject Initiation
Stage
Implementation
andManagement
Stage
StrategyStage
7. Measure,Monitor
andReport
Performance
5.Formulate
Strategies & DevelopImplementation Plans
4.Perform StrategicAnalysis & Identify
Opportunities
3.Collect
Internal &External
Data
2.Define Project
and Form Cross-Functional Team
6.PerformSupplier Selection
1.Identify Need
and Pre-ProjectPlanning

22
1. Identify Need
7.Measure,Monitor
andReport
Performance
5.Formulate
Strategies & DevelopImplementation Plans
4.Perform StrategicAnalysis & Identify
Opportunities
3.Collect
Internal &External
Data
2.Define Project
and Form Cross-Functional Team
6.PerformSupplier Selection
1.Identify Needand Pre-Project
Planning
7.Measure,Monitor
andReport
Performance
5.Formulate
Strategies & DevelopImplementation Plans
4.Perform StrategicAnalysis & Identify
Opportunities
3.Collect
Internal &External
Data
2.Define Project
and Form Cross-Functional Team
6.PerformSupplier Selection
1.Identify Needand Pre-Project
Planning
DefinitionDefinitionIdentify required needs of initiative, and obtain sponsor and key stakeholder support
Key ConsiderationsKey ConsiderationsKey ConsiderationsKey Considerations
• Do understand client’s needs
• Do determine costs of the function being outsourced
• Do align customer expectations with sourcing strategy
• Do engage sponsors and stakeholders early in the process
Do’s and Don’tsDo’s and Don’tsDo’s and Don’tsDo’s and Don’ts
• Protocol – Key parameters
• Understand skill, timeline, training, and IT requirements
• Definition of deliverable
• Budget approval
• Understand context of initiative and relationship to other outsourcing activity
• Understand risk/issues and urgency/visibility of initiative

23
2. Form Cross-Functional Team
7.Measure,Monitor
andReport
Performance
5.Formulate
Strategies & DevelopImplementation Plans
4.Perform StrategicAnalysis & Identify
Opportunities
3.Collect
Internal &External
Data
2.Define Project
and Form Cross-Functional Team
6.PerformSupplier Selection
1.Identify Needand Pre-Project
Planning
7.Measure,Monitor
andReport
Performance
5.Formulate
Strategies & DevelopImplementation Plans
4.Perform StrategicAnalysis & Identify
Opportunities
3.Collect
Internal &External
Data
2.Define Project
and Form Cross-Functional Team
6.PerformSupplier Selection
1.Identify Needand Pre-Project
Planning
DefinitionDefinitionDetermine initiative scope, timeline, key milestones, team members, and roles and responsibilities
• Does team have access to key decision-makers?
• Is collaboration of people from several parts of the organization required?
• Does the initiative demand the assignment of critical internal resources (eg subject matter experts?)
• Is team aligned on expected deliverables, and with customer expectations?
• Is initiative scoped properly and have appropriate timelines?
• How will team measure and report progress?
Key ConsiderationsKey ConsiderationsKey ConsiderationsKey Considerations
• Do form a cross-functional team– Team members should represent
the product/service being outsourced and/or those affected by the product/service being outsourced
• Do develop a workplan
• Do determine communication plan
Do’s and Don’tsDo’s and Don’tsDo’s and Don’tsDo’s and Don’ts

24
3. Collect Internal and External Data
7.Measure,Monitor
andReport
Performance
5.Formulate
Strategies & DevelopImplementation Plans
4.Perform StrategicAnalysis & Identify
Opportunities
3.Collect
Internal &External
Data
2.Define Project
and Form Cross-Functional Team
6.PerformSupplier Selection
1.Identify Needand Pre-Project
Planning
7.Measure,Monitor
andReport
Performance
5.Formulate
Strategies & DevelopImplementation Plans
4.Perform StrategicAnalysis & Identify
Opportunities
3.Collect
Internal &External
Data
2.Define Project
and Form Cross-Functional Team
6.PerformSupplier Selection
1.Identify Needand Pre-Project
Planning
DefinitionDefinitionCollect internal and external data to determine business requirements, best practices, and supplier capabilities
• Supplier and industry overview
• Industry cost structure– Ex. PICAS
• Current spend analysis and rate structure
• Supplier overview (RFI may be needed to collect this information)– Financials – Compliance– Capacity– Capability
Key ConsiderationsKey ConsiderationsKey ConsiderationsKey Considerations
• Do collect as much data as possible
• Do understand drivers of service provided
Do’s and Don’tsDo’s and Don’tsDo’s and Don’tsDo’s and Don’ts
– Experience– Quality– Geographic Reach

25
Internal Quality Check List
Internal Quality Check List Includes:
• Financial Health Check
• D&B
• Quality Audit Performed

26
6. Select Supplier
Supplier selection has 6 major workstreams:
• Issue a Confidentiality Agreement (CDA)
• Establish Master Service Agreement
• Create statement of Work
• Issue RFI/RFP
• Evaluate responses
• Negotiate
• Final Selection of Supplier
7.Measure,Monitor
andReport
Performance
5.Formulate
Strategies & DevelopImplementation Plans
4.Perform StrategicAnalysis & Identify
Opportunities
3.Collect
Internal &External
Data
2.Define Project
and Form Cross-Functional Team
6.PerformSupplier Selection
1.Identify Needand Pre-Project
Planning
7.Measure,Monitor
andReport
Performance
5.Formulate
Strategies & DevelopImplementation Plans
4.Perform StrategicAnalysis & Identify
Opportunities
3.Collect
Internal &External
Data
2.Define Project
and Form Cross-Functional Team
6.PerformSupplier Selection
1.Identify Needand Pre-Project
Planning

27
Evaluation Criteria
Criteria Rating Weight Criteria Rating Weight
I. Financial Stability Y/N Y/NScore/Weight Score/Weight Score 1-5 Weight=16
D&B Rating CFR 21 Part 11 ComplianceRevenue Trend (last three years) Connectivity to internal systemsRevenue Per Employee
Score/Weight Y/N Y/NScore/Weight Score 1-5 Weight=26 % of Business with Sponsor Company
Capacity M&A StatusGeographic Reach Litigation Therapeutic Expertise
Score/Weight Score 1-5 Weight=26Score/Weight Score 1-5 Weight=21 Ease of Service
Voluntary Turnover Rate in % (last 3 years) Sponsor Studies (Year to Year Revenue)Qualified People Total Score Max of 25 100
Years of Experience/Therapeutic ExperienceScore
Score/Weight Score 1-5 Weight=16 1 = Fails to meet rqmtsRegulatory Audit 2 = Partially meets rqmts
Date of Last Audit 3 = Meets rqmts483 Observations Cited? 4 = Exceeds rqmtsCertifications (eg ISO 9000, other?) 5 = Greatly exceeds rqmts
V. IT
VI. Risk Benefit
VII. Customer Service Level
CRO Evaluation Criteria
IV. Quality Assurance
II. Service Capability
CRO Evaluation Criteria
III. Human Resources

28
6. Select Supplier – MSA
7.Measure,Monitor
andReport
Performance
5.Formulate
Strategies & DevelopImplementation Plans
4.Perform StrategicAnalysis & Identify
Opportunities
3.Collect
Internal &External
Data
2.Define Project
and Form Cross-Functional Team
6.PerformSupplier Selection
1.Identify Needand Pre-Project
Planning
7.Measure,Monitor
andReport
Performance
5.Formulate
Strategies & DevelopImplementation Plans
4.Perform StrategicAnalysis & Identify
Opportunities
3.Collect
Internal &External
Data
2.Define Project
and Form Cross-Functional Team
6.PerformSupplier Selection
1.Identify Needand Pre-Project
Planning
DefinitionDefinition
• Does an MSA already exist?– Can it be amended to fit
specific needs?
• Consistent terms and conditions, and position on material issues
• Legal support model
• Pre-established work order templates and attachments
• Accommodates flexible pricing models
• Address systems and equipment issues
Key ConsiderationsKey ConsiderationsKey ConsiderationsKey Considerations
• Do check if an MSA already exists
• Do have an MSA in place
• Do use single global MSA where possible
• Requires cooperation with internal customer groups (monitoring/investigator issues)– Ex. Investigator site selection,
co-monitoring
Do’s and Don’tsDo’s and Don’tsDo’s and Don’tsDo’s and Don’ts
Ensure single Master Service Agreement (MSA) is in place to simplify and expedite agreement process

29
6. Select Supplier – Statement of Work/Work Order
7.Measure,Monitor
andReport
Performance
5.Formulate
Strategies & DevelopImplementation Plans
4.Perform StrategicAnalysis & Identify
Opportunities
3.Collect
Internal &External
Data
2.Define Project
and Form Cross-Functional Team
6.PerformSupplier Selection
1.Identify Needand Pre-Project
Planning
7.Measure,Monitor
andReport
Performance
5.Formulate
Strategies & DevelopImplementation Plans
4.Perform StrategicAnalysis & Identify
Opportunities
3.Collect
Internal &External
Data
2.Define Project
and Form Cross-Functional Team
6.PerformSupplier Selection
1.Identify Needand Pre-Project
Planning
DefinitionDefinition
Poorly Written SOW RisksPoorly Written SOW RisksPoorly Written SOW RisksPoorly Written SOW Risks Well Written SOW BenefitsWell Written SOW BenefitsWell Written SOW BenefitsWell Written SOW Benefits
Expresses desired output in legally enforceable terms.Describes what is wanted, when, where, how and at what quality or performance level.
• Delivery of poor quality product or services
• Wasted time and money
• Unfavorable pricing
• Contractual disputes and lawsuits
• Uninvited scrutiny by protesters, attorneys, and/or government officials
• Solicits high quality, competitive, and consistent proposals from each supplier
• Effective internal planning and communication among work groups involved in particular sourcing effort
• Adequately defines the relationship
• Clearly describes roles and responsibilities
• Clearly indicates metrics to determine whether client requirements are met
• Links to protocol parameters
• Ensures customer’s buy-in

30
6. Select Supplier – Issue RFI/RFP and Evaluate
7.Measure,Monitor
andReport
Performance
5.Formulate
Strategies & DevelopImplementation Plans
4.Perform StrategicAnalysis & Identify
Opportunities
3.Collect
Internal &External
Data
2.Define Project
and Form Cross-Functional Team
6.PerformSupplier Selection
1.Identify Needand Pre-Project
Planning
7.Measure,Monitor
andReport
Performance
5.Formulate
Strategies & DevelopImplementation Plans
4.Perform StrategicAnalysis & Identify
Opportunities
3.Collect
Internal &External
Data
2.Define Project
and Form Cross-Functional Team
6.PerformSupplier Selection
1.Identify Needand Pre-Project
Planning
DefinitionDefinition
• Ensure competitive bidding environment
• Standardized data collection from all suppliers
• Adhere to ethical standards
• Adhere to sourcing strategy
• Consider alternative pricing mechanisms– Hourly rates and hours– Unit based pricing
Key ConsiderationsKey ConsiderationsKey ConsiderationsKey Considerations
• Do prepare Request for Information/Proposal
• Do confirm budget availability
• Do ensure signed confidentiality agreement
• Do compare RFI/RFP responses
• Do clarify details (as required)
• Do ensure completeness and consistency across bids
Do’s and Don’tsDo’s and Don’tsDo’s and Don’tsDo’s and Don’ts
Issue a Request for Information/Proposal (RFI/RFP) to determine supplier background, capabilities, and pricing

31
6. Select Supplier – Negotiate Terms and Conditions
7.Measure,Monitor
andReport
Performance
5.Formulate
Strategies & DevelopImplementation Plans
4.Perform StrategicAnalysis & Identify
Opportunities
3.Collect
Internal &External
Data
2.Define Project
and Form Cross-Functional Team
6.PerformSupplier Selection
1.Identify Needand Pre-Project
Planning
7.Measure,Monitor
andReport
Performance
5.Formulate
Strategies & DevelopImplementation Plans
4.Perform StrategicAnalysis & Identify
Opportunities
3.Collect
Internal &External
Data
2.Define Project
and Form Cross-Functional Team
6.PerformSupplier Selection
1.Identify Needand Pre-Project
Planning
DefinitionDefinition
• Templates either already exist or are in progress for range of CRO services– MSA– Clinical Standards– Work Order– Change Order– Equipment Schedule
• Type of Relationship– Full Service (ex. Many services)– Functional Service Provider (ex.
Biometrics)– Staff Augmentation (contractors
to fill internal resource gap)
Key ConsiderationsKey ConsiderationsKey ConsiderationsKey Considerations
• Do link to MSA and Milestones
• Do leverage existing templates/materials
• Do understand type of relationship
• Do contact appropriate Vendor Relationship Lead to determine whether an agreement is already in place
Do’s and Don’tsDo’s and Don’tsDo’s and Don’tsDo’s and Don’ts
Negotiate terms and conditions of contract consistent with Pfizer standards

32
6. Select Supplier – Negotiate Pricing
7.Measure,Monitor
andReport
Performance
5.Formulate
Strategies & DevelopImplementation Plans
4.Perform StrategicAnalysis & Identify
Opportunities
3.Collect
Internal &External
Data
2.Define Project
and Form Cross-Functional Team
6.PerformSupplier Selection
1.Identify Needand Pre-Project
Planning
7.Measure,Monitor
andReport
Performance
5.Formulate
Strategies & DevelopImplementation Plans
4.Perform StrategicAnalysis & Identify
Opportunities
3.Collect
Internal &External
Data
2.Define Project
and Form Cross-Functional Team
6.PerformSupplier Selection
1.Identify Needand Pre-Project
Planning
DefinitionDefinition
• The more information you have the more prepared you are for negotiation
• Understand vendor cost structure
• Understand key study cost drivers
• Investigate alternative work structures and pricing models
• Productivity improvements vs. escalators
• Trade items of unequal value
Key ConsiderationsKey ConsiderationsKey ConsiderationsKey Considerations
• Do leverage existing data and tools
• Do exercise caution around providing information which reduces competitive advantage/leveragability
• Do consider various pricing variables– Site– Therapeutic area– Phase– Study location
Do’s and Don’tsDo’s and Don’tsDo’s and Don’tsDo’s and Don’ts
Negotiate pricing which generates mutual value for Pfizer and the service provider
– Unit of Measure– Units– Resources– Timeline– cost

33
6. Select Supplier – Negotiate Other Key Elements
7.Measure,Monitor
andReport
Performance
5.Formulate
Strategies & DevelopImplementation Plans
4.Perform StrategicAnalysis & Identify
Opportunities
3.Collect
Internal &External
Data
2.Define Project
and Form Cross-Functional Team
6.PerformSupplier Selection
1.Identify Needand Pre-Project
Planning
7.Measure,Monitor
andReport
Performance
5.Formulate
Strategies & DevelopImplementation Plans
4.Perform StrategicAnalysis & Identify
Opportunities
3.Collect
Internal &External
Data
2.Define Project
and Form Cross-Functional Team
6.PerformSupplier Selection
1.Identify Needand Pre-Project
Planning
DefinitionDefinition
• Timeline requirements• Payment implications• Definition of deliverable
achievement• Service level around deliverables
– Ex. All CRFs will be entered (first and second pass) within x business days of allocation by Pfizer
• Clearly defined IT requirements (incl. asset allocation and disposal)
• Communication requirements– Meeting frequency and
participants• Standards, SOPs, and training
requirements
Key ConsiderationsKey ConsiderationsKey ConsiderationsKey Considerations
• Do develop Task Ownership Matrix
• Do agree upon deliverables and requirements
• Do develop IT connectivity plan and application access plan
• Do finalize metrics collection and calculation
• Do finalize key study data capture process
Do’s and Don’tsDo’s and Don’tsDo’s and Don’tsDo’s and Don’ts
Negotiate other key elements (Task Ownership, Deliverables, IT Requirements, Etc.) required

34
Sample Tools
GLOBAL CLINICAL MONITORING RACI TASK OWNERSHIP MATRIX
*IMPORTANT* It is required that all parties named within this document be directly involved in its’ completion and be in full agreement with the RACI distribution.
KEY PPT - Pfizer Project Team (core team overseeing clinical trial activity) N/A - Not applicable CRO – Contract Research Organization PCO - Pfizer Country Office R – Responsible for completion of task A – Accountable for completion of task, even though responsibility <R> may be delegated to another group C – Must be Consulted prior to completion of task I – Must be Informed of task completion All services delegated to the CRO must be conducted in accordance with ICH Good Clinical Practise guidelines and must be conducted in accordance with all local laws and regulations
SERVICE TYPE: Clinical Monitoring
PP
T
N/A
CR
O
PC
O1
PC
O2
PC
O3
SECTION 1 STUDY DESIGN & MATERIALS
1.1 Design and Development of Clinical Study Documentation
Provide the initial Clinical Investigators Brochure (CIB),
final Protocol, CRF, questionnaires and Diary Cards (where applicable).
Revise Protocol, CRF, Diary Card and CIB as required.
Deliver copies of protocol, CRF, Diary Card and numbered copies of CIB to CRO.
Provide a template subject information sheet and
informed consent form, to include local data privacy sections.
Development (hardware, software design and validation) of input screens where electronic CRF and/or Diary Card are to be used. Deployment of sufficient pre-loaded hardware to CRO where electronic CRF and/or Diary Card are to be used.
With Pfizer, produce a Study Procedures Manual (incorporating study specific guidelines e.g. CRF completion guidelines), Investigator and Country Files (based on the CROs SOPs) but using Pfizer’s Trial Master filing system (ELARA). All documents to be reviewed by Pfizer prior to finalization.
Update the Study Procedures Manual, Investigator and Country Files during the course of the Study as a result of any protocol amendments or other significant changes to the Study and / or its management.
Prepare any necessary study aids that may assist the
site personnel in running the Study, with input and approval from Pfizer.
Provide local language translations of all informed consent documentation to Pfizer country offices.
Task Ownership Matrix Example
Illustrative

35
6. Final Selection
DefinitionDefinition
• Strategic/preferred suppliers
• Pricing
• Capabilities
• Documentation/justification of decision made
Key ConsiderationsKey ConsiderationsKey ConsiderationsKey Considerations
• Do obtain stakeholder buy-in
• Do communicate decision
• Do finalize contract(s)
• Do determine implementation timeline
Do’s and Don’tsDo’s and Don’tsDo’s and Don’tsDo’s and Don’ts
Select supplier(s) to move forward and begin implementation planning
7.Measure,Monitor
andReport
Performance
5.Formulate
Strategies & DevelopImplementation Plans
4.Perform StrategicAnalysis & Identify
Opportunities
3.Collect
Internal &External
Data
2.Define Project
and Form Cross-Functional Team
6.PerformSupplier Selection
1.Identify Needand Pre-Project
Planning
7.Measure,Monitor
andReport
Performance
5.Formulate
Strategies & DevelopImplementation Plans
4.Perform StrategicAnalysis & Identify
Opportunities
3.Collect
Internal &External
Data
2.Define Project
and Form Cross-Functional Team
6.PerformSupplier Selection
1.Identify Needand Pre-Project
Planning

36
7. Measure, Monitor, and Report Performance
DefinitionDefinition
• Agree to metrics plan
• Link business requirements to supplier performance targets
• Manage and monitor supplier performance:– Process– Quality– Cost– Speed– Compliance– Etc.
• Perform savings validation and reporting
• Perform periodic reviews
Key ConsiderationsKey ConsiderationsKey ConsiderationsKey Considerations
• Do establish service provider program
• Do measure performance
• Do manage supplier an ongoing basis
• Do determine savings
• Do communicate supplier review output
Do’s and Don’tsDo’s and Don’tsDo’s and Don’tsDo’s and Don’ts
Measure, monitor, and report supplier performance7.
Measure,Monitor
andReport
Performance
5.Formulate
Strategies & DevelopImplementation Plans
4.Perform StrategicAnalysis & Identify
Opportunities
3.Collect
Internal &External
Data
2.Define Project
and Form Cross-Functional Team
6.PerformSupplier Selection
1.Identify Needand Pre-Project
Planning
7.Measure,Monitor
andReport
Performance
5.Formulate
Strategies & DevelopImplementation Plans
4.Perform StrategicAnalysis & Identify
Opportunities
3.Collect
Internal &External
Data
2.Define Project
and Form Cross-Functional Team
6.PerformSupplier Selection
1.Identify Needand Pre-Project
Planning

Agenda
CRO Market Profile/Outsourcing Trends
The Strategic Global Sourcing Process
Service Provider Performance Management

38
Key Steps to Service Provider Performance Management
The Service Provider Performance Management process using the following key steps
Step 1Define CRO
Supplier and Services for
Performance Evaluation
Step 1Define CRO
Supplier and Services for
Performance Evaluation
Step 2Develop Goals,
Review Frequency and Scorecard
Step 2Develop Goals,
Review Frequency and Scorecard
Step 3Gain Commitment
From Suppliers
Step 3Gain Commitment
From Suppliers
Step 4Perform Supplier
Evaluation
Step 4Perform Supplier
Evaluation
Step 5Communicate
Evaluation Results to Internal
Stakeholders and Suppliers
Step 5Communicate
Evaluation Results to Internal
Stakeholders and Suppliers
Step 6Meet With
Suppliers for Periodic
Performance Review (PPR)
Step 6Meet With
Suppliers for Periodic
Performance Review (PPR)
Step 7Develop
Continuous Improvement Plan
Step 7Develop
Continuous Improvement Plan
Step 8Post Evaluation
Results in the Internal Database
Step 8Post Evaluation
Results in the Internal Database

39
Key messages – Metrics
1. Develop appropriate metrics to support your organization
– Example: Cost, Quality and Speed metrics for tracking CRO performance
2. Metrics can be leveraged for specific outsourcing situations
– Recruiting and Monitoring
– Data Management
– Biostats and Reporting
– Full Service Outsourcing

40
SSP Metrics – Speed (sample)
Metrics
Applicable metrics
Full-service outsourcing
Recruiting and monitoring
Data Management
Biostats and reporting
1. Lead time between receipt of the complete protocol pack at the country and the date of full external approval *
2. Recruitment Reliability (subject recruitment progress compared with agreed target patient numbers and timelines) *
3. Recruitment Rate (number of subjects randomized per month at each study center)*
4. Lead-time between a patient visit and the arrival of the data in-house*
5. Average time from CRF page received to entry complete
9. Time between Protocol approval to FSFV
10. Time between Protocol approval to 50% of sites have a FSFV
6. Time between last CRF in house and database lock
7. Time between DB lock to top-line report
CRO
12. Time between LSLV to Database lock
8. Time between top-line report to final monitoring study report
11. Time between FSFV to LSFV

41
SSP Metrics – Quality (sample)
7. CQA audit rating**
8. CRO project management quality (from DOTL/CSM survey)
5. Number of times database is unlocked/unfrozen due to database errors
6. Number of iterations between locked database to final tables
4. Number of Data Clarification Forms issued per 100 Data Capture Modules*
2. Screening failure rate
3. Patient retention rate
Metrics Full-serviceRecruiting and monitoring
DM B&R
CRO
Applicable metrics
1. Number of protocol violations/waivers
42
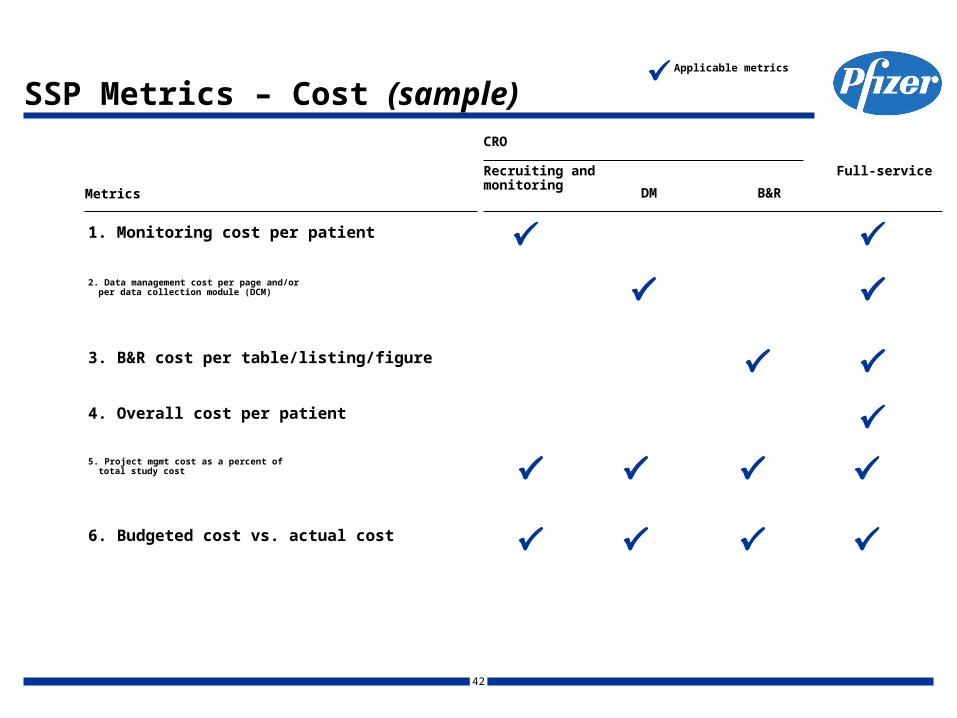
SSP Metrics – Cost (sample)
5. Project mgmt cost as a percent of total study cost
6. Budgeted cost vs. actual cost
2. Data management cost per page and/or per data collection module (DCM)
3. B&R cost per table/listing/figure
4. Overall cost per patient
1. Monitoring cost per patient
Metrics
Full-serviceRecruiting and monitoring
DM B&R
CRO
Applicable metrics

43
Performance Metrics Usage Guideline
• Purpose of CRO Performance Metrics
– Establish a performance management tool to measure and improve vendor performance
– Facilitate future decision making around outsourced work and strategic vendors
• Reporting Frequency: quarterly
• Format: metrics reported at appropriate level (e.g., vendor, study, country)
• Reporting responsibility
– Short-term: pilot with a few CROs (perhaps manual effort)
– Long-term: establish system based reporting enabling internal automatic metrics reports through CROs feeds


![CRO PROS Leveraging call analytics for conversion rate optimisation [CRO]](https://img.pdfslide.us/doc/110x75/587213291a28ab3f188b59ad/cro-pros-leveraging-call-analytics-for-conversion-rate-optimisation-cro.jpg)