Embed Size (px)
Citation preview

Global Storage Resource Assessment – 2019 Update
10365GLOB-Rep-01-01
June 2020
20
20 9
www.pale-blu.com
Support by:

Global Storage Resource Assessment – 2019 Update Contents
Pale Blue Dot Energy (10365GLOB) Page 2 of 95
Contents
Document Summary
Client Oil and Gas Climate Initiative (OGCI)
Project Title 10365GLOB
Title: Global Storage Resource Assessment – 2019 Update
Distribution: Classification: Client Confidential
Date of Issue: 22nd June 2020
Prepared by: Shelagh Baines, Elle Lashko
Approved by: Alan James
Disclaimer:
While the information contained in this document is believed to be accurate at the time of printing, no representation or warranty, express or implied, is given by Pale Blue Dot Energy Limited (“PBD”) or any of
its respective affiliates or any of PBD’s or it’s respective affiliate’s directors, officers or employees or any other person whatsoever on the completeness, accuracy or fairness of the information contained in this
document, nor is any responsibility accepted for any errors, misstatements in, or omissions from, this document or any direct or consequential loss howsoever arising from any use of, or reliance on, this
document or otherwise in connection with it. No responsibility or liability is accepted for any loss, cost or damage suffered or incurred as a result of reliance on any such information, opinions or beliefs. Where
third-party information has been used in this document, PBD has not independently verified such information and PBD does not represent or warrant that this information is accurate.
This document does not and is not intended to constitute, and should not be construed as, an offer, inducement, invitation or commitment to purchase, subscribe to, provide or sell any securities, services or
products of the PBD in any jurisdiction, or any part of any solicitation of any such offer, inducement, invitation or commitment, or to provide any recommendations for financial, securities, investment or other
advice or to take any decision. Nothing in this report constitutes investment, legal or insurance advice from PBD.
Certain statements in this presentation may be forward looking statements. By their nature, forward looking statements involve risks, uncertainties and assumptions from PBD and investments that could cause
actual results or events to differ materially from those expressed or implied by the forward-looking statements. Forward looking statements contained in this presentation regarding past trends or activities should
not be taken as a representation that such trends or activities will continue in the future.
This document is strictly confidential and is being provided to you solely for your information and none of the material, nor its content, nor any copy of it, may be altered in any way, transmitted to, copied or
distributed to any other party, without the prior express written permission of PBD. in whole or in part, for any purpose.
All material presented in this report, unless specifically indicated otherwise, is under copyright to PBD
Amendment Record
Rev Date Description Issued By Checked By Approved By
V00 30-04-20 Draft S Baines / E Lashko R Gilbert A James
V01 22-06-20 Amended to include comments from OGCI SWG
S Baines / E Lashko R Gilbert A James

Global Storage Resource Assessment – 2019 Update Contents
Pale Blue Dot Energy (10365GLOB) Page 3 of 95
Table of Contents
CONTENTS ................................................................................................................................................................................................................................................... 2
1.0 EXECUTIVE SUMMARY .................................................................................................................................................................................................................... 7
2.0 OBJECTIVES & APPROACH .......................................................................................................................................................................................................... 11
3.0 STORAGE RESOURCE MANAGEMENT SYSTEM (SRMS).......................................................................................................................................................... 14
4.0 SUMMARY & RECOMMENDATIONS ............................................................................................................................................................................................. 22
5.0 BIBLIOGRAPHY .............................................................................................................................................................................................................................. 28
6.0 APPENDIX A – COUNTRY ASSESSMENTS .................................................................................................................................................................................. 40
Global Storage Resource Assessment – 2019 Update Contents
Pale Blue Dot Energy (10365GLOB) Page 4 of 95
Figures
FIGURE 1-1. NUMBER OF POTENTIAL STORAGE RESOURCE SITES ASSESSED IN THE 2019 UPDATE, BY COUNTRY OR REGION. N = 525. ................................................................. 8
FIGURE 1-2. BOTH PROJECT AND NON-PROJECT SPECIFIED STORAGE RESOURCE SUMMARY FOR THE COUNTRIES ASSESSED BY THE GSRA 2019 UPDATE. DATA LABELS
REPRESENT THE ASSESSED POTENTIAL STORAGE RESOURCE BY SRMS MATURITY CLASS IN MILLIONS OF TONNES (MT) (NOTE: THE Z SCALE ON THIS PLOT IS LOGARITHMIC). 10
FIGURE 2-1 MAP SHOWING COUNTRIES INCLUDED IN THE GSRA 2019 UPDATE ASSESSMENT. .......................................................................................................................... 11
FIGURE 2-2. WORK FLOW FOR WORK PACKAGES 1, 2, 3 AND 4 OF THE GSRA – 2019 UPDATE ......................................................................................................................... 12
FIGURE 3-1. FLOWCHART FOR THE CLASSIFICATION OF STORAGE RESOURCES BASED ON THE SRMS GUIDELINES AND TERMINOLOGY. ................................................................ 15
FIGURE 4-1. A) SPREAD OF GLOBAL STORAGE RESOURCE ACROSS SRMS CLASSIFICATIONS, BOTH PROJECT SPECIFIED AND NOT. B) SPREAD OF GLOBAL STORAGE RESOURCE
ACROSS SRMS CLASSIFICATIONS, WHERE A PROJECT HAS BEEN SPECIFIED. C) SPLIT OF GLOBAL STORAGE RESOURCE BETWEEN SALINE AQUIFERS AND HYDROCARBON
FIELDS, BOTH PROJECT SPECIFIED AND NOT. ............................................................................................................................................................................................ 23
FIGURE 4-2. STORAGE RESOURCE SUMMARY FOR THE COUNTRIES ASSESSED IN THE GSRA 2019 UPDATE, BOTH PROJECT SPECIFIED AND NOT. ................................................ 24
FIGURE 4-3. STORAGE RESOURCE SUMMARY FOR THE COUNTRIES ASSESSED IN THE GSRA 2019 UPDATE, PROJECT SPECIFIED ONLY. .............................................................. 25
FIGURE 6-1. A) SPREAD OF STORAGE RESOURCE IN AUSTRALIAN SITES ACROSS SRMS CLASSIFICATIONS, WHERE A PROJECT HAS BEEN SPECIFIED. B) SPREAD OF STORAGE
RESOURCE IN ALL AUSTRALIAN SITES ACROSS SRMS CLASSIFICATIONS; BOTH PROJECT SPECIFIED AND NOT. C) SPLIT OF AUSTRALIAN STORAGE RESOURCE BETWEEN SALINE
AQUIFERS AND HYDROCARBON FIELDS, BOTH PROJECT SPECIFIED AND NOT. .............................................................................................................................................. 41
FIGURE 6-2. STORAGE RESOURCE SUMMARY FOR AUSTRALIA COMPILED IN THE GSRA 2019 UPDATE. GRAPH ABOVE IS LOG SCALE AND GRAPH BELOW IS LINEAR. BLUE BOX
HIGHLIGHTS SITES WHERE A PROJECT HAS BEEN SPECIFIED. WHERE POSSIBLE THE DATA HAVE UNDERGONE DUE DILIGENCE CHECKS, IDENTIFYING POTENTIAL REPEAT ENTRIES
TO AVOID DOUBLE COUNTING. .................................................................................................................................................................................................................. 42
FIGURE 6-3. A) SPREAD OF STORAGE RESOURCE IN ALL BALTIC SITES ACROSS SRMS CLASSIFICATIONS. B) SPLIT OF BALTIC STORAGE RESOURCE BETWEEN SALINE AQUIFERS AND
HYDROCARBON FIELDS, BOTH PROJECT SPECIFIED AND NOT. ..................................................................................................................................................................... 47
FIGURE 6-4. STORAGE RESOURCE SUMMARY FOR BALTIC REGION COMPILED IN THE GSRA 2019 UPDATE. GRAPH ABOVE IS LOG SCALE AND GRAPH BELOW IS LINEAR. PROJECTS
WERE NOT SPECIFICED FOR ANY OF THESE SITES. WHERE POSSIBLE THE DATA HAVE UNDERGONE DUE DILIGENCE CHECKS, IDENTIFYING POTENTIAL REPEAT ENTRIES TO AVOID
DOUBLE COUNTING. ................................................................................................................................................................................................................................. 48
FIGURE 6-5. A) SPREAD OF STORAGE RESOURCE IN ALL BRAZILIAN SITES ACROSS SRMS CLASSIFICATIONS. B) SPLIT OF BRAZILIAN STORAGE RESOURCE BETWEEN SALINE
AQUIFERS AND HYDROCARBON FIELDS, BOTH PROJECT SPECIFIED AND NOT. .............................................................................................................................................. 50

Global Storage Resource Assessment – 2019 Update Contents
Pale Blue Dot Energy (10365GLOB) Page 5 of 95
FIGURE 6-6. STORAGE RESOURCE SUMMARY FOR BRAZIL COMPILED IN THE GSRA 2019 UPDATE. GRAPH ABOVE IS LOG SCALE AND GRAPH BELOW IS LINEAR. BLUE BOX
HIGHLIGHTS SITES WHERE A PROJECT HAS BEEN SPECIFIED. WHERE POSSIBLE THE DATA HAVE UNDERGONE DUE DILIGENCE CHECKS, IDENTIFYING POTENTIAL REPEAT ENTRIES
TO AVOID DOUBLE COUNTING.. ................................................................................................................................................................................................................. 51
FIGURE 6-7. A) SPREAD OF STORAGE RESOURCE IN CANADIAN SITES ACROSS SRMS CLASSIFICATIONS, WHERE A PROJECT HAS BEEN SPECIFIED. B) SPREAD OF STORAGE
RESOURCE IN ALL CANADIAN SITES ACROSS SRMS CLASSIFICATIONS; BOTH PROJECT SPECIFIED AND NOT. C) SPLIT OF CANADIAN STORAGE RESOURCE BETWEEN SALINE
AQUIFERS AND HYDROCARBON FIELDS, BOTH PROJECT SPECIFIED AND NOT. .............................................................................................................................................. 55
FIGURE 6-8. STORAGE RESOURCE SUMMARY FOR CANADA COMPILED IN THE GSRA 2019 UPDATE. GRAPH ABOVE IS LOG SCALE AND GRAPH BELOW IS LINEAR. BLUE BOX
HIGHLIGHTS SITES WHERE A PROJECT HAS BEEN SPECIFIED. WHERE POSSIBLE THE DATA HAVE UNDERGONE DUE DILIGENCE CHECKS IDENTIFYING POTENTIAL REPEAT ENTRIES
TO AVOID DOUBLE COUNTING. .................................................................................................................................................................................................................. 56
FIGURE 6-9. A) SPREAD OF STORAGE RESOURCE IN CHINESE SITES ACROSS SRMS CLASSIFICATIONS, WHERE A PROJECT HAS BEEN SPECIFIED. B) SPREAD OF STORAGE
RESOURCE IN ALL CHINESE SITES ACROSS SRMS CLASSIFICATIONS; BOTH PROJECT SPECIFIED AND NOT. C) SPLIT OF CHINESE STORAGE RESOURCE BETWEEN SALINE
AQUIFERS AND HYDROCARBON FIELDS, BOTH PROJECT SPECIFIED AND NOT. .............................................................................................................................................. 66
FIGURE 6-10. STORAGE RESOURCE SUMMARY FOR CHINA COMPILED IN THE GSRA 2019 UPDATE. GRAPH ABOVE IS LOG SCALE AND GRAPH BELOW IS LINEAR. BLUE BOX
HIGHLIGHTS SITES WHERE A PROJECT HAS BEEN SPECIFIED. WHERE POSSIBLE, THE DATA HAVE UNDERGONE DUE DILIGENCE CHECKS IDENTIFYING POTENTIAL REPEAT ENTRIES
TO AVOID DOUBLE COUNTING. .................................................................................................................................................................................................................. 67
FIGURE 6-11. ABOVE: SPREAD OF ALL STORAGE RESOURCE ACROSS SRMS CLASSIFICATIONS. BELOW: SPLIT OF STORAGE RESOURCE BETWEEN SALINE AQUIFERS AND
HYDROCARBON FIELDS, BOTH PROJECT SPECIFIED AND NOT. ..................................................................................................................................................................... 73
FIGURE 6-12. STORAGE RESOURCE SUMMARY FOR THE INDIAN SUB-CONTINENT COMPILED IN THE GSRA 2019 UPDATE. GRAPH ABOVE IS LOG SCALE AND GRAPH BELOW IS
LINEAR. BLUE BOX HIGHLIGHTS SITES WHERE A PROJECT HAS BEEN SPECIFIED. WHERE POSSIBLE, THE DATA HAVE UNDERGONE DUE DILIGENCE CHECKS IDENTIFYING
POTENTIAL REPEAT ENTRIES TO AVOID DOUBLE COUNTING.. ...................................................................................................................................................................... 74
FIGURE 6-13. A) SPREAD OF STORAGE RESOURCE IN NORWEGIAN SITES ACROSS SRMS CLASSIFICATIONS, WHERE A PROJECT HAS BEEN SPECIFIED. B) SPREAD OF STORAGE
RESOURCE IN ALL NORWEGIAN SITES ACROSS SRMS CLASSIFICATIONS; BOTH PROJECT SPECIFIED AND NOT. C) SPLIT OF NORWEGIAN STORAGE RESOURCE BETWEEN SALINE
AQUIFERS AND HYDROCARBON FIELDS, BOTH PROJECT SPECIFIED AND NOT. .............................................................................................................................................. 78
FIGURE 6-14. STORAGE RESOURCE SUMMARY FOR NORWAY COMPILED IN THE GSRA 2019 UPDATE. GRAPH ABOVE IS LOG SCALE AND GRAPH BELOW IS LINEAR. BLUE BOX
HIGHLIGHTS SITES WHERE A PROJECT HAS BEEN SPECIFIED. WHERE POSSIBLE, THE DATA HAVE UNDERGONE DUE DILIGENCE CHECKS IDENTIFYING POTENTIAL REPEAT ENTRIES
TO AVOID DOUBLE COUNTING. .................................................................................................................................................................................................................. 79

Global Storage Resource Assessment – 2019 Update
Pale Blue Dot Energy (10365GLOB) Page 6 of 95
FIGURE 6-15. A) SPREAD OF STORAGE RESOURCE IN UK SITES ACROSS SRMS CLASSIFICATIONS, WHERE A PROJECT HAS BEEN SPECIFIED. B) SPREAD OF STORAGE RESOURCE IN
ALL UK SITES ACROSS SRMS CLASSIFICATIONS; BOTH PROJECT SPECIFIED AND NOT. C) SPLIT OF UK STORAGE RESOURCE BETWEEN SALINE AQUIFERS AND HYDROCARBON
FIELDS, BOTH PROJECT SPECIFIED AND NOT. ............................................................................................................................................................................................ 84
FIGURE 6-16. STORAGE RESOURCE SUMMARY FOR THE UK COMPILED IN THE GSRA 2019 UPDATE. GRAPH ABOVE IS LOG SCALE AND GRAPH BELOW IS LINEAR. BLUE BOX
HIGHLIGHTS SITES WHERE A PROJECT HAS BEEN SPECIFIED. WHERE POSSIBLE, THE DATA HAVE UNDERGONE DUE DILIGENCE CHECKS IDENTIFYING POTENTIAL REPEAT ENTRIES
TO AVOID DOUBLE COUNTING. .................................................................................................................................................................................................................. 85
FIGURE 6-17. A) SPREAD OF STORAGE RESOURCE IN U.S. SITES ACROSS SRMS CLASSIFICATIONS, WHERE A PROJECT HAS BEEN SPECIFIED. B) SPREAD OF STORAGE RESOURCE
IN ALL U.S. SITES ACROSS SRMS CLASSIFICATIONS; BOTH PROJECT SPECIFIED AND NOT. C) SPLIT OF U.S. STORAGE RESOURCE BETWEEN SALINE AQUIFERS AND
HYDROCARBON FIELDS, BOTH PROJECT SPECIFIED AND NOT. ..................................................................................................................................................................... 90
FIGURE 6-18. STORAGE RESOURCE SUMMARY FOR THE U.S. COMPILED IN THE GSRA 2019 UPDATE. GRAPH ABOVE IS LOG SCALE AND GRAPH BELOW IS LINEAR. BLUE BOX
HIGHLIGHTS SITES WHERE A PROJECT HAS BEEN SPECIFIED. WHERE POSSIBLE, THE DATA HAVE UNDERGONE DUE DILIGENCE CHECKS IDENTIFYING POTENTIAL REPEAT ENTRIES
TO AVOID DOUBLE COUNTING. .................................................................................................................................................................................................................. 91
Tables
TABLE 4-1. STORAGE RESOURCE CLASSIFICATION SUMMARY FOR THE GSRA-2019 UPDATE ............................................................................................................................ 22
TABLE 6-1. 2019 STORAGE RESOURCE CLASSIFICATION SUMMARY FOR AUSTRALIA .......................................................................................................................................... 40
TABLE 6-2. 2019 STORAGE RESOURCE CLASSIFICATION SUMMARY FOR BALTIC REGION (DENMARK & GERMANY) .............................................................................................. 46
TABLE 6-3. 2019 STORAGE RESOURCE CLASSIFICATION SUMMARY FOR BRAZIL ................................................................................................................................................ 50
TABLE 6-4. 2019 STORAGE RESOURCE CLASSIFICATION SUMMARY FOR CANADA .............................................................................................................................................. 54
TABLE 6-5. 2019 STORAGE RESOURCE CLASSIFICATION SUMMARY FOR CHINA .................................................................................................................................................. 65
TABLE 6-6. 2019 STORAGE RESOURCE CLASSIFICATION SUMMARY FOR BANGLADESH, INDIA AND PAKISTAN ....................................................................................................... 71
TABLE 6-7. 2019 STORAGE RESOURCE CLASSIFICATION SUMMARY FOR NORWAY ............................................................................................................................................. 77
TABLE 6-8. 2019 STORAGE RESOURCE CLASSIFICATION SUMMARY FOR UNITED KINGDOM ................................................................................................................................ 83
TABLE 6-9. 2019 STORAGE RESOURCE CLASSIFICATION SUMMARY FOR UNITED STATES OF AMERICA................................................................................................................ 89

Global Storage Resource Assessment – 2019 Update Executive Summary
Pale Blue Dot Energy (10365GLOB) Page 7 of 95
1.0 Executive Summary
The Global CO2 Storage Resource Assessment (GSRA) 2019 update is the first
of a six-year programme aimed at building a global view of the commercial
readiness of CO2 storage resources in key markets. Funded by the Oil and Gas
Climate Initiative (OGCI) with oversight by the Storage Working Group (SWG),
published results of potential resource evaluations are classified against the
Storage Resource Management System (SRMS). This system is based on the
Petroleum Resource Management System (PRMS) and provides a consistent
set of definitions and a classification system for CO2 storage resources. It aims
to reduce the subjective nature of resource assessment and allow sensible
comparison of resource potential. The GSRA 2019 Update comprises a web-
based database of assessed storable quantities accompanied by this report, the
annual summary of resource classification. Unless otherwise stated, all resource
quantities stated are mid case values close to P50 estimates.
The 2019 Update reviewed published evaluations of potential storage resources
from 525 sites across 12 countries or regions (Figure 1-1). This includes both oil
and gas fields and saline aquifers but excludes CO2-Enhanced Oil Recovery
projects (CO2-EOR) and other storage options such as unmineable coal, basalts
and organic-rich shales. The aggregated storage resource across all SRMS
maturity classes is 12,267 Gigatonnes (Gt) but this combined figure masks the
wide range of data availability, approaches, and methodologies applied across
the resource evaluations. Over 97% of this aggregated figure is currently
classed as ‘Undiscovered (Prospective)’ meaning that further drilling or
enhanced reporting is required before discovered resource can be declared.
Only 3%, or 408 Gt, of the aggregated storage resource is classified as being
Discovered but Sub-Commercial or Contingent resource. Here, the current level
The Global CO2 Storage Resource Assessment (GSRA)
2019 update has assessed 525 CO2 storage resource
sites from 12 countries/regions against the SPE Storage
Resources Management System (SRMS). Both oil and
gas fields, and saline aquifers are assessed.
To date, 84.8 Gt storage resource is held within defined
storage projects, only a small portion of the total 12,267
Gt project and non-project, aggregated global storage
resource. Of this global total, only 3.3% is classed as
Discovered (408.6 Gt) with less than 0.001% assessed
as Commercial resource (106 Mt).
Since CO2 Enhanced Oil Recovery projects are not
accounted for in the SRMS, active commercial projects
are only operating in Australia, Canada, Norway and the
U.S.A.
Whilst this assessment has identified several challenges
with the SRMS framework, future resource evaluations
should comply with SRMS guidelines to build a more
robust global picture of CO2 storage potential and
maturity.

Global Storage Resource Assessment – 2019 Update Executive Summary
Pale Blue Dot Energy (10365GLOB) Page 8 of 95
of understanding, economic, or regulatory conditions are not yet mature enough
for commercial development. While the scale of these estimates is encouraging,
suggesting that significant storage potential exists globally, the commercial
readiness of the global resource remains very low due largely to business model
and economic constraints. As of the end of 1st quarter 2020, only 0.1 Gt of the
resources assessed was classed as Commercial with a further 0.03Gt as
Stored. The assessment highlights the disparity in maturity of the reported
storage resource on a global scale (Figure 1-2). Of the twelve countries
assessed, only four (Australia, Canada, Norway and the USA) carry any
commercial resource, but even in these countries where regulatory and legal
frameworks exist to allow CCS, the lack of policy to actively drive investment
and deployment means that the country-wide resource is still dominated by Sub-
Commercial and Undiscovered resources.
The SRMS is designed as a project-based classification system with
progression based on commercial triggers including national/federal regulatory
systems and financial investment to drive project progression. Currently only six
countries in the GSRA 2019 Update have identified projects (Figure 1-3) but
these are still dominated by Sub-Commercial and Undiscovered storage
resources. The GSRA 2019 Update has highlighted some areas where the
assessment of published evaluations against the SRMS is challenging.
Determining the proportion of discovered resource in large saline aquifers, the
wide range in detail and quality of published resource evaluations, a lack of
development plans linked to resource estimates, overcoming double counting
and aggregation, and the adherence of the evaluations to the SRMS, were key
issues identified. These factors also affect the level of confidence attached to
published estimates of storage resource, particularly at the Play level (sequence
or basin) where some studies indicate an order of magnitude difference between
estimates calculated from simple pore volume based methodologies and those
derived from numerical simulations where subsurface constraints such as
pressure change during injection can be taken into account.
Figure 1-1. Number of potential storage resource sites assessed in the 2019 Update, by country or region. N = 525.
For the SRMS to be used as designed, a more complete adoption of its guiding
principles and requirements is needed across the global CO2 storage resource
evaluation process. All evaluations should include a range of resource estimates
from either deterministic or probabilistic methodologies. Furthermore. in the
absence of numerical simulations to assess the impact of pressure on storage
potential, any analogue parameters (e.g. storage efficiency factors) should be
provided together with a clear justification for their selection.
As a result, all countries or regions probably carry a significant commercial
maturity understatement and improving this should be a focus of future
USA: 132
China: 72
Australia: 29
Canada: 67
Norway: 42
UK: 87
India: 15
Pakistan: 17
Bangladesh: 23
Baltic: 13Brazil: 28
Sri Lanka: 1
2019 GSRA - 2019 Update: Number of Sites

Global Storage Resource Assessment – 2019 Update Executive Summary
Pale Blue Dot Energy (10365GLOB) Page 9 of 95
assessment cycles. Similarly, on-going injection operations and projects under
active evaluation should be re-assessed annually to monitor progression or
resource maturity. At present the GSRA 2019 Update is currently
underpopulated in this class. Workers on CO2 storage resources around the
world are encouraged to submit a summary resource statement for
consideration and inclusion in future annual updates.
This work has been commissioned by OGCI and led by the Global CCS Institute
and supported by Pale Blue Dot Energy.

Global Storage Resource Assessment – 2019 Update Executive Summary
Pale Blue Dot Energy (10365GLOB) Page 10 of 95
Figure 1-2. Both project and non-project specified storage resource summary for the countries assessed by the GSRA 2019 update. Data labels represent the assessed potential storage resource by SRMS maturity class in millions of tonnes (Mt) (Note: the z scale on this plot is logarithmic)
Figure 1-3. Project-specific storage resource summary for the countries assessed by the GSRA 2019 update. Data labels represent the assessed potential storage resource by SRMS maturity class in millions of tonnes (Mt) (Note: the z scale on this plot is logarithmic)

Global Storage Resource Assessment – 2019 Update Objectives & Approach
Pale Blue Dot Energy (10365GLOB) Page 11 of 95
2.0 Objectives & Approach
Figure 2-1 Map showing countries included in the GSRA 2019 Update Assessment.
2.1 Objectives
This GSRA 2019 Update report fulfils the delivery of an annual programme of
the classification of published storage resource evaluations using the SPE
SRMS (Society of Petroleum Engineers (SPE) 2017). This project supports the
Oil and Gas Climate Initiative Storage Working Group (OGCI SWG) in identifying
the availability of CO2 storage resource in key markets. The current programme
builds on the work of Pale Blue Dot Energy’s interim assessment, produced for
the OGCI in 2017. This Update represents the first in a six-year programme,
which aims to capture advances in CO2 storage resource evaluation during this
period.
The programme has four main objectives:
• Support the deployment of CCS as a sustainable low-emissions
technology
• Build confidence in CO2 storage resources to support the
deployment of CCS
• Provide a visible platform for global storage potential
• Establish the SPE’s SRMS as robust reporting mechanisms for CO2
storage
Each objective is met through a series of work packages.
Work Package 1
Objective: to complete CO2 storage resource assessments by classifying
published CO2 storage resource evaluations from around the world, against the
SRMS. The 2019 Assessment both updates the 2017 Interim Assessment
(PBDE, 2017) and focuses on a ‘priority’ country selected by the OGCI SWG. In
2019, the priority country was Canada.
Work Package 2
Objective: to build, populate and deliver the Global CO2 Storage Resources
website based on the outputs of Work Package 1. This work package is
delivered by the Global CCS Institute (GCCSI).
Work Package 3
Objective: to develop and publish a summary of the current classification of the
target regional CO2 storage resource assessments against the SRMS system
(this report).

Global Storage Resource Assessment – 2019 Update Objectives & Approach
Pale Blue Dot Energy (10365GLOB) Page 12 of 95
Work Package 4
Objective: to establish an outreach programme to selected stakeholders. The
first level of engagement will focus on senior budget holders in major institutions
responsible for regional resource estimation. The objective with these
stakeholders is to build support for the SPE SRMS reporting system and its
implementation. The second group of stakeholders will include technical
resource estimators. The goal of this engagement level will focus on showing
how to use the SPE SRMS reporting system.
Note: As the first cycle of the programme was ending, the global Covid-19
pandemic resulted in the cancellation and/or long-term postponement of many
of the events identified as candidates for implementing the Work Package 4
outreach programme. In response, the Assessment Team proposed replacing
the outlined programme with a webinar designed to meet the goals of the work
package.
Figure 2-2. Work flow for Work Packages 1, 2, 3 and 4 of the GSRA – 2019 Update
2.2 Approach
The GSRA 2019 Update deployed the SRMS against a library of publicly
available information sources and evaluations collated by the assessment team
and the Storage Working Group. The effort in Work Package 1 of this project
was focussed in two main areas:
• A review and update of the preliminary storage resource
classification undertaken in 2017 by PBDE (PBDE, 2017) which
targeted Australia, the Baltic Region (Denmark and Germany),
Bangladesh, Brazil, China, India, Norway, Pakistan, United
Kingdom, and the United States of America.
• A detailed assessment of the ‘priority’ country for the 2019
assessment cycle: Canada.
In order to align fully with the current SRMS, only depleted or partially depleted
oil and gas fields, and saline aquifers were included in the assessment;
alternative storage resources such as CO2-Enhanced Oil Recovery (EOR)
operations, basalts, unconventional organic-rich shales, and deep unmineable
coals seams were excluded.
A comprehensive bibliography of papers and web-based datasets, all available
in the public domain, was built and reviewed prior to being approved by the
OGCI SWG for use. This formed the basis of the assessment and is presented
in Section 5.0. The bibliography contains a wide range of information sources,
including regional scale national and multinational CO2 storage resource
assessments, more detailed evaluations, often targeting a basin, sub-basin, or
formation, and focussed technical studies of a field or site.
WP1: Define, acquire, review portfolio of CO2
Storage Resource Assessments.
Restate Assessments against current SRMS
& Guidance
WP2: Deliver a webpage to display the
outputs of WP1. (GCCSI)
WP3: Develop publishable summary report & key findings including a statement
regarding the shift from the previous annuual
statement
WP4: Preparation of materials and delivery of two outreach events / conferences in region

Global Storage Resource Assessment – 2019 Update Objectives & Approach
Pale Blue Dot Energy (10365GLOB) Page 13 of 95
Following review of the evaluation documents, each storage resource was taken
through the SRMS classification process (see Section 3.0 for additional
information). Key data for the resource were collated, where available, and
assessment notes to support and clarify assessment decisions were
documented in the GSRA database.
The Assessment Team met regularly to perform due diligence and consistency
reviews on both the data and the classification process. Additional feedback and
guidance were provided by the OGCI SWG. Once Work Package 1 was
complete, the database was uploaded to the website developed in Work
Package 2.
This report is the deliverable for Work Package 3 and is a summary report to
accompany the 2019 cycle of the annual assessment. It should be viewed as an
accompanying document to the Global CO2 Resources database (Work
Package 2 deliverable).
2.3 Report Organisation
The report is organised into four key sections. Section 3.0 provides an overview
of key aspects of the SRMS and highlights some challenges encountered while
deploying the system during the GSRA 2019 Update. It also provides a
description of the terminology applied during this assessment and guidance as
to how some of the challenges were handled. Section 4.0 provides a summary
of the 2019 Assessment and gives recommendations for future assessment
cycles. The classification process has been applied to all sites identified from
the bibliography in Section 5.0. Section 6.0 (Appendix A) provides the 2019
Country Assessments, where further details of each country’s storage resource
can be found.

Global Storage Resource Assessment – 2019 Update Storage Resource Management System (SRMS)
Pale Blue Dot Energy (10365GLOB) Page 14 of 95
3.0 Storage Resource Management System (SRMS)
The development of the Storage Resource Management System (SRMS) aims
to provide similar support to the CCS industry as the Petroleum Resource
Management System (PRMS) does for the petroleum industry, supporting
petroleum project development through resource classification for investment.
More specifically to CCS, the SRMS aims to:
• Enable nations to map the progression of storage resource maturity
in a key evolving industry.
• Create consistency in the use of resource terminology to improve
communication of key issues between practitioners, financiers,
regulators, and policy makers.
• Improve confidence regarding resource assessments with potential
customers of CCS who are unfamiliar with subsurface issues but
who need to make important business decisions.
Key levers for resource progression along the SRMS are commercial, project
related steps. In contrast to many current approaches to maturing potential CO2
storage sites, neither the type of resource nor the methodology of evaluating the
resource are the key drivers. The main levers are:
• Discovery status of the resource, as per SRMS guidelines
• The status of the regulatory system in the jurisdiction area
• Internal project decision to proceed
• External regulatory consent to proceed
• Commencement of operations
• End of injection
• The point of handover of long-term responsibility for the injected CO2 to
the state
The SRMS was originally published as a draft version in 2017 and was updated
later that year. The approach to applying the SRMS in this 2019 Assessment
uses this updated version (SPE, 2017) and has attempted to rigorously apply
the published guidance and terminology throughout the assessment to ensure
a consistent approach. There are several terms used throughout the work which
are highlighted below.
A classification flowchart (Figure 3-1), derived from the SRMS documentation,
has also been developed and updated, and has been used to aid the
classification process throughout the assessment. Note that the SRMS does not
separate the ‘Play’ classification into ‘Sequence’ and ‘Basin’, however during the
interim assessment undertaken in 2017 (see 2.1), it was recommended to
distinguish the following:
• Basin – where no storage formation was defined in the published
data and the evaluation uses only the basin area and generic
reservoir properties.
• Sequence – where a specific storage formation was identified in the
published evaluation.
Although not distinguished by the SRMS, the classification was split in the GSRA
2019 Update to separate sites with a lower level of maturity within the Play
classification.

Global Storage Resource Assessment – 2019 Update Storage Resource Management System (SRMS)
Pale Blue Dot Energy (10365GLOB) Page 15 of 95
Figure 3-1. Flowchart for the classification of storage resources based on the SRMS guidelines and terminology.

Global Storage Resource Assessment – 2019 Update Storage Resource Management System (SRMS)
Pale Blue Dot Energy (10365GLOB) Page 16 of 95
3.1 Terminology
In the SRMS guidelines, ‘evaluation’ and ‘assessment’ have the same
meaning. In the GSRA 2019 update, these terms are used in the following
manner:
Evaluation: The geosciences, engineering, and associated studies, including
economic analyses, conducted on an exploration, development, or storage
project resulting in estimates of the CO2 quantities that can be stored and the
associated cash flow under defined forward conditions.
Assessment: The consideration of any Evaluations for the purpose of
classifying the estimates of derived CO2 storage resource quantities according
to the SRMS guidelines, as interpreted by the Assessor / Assessment team.
Total Storage Resource: This is the equivalent of Total Petroleum in Place in
the PRMS and represents the maximum conceivable theoretical storage
resource. The Total Storage Resource is the sum of: -
1. Storage resource assuming pore volume water is fully saturated in
dissolved CO2
2. Storage resource assuming pore space in unstructured saline aquifers
is fully occupied with CO2 to the maximum residual saturation level (after
CO2 flood with 100% sweep efficiency)
3. Storage resource assuming pore space in structured saline aquifers &
oil/gas fields is fully occupied with CO2 leaving only irreducible water
saturation
3.1.1 Storage Project
The SRMS is a project-based system. The SRMS guidelines state that ‘to assign
resources of any class, a development plan consisting of one or more projects
needs to be defined’. It is expected that the development plan, which may be
based on appropriate analogues for Prospective Resources, will mature as the
project progresses through the SRMS. However, the reality is that due to the
lack of data available in the source bibliography, many resources do not have a
published development plan. To aid in the identification of resource sites which
have a published development plan each database entry is coded as either
identified as a ‘Project’ or not. In order to gain ‘project’ status, some level of
development plan, conceptual or derived from modelling, must be available or
implied with a stated volume of CO2 with an associated plan including the
number of wells required to inject that volume of CO2. This means that both
Undiscovered and Discovered resources may be defined as projects.
3.1.2 Treatment of Discovered Saline Aquifer Resources
“A discovery is a geologic formation or several geologic formations collectively,
for which one or several wells have established through testing, sampling,
and/or logging the existence of a significant quantity of potential CO2 storage for
a proposed project” (Society of Petroleum Engineers (SPE) 2017). When
determining the discovery status of open, unstructured, clastic saline aquifers a
problem arises, when part of the aquifer may have been discovered through
hydrocarbon exploration, while another part may be largely undrilled. To
overcome this, an area of 200 km2 (circle of 8km radius) around wells within the
site that have proven reservoir potential and containment was considered as
discovered. This permitted the discovered proportion of the saline aquifer to be
calculated from the well density where this was available. Unless otherwise

Global Storage Resource Assessment – 2019 Update Storage Resource Management System (SRMS)
Pale Blue Dot Energy (10365GLOB) Page 17 of 95
specified, the reported well number was assumed to be evenly distributed
across the site area. For some areas, particularly those covering a large
geographic area with an unknown number of wells (e.g. USA states and
Canadian provinces), no well density is available and the whole area is
considered undiscovered other than any specific projects or sites which are
defined separately. The area of 200 km2 was selected, following results from a
study of well density in the UK Southern North Sea Bunter sandstone (PBDE,
2017). The area within the selected well radius is classed as Discovered but with
the following caveats applied:
• The analogue used for the storage efficiency factor linked with the
discovered contingent resource is clearly identified, where possible.
• ‘The storage site is flagged as ‘Discovered awaiting detailed
assessment’ for the area linked to the exemplar or analogue while
the potential resource outside the well discovery zone is flagged as
‘Undiscovered’. Together this represents a partly discovered site.
• A smaller area was considered for use in complex formations such
as carbonates:- 20km2 discovery area for carbonate platforms with
limited diagenesis or 0.5km2 discovery area for carbonate reef
formations. In practise, the data availability in the published sources
precluded the use of this approach for carbonate formations and a
200km2 area around discovery wells was adopted.
3.1.3 Treatment of Petroleum Accumulations
By definition, conventional petroleum accumulations are considered to be
Discovered from an SRMS perspective, due to the proven reservoir and
containment potential, and having been characterised as having a structural or
stratigraphic trap.
It is recognised that the simultaneous production of hydrocarbons and injection
of CO2 in the same site, is commercially problematic outside a pilot or full field
deployment of a CO2-EOR programme. This is due to issues of licensing,
materials selection, and product contamination amongst others. As a result,
many countries have specific legislation to prevent negative interaction between
CO2 injection and petroleum production. This lack of regulatory access may
lead to the classification of certain storage resources as Sub - Commercial but
Inaccessible for use, yet may change if there is a date forecast with reasonable
confidence, at which that negative interaction will cease and that that date is
within a reasonable timeframe. This classification is consistent with the SRMS,
which defines Inaccessible resource as the “Portion of discovered resources that
are inaccessible from development as a result of a lack of physical, societal, or
regulatory access at the surface or subsurface.” This approach will leave
supergiant fields, whose cessation of production (COP) date is far into the future,
and other accumulations which have no published estimation of the COP date
as Sub - Commercial but Inaccessible.
To manage this situation, an "Earliest Accessible Date" (EAD) threshold has
been set 30 years into the future, from the point of the storage resource
assessment. Where the COP is later than the EAD, the resources are classified
to be Sub - Commercial but Inaccessible at the time of assessment, due to
regulatory/commercial issues preventing the sanctioning of CO2 injection in the
vicinity of petroleum productions sites. If no COP is specified (as is the case
with many producing properties) then it is assumed that production will continue
past the EAD and therefore the storage resources are also Sub - Commercial
but Inaccessible. Whilst this may be considered a harsh threshold, petroleum
Operators should be encouraged to think beyond the production cycle for the
use of the subsurface resources. Indeed, the SRMS notes that Inaccessible

Global Storage Resource Assessment – 2019 Update Storage Resource Management System (SRMS)
Pale Blue Dot Energy (10365GLOB) Page 18 of 95
resources "may be used for storage in the future as commercial or regulatory
circumstances change". As such, should a COP for a specific producing field
become known and published then, subject to this being earlier than the EAD,
the associated storage resource could progress into a contingent storage
resource classification.
For the GSRA 2019 update, to be published in 2020, the EAD is set to 2050.
In countries which have no published regulatory system covering CO2 storage
licensing, then all discovered potential storage resources (whether former
petroleum producing properties or not) have been classified as Sub -
Commercial but Inaccessible, regardless of knowledge or status of COP as
these are constrained by the lack of regulatory system.
It is noted that the SRMS could be clearer in its definition of Inaccessible storage
resources. Currently the glossary contains the following definitions:
Inaccessible: Portion of discovered resources that are inaccessible
from development as a result of a lack of physical, societal, or regulatory
access at the surface or subsurface.
Inaccessible Contingent Storage Resources: Portion of Contingent
Storage Resources’ storable quantities that is identified but is not
considered available for storage. (Note this definition is in direct conflict
with Figure 2.1 of the SRMS document which clearly shows that
Discovered Inaccessible Storage Resources are not part of the
Contingent Storage Resources class)
Inaccessible Resources: That portion of Contingent (Discovered) or
Prospective (Undiscovered) Storage Resource quantities, which are
estimated as of a given date, not to be used for storage. A portion of
these quantities may become storable in the future as commercial
circumstances change, technological developments occur, or additional
data are acquired.(Note this definition is in direct conflict with Figure 2.1
of the SRMS document which clearly shows that Discovered
Inaccessible Storage Resources are not part of the Contingent Storage
Resources class and that Undiscovered Inaccessible Storage
Resources are not part of the Prospective Storage Resources class)
Inaccessible Storage: Storable quantities for which a feasible project
cannot be defined by use of current, or reasonably forecast
improvements in, technology.
Clearly, from Figure 2.1 in the SRMS guidelines (and incorporated into the
SRMS Flowchart in Figure 3-1 in this report), Inaccessible storage resources
contribute to the Total Storage Resource, but lie outside both Contingent and
Prospective storage resource classifications. This contradiction should be
resolved by the SRMS committee soonest.
It is appreciated that the terminology and guidance of how this may be applied
in the SRMS may change in the future; the 2019 assessment is designed to
conform to the 2017 published SRMS, together with its glossary of definitions
and guidance.
3.2 Double Counting
The source bibliography portfolio contains a wide diversity of published
estimates of storable quantities using different approaches and methodologies
which are not always documented in detail. Often, as with the US DOE CO2
Storage Atlas, estimated storable quantities are presented on a state or province
basis, without the detailed information on which basins or geological formations,
Global Storage Resource Assessment – 2019 Update Storage Resource Management System (SRMS)
Pale Blue Dot Energy (10365GLOB) Page 19 of 95
or which portions of these were included in the estimate. At the same time,
estimated storable quantities may be available for the same geographic region
but at a Basin and/or Formation level, and not attributed to a state or
province. This creates a clear risk of double counting which is acknowledged
and must be appropriately managed.
Ideally, estimated storable quantities should be presented on the basis of basin,
formation, state, and storage site to enable appropriate countrywide
assessment, however, this is currently only available in countries with no
requirement for state or provincial resource breakdowns, such as the UK and
Norway.
Four potential strategies for handling this concern have been considered: -
1. Calculate
This would involve the refinement of the estimated storable quantities by the
Assessor, such that each was divided by basin, formation, state, and storage
site using the published materials. Such allocation is likely to either:
• Degrade the quality of the regional storage resource estimate
• Lend more credibility, maturity and confidence to early regional
evaluations than is appropriate
• Introduce additional error to the evaluation by using an inappropriate
allocation algorithm
• Falsely suggest that adequate definition was available for the
important early, regional evaluations to allow reliable and
representative allocation
As such, where there is an evaluation which covers more than one state, region,
province, or basin within the same country, no attempt to allocate resources
between the various areas has been made.
The ‘calculate’ approach was tested but it was rarely possible to complete in a
manner acceptable to the assessment team and is beyond the scope of this
assessment.
2. Ignore
This option accepts and acknowledges that the issue is real, but simply make
no attempt to estimate its impact. Whilst the Calculation Option is not possible,
this approach was not viable since it would undermine the Global Storage
Resource Assessment programme objectives.
3. Subtract
This approach subtracts the storage resource of a specific storage site from the
more regional or state-wide estimate that covers the same geographical
area. This option has some potential to manage the double counting issue. The
SRMS however presents very clear guidance on the aggregation of resource
estimates, which it is felt should apply equally to subtraction of resource
estimates as well as summation. Specifically, the SRMS guidance is that
"Storable quantities classified as Capacity, Contingent Resources, or
Prospective Resources should not be aggregated with each other without due
consideration of the significant differences in the criteria associated with their
classification". With single state-wide estimates being classed here as
‘Undiscovered’, the subtraction of the ‘Discovered’ contingent resources from a
specific site is problematic. Subtraction has been used in some cases where it
was considered appropriate but only for storage resources within the same
major SRMS maturity class.

Global Storage Resource Assessment – 2019 Update Storage Resource Management System (SRMS)
Pale Blue Dot Energy (10365GLOB) Page 20 of 95
4. Qualify
Another approach is to accept the state-wide estimates as very high-level
summaries and where more detailed and/or reliable technical summaries with a
basin / formation / site focus are available they have been selected as the
preferred source. In these circumstances, the state-wide entry in the
assessment database is still preserved and the estimates included in the
assessor’s notes, but no resources have been classified.
The Subtract and Qualify approaches outlined noted here have been used to
manage the Double Counting issue to some extent. Whilst these approaches
mitigate some of the risk of double counting, it is not possible at this stage to
eliminate fully the risk of double counting within the GSRA database. Where this
is identified as a significant issue, this is reported in the accompanying country
assessment documentation.
3.3 Multiple Evaluations
Where multiple evaluations of an area or site are available the principles that
have been followed are: -
• Where possible use the most recent evaluation, especially where the
methodology would result in the most reliable estimate of storable
quantities.
• If the most recent evaluation is considered less reliable due to the
approach taken or a lack of detail published about the evaluation, then
an older evaluation may be used instead with justification provided in
the assessment notes.
3.4 Single Evaluations
Where a single evaluation of an area or site is available then this evaluation has
been used as input to the assessment. The assessment will include a note from
the assessor regarding the reliability of the assessment and any specific
concerns that have arisen from the available reports of the evaluation. If critical
assessment evidence is not presented or is unclear, the assessor may have
assigned the resources to a lower maturity SRMS class than the site may
actually qualify for if more detailed information were available. As a result, the
storage resource assessments presented will be an underestimate of the actual
maturity of the portfolio. This can be adjusted in future years as workers on each
site either publish or directly submit evidence to this programme.
3.5 SRMS Evolution Draft to Approved July 2017
There was some evolution of the SRMS between the draft deployed in the OGCI
2017 assessment and this GSRA 2019 update. One specific change was in the
definition of Contingent Resource sub-classes and is outlined in the table
below:

Global Storage Resource Assessment – 2019 Update Storage Resource Management System (SRMS)
Pale Blue Dot Energy (10365GLOB) Page 21 of 95
Of particular note is the clarification of the Development Unclarified sub class in
the SRMS - Approved July 2017. The guidance for this sub class is that "it
requires active appraisal or evaluation and should not be maintained without a
plan for future evaluation." The implications of this change are that many
potential CO2 storage sites which have demonstrable storage resource potential
including many depleted petroleum fields, for which no current plans for future
evaluation are available must now be assessed as Development Not Viable
rather than Development Unclarified. This is despite the SRMS definition of
Development Not Viable referring to "limited storage potential" which is
interpreted here as limited technical or commercial potential at the time of
assessment. This includes sites which have good technical potential but limited
commercial potential due to limited demand from storage developers to progress
at the current time.

Global Storage Resource Assessment – 2019 Update Summary & Recommendations
Pale Blue Dot Energy (10365GLOB) Page 22 of 95
4.0 Summary & Recommendations
4.1 Summary
The GSRA 2019 update has assessed the potential storage resource from
twelve countries against the 2017 SRMS (Society of Petroleum Engineers (SPE)
2017). This has delivered a classified inventory of over 525 potential storage
sites with an aggregated storage resource of 12267 Gt*.
Classification CO2 storage resource (Gt)
Project and no project
CO2 storage resource (Gt)
Project specified
Stored 0.028 0.028
Capacity 0.106 0.106
Sub-Commercial 408 65.59
Undiscovered 11859 18.92
Aggregated* 12267 84.77
* The aggregated resource represents the summed storage resource across all maturity classes and as such
should not be viewed as representative of the potential of the country.
Table 4-1. Storage resource classification summary for the GSRA-2019 Update
As shown by Table 4-1, the resource base is dominated by the pre-commercial
Undiscovered (97%) and Sub-commercial (3%) classes of storage resource.
Commercial projects and those where CO2 is approved for development or
already being injected and stored in the subsurface only contribute 0.13 Gt to
the overall inventory; less than 0.001%. Only 84.6 Gt (0.7%) of the aggregated
potential resource is within defined projects.
The skewed distribution of the storage resource classification highlights one of
the key issues with current storage potential evaluations; most are not reported
with storage resource classification in mind and often do not provide the detail
required to fully assess the discovery status of a site. However, the large
resource estimate is encouraging evidence for significant storage potential on a
scale which matches the industrial and societal requirements. This observation
is tempered both by the small number of projects (52) identified by the GSRA
2019 update and by the classification of many projects as Development Not
Viable as, although the projects demonstrate storage potential, none are either
currently being progressed or under active evaluation.

Global Storage Resource Assessment – 2019 Update Summary & Recommendations
Pale Blue Dot Energy (10365GLOB) Page 23 of 95
Figure 4-1. a) Spread of global storage resource across SRMS classifications, both project specified and not. b) Spread of global storage resource across SRMS classifications, where a project has been specified. c) Split of global storage resource between saline aquifers and hydrocarbon fields, both project specified and not.
Saline aquifers dominate the resource inventory (11,999 Gt: 98%) mainly due to
the large storable quantities from the national and regional atlases and studies.
The resource estimates for the saline aquifers rely largely on volumetric
calculation, however, and, as such, should be regarded as very high-level
estimates of storage potential.

Global Storage Resource Assessment – 2019 Update Summary & Recommendations
Pale Blue Dot Energy (10365GLOB) Page 24 of 95
Figure 4-2. Storage resource summary for the countries assessed in the GSRA 2019 update, both project specified and not.
Global Storage Resource Assessment – 2019 Update Summary & Recommendations
Pale Blue Dot Energy (10365GLOB) Page 25 of 95
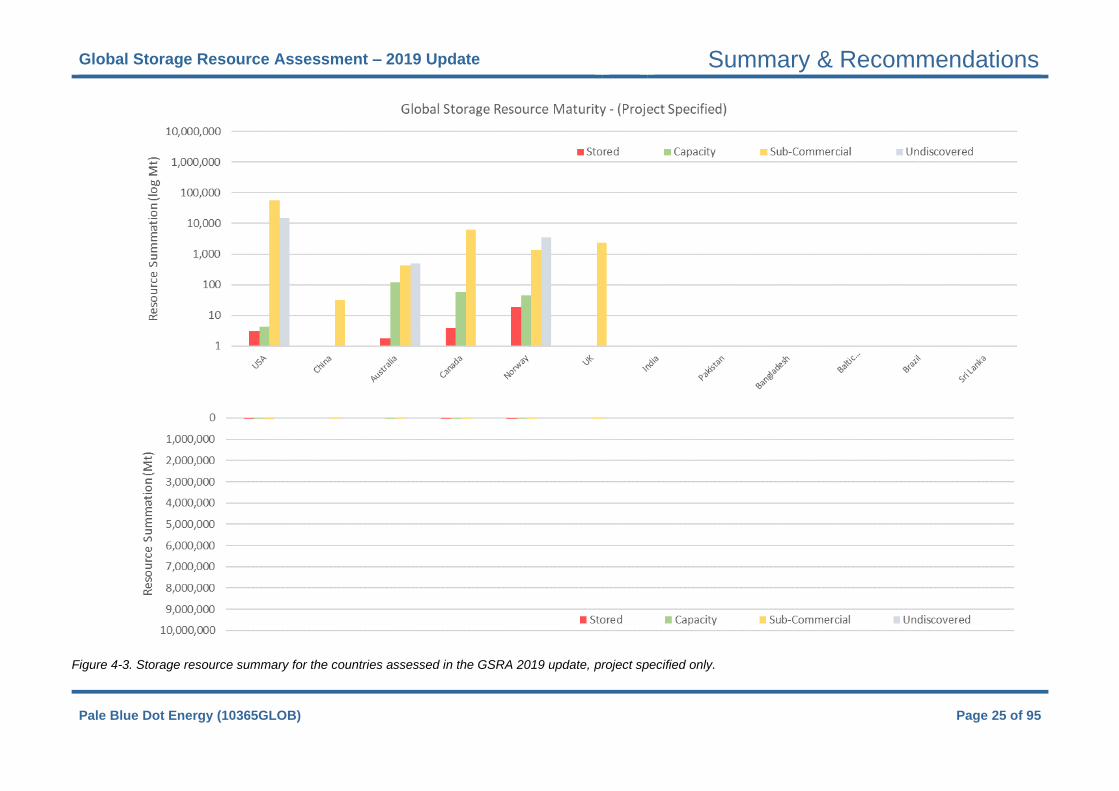
Figure 4-3. Storage resource summary for the countries assessed in the GSRA 2019 update, project specified only.

Global Storage Resource Assessment – 2019 Update Summary & Recommendations
Pale Blue Dot Energy (10365GLOB) Page 26 of 95
Oil and gas fields only contribute 2% (268 Gt) of the aggregated storage
resource for this assessment. Most of this resource is classed as Discovered:
Inaccessible as only Norway and the UK provide COP or EAD dates with the
published reserves data
Significant volumes of CO2 are being injected into depleted fields for enhanced
oil recovery, particularly in North America, but CO2-EOR is not currently covered
by the SRMS and so was not considered in the GSRA.
Figure 4-2 displays the storage resource for all the sites that have been placed
in the SRMS classification system. Norway and Canada are the most mature
with significantly greater resource sitting in the Commercial class. However,
there are only four countries in which CO2 has been stored in the subsurface
with projects currently classed as being commercially mature. In all countries,
except Norway, the Undiscovered resource dominates the inventory, however it
is acknowledged that the maturity of some countries such as the UK is
understated.
4.2 Issues
In general, there is a wide variation in data quality and quantity in the evaluations
in the bibliography. This can be split into two key areas:
1. a lack of breakdown of resource at the basin or formation level,
2. and a lack of consistency in the approach to resource estimation.
Many countries, even those seen to be advancing CCS (e.g. USA), are
dominated by high level, data-light, published resource estimates due to the
huge geographic areas to be covered. In others, e.g. Australia, the problem lies
with current resource estimates being over a decade old and in need of update
with more up-to-date methodologies. Some countries have yet to be rigorously
evaluated, providing only single estimate, poorly defined storage resource
values. A consistent and benchmarked methodology is essential for maintaining
a balanced overview of available potential resources in a region.
As discussed in Section 3.0 of this report, double counting remains as issue
within this assessment. To adhere to SRMS guidelines on aggregation, there
are several examples where Prospective (often regional) and Contingent (often
local) resources are carried for the same basin or formation. The large size of
the Prospective resource relative to the Contingent means the double counting
is not numerically significant but this again emphasises the issue with poorly
constrained resource evaluations.
Only 10% of the 525 sites in the GSRA 2019 update are defined projects and
only 9% have a numerical simulation providing the resource estimate. Given the
example of the Basal Sand in Canada where there is an order of magnitude
difference between the volumetric estimate of storage potential derived from a
3D static model, and that from the simulated (using an equivalent 3D static
model) injection of CO2 taking pressure build-up during active injection into
account, the validity of the very large volumetric estimates must be questioned.
As discussed in Section 3.0, many evaluations only provide a single resource
estimate. The data available for the GSRA 2019 update suffer from a lack of
probabilistic analysis; most studies do not provide a range of estimates of
storage resource. An additional issue lies with the active storage projects where
often the storage resource value is the permitted value for the operation, not the
simulated storage resource.
Oil and gas fields offer a well-defined storage option, albeit for often smaller
volume of CO2, however, other than the UK and Norway, it is unusual to have
published COP or EAD available. This means that many large, potentially

Global Storage Resource Assessment – 2019 Update Summary & Recommendations
Pale Blue Dot Energy (10365GLOB) Page 27 of 95
commercial storage resources are currently classified as Inaccessible and
cannot be moved through the SRMS system until the necessary data are made
available.
While several countries in the 2019 update currently have CCS-specific
regulatory and legal frameworks either federally or at a state/province level,
most are still lacking a comprehensive policy to drive investment and actively
encourage deployment of CCS. This is a major obstacle to development of
potential storage resources at the rate considered necessary to meet the
industrial and societal requirement.
4.3 Recommendations
• All storage assessments should include low, medium, and high
estimates of storage resource from either probabilistic or Monte
Carlo methodology.
• Specific sources of any analogue parameters used in estimation
such as storage efficiency should always be provided.
• All workers in the CO2 storage and CCS space should endeavour to
use the key terms from the SRMS in a consistent manner and
replace the common usage of ‘capacity’ with ‘storage resource’.
• Further systematic assembly of storage exemplars and their storage
efficiency characteristics should be developed as a global resource
tool to support accelerated storage resource assessment.
• Active pilots and projects should be re-assessed in each assessment
cycle to monitor the progression of the project.
• Countries such as the USA which are at risk of significant under-
statement of commercial maturity should be considered for on-going
assessment in future. In the USA large data resource sits with the
Regional Partnerships and should be accessed. In addition, the DOE
Carbon SAFE projects should be added to the database as
information becomes more readily available.

Global Storage Resource Assessment – 2019 Update Bibliography
Pale Blue Dot Energy (10365GLOB) Page 28 of 95
5.0 Bibliography
Note: The following bibliography contains all the references considered during
the GSRA 2019 update. They may be referenced directly in this report,
used as a source of storage resource in the accompanying GCCSI
website database, or may have been excluded from this study due to a
more recent evaluation of a site. In the latter case, the reference may
not be cited in either this report or the website database.
ACT Acorn Consortium. 2018. “D07 Acorn CO2 Storage Site Development
Plan 10196ACTC-Rep-27-01.”
ACT Acorn Consortium. 2018. “D08 East Mey CO2 Storage Site Development
Plan 10196ACTC-Rep-26-01.”
Adeyinka, A, G Pickup, and P Olden. 2013. Numerical Simulation of CO2
Storage Using the Vertical Equilibrium Approximation. SPE.
Alshuhail, A.A., Lawton, D.C. and Isaac, H.J. 2011. “Geophysical
characterization of the Devonian Nisku Formation for the Wabamun
Area CO2 Sequestration Project (WASP), Alberta, Canada.” Energy
Procedia (Elsevier) 4: 4696-4703.
Anthonsen, K, C Bernstone, and H Feldrappe. 2014. “Screening for CO2
storage sites in Southeast North Sea and Southwest Baltic Sea.”
Energy Procedia 5083-5092.
Anthonsen, K. L., Frykman, P., Nielsen, C. M. 2016. “Mapping of the CO2
storage potential in the Nordic region.” Geological Survey of Denmark
and Greenland Bulletin 35 87-90.
Australian Government. 2009. “National Carbon Mapping and Infrastructure
Plan.”
Australian Government: Geoscience Australia. 2016. “Carbon dioxide storage
potential of the Gippsland Basin.”
Australian Government: Geoscience Australia. 2015. “China Australia
Geological Storage of CO2 Project Phase Two (CAGS2).”
Australian Government: Geoscience Australia. 2019. “Combined study of static
and dynamic reservoir modelling for the CO2 storage project in deep
saline aquifer in Zhundong, Xinjiang, China.”
Australian Government: Geoscience Australia. 2008. “Description, Distribution
and Potential CO2 Storage/Seal Capacity of the Cenozoic Sandstones
and Carbonates, Browse Basin, Western Australia.”
Australian Government: Geoscience Australia. 2014. “Regional assessment of
the CO2 storage potential of the Mesozoic succession in the Petrel
Sub-basin, Northern Territory, Australia.”
Bachu, S, D Bonijoly, J Bradshaw, R Burruss, S Holloway, NP Christensen,
and OM Mathaissen. 2007. “CO2 Storage Capacity Estimation;
Methodology and gaps.” International Journal of Greenhouse Gas
COntrol 430-443.
Bachu, S. & Shaw, J. 2004. “CO2 storage in oil and gas reservoirs in western
Canada: Effect of aquifers, potential for CO2-flood enhanced oil
recovery and practical capacity.” Proceeding of the 7th International

Global Storage Resource Assessment – 2019 Update Bibliography
Pale Blue Dot Energy (10365GLOB) Page 29 of 95
Conferecnce on Greenhouse Gas Control. Vancouver: Greenhouse
Gas Control Technologies 7. 361-369.
Bachu, S. 2004. “Evaluation of CO2 Sequestration Capacity in Oil and Gas
Reservoirs in the Western Canada Sedimentary Basin.”
Bachu, S., Brydie, J., Hauck, T., Lakeman, B., Palombi, D., Stoakes, F.,
Wendte, J., Lawton,D., Mehran-Pooladi, D., Hawkes, C., Chalaturnyk,
R., Krawec, T. and Sawchuk, W. 2011. “The Heartland Area Redwater
CO2 storage project (HARP): results of Phase I site characterization.”
Energy Procedia 4: 4559-4566.
Bachu, S., Melnik, A. and Bistran, R. 2014. “Approach to evaluating the CO2
storage capacity in Devonian deep saline aquifers for emissions from
oil sands operations in the Athabasca area, Canada.” Energy Procedia
(63): 5093-5102.
Baines, S, and R Worden. 2004. “Geological storage of carbon dioxide.”
Geological Society of London.
Bandilla, K, T Elliot, M Celia, M Person, I Nordbotten, J Rupp, and K Ellett.
2012. “Modeling carbon dioxide sequestration in the Illinois Basin
using a vertically integrated approach.” Computing and Visualisation in
Science 39-51.
Bedard, K., Malo, M. and Comeau, F.A. 2013. "CO2 Geological Storage in the
Province of Quebec, Canada – Capacity Evaluation of the St.
Lawrence Lowlands Basin." Energy Procedia (37): 5093 - 5100.
Bentham, M. 2006. An Assessment of Carbon Sequestration Potential in the
UK-Southern North Sea Case Study. Tyndall Centre for Climate
Change Research.
Bentham, M, A Green, and D Gammer. 2013. “12.3.9 The occurrence of faults
in the Bunter Sandstone formation of the UK sector of the Southern
North Sea and the potential impact on storage capacity .” Energy
Procedia 5101-5109.
Bentham, M, and G Kirby. 2005. “CO2 Storage in Saline Aquifers.” Oil & Gas
Science and Technology, Vol 60 No 3 p559-567.
Bentham, M, J Pearce, K Kirk, S Hovorka, S van Gessel, B Pegler, S Neades,
and D Dixon. 2014. “Managing CO2 storage resources in a mature
CCS future.” Energy Procedia 5310-5324.
Bentham, M, T Mallows, J Lowndes, and A Green. 2014. “CO2 Storage
Evaluation Database (CO2Stored). The UK's online storage atlas.”
Energy Procedia 63 (BGS) 5103 - 5113.
Birkholzer, J, and Q Zhou. 2009. “Basin-scale hydrogeologic impacts of CO2
storage: Capacity and regulatory implication.” International Journal of
Greenhouse Gas Control 745-756.
—. 2011. “Modelling basin- and plume - scale processes of CO2 storage: a
full-scale deployment scenario in the Illinois Basin.” ModelCARE 2009.
Wuhan: IAHS. 239-244.
Bradshaw, Bachu, Bonijoly, Holloway, Christensen, and Mathiasen. 2007.
“CO2 Storage Capacity Estimation: Issues and development of
standards.” International Journal of Greenhouse Gas Control 62-68.
Bradshaw, J, G Allinson, BE Bradshaw, V Nguyen, AJ Rigg, L Spencer, and P
Wilson. 2004. “Australia's CO2 geological storage potential and
matching of emission sources to potential sinks.” Energy 29 1623-
1631.

Global Storage Resource Assessment – 2019 Update Bibliography
Pale Blue Dot Energy (10365GLOB) Page 30 of 95
Brennan, and Burruss. 2006. “Specific Storage Volumes: A Useful Tool for
CO2 Storage Capacity Assessment.” Natural Resources Research
165-182.
British Geological Survey. 2008. A Regional Assessment of the Potential for
the CO2 Storage in the Indian Subcontinent. IEAGHG.
Brydie, J.R., Faught, R.L., Trottier, S., Mayck, T., Dmetruik, J. and Krawee, T.
2011. “Assurance monitoring approach for the Heartland Area
Redwater project (HARP) geological CO2 storage project, Alberta,
Canada.” Energy Procedia 4: 5669-5676.
CEPAC. 2016. “Brazilian Atlas of CO2 Capture and Geological Storage.”
CEPAC. 2014. Brazilian Atlas of CO2 Capture and Geological Storage.
EDIPURCS.
Chamwudhiprecha, N. 2010. Carbon dioxide storage potential in the North
Sea. Imperial College London.
CO2CRC. n.d. Our History. http://www.co2crc.com.au/our-history/.
Commonwealth of Australia. 2010. “Australia's Potential for the Geological
Storage of CO2.”
Consoli, C. & Wildgust, N. 2017. “Current status of global storage resources.”
Energy Procedia 4623-4628.
Crouch, S. 2011. “Quest CCS Project: Storage Development Plan.
Government of Alberta.”
Crouch, Syrie. 2011. Quest CCS Project: Storage Development Plan.
Government of Alberta, 305.
https://open.alberta.ca/dataset/46ddba1a-7b86-4d7c-b8b6-
8fe33a60fada/resource/5555eb2e-6d86-4419-97a3-
8d3de7c5b702/download/storagedevelopmentplan.pdf.
Diao, Y., Zhu, G., Li, X., Bai, B., Wang, Y., Zhang, B., Long, H. 2018. “An
upgraded storage site model of the Shenhua CCS demonstration
project.” Energy Procedia 154 94-99.
DOE, US. 2007. Carbon Sequestration Atlas of the US and Canada. NETL.
Eisinger, C.L., Lavoie, R. and Keith, D.A. 2011. “The Wabamun Area
Sequestration Project (WASP): A multidisciplinary study of gigaton
scale CO2 storage in a deep saline carbonate aquifer.” Energy
Procedia (Elsevier) 4: 4793-4797.
Energy Technologies Institute (ETI). 2015. “DECC Storage Appraisal: Data
and Information Requirements.”
Energy Technologies Institute (ETI). 2015. “DECC Storage Appraisal: Due
Diligence and Portfolio Selection.”
Energy Technologies Institute (ETI). 2015. “DECC Storage Appraisal: Initial
Screening & Down-Select.”
Energy Technologies Institute (ETI). 2015. “DECC Storage Appraisal: Prospect
Summary Sheets.”
Energy Technologies Institute (ETI). 2015. “DECC Storage Appraisal: Strategic
UK CO2 Storage Appraisal - Project - Addendum.”
Energy Technologies Institute (ETI). 2015. “DECC Storage Appraisal: UK CO2
Storage Site Screening and Selection Methodology.”
Energy Technologies Institute (ETI). 2015. “DECC Storage Appraisal: WP6 -
CO2 Storage Development Build-out.”

Global Storage Resource Assessment – 2019 Update Bibliography
Pale Blue Dot Energy (10365GLOB) Page 31 of 95
Energy Technologies Institute ETI. 2015. “DECC Storage Appraisal: WP5A -
Bunter Storage Development Plan 10113ETIS-Rep-13-02.”
Energy Technologies Institute ETI. 2015. “DECC Storage Appraisal: WP5B -
Forties 5 Site 1 Storage Development Plan 10113ETIS-Rep-18-00.”
Energy Technologies Institute ETI. 2015. “DECC Storage Appraisal: WP5C -
Hamilton Storage Development Plan 10113ETIS-Rep-17-02.”
Energy Technologies Institute ETI. 2015. “DECC Storage Appraisal: WP5D -
Captain X Storage Development Plan 10113ETIS-Rep-18-02.”
Energy Technologies Institute ETI. 2015. “DECC Storage Appraisal: WP5E -
Viking A Storage Development Plan 10113ETIS-Rep-21-03.”
Energy Technologies Institute. 2016. Progressing Development of the UK's
Strategic Carbon Dioxide Storage Resource. Pale Blue Dot Energy
Ltd.
Energy Technologies Institute. 2016. “Strategic UK Storage Appraisal Project -
Prospect Summary Sheets.”
Energy Technology Institute. 2011. “UK Storage Appraisal Project Report
(UKSAP).”
Energy, Shell Canada. 2019. “Shell Quest Carbon Capture and Storage
Project: Annual Summary Report 2018 - Alberta Department of
Energy.” 51. https://open.alberta.ca/dataset/c7969bcb-d510-48b4-
aef5-7cc6d92d183a/resource/b1480661-2efa-4b9d-a6e6-
5ca47021c399/download/quest-annual-summary-alberta-department-
of-energy-2018.pdf.
EON UK. 2010. “Kingsnorth Carbon Capture & Storage Project - Capacity
Assessment – Determine Well Distribution Relative to Reservoir.”
Furnival, S, A Brown, P Rowbotham, I Wright, and R De Silva. 2014. Planning
for Commercial Scale CO2 Storage in a Massive UK Saline Aquifer.
Don Valley CCS Project.
Furnival, S, S Wright, S Dingwall, P Bailey, A Brown, D Morrison, and R De
Silva. 2014. “Subsurface Characterization of a Saline Aquifer Cited for
Commercial Scale CO2 Disposal.” Energy Procedia 4926-4936.
Furre, A-K., Meneguolo, R., Ringrose, P., Kassold, S. 2019. “Building
confidence in CCS: From Sleipner to the Northern Lights Project.” First
Break 83-89.
GDCCSR. 2013. “Feasibility Study of CCS-Readiness in Guangdong Province
Part 6 - Roadmap Study.”
GDCCSR. 2013. “Feasibility Study of CCS-Readiness in Guangdong Province,
China - Part 2 - Assessment of CO2 Storage Potential.”
GDCCUS Center. 2015. “CO2 Offshore Storage in China:Research Review
and Plan for Demonstration Project.”
Geological Survey of Denmark and Greenland. 2006. “Assessing European
Capacity for Geological Storage of Carbon Dioxide. WP2 Report:
Storage capacity.”
Geological Survey of Denmark and Greenland. 2014. “Assessment of the CO2
storage potential in Europe. CO2StoP Final Report.”
GEUS. 2016. “Mapping of the CO2 storage potential in the Nordic region.”
Gill, William. n.d. The North Sea Basin. Royal School of Mines.

Global Storage Resource Assessment – 2019 Update Bibliography
Pale Blue Dot Energy (10365GLOB) Page 32 of 95
Global CCS Institute. 2018. Carbon capture and storage in decarbonising the
Chinese economy. https://www.globalccsinstitute.com/news-
media/insights/carbon-capture-and-storage-in-de-carbonising-the-
chinese-economy/.
Global CCS Institute. 2018. “CCS Legal and Regulatory Indicator (CCS-LRI).”
Global CCS Institute. 2018. “CCS Policy Indicator (CCS-PI).”
Global CCS Institute. 2018. “CCS Storage Indicator (CCS-SI).”
Global CCS Institute. 2017. “The Global Status of CCS: 2017.”
Goodman, A., Hakala, A, Bromhal, G., Deel, D., Rodosta, T., Fraily, S., Small,
M., Allen, D., Romanov, V., Fazio, J., Huerta, N., McIntyre, D.,
Kutchko, B., and Guthrie, G. 2011. “U.S. DOE methodology for
development of geologic storage potential for carbon dioxide at
national and regional scale.” Int. J Greenhouse Gas Control 5 (4): 952-
965.
Groot, H. de (Shell). 2011. “Quest CCS Project: Capacity Risk and
Uncertainty.”
Groot, H. de (Shell). 2011. “Quest CCS Project: Injectivity Risk and
Uncertainty.”
Groot, Hein de. 2011. “Quest CCS Project. Containment Risk and
Uncertainty.” 72. https://open.alberta.ca/dataset/46ddba1a-7b86-4d7c-
b8b6-8fe33a60fada/resource/7af896e0-410b-4090-882c-
3c8546087401/download/containmentriskanduncertaintyreview.pdf.
Groot, Hein de. 2011. Quest CCS Project: Capacity Risk and Uncertainty.
Government of Alberta, 27. https://open.alberta.ca/dataset/46ddba1a-
7b86-4d7c-b8b6-8fe33a60fada/resource/3bb81f38-48bd-4726-a0af-
bbe84995b43e/download/capacityriskanduncertaintyreview.pdf.
Groot, Hein de. 2011. Quest CCS Project: Injectivity Risk and Uncertainty.
Government of Alberta, 41. https://open.alberta.ca/dataset/46ddba1a-
7b86-4d7c-b8b6-8fe33a60fada/resource/81708751-f63e-4c88-9789-
cd48de01f9e2/download/injectivityriskanduncertaintyreview.pdf.
Guangcai, H, L Yongping, S Xiaosi, Z Zhenghong, T Zhengping, Y Lihe, Y
Yuncheng, and W Xioayeng. 2008. “Groundwater Systems and
Resources in the Ordos Basin, China.” Acta Geolologica Sinica 1061-
1069.
Gunter, W.D., Bachu, S., Palombi, D., Lakeman, B., Sawchuk, W. and Bonner,
D. 2009. “Heartland Area Redwater reef saline aquifer CO2 storage
project.” Energy Procedia 1: 3943-3950.
Hannis, S, S Bricker, A Goater, A Holloway, J Rushton, G Williams, and J
Williams. 2013. “Cross-international boundary effects of CO2
injection.” Energy Procedia 4927-4936.
Heinemann, N, M Wilkinson, G Pickup, S Haszeldine, and N Cutler. 2012.
“CO2 storage in the offshore Bunter Sandstone Formation.”
International Journal of Greenhouse Gas Control 210-219.
Holloway, S., Garg, A., Kapshe, M., Deshpande, A., Pracha, A. S., Khan, S.
R., Mahmood, M. A., Singh, T. N., Kirk, K. L., Gale, J. 2009. “An
assessment of the CO2 storage potential of the Indian subcontinent.”
Energy Procedia 2607-2613.

Global Storage Resource Assessment – 2019 Update Bibliography
Pale Blue Dot Energy (10365GLOB) Page 33 of 95
Holloway, Vincent, Bentham, and Kirk. 2006. “Top down and Bottom Up
estimates of CO2 storage capacity in the United Kingdom Sector of
the Southern North Sea Basin.” Environmental Geosciences 71-84.
Huang, X., Bandilla, K.W., Celia, M.A. & Bachu, S. 2014. “Basin-scale
modeling of CO2 storage using models of varying complexity.”
International Journal of Greenhouse Gas Control 20 73-86.
IEAGHG. 2000. Barriers to Overcome in Implementation of of CO2 Capture
and Storage (1) Storage in Disused Oil and Gas Fields. Cheltenham:
IEAGHG.
Iglesias, R. S., Katzer, J. M., Melo, C. L., Heemann, R., Machado, C. X. 2015.
“Carbon capture and geological storage in Brazil: an overview.” GHG
119-130.
IOGP. 2019. “The potential for CCS and CCU in Europe.”
Jafari, A. & Bachu, S. 2014. “Evaluation of CO2 Storage Capacity in Devonian
hydrocarbon reservoirs for emissions from oil sands operations in the
Athabasca area, Canada.” Energy Procedia 63 5222-5230.
Jiang, K., Ashworth, P., Zhang, S., Liang, X. Sun, Y., & Angus, D. In press.
“China's carbon capture, utilization and storage (CCUS) policy: A
critical review.” Renewable and Sustainable Energy Reviews.
Jiang, T., Pekot, L.J., Jin, L., Peck, W.D., Gorecki, C.D. and Worth, K. 2017.
“Numerical modeling of the Aquistore CO2 storage project.” Energy
Procedia (Elsevier) 114: 4886-4895.
Jianqiang, G., Dongguang, W., Senqi, Z., Tianfu, X., Xufeng, L., Yujie, D.,
Xiaofeng, J. 2015. “Potential and Suitability Evaluation of CO2
Geological Storage in Major Sedimentary Basins of China, and the
Demonstration Project in Ordos Basin.” Journal of the Geological
Society of China 1319-1332.
Jiao, Z, RC Surdam, L Zhou, PH Stauffer, and T Luo. 2011. “A Feasibility
Study of Geological CO2 Sequestration in the Ordos Basin, China.”
Energy Procedia 4 59825-5989.
Jones, J.P., Brydie, J.R. and Perkins, E.H. 2013. “Investigation of potential far
field impacts on freshwater resources related to CO2 storage: A case
study of the HARP project site in Alberta, Canada.” Energy Procedia
(37): 3792-3799.
Kapila, R. V. & Haszeldine, S. 2009. “Opportunities in India for Carbon Capture
and Storage as a form of climate change mitigation.” Energy Procedia
4527-4534.
Keith, D. and Lavoie, R. 2009. “Overview of the Wabamun Area CO2
Sequestration Project (WASP).” Energy Procedia 1: 2817-2824.
Kopp, A., Class, H., Helmig, R. 2009. “Investigations on CO2 storage capacity
in saline aquifers - Part 2: Estimation of storage capacity coefficients.”
International Journal of Greenhouse Gas Control 277-287.
Lavoie, R. and Keith, D. 2010. “Wabamun Area CO2 Sequestration Project
(WASP): Final Report.” Energy and Environemntal Systems Group,
University of Calgary, 1-436.
Lee, S.Y., Swager, L., Pekot, L., Piercey, M., Will, R. and Zaluski, W. 2018.
“Study of operational dynamic data in Aquistore project.” International
Journal of Greenhouse Gas Control 76: 62-77.
http://www.sciencedirect.com/science/article/pii/S1750583617309878.

Global Storage Resource Assessment – 2019 Update Bibliography
Pale Blue Dot Energy (10365GLOB) Page 34 of 95
Lemieux, A., Sharp. K., Shkarupin, A. 2019. “Preliminary assessment of
underground hydrogen storage sites in Ontario, Canada.” International
Journal of Hydrogen Energy, 44 15193-15204.
Li, X, D Zhou, P Li, Y Wu, X Li, N Wei, S Haszeldine, B Senior, Y, Li, J Shu,
and J Chen. 2015. CO2 Offshore Storage in China: Research Review
and Plan for Demonstration Project. UK-China CCUS Center.
Li, X., Wei, N., Liu, Y., Fang, Z., Dahowski, R. T., Davidson, C. L. 2009. “CO2
Point Emission and Geological Storage Capacity in China.” Energy
Procedia 2793-2800.
Liu, F, P Lu, C Zhu, and Y Xiao. 2011. “12.2.3 Coupled Reactive Flow and
Transport Modeling of CO2 Sequestration in the Mount Simon
Sandstone Formation, Midwest, USA.” AAPG.
Liu, G., Gorecki, C.D., Bailey, T.P., Braunberger, J.R., Sorensen, J.A. and
Steadman, E.N. 2014. “Fort Nelson Test Site - Simulation.” Plains Co2
reduction (PCOR) Partnership.
https://undeerc.org/PCOR/technicalpublications/pdf/TR-2014-Fort-
Nelson-Simulation-Report.pdf.
Liu, G., Peck, W.D., Braunberger, J.R., Klenner, R.C., Gorecki, C.D.,
Steadman, E.N. & Harju, J.A. 2014. “Evaluation of large-scale carbon
dioxide storage potential in the basal saline system in the Alberta and
Williston Basins in North America.” Energy Procedia 63 2911-2920.
Liu, G., Peck, W.D., Gorecki, C.D., Steadman, E.M. and Harju, J.A. 2013.
“Basal Cambrian Dynamic Capacity Estimation Completed.” PCOR
Phase III, Task 16 Milestone M35, Plains CO2 reduction (PCOR)
Partnership.
Liu, H. J., Were, P., Li, Q., Gou, Y. & Hou, Z. 2017. “Worldwide Status of
CCUS Technologies and Their Development and Challenges in
China.” Hindawi, Geofluids.
Lothe, A. E., Emmel, B., Grøver, A., Bergmo, P. E. 2014. “CO2 storage and
modelling and capacity estimation for the Trøndelag Platform, offshore
Norway - using a basin modelling approach.” Energy Procedia 3648-
3657.
Macdonald-Smith, A. 2020. Chevron injects one millionth tonne of carbon at
Gorgon. Accessed 03 09, 2020. https://www.afr.com/policy/energy-
and-climate/chevron-injects-one-millionth-tonne-of-carbon-at-gorgon-
20200214-p540xv.
Mawalkar, S., Burchwell, A., Gupta, N., Place, M., Kelley, M., Winecki, S.,
Mannes, R. and Pardini, R. 2018. “Achieving 1 million metric ton
stored; measurement and accounting for net CO2 injection in a CO2-
EOR complex.” 14th International Conference on Greenhouse Gas
Control Technologies. Melbourne, Australia.
Medina, C, J Rupp, and D Barnes. 2011. “Effects of reduction in porosity and
permeability with depth on storage capacity and injectivity in deep
saline aquifers: A case study from the Mount Simon Sandstone
aquifer.” International Journal of Greenhouse Gas Control 146-156.
Mehnert, E, J Damico, S Frailey, H Leetaru, Y Lin, R Okwen, N Adams, B
Storsved, and A Valloch. 2013. “12.2.5 Development of a basin-scale
model for CO2 sequestration in the basal sandstone reservoir of the
Illinois Basin issues, approach and preliminary results.” Energy
Procedia 3850-3858.

Global Storage Resource Assessment – 2019 Update Bibliography
Pale Blue Dot Energy (10365GLOB) Page 35 of 95
Michael, K., Allinson, G., Golab, A., Sharma, S., Shulakova, V. 2009. “CO2
storage in saline aquifers II - experience from existing storage
operations.” Energy Procedia 1973-1980.
Minchener, A, Z Chuguang, L Zhaohui, J Zunsheng, P Xiaodong, L Xiaochun,
Z Haibo, C Ji, G Lin, and X Liang. 2015. People's Republic of China:
Roadmap for Capture and Storage Demonstration and Deployment.
Asia Development Bank.
Ministry of Petroleum and Energy, Gassnova. 2016. “Feasibility study for full-
scale CCS in Norway.”
Mitrovic, M. and Malone, A. 2011. “Carbon capture and storage (CCS)
demonstration projects in Canada.” Energy Procedia (Elsevier) 4:
5685-5691.
NACSA. 2012. Natural Resources Canada.
https://www.nrcan.gc.ca/energy/publications/16461.
NETL. 2015. Carbon Storage Atlas V. US Department of Energy.
Ngoc, T., Lefebvre, R., Konstantinovskaya, E. & Malo, M. 2014.
“Characterization of deep saline aquifers in the Becancour area, St.
Lawrence Lowlands, Quebec, Canada: implcations for CO2 geological
storage.” Environmental Earth Science 119-146.
NGU (Geological Survey of Norway). 2002. “CO2 point sources and
subsurface storage capacities for CO2 in aquifers in Norway.”
Nilsen, H. M., Lie, K-A., Andersen, O. 2015. “Analysis of CO2 trapping
capacities and long-term migration for geological formations in the
Norwegian North Sea using MRST-co2lab.” Computers &
Geosciences 15-26.
2012. “North American Carbon Storage Atlas.”
Norwegian Petroleum Directorate. 2014. CO2 Storage Atlas - Norwegian
Continental Shelf. NPD.
—. 2017. NPD petroleum database.
http://www.npd.no/engelsk/cwi/pbl/en/aFactGlobe/NPDsFactGlobeWel
come.htm.
Norwegian Petroleum. 2020. Emissions to Air.
https://www.norskpetroleum.no/en/environment-and-
technology/emissions-to-air/.
Peck, W.D., Bachu, S., Knudsen, D.J., Hauk, T., Crotty, C.M., Gorecki, C.D.,
Sorensen, J.A., Peterson, J. and Melnik, A. 2013. “CO2 storage
resource potential of the Cambro-Ordovician Saline System in the
western interior of North America.” Energy Procedia 37: 5230-5239.
Peck, W.D., Bailey, T.P., Liu, G., Klenner, R.C.L., Gorecki, C.D., Ayash, S.C.,
Steadman, E.N. and Karju, J.A. 2014. “Model development of the
Aquistore CO2 storage project.” Energy Procedia (Elsevier) 63: 3723-
3734.
Petroleum Technology Research Centre. 2016-2018. “Aquistore Annual
Reports .”
Pham, V.T.H., Riis, F., Gjeldvik, I.T., Halland, E.K., Tappel, I.M., Aagaard, P.
2013. “Assessment of CO2 injection into the south Utsira-Skade
aquifer, the North Sea, Norway.” Energy 529-540.

Global Storage Resource Assessment – 2019 Update Bibliography
Pale Blue Dot Energy (10365GLOB) Page 36 of 95
PNNL. 2009. Regional Opportunities for Carbon Dioxide Capture and Storage
in China. US Department of Energy.
Poulsen, N. E., Chen, W., Dai, S., Ding, G., Li, M., Vincent, C. J., Zeng, R.
2011. “Geological assessment for CO2 storage in the Bahaiwan Basin,
East China.” Energy Procedia 5990-5998.
PTRC. 2016-2018. “Aquistore Annual Reports.” Petroleum Technology
Research Centre. https://ptrc.ca/media-centre/publications.
Ringrose, P. S. 2018. “The CCS hub in Norway: some insights from 22 years
of saline aquifer storage.” Energy Procedia 166-172.
Roach, L.A.N. and White, D.J. 2018. “Evolution of a deep CO2 plume from
time-lapse seismic imaging at the Aquistore storage site,
Saskatchewan, Canada.” International Journal of Greennhouse Gas
Control 74: 79-86.
http://www.sciencedirect.com/science/article/pii/S1750583617310484.
Rockett, G. C. et al. 2013. “CO2 Storage Capacity of Campos Basin’s Oil
Fields, Brazil.” Energy Procedia,, 1-10.
Rockett, G. C., Machado, C. X., Ketzer, J. M. M., Centeno C. I. 2011. “The
CARBMAP Project: Matching CO2 Sources and Geological Sinks in
Brazil using Geographic Information System.” Energy Procedia.
Roston, B., White, D., Hawkes, C. and Chalaturnyk, R. 2014. “Characterization
of the Aquistore CO2 project storage site, Saskatchewan, Canada.”
Energy Procedia (Elsevier) 63: 2977-2984.
Shafeen, A., Croiset, E., Douglas, P.L. and Chatzis, I. 2004. “CO2
Sequestration in Ontario, Canada. Part I: storage evaluation of
potential reservoirs.” Energy Conversion and Management (45): 2645-
2659.
Shell Canada Energy. 2016. Shell Quest Carbon Capture and Storage Project:
Annual Summary Report 2015. Alberta Department of Energy.
Shell Canada Energy. 2019. Shell Quest Carbon Capture and Storage Project:
Annual Summary Report 2018. Alberta Department of Energy.
Shell UK. 2015. “Peterhead CCS Project - Storage Development Plan.”
Smith, M, D Campbell, E Mackay, and D Polson. 2012. CO2 Aquifer Storage
Site Evaluation and Monitoring (Results of the CASSEM Project).
Scottish Carbon Capture and Storage.
Smith, S., Burke, R., Helms, L., Fischer, D., Sorensen, J. B., Peck, W.,
Steadman, E. & Harju, J. 2005. Sequestration Potential of Petroleum
Reservoirs in the Williston Basin. Plains CO2 Reduction (PCOR)
Partnership.
Smith, S.A., Sorensen, J.A., Steamand, E.N. and Harju, J.A. 2007. “Estimates
of CO2 Storage Capacity in Selected Oil Fields of the Northern Great
Plains Region of North America.” Plains CO2 Reduction (PCOR)
Partnership. https://undeerc.org/PCOR/technicalpublications/pdf/TR-
2007-Estimate-CO2-Storage-Capacity-Oil-Fields-Great-Plains.pdf.
Smith, S.S., Burke, R.B., Helms, L.D., Fischer, D.W., Sorensen, J.A., Peck,
W.D., Steadman, E.N. and Harju, J.A. 2005. “Sequestration Potential
of Petroleum Reservoirs in the Williston Basin.” Plains CO2 reduction
(PCOR) Partnership.

Global Storage Resource Assessment – 2019 Update Bibliography
Pale Blue Dot Energy (10365GLOB) Page 37 of 95
Society of Petroleum Engineers (SPE). 2017. CO2 Storage Resources
Management System. SPE. Downloaded from:
https://www.spe.org/industry/docs/SRMS.pdf
Sorensen, J., Botnen, L., Smith, S., Liu, G. Bailey, T., Gorecki, C., Steadman,
E., Harju, J., Nakles, D. & Azzolina, N. 2014. Fort Nelson Carbon
Capture and Storage Feasibility Study – A Best Practices Manual for
Storage in a Deep Carbonate Saline Formation. Plains CO2 Reduction
(PCOR) Partnership.
Sorensen, J.A., Botnen, L.S., Smith S.A., Liu, G., Baily, T.P., Gorecki, C.D.,
Steadman, E.N. and Harju, J.A. 2014. “Fort Nelson Carbon Capture
and Storage Feasibility Study – A Best Practices Manual for Storage in
a Deep Carbonate Saline Formation.” Plains CO2 Reduction (PCOR)
Partnership. https://undeerc.org/PCOR/technicalpublications/pdf/TR-
2014-Fort-Nelson-CCS-Feasibility-Study-Best-Practices-Manual-for-
Storage-in-Deep-Carbonate-Saline-Formation.pdf.
Sorensen, J.A., Gorecki, C.D. and Steadman, E.N. 2014. “Fort Nelson Test
Site - Site Characterization Report.” Plains CO2 Reduction 9PCOR)
Partnership. https://undeerc.org/PCOR/technicalpublications/pdf/TR-
2014-Fort-Nelson-Test-Site-Characterization-Report.pdf.
Sorensen, J.A., Jensen, M.D., Smith, S.A., Fischer. D.W., Steadman, E.N. &
Harju, J.A. 2005. Geologic Sequestration potential of the PCOR
Partnership Area. Plains CO2 Reduction (PCOR) Partnership.
Thibeau, S, S Bachu, J Birkholzer, S Holloway, F Neele, and Q Zhou. 2014.
“Using Pressure and Volumetric Approaches to Estimate CO2 Storage
Capacity in Deep Saline Aquifers.” Energy Procedia 5294-5304.
Thibeau, S., Seldon, L., Masserano, F., Canal Vila, J., Ringrose, P. 2018.
“Revisiting the Utsira Saline Aquifer CO2 Storage Resources using the
SRMS Classification Framework.” 14th Greenhouse Gas Control
Technologies Conference. Melbourne.
Tran Ngoc, T.D., Lefebvre, R., Konstantinovskaya, E. and Malo, M. 2014.
"Characterization of deep saline aquifers in the Becancour area, St.
Lawrence Lowlands, Quebec, Canada: implcations for CO2 geological
storage." Environ Earth Sci (72): 119-146.
US DOE. 2007. Carbon Sequestration Atlas of the US and Canada. NETL.
Vandewejjer, V, B van der Meer, L Kranners, F Neele, N Maurand, and Y Le
Gallo. 2009. “CO2 Storage in Saline Aquifers: In the Southern North
Sea and Northern Germany.” Energy Procedia (Energy Procedia)
3079-3086.
Viebahn, P., Vallentin, D., Höller, S. 2014. “Prospects of carbon capture and
storage (CCS) in India's power sector - An integrated assessment.”
Applied Energy 62-75.
Vincent, C., Dai, S., Wenying, C., Rongshu, Z., Guosheng, D., Xu, R.,
Vangkilde-Pedersen, T., Dalhoff, F. 2010. “Carbon dioxide storage
options for the COACH project in the Bohai Basin, China.” Energy
Procedia 2785-2792.
Wang, G, and TR Carr. 2011. “Evaluation of CO2 Geological Storage Capacity
in the Paleozoic Formations of the Ordos Basin, China.” 2011 GSA
Northeastern / North Central Joint Section Meeting. Pittsburgh.

Global Storage Resource Assessment – 2019 Update Bibliography
Pale Blue Dot Energy (10365GLOB) Page 38 of 95
Wei, N., Li, X., Fang, Z., Bai, B., Li, Q., Liu, S., Jia, Yu. 2015. “Regional
resource distribution of onshore carbon geological utilization in China.”
Journal of CO2 Utilization 20-30.
Wei, N., Li, X., Wang, Y., Dahowski, R. T., Davidson, C. L., Bromhal, G. S.
2013. “A preliminary sub-basin scale evaluation framework of site
suitability for onshore aquifer-based CO2 storage in China.”
International Journal of Greenhouse Gas Control 231-246.
Wen, D., Ma, X., Wang, L., Li, X., Diao, Y., Zhang, H., Hu, L., Long, H., Shao,
W. 2018. “Combined study of static and dynamic reservoir modelling
for the CO2 storage project in deep saline aquifer in Zhundong,
Xinjiang, China.” 14th International Conference on Greenhouse Gas
Control Technologies (GHGT-14). Melbourne.
White, D., Harris, K., Roach, L., Roberts, B., Worth, K., Stork, A., Nixon, C.,
Schmitt, D., Daley, T. and Samson, C. 2017. “Monitoring results after
36 ktonnes of deep CO2 injection at the Aquistore CO2 Storage Site,
Saskatchewan, Canada.” Energy Procedia (Elsevier) 114: 4056-4061.
White, D.J. 2018. “3D architecture of the Aquistore reservoir: Implications for
CO2 flow and storage capacity.” International Journal of Greenhouse
Gas Control 71: 74-85.
http://www.sciencedirect.com/science/article/pii/S1750583617310460.
Whittaker, S. and Worth, K. 2011. “Aquistore: a fully integrated demonstration
of the capture, transportation and geologic storage of CO2.” Energu
Procedia (Elsevier) 4: 5607-5614.
Williams, JDO, M Bentham, M Jin, G Pickup, E Mackay, D Gammer, and A
Green. 2013. “The effect of geological structure and heterogeneity on
CO2 storage in simple 4-way dip structures; a modeling study from the
UK Southern North Sea.” Energy Procedia 3980-3968.
Williams, JDO, M Jin, M Bentham, G Pickup, S Hannis, and E Mackay. 2011.
“Modelling carbon dioxide storage within closed structures in the UK
Bunter Sandstone Formation.”
Winkler, Mario. 2011. Quest CCS Project: Generation-4 Integrated Reservoir
Modeling Report. Government of Alberta, 249.
https://open.alberta.ca/dataset/46ddba1a-7b86-4d7c-b8b6-
8fe33a60fada/resource/03c38d0b-5f96-47a5-8f0b-
503e62e6240e/download/generation-
4integratedreservoirmodelingreport.pdf.
Wright, R., Mourits, F., Rodriguez, L.B., and Serrano, M.D. 2013. "The First
North American Carbon Storage Atlas." Energy Procedia 37 5280 -
5289.
Wright, R., Mourtis, F., Rodriguez, L. & Serrano, M. 2013. “The First North
American Carbon Storage Atlas.” Energy Procedia 37 5280-5289.
Xiao, XM., BQ Zhao, ZL Thu, ZG Song, and RWT Wilkins. 2005. “Upper
paleozoic petroleum system, Ordos Basin, China.” Marine and
Petroleum Geology 945-963.
Yang, H. Fu,J. Wei,X. Liu, X. 2008. “Sulige field in the Ordos Basin: Geological
setting, field discovery and tight gas reservoirs.” Marine and Petroleum
Geology 387-400.
Zhou, D. Zhao,D. Liu,Q. Li, X. Li,J. Gobbons,J. Liang, X. 2013. “The GDCCSR
Project Promoting Regional CCS-readiness in the Guangdong
province, South China.” Energy Procedia 37 7622 - 7632.

Global Storage Resource Assessment – 2019 Update Bibliography
Pale Blue Dot Energy (10365GLOB) Page 39 of 95
Zhou, D. Zhao,Z. Liao,J. Sun,Z. 2010. “A Preliminary Assessment on CO2
Storage Capacity in the Offshore Guangdong, China.” International
Journal of Greenhouse Gas Control 5 308 - 317.
Zhou, Q. 2012. “On scale and magnitude of pressure build-up induced by
large-scale geologic storage of CO2.” LBNL Paper LBNL-4898E.

Global Storage Resource Assessment – 2019 Update Appendix A – Country Assessments
Pale Blue Dot Energy (10365GLOB) Page 40 of 95
6.0 Appendix A – Country Assessments
6.1 Australia
6.1.1 Summary
The GSRA 2019 update has identified a CO2 storage resource for Australia as
follows:
Classification CO2 storage resource (Gt) Project and no project
CO2 storage resource (Gt) Project specified only
Stored 0.002 0.002
Capacity 0.12 0.12
Sub-Commercial 17 0.42
Undiscovered 414 0.5
Aggregated* 431 1
* The aggregated resource represents the summed storage resource across all maturity
classes and as such should not be viewed as representative of the potential of the country.
Table 6-1. 2019 Storage resource classification summary for Australia
• There are currently 29 sites at both a local and regional scale,
located across a minimum of 14 basins, both onshore and offshore.
Five of these evaluations have a project defined.
• As of February 2020, over 1.8 Mt of CO2 has been injected to deep
geological storage. 1 Mt in the Chevron-operated Gorgon project and
0.8 Mt in the CO2CRC Otway Research Facility.
• Australia remains the most highly-ranked country in the world for
CCS specific legislation, according to the GCCSI Legal and
Regulatory Indicator (Global CCS Institute 2018).

Global Storage Resource Assessment – 2019 Update Appendix A – Country Assessments
Pale Blue Dot Energy (10365GLOB) Page 41 of 95
Figure 6-1. a) Spread of storage resource in Australian sites across SRMS classifications, where a project has been specified. b) Spread of storage resource in all Australian sites across SRMS classifications; both project specified and not. c) Split of Australian storage resource between saline aquifers and hydrocarbon fields, both project specified and not.

Global Storage Resource Assessment – 2019 Update Appendix A – Country Assessments
Pale Blue Dot Energy (10365GLOB) Page 42 of 95
6.1.2 Resource Statement
Figure 6-2. Storage resource summary for Australia compiled in the GSRA 2019 update. Graph above is log scale and graph below is linear. Blue box highlights sites where a project has been specified. Where possible the data have undergone due diligence checks, identifying potential repeat entries to avoid double counting.
Sites with a project specified

Global Storage Resource Assessment – 2019 Update Appendix A – Country Assessments
Pale Blue Dot Energy (10365GLOB) Page 43 of 95
6.1.3 Evaluation History
The potential CO2 storage resources of Australia were summarised as part of
the GEODISC programme of research completed by the Australian Petroleum
Cooperative Research Centre, Geoscience Australia and the University of New
South Wales in 2004 (Bradshaw, et al. 2004). The project screened over 300
geological basins down to 48 before some 65 "potentially environmentally
sustainable sites for CO2 injection” (ESSCIs) were identified. This report was at
the time a ground-breaking piece of work and one of the first attempts at a
regional CO2 resource evaluation. To navigate the lack of globally published
reservoir simulation studies at the time, a "risked based" calculation method was
developed. A chance factor was assigned to each potential ESSCI, describing
its chance of being capable to deliver a viable development. This ESSCI chance
accounted for storage resource, injectivity potential, site details, containment,
and existing natural resources. In general, depleted fields had the highest
ESSCI chance, followed by structural traps with no hydrocarbons and finally
hydrodynamic systems with no structures.
The study concludes that Australia has a potential risked storage resource
(ESCCI storage potential x ESCCI Chance factor) of 720 Gt. Whilst the
evaluation included the identification of specific formation and seal pairs through
regional review and highlighted the significant potential available, the document
does not support a useful classification against the SRMS system. Furthermore,
the CO2 storage resource was presented as "Risked Resource" rather than the
un-risked resource required by the SRMS.
In 2009, the Carbon Storage Taskforce (CST) compiled the National Carbon
Mapping and Infrastructure Plan – Australia on behalf of the Australian
Government, which provided the storage resource estimations included in this
report (Australian Government 2009). The Taskforce is composed of members
from key industry sectors which have an expertise or interest in CCS. The Plan
aims to map both the potential storage resource and carbon sources in Australia
to accelerate industrial CCS development. The report considered the storage
resource within saline aquifers, petroleum fields and EOR projects. Theoretical,
probabilistic storage capacities were calculated for saline aquifers, based on the
probability of the resource being able to be utilised. The reported results used a
storage efficiency factor (E) of 4%.
The methodology to evaluate the storage within hydrocarbon fields was not
defined in the CST report.
Since 2009, the Australian Government has undertaken several research
projects on specific sites or basins that are considered priority areas for CCS
development in Australia. Of these, two provide storage resource estimations,
one for the Gippsland Basin and one for the Petrel Sub-basin (Australian
Government: Geoscience Australia 2016) (Australian Government: Geoscience
Australia 2014). Both these reports use simulation modelling to prove CO2
containment, built using well and seismic data from nearby hydrocarbon
exploration activity. As such, they provide project-based evaluations.
6.1.4 Resource Review
6.1.4.1 Major Projects
The Australian commercial storage resource documented in this report is
sourced from two projects: Chevron’s Gorgon LNG project and the CO2CRC
Otway Research Facility.
Operating since 2009, Gorgon is an LNG site where naturally occurring CO2 is
separated from the natural gas before compression. Up to 3.8 Mt/yr is expected
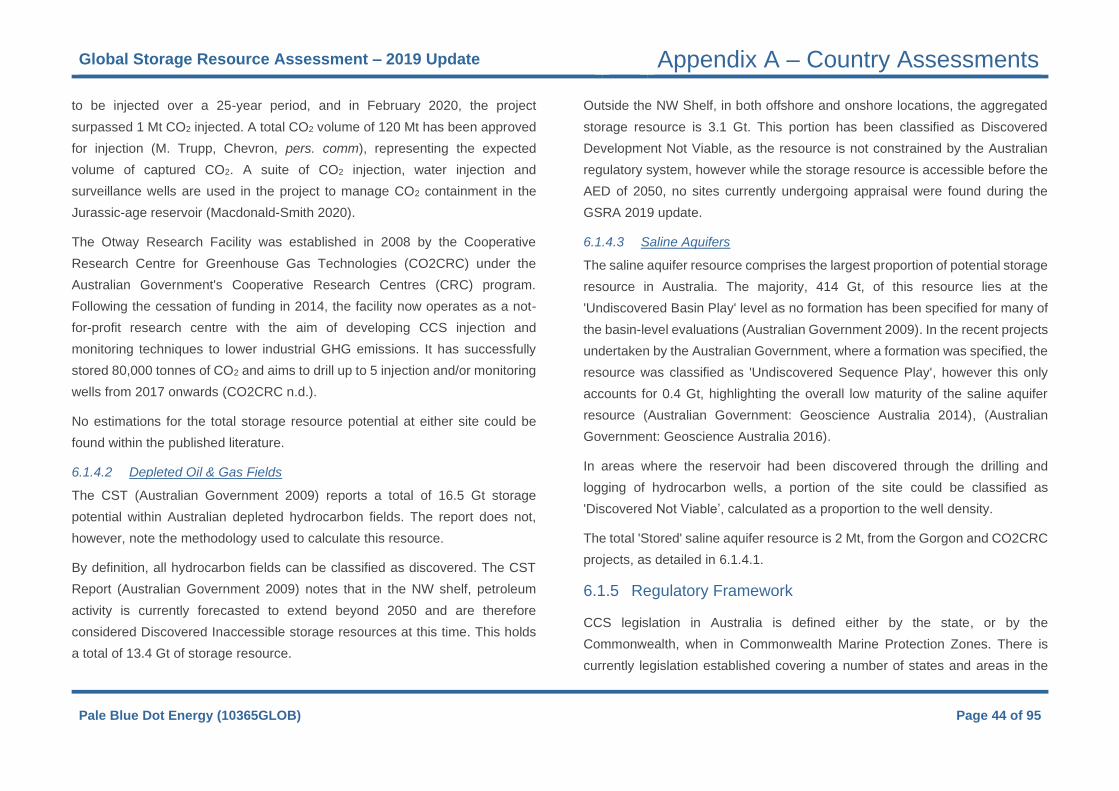
Global Storage Resource Assessment – 2019 Update Appendix A – Country Assessments
Pale Blue Dot Energy (10365GLOB) Page 44 of 95
to be injected over a 25-year period, and in February 2020, the project
surpassed 1 Mt CO2 injected. A total CO2 volume of 120 Mt has been approved
for injection (M. Trupp, Chevron, pers. comm), representing the expected
volume of captured CO2. A suite of CO2 injection, water injection and
surveillance wells are used in the project to manage CO2 containment in the
Jurassic-age reservoir (Macdonald-Smith 2020).
The Otway Research Facility was established in 2008 by the Cooperative
Research Centre for Greenhouse Gas Technologies (CO2CRC) under the
Australian Government's Cooperative Research Centres (CRC) program.
Following the cessation of funding in 2014, the facility now operates as a not-
for-profit research centre with the aim of developing CCS injection and
monitoring techniques to lower industrial GHG emissions. It has successfully
stored 80,000 tonnes of CO2 and aims to drill up to 5 injection and/or monitoring
wells from 2017 onwards (CO2CRC n.d.).
No estimations for the total storage resource potential at either site could be
found within the published literature.
6.1.4.2 Depleted Oil & Gas Fields
The CST (Australian Government 2009) reports a total of 16.5 Gt storage
potential within Australian depleted hydrocarbon fields. The report does not,
however, note the methodology used to calculate this resource.
By definition, all hydrocarbon fields can be classified as discovered. The CST
Report (Australian Government 2009) notes that in the NW shelf, petroleum
activity is currently forecasted to extend beyond 2050 and are therefore
considered Discovered Inaccessible storage resources at this time. This holds
a total of 13.4 Gt of storage resource.
Outside the NW Shelf, in both offshore and onshore locations, the aggregated
storage resource is 3.1 Gt. This portion has been classified as Discovered
Development Not Viable, as the resource is not constrained by the Australian
regulatory system, however while the storage resource is accessible before the
AED of 2050, no sites currently undergoing appraisal were found during the
GSRA 2019 update.
6.1.4.3 Saline Aquifers
The saline aquifer resource comprises the largest proportion of potential storage
resource in Australia. The majority, 414 Gt, of this resource lies at the
'Undiscovered Basin Play' level as no formation has been specified for many of
the basin-level evaluations (Australian Government 2009). In the recent projects
undertaken by the Australian Government, where a formation was specified, the
resource was classified as 'Undiscovered Sequence Play', however this only
accounts for 0.4 Gt, highlighting the overall low maturity of the saline aquifer
resource (Australian Government: Geoscience Australia 2014), (Australian
Government: Geoscience Australia 2016).
In areas where the reservoir had been discovered through the drilling and
logging of hydrocarbon wells, a portion of the site could be classified as
'Discovered Not Viable’, calculated as a proportion to the well density.
The total 'Stored' saline aquifer resource is 2 Mt, from the Gorgon and CO2CRC
projects, as detailed in 6.1.4.1.
6.1.5 Regulatory Framework
CCS legislation in Australia is defined either by the state, or by the
Commonwealth, when in Commonwealth Marine Protection Zones. There is
currently legislation established covering a number of states and areas in the

Global Storage Resource Assessment – 2019 Update Appendix A – Country Assessments
Pale Blue Dot Energy (10365GLOB) Page 45 of 95
Commonwealth waters, giving Australia the highest global Legal and Regulatory
Indicator rating from the GCCSI (Global CCS Institute 2018). The CST Report
notes, however, that the regulation is not consistent between states, particularly
in the areas surrounding long-term liability and any pre-existing rights for
resource exploitation of specific sites (Australian Government 2009).
The CCS-supportive legislation and policy framework in Australia has led to
industry CCS operations at Gorgon, in addition to numerous government-
backed research facilities and pilot-projects (Global CCS Institute 2018).
6.1.6 Issues for the 2019 Assessment
While the National Carbon and Infrastructure Mapping Plan made significant
progress in identifying and quantifying CO2 storage resource in Australia, the
report is now more than a decade old and would benefit from modern evaluation,
accounting for the significant changes in the CCS industry over the last 10 years
and also learnings from the petroleum industry.
There is a risk of double counting in the Bonaparte and Gippsland Basins
between the regional, theoretical evaluation made in the National Carbon
Mapping and Infrastructure Plan (Australian Government 2009) and later studies
that considers injection on a local scale into the basins (Australian Government:
Geoscience Australia 2014) (Australian Government: Geoscience Australia
2016). In accordance with the SRMS guidelines on aggregation of resources,
the double counting cannot be avoided as due to the different maturity of the
sites against the SRMS classification system (Society of Petroleum Engineers
(SPE) 2017).
6.1.7 Future Updates
Further work should also focus on evaluation at a site or even formation level,
to progress the maturity of the Australian resource along the SRMS classification
system.
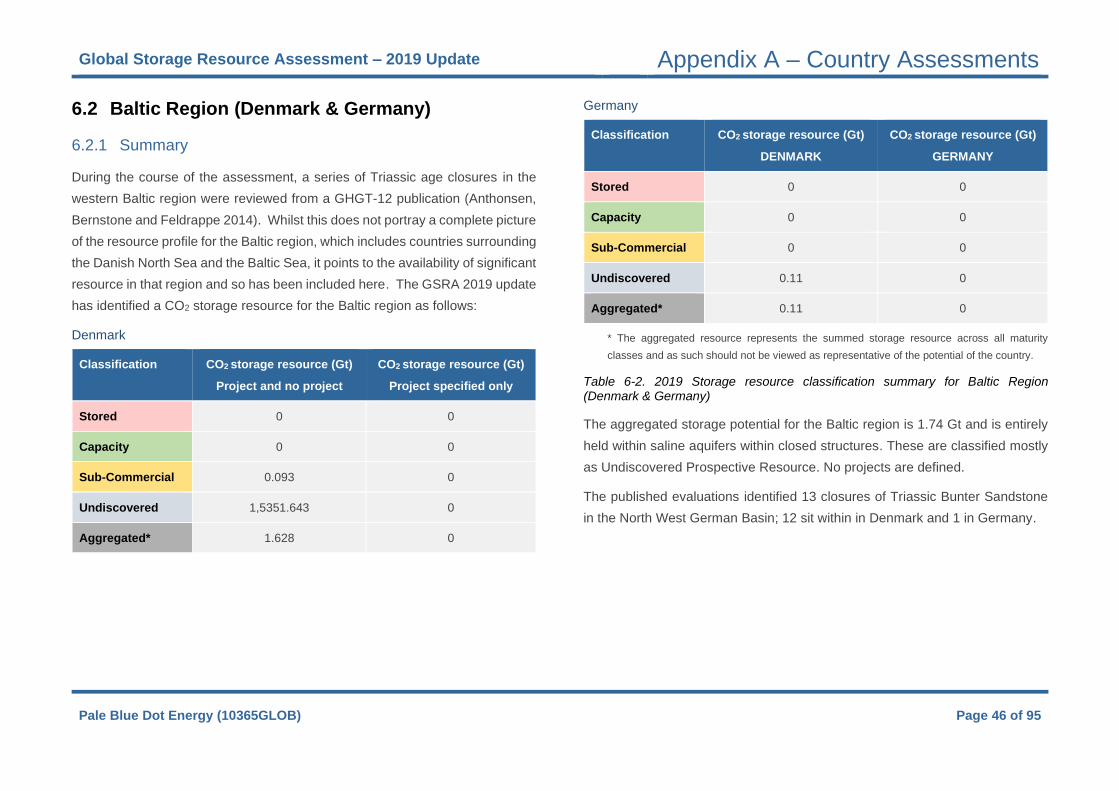
Global Storage Resource Assessment – 2019 Update Appendix A – Country Assessments
Pale Blue Dot Energy (10365GLOB) Page 46 of 95
6.2 Baltic Region (Denmark & Germany)
6.2.1 Summary
During the course of the assessment, a series of Triassic age closures in the
western Baltic region were reviewed from a GHGT-12 publication (Anthonsen,
Bernstone and Feldrappe 2014). Whilst this does not portray a complete picture
of the resource profile for the Baltic region, which includes countries surrounding
the Danish North Sea and the Baltic Sea, it points to the availability of significant
resource in that region and so has been included here. The GSRA 2019 update
has identified a CO2 storage resource for the Baltic region as follows:
Denmark
Classification CO2 storage resource (Gt)
Project and no project
CO2 storage resource (Gt)
Project specified only
Stored 0 0
Capacity 0 0
Sub-Commercial 0.093 0
Undiscovered 1,5351.643 0
Aggregated* 1.628 0
Germany
Classification CO2 storage resource (Gt)
DENMARK
CO2 storage resource (Gt)
GERMANY
Stored 0 0
Capacity 0 0
Sub-Commercial 0 0
Undiscovered 0.11 0
Aggregated* 0.11 0
* The aggregated resource represents the summed storage resource across all maturity
classes and as such should not be viewed as representative of the potential of the country.
Table 6-2. 2019 Storage resource classification summary for Baltic Region (Denmark & Germany)
The aggregated storage potential for the Baltic region is 1.74 Gt and is entirely
held within saline aquifers within closed structures. These are classified mostly
as Undiscovered Prospective Resource. No projects are defined.
The published evaluations identified 13 closures of Triassic Bunter Sandstone
in the North West German Basin; 12 sit within in Denmark and 1 in Germany.

Global Storage Resource Assessment – 2019 Update Appendix A – Country Assessments
Pale Blue Dot Energy (10365GLOB) Page 47 of 95
*Note: None of the Baltic sites have an associated project specified.
Figure 6-3. a) Spread of storage resource in all Baltic sites across SRMS classifications. b) Split of Baltic storage resource between saline aquifers and hydrocarbon fields, both project specified and not.

Global Storage Resource Assessment – 2019 Update Appendix A – Country Assessments
Pale Blue Dot Energy (10365GLOB) Page 48 of 95
6.2.2 Resource Statement
Figure 6-4. Storage resource summary for Baltic region compiled in the GSRA 2019 update. Graph above is log scale and graph below is linear. Projects were not specificed for any of these sites. Where possible the data have undergone due diligence checks, identifying potential repeat entries to avoid double counting.

Global Storage Resource Assessment – 2019 Update Appendix A – Country Assessments
Pale Blue Dot Energy (10365GLOB) Page 49 of 95
6.2.3 Evaluation History
The storage resources of the Baltic region were reviewed, and a preliminary
assessment carried out, during the GSRA 2019 Update. The basis of the
assessment is the Screening study of sites in the Southern North Sea and
Southwest Baltic Sea areas (Anthonsen, Bernstone and Feldrappe 2014). This
document is based on petroleum research project called Petrobaltic.
The GSRA reviewed the potential storage resource offered by saline aquifers,
both onshore and offshore. In the huge offshore area considered, only 11 wells
were available to the study,
6.2.4 Resource Review
6.2.4.1 Major Projects
No active or developing carbon storage projects have been assessed.
6.2.4.2 Depleted Oil & Gas Fields
No depleted oil and gas fields have been considered.
6.2.4.3 Saline Aquifers
The published evaluation considered static resource assessments of large
closed structures containing Jurassic and/or Triassic formations. This included
a review of reservoir and caprock potential.
6.2.5 Regulatory Framework
As the Baltic area is covered by the EU CCS Directive, the area is covered by
jurisdictions which are generally at an advanced state of deployment readiness.
Denmark, Germany and Poland are all classed as a ‘moderately performing’
nations by the 2018 GCCSI CCS Readiness Index. Of these, Germany leads
with the highest combination of scores for both CCS interest and readiness and
with increased focus after a 2019 shift on the government position regarding
underground CO2 storage. Poland carries a moderate readiness with a high
interest due to the countries large domestic coal resource and dependent on
fossil fuels. Denmark is also at a moderate readiness, but with advanced
renewable energy deployment and net zero policy ambitions.
6.2.6 Issues for the 2019 Assessment
The single source of storage resource evaluation provides a very early and
incomplete view of Baltic storage resource potential. The sites specified are
materially immature, although large subsurface structures have been identified
using seismic data.
6.2.7 Future Updates
Future assessment updates should review and check for published evaluations
of storage progress across the Baltic states.
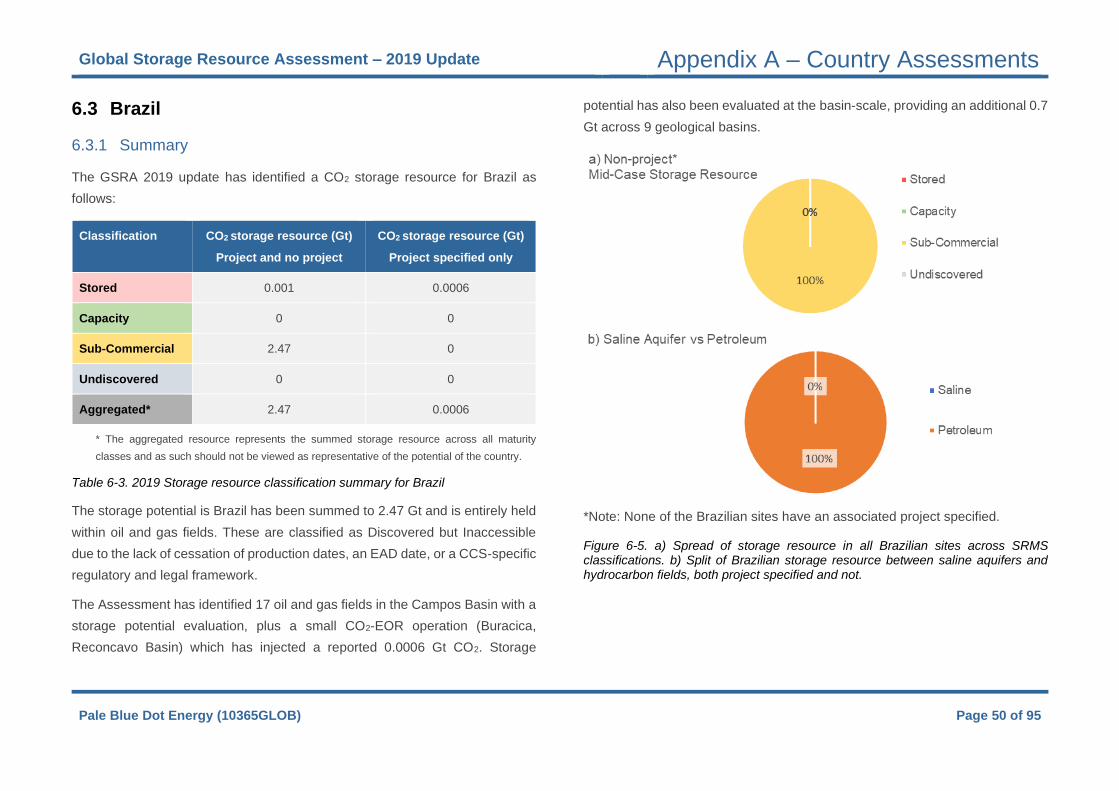
Global Storage Resource Assessment – 2019 Update Appendix A – Country Assessments
Pale Blue Dot Energy (10365GLOB) Page 50 of 95
6.3 Brazil
6.3.1 Summary
The GSRA 2019 update has identified a CO2 storage resource for Brazil as
follows:
Classification CO2 storage resource (Gt)
Project and no project
CO2 storage resource (Gt)
Project specified only
Stored 0.001 0.0006
Capacity 0 0
Sub-Commercial 2.47 0
Undiscovered 0 0
Aggregated* 2.47 0.0006
* The aggregated resource represents the summed storage resource across all maturity
classes and as such should not be viewed as representative of the potential of the country.
Table 6-3. 2019 Storage resource classification summary for Brazil
The storage potential is Brazil has been summed to 2.47 Gt and is entirely held
within oil and gas fields. These are classified as Discovered but Inaccessible
due to the lack of cessation of production dates, an EAD date, or a CCS-specific
regulatory and legal framework.
The Assessment has identified 17 oil and gas fields in the Campos Basin with a
storage potential evaluation, plus a small CO2-EOR operation (Buracica,
Reconcavo Basin) which has injected a reported 0.0006 Gt CO2. Storage
potential has also been evaluated at the basin-scale, providing an additional 0.7
Gt across 9 geological basins.
*Note: None of the Brazilian sites have an associated project specified.
Figure 6-5. a) Spread of storage resource in all Brazilian sites across SRMS classifications. b) Split of Brazilian storage resource between saline aquifers and hydrocarbon fields, both project specified and not.

Global Storage Resource Assessment – 2019 Update Appendix A – Country Assessments
Pale Blue Dot Energy (10365GLOB) Page 51 of 95
6.3.2 Resource Statement
Figure 6-6. Storage resource summary for Brazil compiled in the GSRA 2019 update. Graph above is log scale and graph below is linear. Blue box highlights sites where a project has been specified. Where possible the data have undergone due diligence checks, identifying potential repeat entries to avoid double counting..
Sites with a project specified

Global Storage Resource Assessment – 2019 Update Appendix A – Country Assessments
Pale Blue Dot Energy (10365GLOB) Page 52 of 95
6.3.3 Evaluation History
Brazil's storage resources were reviewed, and a preliminary assessment carried
out, during the 2019 Assessment. The basis of the assessment is the 2016
Brazilian Atlas of Carbon Capture and Storage. This document is based on
research by the Centre of Excellence in Research and Innovation in Petroleum,
Mineral Resources and Carbon Storage (CEPAC) and was funded by the Global
Carbon Capture and Storage Institute (GCCSI).
The 2019 Assessment also accessed information from the Brazilian Carbon
Geological Sequestration Map Project (CARBMAP; 2011), an effort to create a
geographic information system (GIS) to facilitate matching of CO2 sources and
sinks. These two documents currently provide the only information on storage
resource potential in Brazil.
The Assessment has reviewed the potential storage resource offered by oil and
gas fields, both onshore and offshore. Coalfields and basalts are also evaluated
by the Atlas but do not form part of this Assessment. Currently 24 hydrocarbon
fields, covering 10 geological basins, have been evaluated and considered by
the assessment. All storage resources are classified as Discovered as they are
oil and gas fields, however the absence of both a Cessation of Production (COP)
date, or an EAD, indicating when the resource may become accessible for CO2
injection, and the lack of a CCS-specific regulatory system limits them to
"Inaccessible Storage Resources". It should be noted that even though a CCS
regulatory framework is lacking, CO2 continues to be injected underground for
enhanced oil recovery under the existing petroleum regulatory system.
6.3.4 Resource Review
6.3.4.1 Major Projects
No major carbon storage projects were identified by the 2019 Assessment.
However, the Pre-Salt oilfields in the Campos and Santos offshore basins
contain high levels (8-12%) CO2 in the produced fluids (Iglesias et al., 2014).
Petrobras operate an active project which captures CO2 from the hydrocarbon
processing facilities and re-injects the CO2 into the supergiant Lula field in the
Santos Basin. This operation is utilising a 'hub and cluster' development which,
uniquely, deploys 10 FSPO's. The primary focus is on CO2-EOR however the
reported aim is to cumulatively inject 40 Mt by 2025. By January 2019, 10 Mt
had successfully been injected. Future assessments should re-visit this
operation.
6.3.4.2 Depleted Oil & Gas Fields
Quantitative information is available from the Brazil Atlas on the large, offshore
post-salt oil & gas fields within the Campos basin region. The Campos region
potential storage resource is estimated to be 950Mt (CARBMAP; Rockett et al.
2011) but the published resource only represents a subset of 17 fields out of 50
in the basin and excludes the large Pre-Salt oilfields. The approach to evaluating
storage potential uses the replacement methodology proposed by Bachu et al.
(2007).
Further basin-wide storage resource estimates are available for 9 additional
onshore basins. The data are derived from the CARBMAP project and also apply
a cumulative production/replacement methodology for resource evaluation.
In addition, the Reconcavo Basin project, a CO2 storage pilot project in fields
undergoing EOR, has evaluated the impact of 20 years CO2 injection into the

Global Storage Resource Assessment – 2019 Update Appendix A – Country Assessments
Pale Blue Dot Energy (10365GLOB) Page 53 of 95
onshore Buracica oilfield where a small 600,000t inventory has been injected for
enhanced oil recovery.
6.3.4.3 Saline Aquifers
The 2019 Assessment found no specific published details of CO2 storage
potential in saline aquifers. A 2009 pilot project in which 12,000 t CO2 was
injected into the Rio Pojuca saline aquifer represents the only reported carbon
storage.
6.3.5 Regulatory Framework
Brazil is classed as a ‘moderately performing’ nation by the 2018 GCCSI CCS
Readiness Index with moderate scores for both CCS Readiness and Inherent
Interest. Although Brazil's energy mix is 90% renewables, due to a large share
of hydropower in the country, it is supportive of CCS and recognizes it as an
important energy technology in its energy strategy. The government National
Energy Plan 2030, which identifies CCS technology as one of the tools to reduce
CO2 emissions from fossil fuel, was issued on 2007. CCS is also recognized as
a technology capable of boosting Brazil's energy security. However, there is
currently no clear policy environment which encourages investment in CCS and
no development of a regulatory or legal framework to enable deployment. This
is exemplified by the Santos Basin CCS facility which has developed into a
commercial-scale operation through implementation of CO2-EOR, not carbon
storage.
6.3.6 Issues for the 2019 Assessment
Both the Brazil Atlas and CARBMAP provide an early high-level overview of the
potential storage resource and links basins to emissions centres to minimise
transportation burden. However, the overall resource potential remains
unquantified and, as such, the 2019 Assessment is significantly incomplete with
regards to the classification.
6.3.7 Future Updates
Future assessment updates should review and check for published evaluations
of storage progress across Brazil. As the Pre-salt operations develop in the
Campos and Santos offshore basins, additional resource potential may be
identified.

Global Storage Resource Assessment – 2019 Update Appendix A – Country Assessments
Pale Blue Dot Energy (10365GLOB) Page 54 of 95
6.4 Canada
6.4.1 Summary
The GSRA 2019 Update has identified a CO2 storage resource for Canada as
follows:
Classification CO2 storage resource (Gt)
Project and no project
CO2 storage resource (Gt)
Project specified only
Stored 0.004 0.004
Capacity 0.057 0.057
Sub-Commercial 43.6 6.2
Undiscovered 360.3 0
Aggregated* 399 6.2
* The aggregated resource represents the summed storage resource across all maturity
classes and as such should not be viewed as representative of the potential of the country.
Table 6-4. 2019 Storage resource classification summary for Canada
• Storage resource potential is present in both saline aquifers and oil
and gas fields.
• Potential storage resource has been identified in 4 geological basins
with 56 sites or regional locations identified. All together, 11 projects
have been defined. High level, province-scale resource estimates
are also included in the Assessment for those provinces where a
more detailed break-down of the storage resource is unavailable.
• As of December 2019, 3.84 Mt of CO2 has been reported injected
and stored by two CCS projects operating in Canada: Quest (3.7 Mt)
and Aquistore (0.14 Mt).
• Five site characterisation projects have been undertaken over the
past decade, but these have not been progressed since completion.
• Most published information on potential storage resource is
geographically centred on the provinces of Alberta and
Saskatchewan within the Western Canada Sedimentary and
Williston basins, with additional potential identified in British
Columbia, Ontario, and Quebec.
• The current regulatory system is moving towards a CCS-specific
framework with most progress at the provincial level. Alberta and
• Saskatchewan have both approved CO2 injection legislation to
support the active Quest and Aquistore projects.
• There are currently no well-publicised plans for any future large-
scale CCS project in the pipeline, although opportunity may exist
with the Alberta Trunk Line (ACTL) CO2 pipeline project which is
expected to come online during 2020.

Global Storage Resource Assessment – 2019 Update Appendix A – Country Assessments
Pale Blue Dot Energy (10365GLOB) Page 55 of 95
Figure 6-7. a) Spread of storage resource in Canadian sites across SRMS classifications, where a project has been specified. b) Spread of storage resource in all Canadian sites across SRMS classifications; both project specified and not. c)
Split of Canadian storage resource between saline aquifers and hydrocarbon fields, both project specified and not.

Global Storage Resource Assessment – 2019 Update Appendix A – Country Assessments
Pale Blue Dot Energy (10365GLOB) Page 56 of 95
6.4.2 Resource Statement
Figure 6-8. Storage resource summary for Canada compiled in the GSRA 2019 update. Graph above is log scale and graph below is linear. Blue box highlights sites where a project has been specified. Where possible the data have undergone due diligence checks identifying potential repeat entries to avoid double counting.
Sites with a project specified

Global Storage Resource Assessment – 2019 Update Appendix A – Country Assessments
Pale Blue Dot Energy (10365GLOB) Page 57 of 95
6.4.3 Evaluation History
Canada was selected as the priority country for review during the 2019
Assessment. The approach taken was to review the published national and
regional evaluations of storage potential, followed by a more detailed study of
specific projects at the basin and local scale. As a starting point, both the North
American Carbon Storage Atlas (NACSA, 2012) and the 2015 DOE Atlas V were
used to derive high level estimates of the storage resource at the Country- and
Province level. US-DOE-funded projects, through the Regional Carbon
Sequestration Partnerships (specifically the Plains CO2 Reduction Partnership;
PCOR), provided additional data and information. The storage potential in
unmineable coals seams (Enhanced Coalbed Methane, or ECBM), basalt
deposits, and organic-rich shale units has also been investigated by both the
country-level atlases and the regional studies, but has not been included in this
Assessment, as these resource types do not fall within the current SRMS.
6.4.4 Resource Review
6.4.4.1 Major Projects
In 2006, Canada’s National Round Table on the Environment and Energy
(NRTEE, 2006), a now defunct independent advisory board to the Canadian
Government, reported that CCS technology had the potential to offer up to 40%
of the required reductions in CO2 emissions in Canada (NRTEE, 2006). In the
following decade, various task forces created a case for CCS implementation in
Canada, leading to over $3 billion in government and provincial support for CCS
through a range of programs. As a result, several large-scale CCS
demonstration projects, designed to inject at least 1 Mt CO2 / year, were
advanced. These included:
• Boundary Dam Carbon Capture project: a coal-fired electricity-
generation project (SaskPower, Saskatchewan).
• Alberta Carbon Trunk Line (ACTL): a CO2 pipeline project (Enhance
Energy, Alberta).
• Quest CCS: Scotford oil sands upgrader (Shell, Alberta).
• Pioneer project: coal-fired electricity generation (TransAlta, Alberta).
• Swan Hills project: underground coal gasification and syn-gas
electricity generation (Alberta).
• Fort Nelson CCS: shale gas processing plant (Spectra Energy, NE
British Columbia).
• Weyburn: commercial CO2 -EOR (Whitecap Resources (formerly
owned by Cenovus Energy), Saskatchewan).
• Midale: commercial CO2-EOR (Apache Energy, Saskatchewan).
Of these, only Boundary Dam, Quest, and Weyburn-Midale are actively either
capturing or injecting CO2; albeit predominantly for EOR, using CO2 captured
from the Boundary Dam site, or piping CO2 from the Dakota Gasification syn-
fuels plant in North Dakota (Weyburn-Midale fields).
As of the 2019 Assessment, only the Quest CCS project and the Aquistore
project, which acts as a ‘overflow’ store for CO2 captured at Boundary Dam, are
currently injecting CO2 into saline aquifers as part of fully integrated and
monitored CCS projects. The Fort Nelson project completed initial site
characterisation studies and is currently on-hold. The Pioneer CC project
collapsed in 2012 for economic reasons related to the absence of either a
national carbon trading market, or a method for capturing value from emissions
credits (Petroleum Economist, 2012). Swan Hills Syn-Fuels ran a demonstration
project (the ISCG project) in 2009 but has since shifted the company focus.

Global Storage Resource Assessment – 2019 Update Appendix A – Country Assessments
Pale Blue Dot Energy (10365GLOB) Page 58 of 95
Site Studies
Several saline aquifer site characterisation projects were carried out during the
period 2004 – 2014. These attempted to identify or technically progress potential
storage sites:
• WASP
• HARP
• Athabasca area
• St Lawrence Lowlands basin, Quebec (Becancour project)
• Michigan Basin, Ontario
• PCOR (Plains CO2 Reduction Partnership Basal Cambrian System
These are included in the 2019 Assessment.
6.4.4.2 Application of the SRMS in North America
North America raises some of the issues discussed in Section 3.2, which are
particular to both Canada and the USA. National atlases (e.g. 2015 DOE Atlas
V and the 2012 NASCA Atlas) have been used as a starting point for reviewing
the resource potential of each country. These publications report state-wide or
province-wide resource estimates for USA and Canada. These estimates are
generally large numbers for which there is no detail explaining source or
geographic distribution of the data inputs. Both atlases do, however, provide an
explanation of how the resource estimate was calculated, including providing
low/mid/high values for the storage efficiency factors applied to saline aquifers.
The GSRA 2019 Update uses the 2015 DOE Atlas V resource estimates in
preference to the earlier 2012 NASCA data. According to the Atlas V, the data
presented is derived from the DOE-funded Regional Carbon Sequestration
Partnerships. These partnerships have distinct study areas which are defined
by geological basins, i.e. not state or province boundaries, and therefore there
is often no clear alignment between the state and province-level reporting by the
Atlases, and the Regional Partnership evaluation reports.
The GSRA 2019 Update has reviewed studies undertaken by the PCOR and
Big Sky Regional Partnerships. The PCOR study area crosses the USA/Canada
national boundary and covers those parts of British Columbia Alberta,
Saskatchewan and Manitoba which sit within the Alberta and Williston basins.
The partnerships also include several USA states: Montana (North-Central and
Williston Basin), North Dakota, South Dakota, NE Wyoming (Powder River
Basin) and NW Nebraska (Denver Basin). These are reviewed in Section 4.8 of
this report.
For saline aquifers, the Regional Partnerships provide two levels of storage
resource evaluation: DOE Phase I and II studies which provide high level
resource estimates at the formation-level, and DOE Phase III studies which
evaluated specific sites as detailed site characterisation studies or
demonstration projects. As per the SRMS guidelines, formation level resource
estimates have been classified as Undiscovered: Prospective Sequence Play
due to the generally large area covered by the resource, and the lower level of
confidence in the resource estimate. Site specific or demonstration studies have
been classified as Discovered and then further classified based on their level of
development (e.g. Not Viable).
These saline aquifer resource evaluations have been handled according to the
level of published data available:
1. Where the Sequence Play resource estimates are considered
to fully represent the State- or Province-wide resource estimate
provided by the Atlas V, the GSRA 2019 Update has nulled

Global Storage Resource Assessment – 2019 Update Appendix A – Country Assessments
Pale Blue Dot Energy (10365GLOB) Page 59 of 95
the State- or Province-wide resource estimate and a note has been
attached to the assessment.
2. Where there is insufficient data available to fully supersede
the State- or Province-wide resource estimate, the Atlas-derived
estimate has been held and classified as Undiscovered:
Prospective Basin Play.
3. If a resource estimate for a Sequence Play can be shown to only
partly contribute to the State- or Province-wide resource estimate,
the Sequence Play estimate is subtracted from the Basin Play
estimate to avoid double counting within the Undiscovered SRMS
maturity class.
4. Where no resource estimate is available in the 2015 DOE Atlas, the
2012 NASCA report has been used (this applies to the eastern
Canada provinces which are not covered by the DOE Regional
Partnerships).
5. Where storage resource estimates are available and classified as
Discovered, the resource estimate has not been subtracted from the
Sequence or Basin Play resource estimate to avoid aggregation
across SRMS maturity classes. This has been noted in the 2019
Assessment notes for that site.
This approach has highlighted some issues:
• Mismatch of resource estimate values between different Atlases, e.g.
the Atlas V estimate is significantly different to the equivalent NASCA
estimate. This occurs for both oil and gas fields, and saline aquifers.
Where possible the DOE Atlas has been used in preference to the
NASCA Atlas to provide consistency of data inputs and volumetric
calculations.
• Multiple evaluations of the same saline aquifer formation reporting
quite different resource estimates. This is particularly true for the
Cambro-Ordovician Basal Sand for which there are 3 different static
volumetric estimates which use mid-range storage efficiency factors
(E) of 2%, 9.1% and 14%. In this case, preference has been given
to estimates derived from 3D static models which use the lower value
of E, which here is 9.1% as opposed to 14% (while 14 % is used by
PCOR for clastic lithologies where all net-to-gross terms are known
(Goodman et al., 2011), a more recent study (Craig et al., 2014)
suggests that on a 50 year injection time-scale values of E greater
than 2% may be overly optimistic). The alternative estimates are
noted in the Assessment.
• Resource estimates are provided for a geological basin, i.e. they are
not sub-divided by federal nation, or state/province. For the Basal
Sand, which covers an international boundary, the approach taken
is to use a percentage value of the resource estimate derived from a
2D model which did apportion the resource between USA and
Canada and apply to the 3D static estimate.
• Aggregated Sequence Play resource estimates for a region do not
equal the Basin Play resource estimates for that region. This
suggests that either the Basin Play resource estimates contain
additional data, which is not apparent from the regional studies
available, or that the range of storage efficiency factors applied are
quite different. This highlights the need for a consistent approach to
storage resource calculation.
• Studies which use a simulation to evaluate the impact of pressure
on the storage potential of a formation indicate that the storage

Global Storage Resource Assessment – 2019 Update Appendix A – Country Assessments
Pale Blue Dot Energy (10365GLOB) Page 60 of 95
resource is up to 1 magnitude lower than the equivalent volumetric
estimate. Where this occurs, it is noted in the assessment and the
country report and suggests that the volumetric resource estimate is
likely to be invalid.
6.4.4.3 Depleted Oil & Gas Fields
The aggregated depleted field resource identified by the 2019 Assessment is
11.2 Gt. This Sub-commercial resource is assumed Discovered but is classed
as currently Inaccessible due to a lack of information on abandonment dates for
the fields. 7.1 Gt storage potential sits within identified oil and gas fields with the
remaining 4 Gt derived from high level, province-scale studies which do not
provide any level of detail on data source or distribution.
The 2012 NASCA report states that over 50,000 oil and gas reservoirs, plus oil
reservoirs with a gas cap, existed at the time of reporting in north-eastern British
Columbia, Alberta, Saskatchewan, and Manitoba. Additional fields are also
present in Ontario (below Lake Erie), Northwest Territories, and in the Canadian
offshore (Nova Scotia and Newfoundland). Twenty-three (23) depleted fields
have been included in the 2019 Assessment. Inclusion was based on a few key
criteria: a published evaluation of storage potential for an individual field or pool,
having greater than 20 Mt reported storage potential, and appearing in a publicly
available, searchable reserves database. None of the oil or gas fields in the 2019
Assessment have an abandonment date or an EAD (Earliest Accessibility Date)
assigned as the necessary information is not available in the public domain. A
significant number of oil fields in Canada are currently, or have previously
undergone, secondary or tertiary recovery and are flooded with the water or
natural gas injected to enhance oil production, leaving little available pore
volume for CO2. These are typically not included in published storage resource
estimates.
Most of the identified storage resource is in oil pools (5.9 Gt) which are located
predominantly in Saskatchewan and Manitoba. Oil pool size in Alberta is
generally small. Of nearly 8500 oil reservoirs under primary production in 2004
only 98 have a calculated storage resource > 1Mt (Bachu, 2004), and only 1 oil
pool was identified as having a resource greater than the 20 Mt cut-off applied
by this study. Similarly, gas pools in Canada are typically small. Out of nearly
25,800 fields studied in the published literature, only 9 fields in Alberta and 7 in
British Columbia qualify for the >20Mt cut-off; Saskatchewan and Manitoba do
not contain any identified resource potential in gas fields. The total storage
resource reported for gas pools is 1.2 Gt.
Regarding commercial readiness of the depleted field resource identified, no
projects with a stated aim of injecting CO2 directly into depleted fields for storage
have been identified. CO2-EOR is taking place in several locations but these
projects and injected volumes do not form part of the SRMS at this stage. At the
province level, British Columbia is least commercially mature with most of the
stated storage resource sitting within the Undiscovered Province-wide
classification.
Additional data included in the SRMS database were taken from online reserves
data maintained by each province. In some cases, e.g., Saskatchewan, these
publications are not exhaustive and only provide data from a selection of active
projects (i.e., high activity, new projects/pools, or changes to existing
projects/pools).
6.4.4.4 Saline Aquifers
Most of the saline aquifer resource (360 Gt; 93%) is within Undiscovered
resource, split between Sequence Play (83%) and Basin Play (10%). Sub-
commercial resources make up a much smaller proportion (25.6 Gt; 6.6%) of

Global Storage Resource Assessment – 2019 Update Appendix A – Country Assessments
Pale Blue Dot Energy (10365GLOB) Page 61 of 95
the summed saline storage resource. Storage projects form only 15% (3.9 Gt)
of the Sub-commercial resource however the only reported, non-EOR stored
CO2 in Canada is within the Cambro-Ordovician Basal Sand formation saline
aquifers at the Quest and Aquistore projects in Alberta and Saskatchewan
respectively where a total of 61 Mt is either already Stored, or is permitted for
injection (On-Injection).
Saline aquifers identified as holding storage potential in Canada include the
diachronous Cambro-Ordovician Basal Sand clastic formation in the Williston
and Alberta basins, and it's temporal equivalent, the Mt Simon Sandstone in
Ontario, Devonian carbonates located predominantly within the West Canadian
Sedimentary Basin, and the Lower Cretaceous Viking Formation in the Alberta
Sub-basin.
In terms of commercial maturity of saline aquifer storage potential, Alberta is
significantly more advanced than other provinces, with identified potential
resources at several stages of maturity. Saskatchewan is dominated by storage
resource estimates for the Basal Sand, but only the Aquistore project is currently
demonstrating successful injection. In comparison, British Columbia, Manitoba,
and the eastern provinces of Ontario and Quebec contain significantly lower
resource volume and are less commercially (and technically) advanced, except
for the Fort Nelson CCS site in British Columbia.
Basal Sand Storage Potential. The Cambro-Ord Basal Sand (or Basal Aquifer)
is one of the most widely studied aquifers. As such there are several different
estimates of storage potential for the unit; all of which use different values for
storage efficiency:
• Province-wide estimates of storage potential provided by the DOE
Atlas V using a mid-range storage efficiency factor of 2.0%.
• A 2013 PCOR 2D static volumetric estimate which provides a split
between the Canadian (75.2%; 85 Mt) and US (24.8%) portions of
the Williston and Alberta basins and uses a P50 storage efficiency
factor of 2.4%.
• Two (2014 and 2015) PCOR 3D static (geocellular) models for the
combined USA & Canada area (373 Mt) which use P50 values for
storage efficiency of 9.1% and 14% to calculate a volumetric
estimate of storage (note: as discussed above, 14% is considered
an unrealistically high storage efficiency factor on a 50 year injection
timescale and so is not used in this assessment).
• Two numerical simulation studies which both look at injecting a set
volume (63 Mt and 94 Mt) of CO2 into the Basal Sand over a period
of 50 years. Both use the 3D geocellular static model (or equivalent
using the same dataset) developed for the 2014 volumetric case. By
optimising injection location in areas of highest modelled
transmissivity within Saskatchewan and eastern Alberta, the model
was able to successfully able to simulate injection of 3100 Mt (63
Mt/year) without exceeding set pressure constraints using 5 injection
locations (including the Quest site). It should be noted that the
pressure map of the Basal Sand model indicates that there is little
pressure space remaining in the high transmissivity areas of the
aquifer following injection of this volume of CO2 and, as such, may
represent a near-capacity resource value. The alternative (94
Mt/year) simulation attempt focussed injection at the Duffield-
Warburg power generation facility (Alberta) but only achieved a
maximum injected volume of between 298 Mt and 1280 Mt over the
50-year period. Detail is limited in both studies but it appears from

Global Storage Resource Assessment – 2019 Update Appendix A – Country Assessments
Pale Blue Dot Energy (10365GLOB) Page 62 of 95
maps of the simulated subsurface pressure increase that the 2 study
areas do not overlap as the 63 Mt/year study discarded the Warburg
site as it failed to achieve the injection volume of 23 Mt/year set in
that model for the Warburg site.
• Active injection operations which target the Basal Sand are currently
operating at the Shell Quest CCS project (Alberta) and the Aquistore
project (Saskatchewan)
The Basal Sand is classified as a Sequence Play (Undiscovered) and assigned
a summed storage resource estimate of 75.2% of the 2014 3D static model
volumetric calculation (284 Gt). It is noted that this is a very high estimate of
storage resource potential given the numerical simulations which achieved
almost one order of magnitude lower injection volumes.
The Basal Sand project sites are classed as Discovered Sub-commercial:
Contingent (Development Not Viable) resources for those where no current
project evaluation is occurring, or Commercial: Capacity (Stored or On Injection)
where CO2 injection is taking place or permitted. By carrying the Prospective,
Contingent and Capacity resource estimates in the database, there is a degree
of 'double counting', however this only amounts to 6500 Mt (6.5 Gt) out of the
high level volumetric estimate of 284,000 Mt (284 Gt) and as such only
represents 2.8 % of the volumetric estimate. It also raises the question of
whether any credence should be given to the static volumetric resource estimate
given the issue of available pressure space for a 50-year injection project.
Devonian Aquifers Potential. The mid-upper Devonian section of the foreland
basin is best developed in the Alberta sub-basin of the West Canadian
Sedimentary Basin. At the basin scale, the section has been evaluated by the
PCOR group with a summed storage resource of 14.2 Gt. The Devonian
aquifers have also been targeted by several studies including the Athabasca
area identifying possible storage resource associated with the oil sands
operations in the area, large reefal build-up structures (HARP) and regional
carbonates (WASP).
Lower Cretaceous Aquifer Potential: The Viking Formation, which sits within the
Alberta Basin, has been evaluated by PCOR as having some storage resource
potential. No storage projects have been identified within the formation.
The 2019 Assessment carried an assumption that the DOE Atlas V (2015)
province-wide estimates for saline aquifers represent the sum of any reported
regional evaluations (e.g. by PCOR). As per the discussion in Sections 3.2- 3.6,
the SRMS entries at the province-level for Alberta, Saskatchewan and Manitoba
have therefore been assigned a null value.
6.4.5 Regulatory Framework
Canada is the top-ranking nation in the GCCSI CCS Readiness index, meaning
that it has been identified as a leader in promoting and deploying CCS. It is only
lacking a strong policy to help drive investment for rapid deployment on a
commercial scale. The regulatory competence for developing CCS legislation in
Canada is shared between several national and provincial bodies. Regulatory
development, in the form of design and implementation of CCS-specific
legislation, has principally occurred at the provincial level in Canada. Several
provinces have undertaken reviews and scoping studies to consider their
existing regimes potential to manage CCS activities and, in some instances, this
has resulted in the promotion of CCS-specific frameworks. The provincial
governments of Alberta, Saskatchewan, and Nova Scotia have all made
attempts towards the deployment of CCS-specific legislation in recent years,

Global Storage Resource Assessment – 2019 Update Appendix A – Country Assessments
Pale Blue Dot Energy (10365GLOB) Page 63 of 95
however it is the province of Alberta that has developed the most comprehensive
CCS-specific model.
6.4.6 Issues for the 2019 Assessment
6.4.6.1 Data Validation
While the NASCA (2012) report provides a useful early snapshot of storage
resource potential in Canada, it has been superseded by province-wide
resource statements published in the 2015 DOE Atlas V. In addition, the NASCA
Viewer and website which provided web-based access to all NASCA data is no
longer live. Information is provided on the method of calculation of storage
potential in both reports, however there is little to no supporting detail as to the
source of the data. However, the DOE Atlas also has significant shortcomings
for application to the SRMS. The data presented as state-wide storable
quantities are derived from studies carried out by the DOE Regional
Partnerships. For Canada, this only includes information from the PCOR group
(the WestCarb group does not appear to have published any studies for the west
coast of Canada). For example, PCOR studies provide back-up for the overall,
basin-wide storage potential reported for the Cambro-Ord Basal Sand, but this
not reported at the province-level.
6.4.6.2 Probabilistic Assessments
The data available for the 2019 Assessment suffer from a lack of probabilistic
analysis; most studies do not provide a range of estimates of storage resource.
For studies which provide a storage resource estimate derived from a volumetric
methodology, a range of storage efficiency factors may be used but these are
applied to a single static model pore volume. Numerical simulations are rarely
available for the sites reviewed by this report, and often only give a single
storage resource value, assessing whether the site meets the stated benchmark
resource.
Projects (sites with dynamic simulations which specify an injection volume and
a development plan) may only report a single 'base case' resource value. At the
only actively injecting projects, Quest and Aquistore, the resource classified as
Stored or On-Injection refers to the permitted injection volume, not the maximum
storage potential which is not reported.
6.4.6.3 National Atlas Data Discrepancy
There is a significant discrepancy between the storage resource figures
provided in the 2015 DOE Atlas V and the 2012 NASCA report. For example,
the Alberta saline aquifer storage resource in the NASCA report is given as 28
Gt, but the DOE report gives a mid-estimate value of 76.74 Gt, over 2x
greater. Similarly, the values for Saskatchewan saline aquifer storage vary
between 75 Gt in the NASCA report but greatly increase to 285.22 Gt (mid
estimate; 149.72 Gt as the low estimate) in the DOE report.
The discrepancies cannot be wholly attributed to differing methodologies for
calculating storage resource as both studies use the same volumetric equation
and efficiency factors for saline aquifers. Discussion with the DOE-NETL team
responsible for generating the Atlas V numbers suggests that the regional
PCOR study data are not included in the NASCA numbers, as NASCA Canada
generated their own estimates. It is suggested here that any figure for saline
aquifers derived from the 2012 NASCA study should be considered a low
estimate for those provinces which are covered by the DOE Regional
partnerships.
By contrast, the depleted field storage resource estimates are higher (for each
province) in the NASCA report relative to the DOE Atlas, for example, the

Global Storage Resource Assessment – 2019 Update Appendix A – Country Assessments
Pale Blue Dot Energy (10365GLOB) Page 64 of 95
Alberta depleted field resource is 12 Gt in NASCA but only 1.49 Gt in the DOE
Atlas. The reasons for the discrepancies are not clear, NASCA (2012) states
that the CSLF approach of using original oil or gas in place plus a recovery factor
(and an efficiency factor based on local experience or simulations) was applied.
The DOE Atlas applied two methods depending on the available data. Either an
efficiency factor to convert produced volumes to CO2 storage volumes, or a
straight replacement (on volume-for-volume basis) of hydrocarbon by CO2 was
used (DOE, 2015). Given the fact that only 3 years separates the publication of
each report, the difference in values for storage resource at the Province-scale
should be used with caution.
In all cases, the 2015 DOE Atlas V data are used in preference to the 2012
NASCA data as they are the most recent storage estimate available. NASCA
data are used if the Atlas V does not report for a province (this mainly applies to
the eastern provinces).
6.4.6.4 Data Mismatch for Oil and Gas Fields
Following on the above discussion, there is also an issue with data mismatches
between the high level, province-scale resource estimates, and the estimates
based on site-specific resources, e.g., in Saskatchewan the province-wide total
of 960 Mt reported is significantly less than the 4857 Mt resource reported in
depleted fields in the public literature. In such cases, the province-wide resource
has been entered as a null value in the database.
6.4.6.5 Availability of Resource Estimates
Storage resource potential in oil and gas reservoirs is only quoted for British
Columbia, Alberta, Saskatchewan, Manitoba and Ontario as, while oil and gas
reservoirs are present outside of these provinces, they are considered by the
major reports to be too distant from major emissions sources and therefore not
reported.
6.4.7 Future Updates
Required updates to the 2019 Assessment should include:
• Annual adjustments to account for continued injection and any
model updates at Quest and Aquistore. Annual reports are
released for both projects (end-first quarter) and should be reviewed
when released for database update.
• Update following any future release of DOE Carbon Storage
Atlas, or equivalent publication. This should include any further
information as to the source of the data used to generate the high,
Province-level, estimates of storage potential. According to the team
at the US DOE responsible for the Atlas, an updated edition is
currently in-progress, but no release date was provided (M Sullivan,
pers. comm, January 2020).
• Additional release of information on depleted field availability
and storage resource calculations. All depleted field resource
data are currently classes as Discovered - Inaccessible due to the
absence of a published field abandonment date.

Global Storage Resource Assessment – 2019 Update Appendix A – Country Assessments
Pale Blue Dot Energy (10365GLOB) Page 65 of 95
6.5 China
6.5.1 Summary
The GSRA 2019 update has identified a CO2 storage resource for China as
follows:
Classification CO2 storage resource (Gt)
Project and no project
CO2 storage resource (Gt)
Project specified only
Stored 0.0003 0.0003
Capacity 0 0
Sub-Commercial 105 0.031
Undiscovered 3067 0
Aggregated* 3077 0.03
* The aggregated resource represents the summed storage resource across all maturity
classes and as such should not be viewed as representative of the potential of the country.
Table 6-5. 2019 storage resource classification summary for China
• There is a total of 72 sites in this GSRA 2019 update, largely at a
regional scale or a high-level evaluation, with only two sites
associated with a project. The storage resource is located across a
minimum of 21 geological basins, both onshore and offshore.
• China boasts numerous CCUS projects, of which 8 of the key
projects currently are, or will reach large-scale operations in the
2020s.
• Government policy has led to numerous pilot- and large-scale CCUS
facilities being developed, however, this is largely to support
enhanced oil recovery operations (EOR). The lack of CCS-specific
legislation means more needs to be done to incentivise geological
storage and true decarbonisation.

Global Storage Resource Assessment – 2019 Update Appendix A – Country Assessments
Pale Blue Dot Energy (10365GLOB) Page 66 of 95
Figure 6-9. a) Spread of storage resource in Chinese sites across SRMS classifications, where a project has been specified. b) Spread of storage resource in all Chinese sites across SRMS classifications; both project specified and not. c) Split of Chinese storage resource between saline aquifers and hydrocarbon fields, both project specified and not.

Global Storage Resource Assessment – 2019 Update Appendix A – Country Assessments
Pale Blue Dot Energy (10365GLOB) Page 67 of 95
6.5.2 Resource Statement
Figure 6-10. Storage resource summary for China compiled in the GSRA 2019 update. Graph above is log scale and graph below is linear. Blue box highlights sites where a project has been specified. Where possible, the data have undergone due diligence checks identifying potential repeat entries to avoid double counting.
Sites with a project specified

Global Storage Resource Assessment – 2019 Update Appendix A – Country Assessments
Pale Blue Dot Energy (10365GLOB) Page 68 of 95
6.5.3 Evaluation History
The regional evaluation by the Pacific Northwest National Laboratory in 2009
(PNNL 2009), of the potential CO2 storage resource available within the onshore
and offshore territory of China was a first of its kind. It was produced as a
collaboration between US and Chinese researchers and was commissioned by
the US Department of Energy. The report evaluates a large and diverse
geographic portfolio of potential CO2 storage resource within oil and gas fields,
deep saline formations and coal seams. It is only intended to provide a starting
point for finer resolution analysis. The majority of the Chinese sites are sourced
from this PNNL report.
The estimation of the storage resource within saline aquifers was considered
only through theoretical calculation of 100% dissolution of CO2 within reservoirs
deeper than 800-1000m. Whilst acknowledging the clear potential for
hydrodynamic and residual trapping, these storage mechanisms are not
specifically included within the assessment. The authors PNNL suggest that
this approach of ignoring the potential of "free CO2" phase storage will result in
a very conservative resource estimate.
For the evaluation of gas fields, a modified replacement method was adopted
which assumes that only 75% of the pore volume once occupied by produced
gas could be filled with CO2. This would seem to make provision for some loss
of storage efficiency perhaps resulting from water ingress into the reservoirs
from underlying water legs.
Unlike the other regional assessments, the PNNL study only considers the
storage in oilfields when linked to enhanced oil recovery. Instead of deploying a
simple replacement method for the assessment of storage potential, the regional
assessment has considered this potential using guidance and analogues from
well-established CO2 EOR provinces such as the West Texas area of the US.
This together with pre-published assessments of initial oil in place for Chinese
oilfields has enabled an initial assessment of potential storage resources
associated with EOR to be made. It should be noted that the CO2 EOR
performance of the primary analogues is drawn from an environment where the
oil producer must purchase CO2 from a provider. As a result, the operators have
become extremely efficient at using the purchased CO2 inventory to optimise oil
recovery. Of course, this approach also minimises CO2 Storage resource by
definition and so this does represent a conservative view of potential storage
resource.
Updates to this report include the stored volume at the Shenhua Group CCS
Demonstration project (Diao 2018), plus theoretical storage resource
evaluations for hydrocarbon fields within the Dagang oilfield complex (Vincent
2010).
6.5.4 Resource Review
6.5.4.1 Major Projects
China hosts a plethora of CCS and CCUS projects, ranging from pilot and
demonstration right up to large-scale projects. Many of these projects are not
well publicised and as such, this study may be an under-representation of the
full scale of commercial and research operations currently being undertaken in
China. The GCCSI (2018) recognises 18 key CCUS projects in China, including:
• 10 enhanced oil recovery (EOR) projects; 5 of which are
demonstration projects and 5 of which are currently or are
developing towards large-scale operations by the 2020s
• 3 projects capturing carbon dioxide for use in industrial or beverage
applications

Global Storage Resource Assessment – 2019 Update Appendix A – Country Assessments
Pale Blue Dot Energy (10365GLOB) Page 69 of 95
• 2 projects currently under evaluation. There are large-scale facilities
with power and coal-to-liquids applications.
• 3 projects are dedicated geological storage servicing the power and
coal-to-liquids industries. One of these projects came to completion
in 2014.
As carbon utilisation is outside the scope of this study, only projects utilising
permanent geological storage of CO2 were considered in this GSRA 2019
update. These projects include:
Shenhua Group CCS Demonstration project in the Ordos Basin. It was the first
deep saline aquifer storage in China. The project started in 2011, injecting 0.1
Mtpa until completion in 2014, reaching a total of 0.302 Mt CO2 stored. The full-
chain CCS project captured CO2 from a coal liquefaction plant and injected the
CO2 into a tight carbonate reservoir using fracking to enhance secondary
porosity.
China Resources Power (Haifeng) Integrated CCS Demonstration Project,
Shanwei. A capture test platform has been running since 2018 capturing 0.025
Mtpa from the power industry, aiming to scale up to large-scale operations (1
Mtpa) in 2020s. Due to the small volumes, this project is not included in the
website database.
Guohua Jinjie CCS Full Chain Demonstration, Shaanxi Province.
Demonstration-scale operations capturing CO2 from a coal-to-liquids facility at
0.15 Mtpa since 2017. Due to the small volumes and lack of publicly available
literature, this project is not included in the website database.
6.5.4.2 Depleted Oil & Gas Fields
The natural gas fields represent a small portion of the storage resource in China,
with an aggregated storage resource of 5.2 Gt. Similarly, oilfields comprise a
more minor component, with an aggregated storage resource of 4.8 Gt for
oilfields including EOR. In this GSRA 2019 update, evaluations for geological
CO2 storage, rather than CO2 EOR, could only found for the Dagang Oilfield
Complex. This highlights the need for the country-wide evaluation of
hydrocarbon fields, to avoid the underestimation of storage resource, as detailed
in 6.5.3.
All storage resource within depleted hydrocarbon fields is classified as
discovered. As the SRMS classification places a significance on the presence
of a CCS regulatory system for classification, the absence of such a system in
China currently limits the classification of discovered resources to
"Inaccessible". For the oilfields evaluated with EOR operations (PNNL 2009),
however, the resource could be classified as “Development Not Viable” as CO2
injection for EOR can take place under existing petroleum regulatory systems.
6.5.4.3 Saline Aquifers
As in many countries, deep saline formations represent the largest storage
target in China, with an Aggregated Storage Resource for Undiscovered sites in
this GSRA 2019 update of 3067 Gt (PNNL 2009). The PNNL regional evaluation
does not present any information regarding the discovery status or the
geological formations of the potential CO2 storage resource. As a result, the
entirety of the saline aquifer potential has been classified as Undiscovered Basin
Play, even though significant tracts of this potential resource will undoubtedly
have been discovered through exploration for petroleum and groundwater
resources.

Global Storage Resource Assessment – 2019 Update Appendix A – Country Assessments
Pale Blue Dot Energy (10365GLOB) Page 70 of 95
A small volume (0.302 Mt) has been stored in the Shenhua Group CCS Project
(Diao 2018), while 31.4 Mt is classified as Discovered Inaccessible (Wen 2018),
due to the lack of a CCS-specific regulatory system in China. The evaluation by
(Wen 2018), uses simulation modelling to estimate the storage resource of the
Donggou Formation, in the Junggar Basin, and represents one of only two sites
in this 2019 report with a project specified. In a country where there are
numerous CCS and CCUS projects being undertaken, this highlights the lack of
detailed published literature on the Chinese CO2 storage resource.
6.5.5 Regulatory Framework
China has numerous pilot- and large-scale CCUS facilities supporting the
cement, coal-to-liquids and steel industries. These have been developed
through state-supported research and development funding. The GCCSI
recognise the strong focus on government incentives for EOR activities but
encourage a stronger emphasis to be placed to incentivising storage through
policy and CCS-specific regulation (Global CCS Institute 2018).
6.5.6 Issues for the 2019 Assessment
The calculation of depleted oil fields in the PNNL report was only considered
when in EOR applications, which not only contrasts the methodology of other
regional reports, but also doesn't provide a true reflection of CO2 stored, as
described in 6.5.3. Indeed, due to these complications, EOR studies are out of
the scope for this GSRA 2019 update, however the values from the PNNL report
were included, in the absence of other significant estimations.
6.5.7 Future Updates
Further work should focus on evaluation at a site or even formation level, to
progress the maturity of the Chinese resource along the SRMS classification
system. The current evaluations of Chinese storage provide an under-
representation of the storage potential in China.
In the 2018 GCCSI review of Chinese decarbonisation facilities (Global CCS
Institute 2018), two key projects are highlighted as planned operations:
• Shanxi International Energy Group CCUS, Shanxi Province.
Planned large-scale facility aiming to capture 2 Mtpa in the 2020s
from power generation.
• Shenhua Ningxia CTL, Ningxia Province. Another large-scale facility
is planned to be operational in the 2020s, aiming to capture 2 Mtpa
from the coal-to-liquids industry.
A further two projects are identified by (H. J. Liu 2017) as ‘in preparation’ for
geological storage:
• IGCC Clean Energy pilot-project in Lianyungang. Aims to capture 1
Mtpa using pre-combustion capture.
• Oxy-fuel combustion sequestration in Zhongyan Yingcheng of
Hubei. The project aims to capture 0.1 Mtpa for storage in salt rock.
If evaluations for the above projects are published, they should be included in
future updates.
(K. A. Jiang In press), provide a critique on the status of CCUS policy in China
in a recent paper, which could also be included.

Global Storage Resource Assessment – 2019 Update Appendix A – Country Assessments
Pale Blue Dot Energy (10365GLOB) Page 71 of 95
6.6 Bangladesh, India, Pakistan, and Sri Lanka
6.6.1 Summary
The GSRA 2019 update has identified CO2 storage resources for Bangladesh,
India, and Pakistan as follows:
Bangladesh
Classification CO2 storage resource (Gt)
Project and no project
CO2 storage resource (Gt)
Project specified only
Stored 0 0
Capacity 0 0
Sub-Commercial 1.13 0
Undiscovered 20.0 0
Aggregated* 21.13 0
India
Classification CO2 storage resource (Gt)
Project and no project
CO2 storage resource (Gt)
Project specified only
Stored 0 0
Capacity 0 0
Sub-Commercial 0.84 0
Undiscovered 63.3 0
Aggregated* 64.14 0
Pakistan
Classification CO2 storage resource (Gt)
Project and no project
CO2 storage resource (Gt)
Project specified only
Stored 0 0
Capacity 0 0
Sub-Commercial 1.7 0
Undiscovered 30.0 0
Aggregated* 31.7 0
* The aggregated resource represents the summed storage resource across all maturity
classes and as such should not be viewed as representative of the potential of the country.
Table 6-6. 2019 storage resource classification summary for Bangladesh, India and Pakistan
• Bangladesh has 23 sites in the 2019 Assessment: 1 saline aquifer
(Undiscovered; 20.0 Gt) and 22 gas fields (Discovered; 1.13 Gt).
• India has 15 sites in the 2019 Assessment: 11 saline aquifers
(Undiscovered; 63.3 Gt) and 4 oil and gas fields (Discovered; 0.84
Gt)
• Pakistan has 17 sites in the 2019 Assessment: 2 saline aquifers
(Undiscovered; 30 Gt), 14 gas fields and 1 site representing 56 small
oilfields (Discovered; summed resource 1.7 Gt).
• No resources in Sri Lanka were reported.
• All sites in Bangladesh, India and Pakistan are classed as
Inaccessible for both the Sub-Commercial oil and gas fields and the
Undiscovered saline aquifers due to the lack of a CCS regulatory

Global Storage Resource Assessment – 2019 Update Appendix A – Country Assessments
Pale Blue Dot Energy (10365GLOB) Page 72 of 95
framework in any of these South Asian countries. No projects are
defined.
• There are no defined storage projects in the region.

Global Storage Resource Assessment – 2019 Update Appendix A – Country Assessments
Pale Blue Dot Energy (10365GLOB) Page 73 of 95
*Note: No sites with a project specified were identified for the South Asian countries.
Figure 6-11. Above: Spread of all storage resource across SRMS classifications. Below: Split of storage resource between saline aquifers and hydrocarbon fields, both project specified and not.

Global Storage Resource Assessment – 2019 Update Appendix A – Country Assessments
Pale Blue Dot Energy (10365GLOB) Page 74 of 95
6.6.2 Resource Statement
Figure 6-12. Storage resource summary for the Indian Sub-Continent compiled in the GSRA 2019 update. Graph above is log scale and graph below is linear. Blue box highlights sites where a project has been specified. Where possible, the data have undergone due diligence checks identifying potential repeat entries to avoid double counting..
Sites with a project specified

Global Storage Resource Assessment – 2019 Update Appendix A – Country Assessments
Pale Blue Dot Energy (10365GLOB) Page 75 of 95
6.6.3 Evaluation History
Bangladesh, India, and Pakistan underwent a preliminary assessment as part
of the 2019 Assessment. A regional evaluation of the CO2 storage potential of
the Indian subcontinent was completed in 2008 by the British Geological Survey
(BGS) on behalf of the IEAGHG. Its purpose was an early stage evaluation to
gauge the potential for CO2 storage in geological reservoirs across the region. It
includes a review of all major emissions points of over 1Mt/yr. and considered
depleted oil and gas fields, saline aquifers and deep unmineable coal seams. It
excludes the potential storage resource within salt caverns and the
subcontinents extensive basalt formations in the Deccan and Raajmahal
Traps. The national storage potential of India, Pakistan, and Bangladesh all
evaluated independently. Although there is some evidence for offshore resource
potential to the north and west of Sri Lanka, no resource base has been
quantified at this time.
The methodology used in the BGS evaluation included the replacement method
for the depleted oil and gas reservoirs, but for India this has been based upon
state by state petroleum reserves figures (excluding oil already
recovered). Elsewhere many fields had statements of projected ultimate
recovery. Further challenges with data availability have resulted in reasonable
assumptions having to be made about CO2 density, water influx, gas production
and oil properties. All these factors contribute to the assessment of potential
storage resources in depleted oil and gas fields as being both "highly
provisional".
For Saline aquifer resource estimation, an analogue method has been adopted
where it is assumed that the potential CO2 storage resource potential could be
estimated as: Total potential saline aquifer storage resource potential = Area of
Basin in square kilometers x 0.5 x 0.2. This equates the CO2 storage resource
potential in Mt as 10% of the basin area in square kilometers.
6.6.4 Resource Review
Overall, it is only possible to identify two classes of quantified CO2 storage
resource potential within the region:
• Depleted oil and gas fields - these have been classified as
discovered storage resource, but also as "inaccessible" at this time
due to the absence of a CCS regulatory system within any of the
countries in the region
• Saline aquifer systems - these have been classified as undiscovered
storage resources, although it is accepted that there will be a small
number of wells drilled into these systems which establish
discoveries, the location and details of these wells are not available
within the regional assessment. Due to the absence of a CCS
regulatory framework, the resources have been classified as
‘Inaccessible’ at the time of assessment.
The regional assessment is an early and indicative assessment of storage
resources. Over 95% of the stated resource is held within very poorly defined
saline aquifers.
6.6.5 Regulatory Framework
None of the countries have developed policies or CCS-specific regulatory or
legal frameworks and only India has been evaluated under the GCCSI CCS
Readiness framework. India is classed as a high opportunity country in that it
would benefit from CCS deployment but has no system in place to encourage
this. India has a legally non-binding CO2 emissions reduction target of 20-25%

Global Storage Resource Assessment – 2019 Update Appendix A – Country Assessments
Pale Blue Dot Energy (10365GLOB) Page 76 of 95
by 2020. In its Mission Innovation submission India indicated its interest in CO2
capture and utilization (CCU) beyond EOR but there has been no significant
action from the federal government to advance its deployment.
6.6.6 Issues for the 2019 Assessment
There is currently little information available to build a true picture of the storage
potential of any of the countries in the region. Where data are available, the
depth and generally low quality of the information make assessment difficult and
so several assumptions have had to be made during resource estimation.
As a result of the low maturity of the resource estimation, there is only a single
value provided for each resource. This has been recorded as the 'Mid-Range'
estimate of resource potential. As future studies are planned in the region, effort
needs to be made to move towards generating probabilistic assessments.
6.6.7 Future Updates
Any update should be made as and when concrete, useful improvements to the
understanding of storage potential in the region become available.

Global Storage Resource Assessment – 2019 Update Appendix A – Country Assessments
Pale Blue Dot Energy (10365GLOB) Page 77 of 95
6.7 Norway
6.7.1 Summary
The GSRA 2019 update has identified a CO2 storage resource for Norway as
follows:
Classification CO2 storage resource (Gt)
Project and no project
CO2 storage resource (Gt)
Project specified only
Stored 0.019 0.019
Capacity 0.044 0.044
Sub-Commercial 56 1.4
Undiscovered 37.5 3.4
Aggregated* 93.6 4.9
* The aggregated resource represents the summed storage resource across all maturity
classes and as such should not be viewed as representative of the potential of the country.
Table 6-7. 2019 Storage resource classification summary for Norway
• There is currently a total of 42 sites at both local and regional scale,
located across 5 geological basins in the offshore sector. Most of the
Norwegian storage resource is located in the Norwegian North Sea.
• There is a total of 11 project-specified sites, the majority of which
also contain a simulation model.
• As of 2017, a total of 18 Mt of CO2 has been injected to deep
geological storage, at Sleipner (17 Mt) and Snøhvit (1 Mt).
• The Norwegian government has created strong foundations for a
CCS market in Norway, through the introduction of a high carbon tax
for fossil fuel extraction and the GHG Emission Trading Scheme.
Gaps still remain, however, in CCS-specific legislation according to
the GCCSI Legal and Regulatory Indicator Report (Global CCS
Institute 2018).

Global Storage Resource Assessment – 2019 Update Appendix A – Country Assessments
Pale Blue Dot Energy (10365GLOB) Page 78 of 95
Figure 6-13. a) Spread of storage resource in Norwegian sites across SRMS classifications, where a project has been specified. b) Spread of storage resource in all Norwegian sites across SRMS classifications; both project specified and not. c) Split of Norwegian storage resource between saline aquifers and hydrocarbon fields, both project specified and not.

Global Storage Resource Assessment – 2019 Update Appendix A – Country Assessments
Pale Blue Dot Energy (10365GLOB) Page 79 of 95
6.7.2 Resource Statement
Figure 6-14. Storage resource summary for Norway compiled in the GSRA 2019 update. Graph above is log scale and graph below is linear. Blue box highlights sites where a project has been specified. Where possible, the data have undergone due diligence checks identifying potential repeat entries to avoid double counting.
Sites with a project specified

Global Storage Resource Assessment – 2019 Update Appendix A – Country Assessments
Pale Blue Dot Energy (10365GLOB) Page 80 of 95
6.7.3 Evaluation History
The Norwegian CO2 Storage Atlas is a key document for evaluation of the
storage resource in Norway (Norwegian Petroleum Directorate 2014). It was
prepared by the Norwegian Petroleum Directorate (NPD) at the request of the
Ministry of Petroleum and Energy and forms the data source for the majority of
the Norwegian sites within this assessment. The Atlas is compiled from both
site-specific evaluation in published literature and regional evaluation by the
NPD and is composed of three regional basin atlases: the Norwegian North Sea,
the Norwegian Sea and the Barents Sea. Papers published following the release
of the Atlas were included to supplement and update the Norwegian
assessment.
Whilst Norway has a similar overall resource character to the UK, it enjoys larger
areas of undrilled potential and therefore storage resource prospectivity. It also
has operational and developing CO2 injection projects, which together creates a
spread of resource across the SPE SRMS classifications. Significant storage
resource is recognised in the numerous supergiant petroleum fields within the
Norwegian sector. However, as they have the potential to continue production
beyond 2050, the storage resources in these petroleum provinces have been
classified as discovered but inaccessible at this time.
In general, a volumetric method was adopted to estimate potential storage
resource. For a limited number of sites, a more detailed evaluation was made,
sometimes including a simulation model. Where possible, the pore volume has
been estimated using seismic and well data. Storage efficiency has been either
evaluated using a bespoke reservoir simulation model, based upon a
reasonable development plan, or sourced from a representative analogue. For
hydrocarbon fields, a fluid replacement methodology was adopted.
In the Norwegian Atlas, the maturity of a site, and the subsequent methodology
used to evaluate the storage potential of that site, is dictated by data availability.
This approach is described by the maturation pyramid, where the evaluation of
a site only moves up the pyramid and becomes more mature when more data
becomes available for the evaluation. When the site reaches a different maturity
level, a different methodology will be deployed to estimate the site's storage
resource. In Norway, the vast amount of data and experience built through the
petroleum industry allows some sites to be placed high up in the pyramid.
The maturity pyramid methodology adopted in the Atlas is only weakly mappable
to the SRMS, which uses an increase in chance of commerciality to mature a
site. Furthermore, the storage resource nomenclature within the Norwegian
Atlas contrasts with the SRMS. It defines "Prospectivity" as the potential to find
a commercially viable CO2 storage project, rather than as the potential to find
"accessible pore volume being suited to containment", as described in the
SRMS. As a result of this, structures with reservoirs already proven by wells are
held as "Prospects" rather than "Discoveries". Finally, in saline aquifers, the
presence or absence of structures is not always clear, however sites described
as “Prospects” have been considered as structures in this assessment.
No probabilistic work was reported within the Atlas.
6.7.4 Resource Review
6.7.4.1 Major Projects
In Norway, there are two commercial-scale CCS projects currently injecting CO2:
Sleipner and Snøhvit. Operated by Equinor since 1996, Sleipner was the world's
first offshore CCS facility. Natural gas produced at the site contains naturally
occurring CO2, which is separated and stored within the Utsira Formation, in the

Global Storage Resource Assessment – 2019 Update Appendix A – Country Assessments
Pale Blue Dot Energy (10365GLOB) Page 81 of 95
Norwegian North Sea. Sleipner has a stored CO2 volume of 17Mt, up until 2017
(S. S. Thibeau 2018).
Snøhvit is an LNG facility, that is similarly operated by Equinor but located in the
Barents Sea. The natural gas produced from the Snøhvit, Albatross and
Askeladd fields contains CO2 which is separated and injected into the Stø
Formation.
Both projects are referenced in the Atlas, however evaluations focus largely on
additional storage potential within their respective saline aquifers.
The Snøhvit project is evaluated in more detail in the Atlas, however at the time
of publication (2014), operations at Snøhvit has ceased due to an unexpected
and rapid pressure build-up in the Tubaen Formation. It is reported that 1 Mt of
CO2 was stored during this time (Norwegian Petroleum Directorate 2014). The
asset has since been developed in the Stø Formation, which is believed to have
greater hydraulic connectivity which should allow sufficient dissipation of
pressure. No recent publications were found in the GSRA 2019 update that
provide up-to-date stored volumes at Snøhvit, however the Atlas estimated a
mid-case storage resource of 24 Mt.
6.7.4.2 Depleted Oil & Gas Fields
The Aggregated Storage Resource within hydrocarbon fields in the Norwegian
sector is 14 Gt, where 13 Gt lies in the Norwegian North Sea and 1 Gt in the
Norwegian Sea. A small volume (0.2 Gt) lies in the Barents Sea, however as
no date for the cessation of production (CoP) was provided for these fields, the
resource has been classified as Discovered Inaccessible in this GSRA 2019
update. The fields within the Norwegian North Sea and Norwegian Sea are
either abandoned or are due to be abandoned by 2050, however no sites are
reportedly undergoing active appraisal for CO2 storage in the published
literature. As such, they have been classified as Discovered Development Not
Viable.
These data are all sourced from the Atlas, as no further publications were
identified for depleted hydrocarbon fields in this GSRA 2019 update.
6.7.4.3 Saline Aquifers
The storage resource for saline aquifers in Norway is spread across a range of
the SRMS classifications, with Aggregated Storage Resource as follows; 37.6
Gt Undiscovered, 41.7 Gt Sub-commercial, 0.044 Gt Capacity and 0.019 Gt
Stored. The Undiscovered portion is largely classified as Sequence Play, with
some sites classified as Lead where a nominal storage site was identified, or
Prospect where a drill-ready target was present. The Capacity and Stored
storage resource is from Sleipner and Snøhvit, where CO2 has already been
stored and further CO2 is licensed for injection.
The storage resource is spread across a wide range of formations, however the
majority of the storage resource identified in the GSRA 2019 update lies within
the formations: Bryne and Sandnes, Utsira and Skade, and Sognefjord Delta.
Similar to the depleted hydrocarbon fields, little has been published assessing
the storage resource of Norwegian saline aquifers since the Atlas was
published. Recent work has been focussed on the Utsira Formation and Garn
Formation, where simulation modelling has identified optimal locations for CO2
injection, across the regional aquifers (Nilsen 2015), (Lothe 2014).
6.7.5 Regulatory Framework
Norway has the highest CCS Policy-Indicator of the countries within the GCCSI
Carbon Policy Indicator Report (Global CCS Institute 2018). This is the result of
the high level of carbon tax and Greenhouse Gas Emission Trading Act

Global Storage Resource Assessment – 2019 Update Appendix A – Country Assessments
Pale Blue Dot Energy (10365GLOB) Page 82 of 95
implemented by the Norwegian government in 1991, which has facilitated the
permanent storage of CO2 at both Sleipner and Snøhvit (Norwegian Petroleum
2020). Additionally, the Norwegian government has funded several R&D
projects and facilities, including the initiation of Gassnova, a state-owned CCS
enterprise, and the Technology Centre Møngstad, an R&D facility to test CCS
technologies.
Norway has a lower rating of Band B (40/87) in the GCCSI Legal and Regulatory
Indicator Report (Global CCS Institute 2018). The rating shows that Norway has
"CCS specific laws or existing laws that are applicable across parts of the CCS
cycle".
6.7.6 Issues for the 2019 Assessment
There is a risk of double counting in the Utsira Formation between the regional,
theoretical evaluation made in the NPD Atlas and a later study that considers
injection into optimal structures within the aquifer (Nilsen 2015). In accordance
with the SRMS guidelines on aggregation of resources, the double counting
cannot be avoided as due to the different maturity of the sites against the SRMS
classification system (Society of Petroleum Engineers (SPE) 2017).
6.7.7 Future Updates
It is recommended that future publications should focus on:
• Probabilistic storage resources. It states in the SRMS, that
published volumes should provide a range of capacities, where
possible, to account for variability. The leading work in the Atlas
could be enhanced by including the range of storage resource to
highlight the uncertainty of the estimation.
• Current stored volumes for Sleipner and Snøhvit. The recent
release of 4D seismic data and simulation models over the Sleipner
field may help stimulate further research in this area.
• Published storage resource estimates for the Northern Lights
project. Following the successful drilling the Northern Lights
injection well, updates on the storage resource of the site in the
published literature would be welcome for future updates to this
study.

Global Storage Resource Assessment – 2019 Update Appendix A – Country Assessments
Pale Blue Dot Energy (10365GLOB) Page 83 of 95
6.8 United Kingdom
6.8.1 Summary
The GSRA 2019 update has identified a CO2 storage resource for the United
Kingdom as follows:
Classification CO2 storage resource (Gt)
Project and no project
CO2 storage resource (Gt)
Project specified only
Stored 0 0
Capacity 0 0
Sub-Commercial 17 2.3
Undiscovered 60.6 0
Aggregated* 77.6 2.3
* The aggregated resource represents the summed storage resource across all maturity
classes and as such should not be viewed as representative of the potential of the country.
Table 6-8. 2019 Storage resource classification summary for United Kingdom
• There is currently a total of 87 sites at both local and regional scale,
located across 5 geological basins in the offshore sector. There are
currently no evaluated storage sites onshore UK.
• There is a total of 11 project-specified sites, the majority of which
also contain a simulation model developed.
• There are numerous active projects in the UK all at different stages
of development, however as there is no record of this within the
published literature, they could not be included in the GSRA 2019
update.
• The UK Government has outlined strong ambitions for CCUS
deployment in the Clean Growth Strategy released in 2017 and has
released funding for CCS research and development.

Global Storage Resource Assessment – 2019 Update Appendix A – Country Assessments
Pale Blue Dot Energy (10365GLOB) Page 84 of 95
Figure 6-15. a) Spread of storage resource in UK sites across SRMS classifications, where a project has been specified. b) Spread of storage resource in all UK sites across SRMS classifications; both project specified and not. c) Split of UK storage resource between saline aquifers and hydrocarbon fields, both project specified and not.

Global Storage Resource Assessment – 2019 Update Appendix A – Country Assessments
Pale Blue Dot Energy (10365GLOB) Page 85 of 95
6.8.2 Resource Statement
Figure 6-16. Storage resource summary for the UK compiled in the GSRA 2019 update. Graph above is log scale and graph below is linear. Blue box highlights sites where a project has been specified. Where possible, the data have undergone due diligence checks identifying potential repeat entries to avoid double counting.
Sites with a project specified
Global Storage Resource Assessment – 2019 Update Appendix A – Country Assessments
Pale Blue Dot Energy (10365GLOB) Page 86 of 95
6.8.3 Evaluation History
The most widespread source for the estimation of CO2 storage resource within
the UK is from CO2Stored, the UK CO2Storage Evaluation Database, hosted
and under development by the British Geological Survey and The Crown Estate
and under license from the Energy Technologies Institute (ETI). The original
data in CO2Stored was developed by the UK Storage Appraisal Project
(UKSAP), which was commissioned and funded by the ETI. CO2Stored provides
an overview of CO2 storage data for over 500 potential CO2 storage sites around
offshore UK. To date the database excludes the large tracts of acreage to the
west of the Shetland Islands and in the South-Western Approaches. The East
Irish Sea is included. Unfortunately, due to the restriction of the CO2Stored
license to non-commercial use, it could not be used directly in this GSRA 2019
update. As such, the UK individual entries are restricted to sites where the
database is referenced in the published literature, including resource summaries
created by the Energy Technologies Institute (ETI). To account for this and
ensure that the storage resource for the UK is not under-represented, the
remaining storage resource not captured in individual entries, is included in the
GSRA database as four aggregated entries under the groupings: 'Sandstone
aquifers', 'Chalk aquifer's, 'Oil fields' and 'Gas fields'.
6.8.4 Resource Review
6.8.4.1 Major Projects
To date three carbon storage licenses have been, or are being, held in the UK
Continental Shelf (UKCS). These are:
1. CS001 Endurance License. Held by National Grid. Active from
November 2012 till present. Storage site for the previous White
Rose Project and now a potential target site for both the
Humberside and Teesside projects. No published updates since the
cancellation of the White Rose Project in 2015.
2. CS002 Peterhead License (Goldeneye field) held by Shell U.K.
Limited. Active between July 2013 and August 2016. License
terminated by Shell U.K. following the withdrawal of government
funding in 2015. The evaluated area is now part of the current Acorn
License.
3. CS003 Acorn License. Active from January 2018 till present. The
license combines both the Goldeneye field and ACT Acorn Storage
Site which have both been subject to extensive study during many
phases, but most recently the CCS Commercialisation Programme,
funded by the UK Government. The Acorn Project is currently in
Concept Select Phase and is due to enter FEED mid-2020. There
are currently no published evaluations of the storage resource
within the newly defined Acorn site and as such, it could not be
included in the GSRA 2019 update.
In addition to the projects with a storage license, there are also several other
industrial clusters developing around the UK, notably the HyNet Project which
is in Detailed Design and Engineering Phase 1. The project is currently
evaluating the Hamilton Gas Field as a potential storage site, amongst others,
however no details of the project could be found in the published literature so
was not included in the GSRA 2019 update. This absence of reporting for active
projects results in the notable absence of Commercial Storage Resources within
the UK. Should any of the active project publish updated evaluations of the
storage sites, they will be included in future assessments.

Global Storage Resource Assessment – 2019 Update Appendix A – Country Assessments
Pale Blue Dot Energy (10365GLOB) Page 87 of 95
6.8.4.2 Depleted Oil & Gas Fields
All oil and gas fields can be classified as Discovered due to the presence of a
proven reservoir. In the UK the majority of the hydrocarbon fields are further
classified as "Development Not Viable" due to the absence of an active appraisal
program. The two exceptions to this are the Hamilton Gas Field where the
resources are classified as "Development Unclarified" as an active appraisal is
being undertaken however no storage license is held for the site and Goldeneye,
where resources are classified as "Development on Hold" as the retraction of
government funding has caused significant delay.
It has been assumed that the UKCS hydrocarbon fields in the GSRA 2019
update will reach the end of their productive life before 2050 and therefore
become available for CO2 storage before that time, due to the maturity of the
North Sea basin.
The majority of sites have been assessed using a fluid replacement
methodology, with the exception of the sites; Goldeneye Gas Field, Viking A
Storage Site, Hewett Gas Fields Storage Site, and Hamilton Gas Field, which
have a simulation model and published results.
6.8.4.3 Saline Aquifers
The UK, like many other countries within the North Sea region, benefits from a
wealth of experience and data acquired through a well-established hydrocarbon
industry. Furthermore, the requirement for operators to share key subsurface
data through the National Data Repository, have allowed both academia and
industry to accelerate the assessment of many UK sites for CO2 storage.
Consequently, the reasonably high well density in many of the UK saline
aquifers has allowed many of the sites to be classified as Discovered.
The overwhelming majority of the discovered resource is classified as
"Development Not Viable", due to the lack of an active appraisal or evaluation
plan presented for any of the sites. The two aggregated entries for sandstones
aquifers and chalk aquifers, mentioned in 6.8.3, are all classified as
"Undiscovered Basin Play", due to the aggregated nature of the entry. It is noted
that this is not a true reflection of the maturity of the storage resource and
portions of it will undoubtedly be Discovered due to significant hydrocarbon
exploration in the North Sea. Should the licensing conditions for the CO2Stored
database change, or should evaluations be published for sites included in these
aggregations, then the resource can be classified more appropriately.
The two sites 'Endurance Bunter Closure' and 'Goldeneye Storage Site' have
been classified as "Development On Hold" following the retraction of
government funding detailed in 6.8.4.1, which has led to significant delay in the
projects.
6.8.5 Regulatory Framework
The UK has the second most highly rated country in the GCCSI Policy Indicator
Report (Global CCS Institute 2018) due to the ambitions for CCUS deployment
outlined in the Clean Growth Strategy in 2017. Additionally, there are a range
of policies which support emission performance standards and CCS research
and development projects.
6.8.6 Issues for the 2019 Assessment
Lack of commercial access to the CO2Stored database. Due to restrictions
on the database for commercial usage, the data for the UK sites was restricted
to publications that reference the database. Many of the sites in CO2Stored
could not be found in other publications, leading to the undesirable work around

Global Storage Resource Assessment – 2019 Update Appendix A – Country Assessments
Pale Blue Dot Energy (10365GLOB) Page 88 of 95
detailed in 6.8.3, to prevent significant under-representation of the storage
resource in the UK.
Lack of reporting on active projects. As detailed in 6.8.4.1.
6.8.7 Future Updates
Published evaluations for the sites currently active in the UK would be welcome
for future updates to the GSRA. This would better represent the maturity of the
storage resource associated with these projects.

Global Storage Resource Assessment – 2019 Update Appendix A – Country Assessments
Pale Blue Dot Energy (10365GLOB) Page 89 of 95
6.9 United States of America
6.9.1 Summary
The GSRA 2019 update has identified a CO2 storage resource for the United
States of America as follows:
Classification CO2 storage resource (Gt)
Project and no project
CO2 storage resource (Gt)
Project specified only
Stored 0.003 0.003
Capacity 0.004 0.004
Sub-Commercial 258 55
Undiscovered 7804 15
Aggregated* 8017 70
* The aggregated resource represents the summed storage resource across all maturity
classes and as such should not be viewed as representative of the potential of the country.
Table 6-9. 2019 Storage resource classification summary for United States of America
• Storage resource potential is present in both saline aquifers and oil
and gas fields.
• Potential storage resource has been identified in 36 US States with
12 projects and 14 regional studies included in the 2019
Assessment. High level, state-wide estimates are also provided by
the DOE Atlas V, but these have no detail in terms of individual
resource location or estimate attached.
• As of December 2019, 4.36 Mt of CO2 has been reported injected
and stored, or permitted for injection by 4 CCS projects operating in
the USA: Illinois Basin Decatur project (1Mt), Illinois: ICCS (5 Mt),
the Citronelle Project (0.1 Mt), and the Michigan Basin Niagaran
Pinnacle Reef Trend project (0.14 Mt). A significant volume of CO2
has also been injected into oilfields via EOR operations, but this
figure is not included in the SRMS.
• While the US storage resource is distributed across the Lower 48,
the regional saline aquifer studies are dominated by the northern
states within the Williston, Michigan, Illinois, Powder River, and
Denver basins. Future assessments should focus on updating with
the vast potential in other parts of the country, including California,
the southern states, the Gulf of Mexico region, and the Federal
Offshore.
• The current regulatory system is positive to CCS with recent
changes to the tax system (45Q) to incentivise both CO2-EOR and
geological storage. California leads the way with state-level credit-
based systems. Permitting for existing CCS projects provides a way-
forward for future projects.
• The DOE-funded CarbonSAFE initiative is currently funding thirteen
Phase I 'Pre-Feasibility' studies and six Phase II 'Feasibility'
programs with the aim of identifying several saline aquifer sites with
proven potential to store at least 50 Mt/site with an anticipated
injection start-date of 2026.

Global Storage Resource Assessment – 2019 Update Appendix A – Country Assessments
Pale Blue Dot Energy (10365GLOB) Page 90 of 95
Figure 6-17. a) Spread of storage resource in U.S. sites across SRMS classifications, where a project has been specified. b) Spread of storage resource in all U.S. sites across SRMS classifications; both project specified and not. c) Split of
U.S. storage resource between saline aquifers and hydrocarbon fields, both project specified and not.

Global Storage Resource Assessment – 2019 Update Appendix A – Country Assessments
Pale Blue Dot Energy (10365GLOB) Page 91 of 95
6.9.2 Resource Statement
Figure 6-18. Storage resource summary for the U.S. compiled in the GSRA 2019 update. Graph above is log scale and graph below is linear. Blue box highlights sites where a project has been specified. Where possible, the data have undergone due diligence checks identifying potential repeat entries to avoid double counting.
Sites with a project specified

Global Storage Resource Assessment – 2019 Update Appendix A – Country Assessments
Pale Blue Dot Energy (10365GLOB) Page 92 of 95
6.9.3 Evaluation History
The initial basis for the 2019 Assessment was the 2015 US and North America
Carbon Storage Atlas - fifth edition produced by the National Energy Technology
Laboratory and commissioned by the US DOE Office of Fossil Energy. The
storage information in Atlas V was developed to provide a high-level overview
of the immense CO2 storage potential of the North America region and was
intended to provide developers with a starting point for further investigation. The
Atlas considers a full range of sequestration options including oil and natural gas
reservoirs (with or without EOR), saline aquifers, deep unmineable coal seams,
unconventional organic rich shales, and basalt formations. Data and
information in the Atlas are based on input from the DOE-funded Regional
Sequestration Partnerships, research groups delivering evaluations of
sequestration potential across the USA and parts of Canada. The Atlas V
provides a state by state breakdown of potential CO2 storage resources
available in both saline formations, and oil and gas fields. These are referred to
as ‘State-wide Evaluations’ for both saline aquifers and petroleum fields to
highlight the fact that very little is known about the origin and geographic location
of the data presented. In addition, the Atlas delivers short case studies on the
major evaluation and demonstration projects taking place across North America
between 2005 and 2015 which points to the detail that is available but remains
unpublished.
The State-wide saline aquifer evaluations have been further broken down into
regional studies carried out by the Regional Partnerships. These are generally
presented as estimates of storage resource potential at the sequence play level
for a geological basin and, as such often cross state or as in the case of the
Cambro-Ord Basal Sand, national boundaries. In such cases, it has been
assumed that the regional studies by the partnerships represent the summed
resource reported at the state level by the Atlas V and so the State-wide
evaluation for those states is nulled.
In the 2019 Assessment, the demonstration project sites identified from the Atlas
V were reviewed and updated, where possible, to populate the SRMS database.
The nature of the Atlas V has presented some challenges for the storage
resource classification due to its extensive scope, but high-level overview
approach; the data collated by the 2019 Assessment is in no way intended as a
substitute for site-specific characterisation, testing and assessment.
The calculation methods used to assess resource potential are essentially
volumetric methodologies for the State-wide assessments, with local variations
at the local/Project-scale provided where information is available.
For oil and gas fields, Potential CO2 Storage Resources have been estimated
by the replacement method where suitable records are available and the
volumetric method where production and injection records are unavailable.
6.9.4 Resource Review
Despite the volume, quality, and progression of CO2 storage in North America,
the current classification of potential storage resource is significantly limited due
to the mismatch between the lack of detail available and the very large resource
base, particularly for saline aquifers. The approach taken here is to adopt a
minimum maturity level approach to classification and only elevate resources to
more mature classes when there is both evidence and quantification
available. This has led to an understatement of the maturity of the resource
potential with 97% held within the Undiscovered: Prospective maturity class; the
USA represents a strong candidate for re-classification.

Global Storage Resource Assessment – 2019 Update Appendix A – Country Assessments
Pale Blue Dot Energy (10365GLOB) Page 93 of 95
The Sub-Commercial resource class contains both the oil and gas fields (203
Gt, classified as 'Inaccessible' at this stage due a lack of knowledge on field
accessibility dates), and those storage projects (55 Gt), classified as
'Development Not Viable) for which detailed data are not published, or where
their current activity status is on-hold, cancelled, or unknown.
6.9.4.1 Major Projects
The USA has amassed a huge amount of information through the Regional
Carbon Sequestration Partnerships. These have informed the location and
potential scale of storage through high level screening studies through to the
selection of pilot projects. The US DOE is now developing the next generation
of large-scale, integrated CCS projects: the CarbonSAFE Initiative.
At the time of assessment, the only projects reporting stored CO2 in the
subsurface (non-CO2 EOR) are the Alabama Citronelle Project (0.114 Mt), the
Illinois IBDP, injecting 1Mt over 3 years, and the IL: ICCS project, injecting up to
5Mt over 3 years.
6.9.4.2 Depleted Oil & Gas Fields
While there is a large inventory of CO2 injection into commercial oil properties
for enhanced oil recovery, there are very few studies which have evaluated the
injection of CO2 into depleted oil and gas fields for carbon storage without an
uplift in hydrocarbon production. The DOE Atlas V does however report large
resource estimates in oil and gas fields for some states, e.g., Texas: 17180 Mt,
West Virginia: 9840 Mt, New Mexico: 9710 Mt, Louisiana: 5700 Mt, and
California: 4850 Mt, but the source evaluations for these figures are unknown.
The National Energy Technology Laboratory (NETL) has indicated that an
additional demand of 10 to 45 Gt CO2 for enhanced oil recovery operations may
exist across the Lower 48 states, Alaska and Offshore Gulf of Mexico. This could
significantly increase the available storage potential of depleted oil fields but a
more detailed breakdown of where and which fields could be targets for CO2
storage is needed, and a mechanism for including this resource into the SRMS.
6.9.4.3 Saline Aquifers
The storage resource in the USA is currently dominated by the state-wide (Basin
Play) saline aquifer resource estimates provided by the DOE Atlas (7803 Gt),
and regional studies (e.g. COSS (Basal Sand), and the Lower Cretaceous and
Mississippian aquifers; 416 Gt) reported by the DOE Regional Partnerships.
These regional estimates are assigned Undiscovered: Sequence Play status
due to the immense scale of the aquifers and the lack of published detail which
would move them into the 'Discovered' resource category. The scale of this
resource suggests that the USA 'Discovered' portfolio is heavily under-
estimated.
The 2019 Assessment focused the PCOR partnership studies which cover
Montana, North and South Dakota, NW Nebraska, and NE Wyoming and focus
on the Williston, Powder River and Denver basins. As discussed earlier (Section
6.3.4.2: Application of SRMS to North America), this region has required some
careful treatment to avoid double counting. Those states wholly covered by the
PCOR study area (MT, ND, SD) have had the State-wide saline aquifer
evaluation nulled in the database to avoid double counting, however, there is a
mismatch between the summed state-wide evaluations for these three states,
and the summed regional sequence play resource estimates reported. This is
likely to be at least partly a result of re-calculation using a different storage
efficiency factor by the DOE before incorporation into the Atlas, making direct
comparison of reported data difficult.

Global Storage Resource Assessment – 2019 Update Appendix A – Country Assessments
Pale Blue Dot Energy (10365GLOB) Page 94 of 95
The state-wide saline aquifer evaluations in other areas of the USA point to
extremely large, gigatonne-scale, potential storage resources, for example,
Texas: 1505.8 Gt, California: 1311.1 Gt, Louisiana: 734.6 Gt, Wyoming: 550.3
Gt, Mississippi: 459.2 Gt, and Alabama: 304.1 Gt. These regions require further
evaluation to breakdown the resource for proper assessment against the SRMS.
Future evaluations should also work towards validating, if appropriate, such
large resource estimates.
6.9.5 Regulatory Framework
According to the GCCSI CCS Readiness Index 2018 (GCSSI, 2018), the USA
ranks in the highest category, second only to Canada, indicating that, as a
country the USA is well placed to enable CCS deployment, though long term
investment and commitment to CCS. Positive regulatory developments include
a 2018 revision to the 45Q CCS tax incentive increasing the tax credit for
dedicated geological storage to $22.66/ton (increasing linearly to $50/ton by
2026), and incorporation of a CCS Protocol into the California Low Carbon Fuel
Standard (LCFS; a credit-based emissions reduction system). LCFS can also
be stacked with 45Q. US states are looking to simplify CCS guidelines and
provide regulatory clarity to help enable CCS deployment (Beck, 2019).
However, the USA also scores maximum points on the GCCSI Inherent CCS
Interest as a nation which relies heavily on fossil fuels and therefore is most
likely to have a need for a robust CCS policy to achieve any future deep
emissions reduction targets.
6.9.6 Issues for the 2019 Assessment
The 2019 Assessment recognises that the resource statement significantly
understates the Sub-Commercial storage resource within the USA saline aquifer
systems due to the lack of detail on discovery status. The expectation is that
there are large tracts of saline aquifer that should be considered as discovered
resource. Sub-Commercial storage resources are classified at this time as
"Development Not Viable" due to the lack of information on this portfolio. The
classification status of the commercial and active projects could also be
improved through achieving more clarity regarding the progression and status
of pilot projects with many projects only reporting very limited consents for
injection at this time.
Several large, commercial-scale carbon capture facilities have either captured
anthropogenic CO2, or have commenced operations, however most are
delivering to EOR operations. Large-scale capture and geological storage
operations have not yet started-up in the USA. Future opportunities exist with
the CarbonSAFE Initiative – see 'Future Updates' below.
6.9.7 Future Updates
• The USA is expected to deliver several projects into the CCS pipeline
in the next 5 years:
• IL: ICCS Project: this project follows (but is administratively
separate to) the pilot IBDP project in Decatur, Illinois. CO2 injection
and monitoring continues through 2020. The final injection volume
needs to be updated when it becomes available.
• CarbonSAFE Initiative (the Carbon Storage Assurance Facility
Enterprise) is a DOE-funded program focused on the development
of geological storage sites with the potential to store at least 50 Mt
CO2. The timeframe for deployment is 2025-2035. Currently there
are 13 projects at the 'pre-feasibility' stage and 6 being funded to
better establish the 'feasibility' of a project. The funding cycle for
many of these ends in during 2020-2021 and so results should be

Global Storage Resource Assessment – 2019 Update Appendix A – Country Assessments
Pale Blue Dot Energy (10365GLOB) Page 95 of 95
available for update in the next two assessment cycles. It is
anticipated that the projects which succeed at the 'Feasibility' stage
will be the major projects with the best chance of progressing to the
FEED study stage and onward to project commerciality.
• Gulf Coast Offshore opportunity: a key area which is under-
represented in the current SRMS database is the offshore zone and
the offshore Gulf Coast. The region is represented by two Pre-
Feasibility CarbonSAFE projects, but any future country update
should include published reviews of the offshore potential.