Embed Size (px)
Citation preview

Global Steel Trade Monitor
Quick Reference Guide
1
This system is optimized for the latest version of Google Chrome and may not be compatible with other browsers.
Summary
The modernized, interactive Global Steel Trade Monitor (GSTM) has many enhanced capabilities and advanced
analytic features. Specifically, the new graphics in the interactive GSTM allow users to visualize steel trade data from
the world’s top 20 steel importing and exporting countries in a variety of ways.
The data can be viewed online through graphs and a map and can also be downloaded for individual, customized analysis.
This quick reference guide describes:
1. How to navigate and customize the graphic displays of the new dashboard for annual and year-to-date data for exports and imports;
2. How users can filter and disaggregate underlying data;
3. How users can then develop customized visuals of the data based on search parameters; and
4. How users can export data from the GSTM for further individual analysis.
The developments in the GSTM and interactive comparison dashboard will allow users to conduct customized, in-depth analysis of changing trade patterns and product trends for global imports and exports of steel mill products.
Navigation of the Monitor The new GSTM is comprised of three tabs located at the bottom of the landing page of the dashboard. The monitor provides data at the aggregate product category level (5 product categories) for the top 20 largest steel importing and exporting countries and the European Union by reporting country and trade partner. The data is updated regularly when countries release their official trade statistics. Here is a visual example for users to reference on how to navigate these tabs:

Global Steel Trade Monitor
Quick Reference Guide
2
There are three of these tabs, each of which includes annual data:
• “GSTM”: This tab presents two line graphs. The graph on the left shows annual global imports/exports
of aggregate steel categories (represented by the orange line) and the measures from selected partner and reporting countries. The graph on the right presents the same data for the year-to-date data. Hovering the cursor over each point on a line graph displays a tooltip that shows the measure of steel imported from each country, in a given year.
• “GSTM Comparison”: This tab displays six bar charts. The first graph shows the total measure of
steel traded annually and year-to-date between a reporting country and its trade partner, while the
remaining five graphs display the measure of different steel product categories traded. This tab can
also be used to compare the yearly measure of imports and exports side-by-side of the total and five
steel categories.
• “Map”: This tab offers geographic data for the share of product categories imported or exported to each country, in a given year or year-to-date. The size of the pie charts indicates the relative amounts of steel traded by a country, and each color represents a steel category. Hovering the cursor over each slice in one of the various pie charts displays a tooltip that shows the product category and measure amount traded in a given country.

Global Steel Trade Monitor
Quick Reference Guide
3
How to Filter and View Disaggregated/Underlying Data
Each tab presents default settings at the top of the page. This allows users to customize their view by using filters to disaggregate the underlying data based on the trade flow, reporting and partner countries, product categories, and data measures of interest (i.e. volume or value). In many of the filters, the user can choose multiple options for viewing the underlying data for more in-depth analysis of steel trade trends.
In the default setting, the dashboard shows all steel imported by volume into the United States from the world, Canada, and Mexico. To filter and disaggregate the data, the user should change the default settings at the top of the page, which changes the views of the subsequent graphs.
These filters, from left to right, include:
• Trade Flow: Users can change this filter to view either import or export data.
• Reporting Country: This filter allows users to view different reporting countries by selecting a country of interest.
• Partner Country: This filter provides a drop-down menu for the user to select various or all trade partner countries of interest.
• Product Category: This also provides a drop-down menu for the user to select various or all steel product categories.
• Select Unit of Measure: This allows the user to change the measure used for presenting the dataset. The default is to show volume, in metric tons.
o This drop-down allows users to select “Quantity in Metric Tons” or “Value in U.S. Dollars.” o Please note that a metric ton is 1,000 kilograms, or approximately 0.907 net tons.

Global Steel Trade Monitor
Quick Reference Guide
4
To return to the default settings, the user may change the filters individually or click on the “reset filters” button.
Filtering Individual Charts and Maps
• In the “GSTM Comparison” tab, the default view is in Other Comparisons. This comparison displays the
measure of either imports or exports of steel mill products in aggregate and by product category (i.e., Flat, Long, Pipe & Tube, Semi-Finished, and Stainless).
• Alternatively, select Compare Import vs Export to view import and export data for each product category side-by-side.

Global Steel Trade Monitor
Quick Reference Guide
5
For the map: The map geographically displays trade data. Here, the size of the bubbles represents the measure being displayed (for example, volume of imports) and each slice of the pie chart represents a category type of broad steel to or from each country.
• To zoom in and out, click on the “positive/negative signs” at the top right corner of the map.
Global Steel Trade Monitor
Quick Reference Guide
6
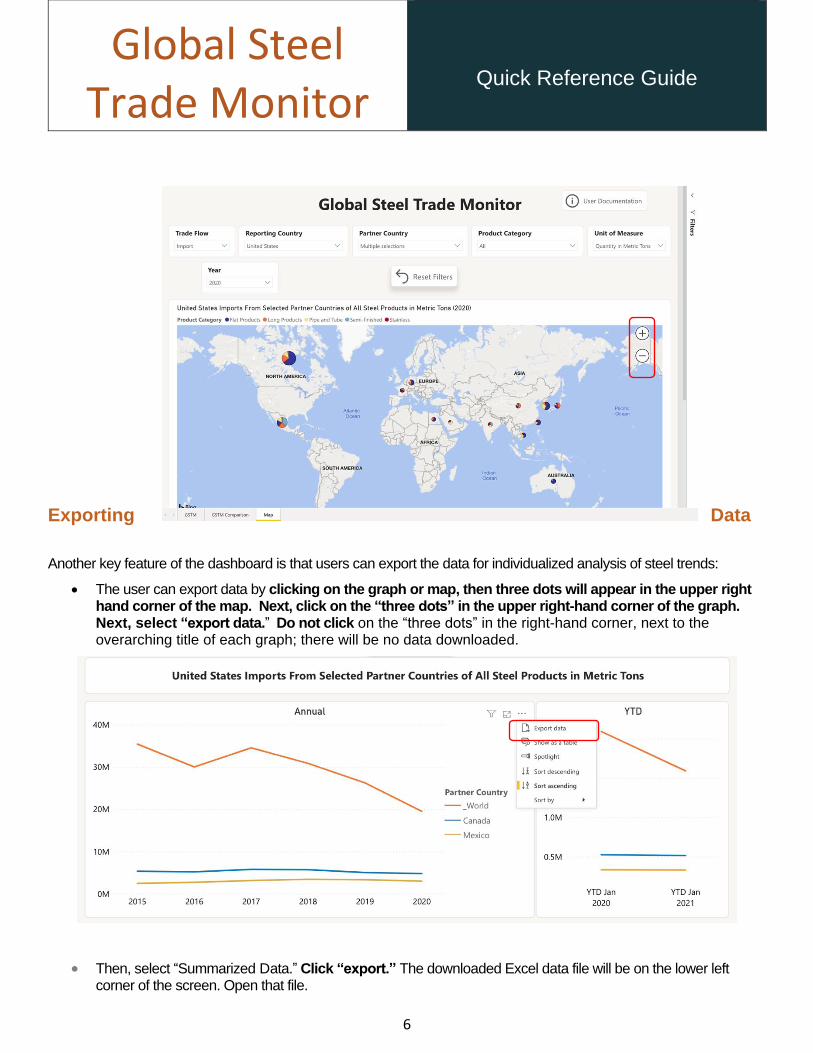
Exporting Data
Another key feature of the dashboard is that users can export the data for individualized analysis of steel trends:
• The user can export data by clicking on the graph or map, then three dots will appear in the upper right hand corner of the map. Next, click on the “three dots” in the upper right-hand corner of the graph. Next, select “export data.” Do not click on the “three dots” in the right-hand corner, next to the overarching title of each graph; there will be no data downloaded.
• Then, select “Summarized Data.” Click “export.” The downloaded Excel data file will be on the lower left corner of the screen. Open that file.

Global Steel Trade Monitor
Quick Reference Guide
7
Using a Pivot Table to Organize Data
Pivot Tables are a useful means of organizing data for interpretation, once it has been exported to your computer:
• Open the exported data file, now on your computer. Once you have opened the file, delete the first two rows of the sheet.
• With the cursor in the data table, click on the Insert tab and select Pivot Table.

Global Steel Trade Monitor
Quick Reference Guide
8
• When the popup below appears, select where you want the pivot table to be placed (either the default of a new worksheet or existing worksheet) and then click ok.
• Drag and drop the concepts you want from in the table (from the top panel to the bottom panel), by columns,
rows, and values. You can also right click on the variable in the top of the field view and select where to place it.

Global Steel Trade Monitor
Quick Reference Guide
9
• Here is a link to Microsoft’s instructions on how to get started using Pivot Tables: https://support.microsoft.com/en-us/office/video-create-a-pivottable-and-analyze-your-data-7810597d-0837-41f7-9699-5911aa282760
Printing Tables and Graphs
Tables, graphs, and other graphics in the monitor can be printed or screenshotted as follows:
• Once you have the desired filters in place, select “focus mode” in the top right of the graph or table. This
spotlights the graphic/table, expanding it to cover the full screen. You can then use any screen capture method,
including using the snipping tool or screenshotting, to save the image.
o For Windows users: to use the snipping tool, click on “New” and point and drag your mouse to select
the area you want to screenshot. Then save the image or copy and paste into your desired software,
like a Word document.
o For Mac Users: click “Command” + “Shift” + “4” and select the area you would like to screenshot, to
save an image of the chart or other graphic.

Global Steel Trade Monitor
Quick Reference Guide
10
• This is what the chart looks like in focus mode:
• In order to exit focus mode, click “Back to Report” in the upper left-hand corner of the display.

Global Steel Trade Monitor
Quick Reference Guide
11
• Once you have saved this image to your computer, you may open it using your preferred viewing
software and print it as you would another image.
Support
Check out the FAQs, Instructional Videos, and User Guides at https://www.trade.gov/steel. Forward
all questions to [email protected].