Embed Size (px)
Citation preview
07/06/2018
1
*Global Social Indicators• HDI (Human Development Index )
• IHDI (Inequality Adjusted HDI)
• PHDI (Perceived HDI - Subjective)
• MPI (Multidimensional Poverty Index )
• MDGs (8 Millenium Development Goals)
• SDGs (17 Sustainable Development Goals)– International Poverty Lines (1,9 U$S a day PPP), Shared
Prosperity (Bottom 40%), My World (Subjective Priorities)
• Happiness and Well-Being (Gallup World Poll)
– Beyond GDP & Better Lives (OECD)
• Expert Commission ((Mis)Measuring Our Lives)
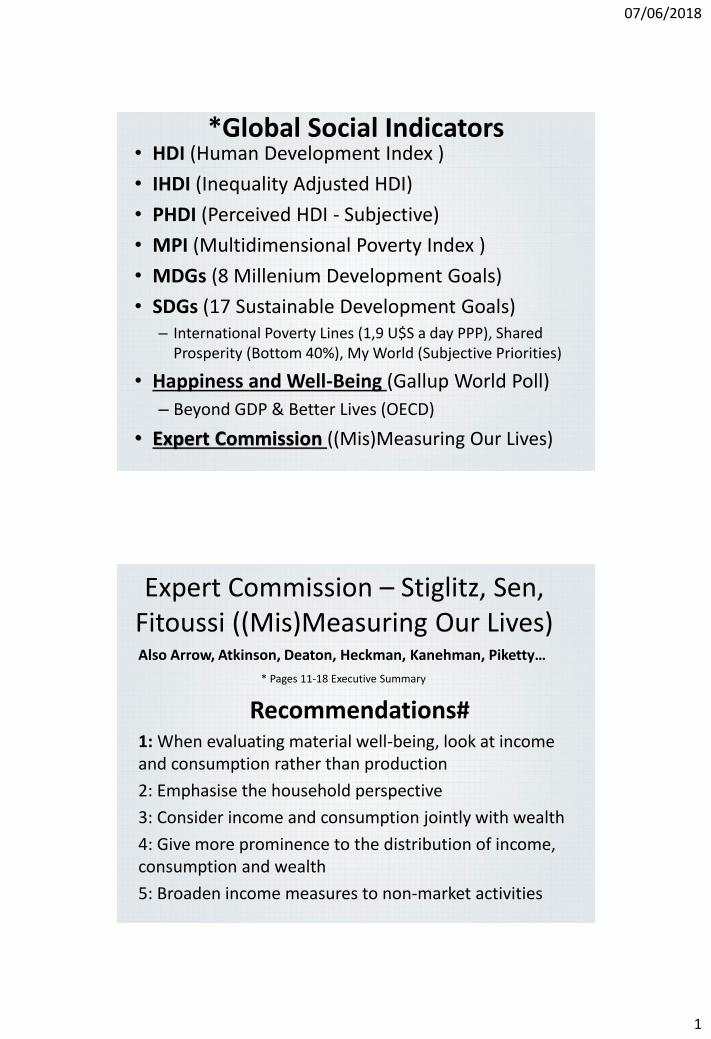
Expert Commission – Stiglitz, Sen, Fitoussi ((Mis)Measuring Our Lives)Also Arrow, Atkinson, Deaton, Heckman, Kanehman, Piketty…
Recommendations#1: When evaluating material well-being, look at income and consumption rather than production
2: Emphasise the household perspective
3: Consider income and consumption jointly with wealth
4: Give more prominence to the distribution of income, consumption and wealth
5: Broaden income measures to non-market activities
* Pages 11-18 Executive Summary
07/06/2018
2
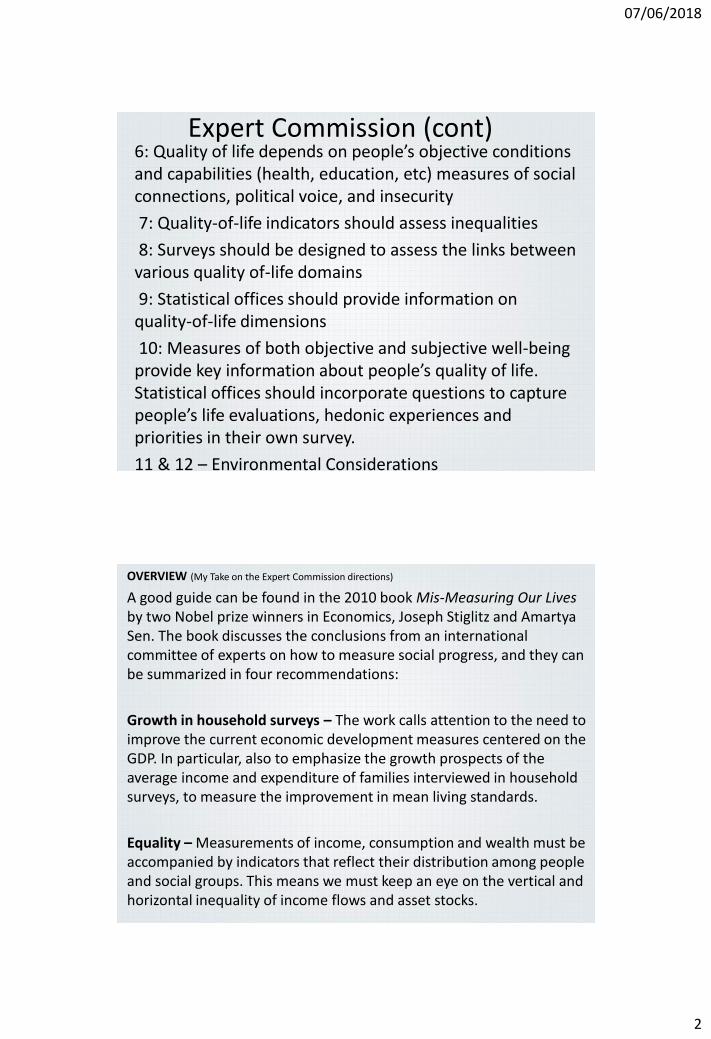
Expert Commission (cont)6: Quality of life depends on people’s objective conditions and capabilities (health, education, etc) measures of social connections, political voice, and insecurity
7: Quality-of-life indicators should assess inequalities
8: Surveys should be designed to assess the links between various quality of-life domains
9: Statistical offices should provide information on quality-of-life dimensions
10: Measures of both objective and subjective well-being provide key information about people’s quality of life. Statistical offices should incorporate questions to capture people’s life evaluations, hedonic experiences and priorities in their own survey.
11 & 12 – Environmental Considerations
OVERVIEW (My Take on the Expert Commission directions)
A good guide can be found in the 2010 book Mis-Measuring Our Lives by two Nobel prize winners in Economics, Joseph Stiglitz and Amartya Sen. The book discusses the conclusions from an international committee of experts on how to measure social progress, and they can be summarized in four recommendations:
Growth in household surveys – The work calls attention to the need to improve the current economic development measures centered on the GDP. In particular, also to emphasize the growth prospects of the average income and expenditure of families interviewed in household surveys, to measure the improvement in mean living standards.
Equality – Measurements of income, consumption and wealth must be accompanied by indicators that reflect their distribution among people and social groups. This means we must keep an eye on the vertical and horizontal inequality of income flows and asset stocks.
07/06/2018
3
• Sustainability – To consider asset stocks such as, for example,environmental attributes to incorporate the sustainability ofperformance indicators as time goes by, in other wordswhether current welfare levels can continue for futuregenerations. The different assets inventories collected by thesurveys and, especially, education and housing to analyze thestability of labor earnings and living standards.
• Perceptions – Lastly, the conjugation of objective andsubjective well-being measurements by using questionsraised in opinion polls relating to the assessment of theirlives is designed to obtain a more realistic view of the qualityof life in different countries. In other words, it is not enoughto objectively improve our lives, but it is also necessary forpeople to recognize this development. Here, we use as abenchmark of subjective indicators, measurements ofhappiness or life satisfaction that has become moreprominent in the recent economic literature.
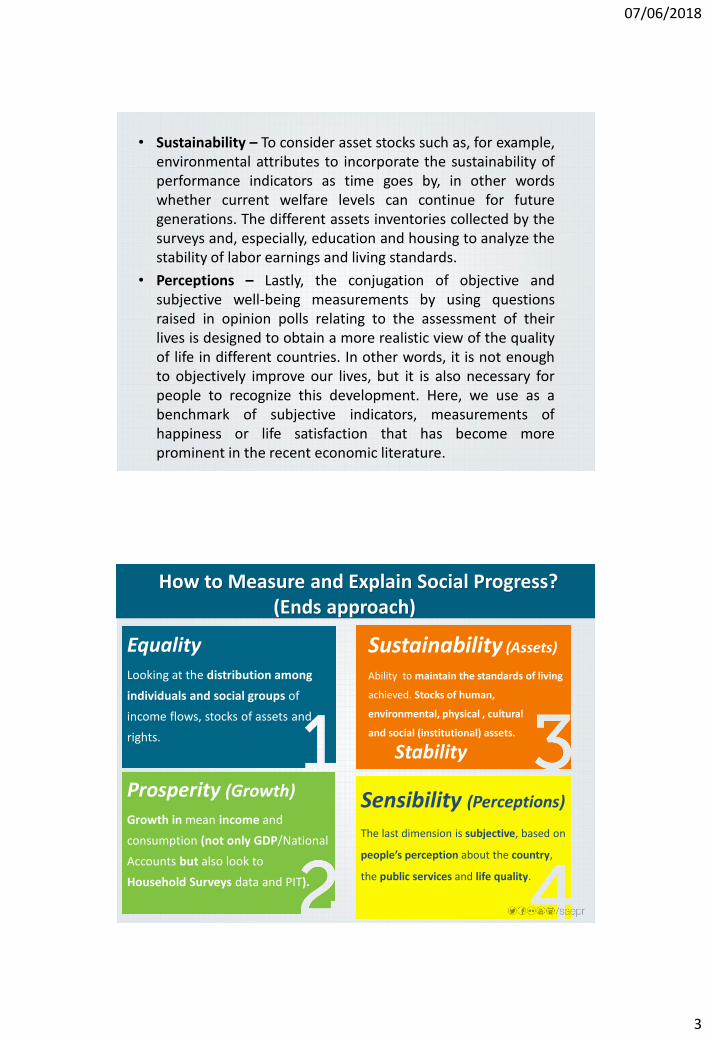
EqualityLooking at the distribution among
individuals and social groups of
income flows, stocks of assets and
rights.
Sustainability (Assets)
Ability to maintain the standards of living
achieved. Stocks of human,
environmental, physical , cultural
and social (institutional) assets.
Prosperity (Growth)
Growth in mean income and
consumption (not only GDP/National
Accounts but also look to
Household Surveys data and PIT).
Sensibility (Perceptions)
The last dimension is subjective, based on
people’s perception about the country,
the public services and life quality.
How to Measure and Explain Social Progress? (Ends approach)
Stability
07/06/2018
4
Felicidade Futura ( 2015)
2.8 - 4
4 - 5.19
5.19 - 6.39
6.39 - 7.58
7.58 - 8.78
No Data
Source: Gallup World Poll microdata
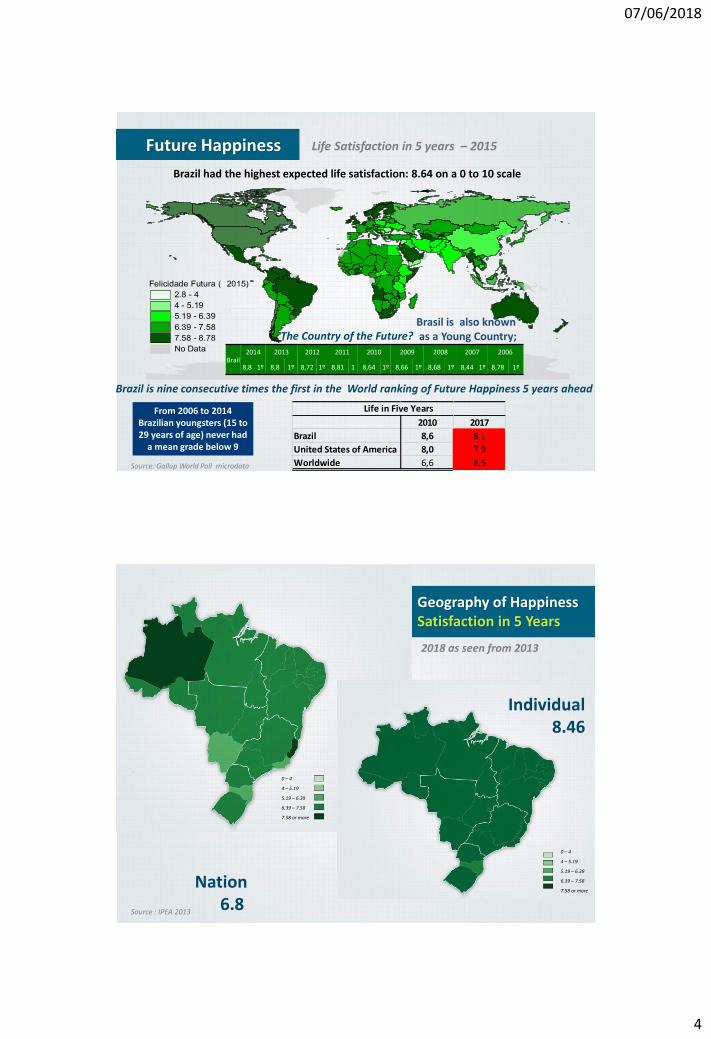
Future Happiness Life Satisfaction in 5 years – 2015
Brazil had the highest expected life satisfaction: 8.64 on a 0 to 10 scale
Brazil is nine consecutive times the first in the World ranking of Future Happiness 5 years ahead
The Country of the Future?
Brail2014 2013 2012 2011 2010 2009 2008 2007 2006
8,8 1º 8,8 1º 8,72 1º 8,81 1 8,64 1º 8,66 1º 8,68 1º 8,44 1º 8,78 1º
2010 2017
Brazil 8,6 8,1
United States of America 8,0 7,9
Worldwide 6,6 6,5
Life in Five YearsFrom 2006 to 2014 Brazilian youngsters (15 to29 years of age) never had
a mean grade below 9
Brasil is also knownas a Young Country;
Nation6.8
Source : IPEA 2013
Geography of HappinessSatisfaction in 5 Years
2018 as seen from 2013
0 – 4
4 – 5.19
5.19 – 6.39
6.39 – 7.58
7.58 or more
0 – 4
4 – 5.19
5.19 – 6.39
6.39 – 7.58
7.58 or more
Individual8.46
07/06/2018
5
Source: Gallup World Poll 2006 microdata
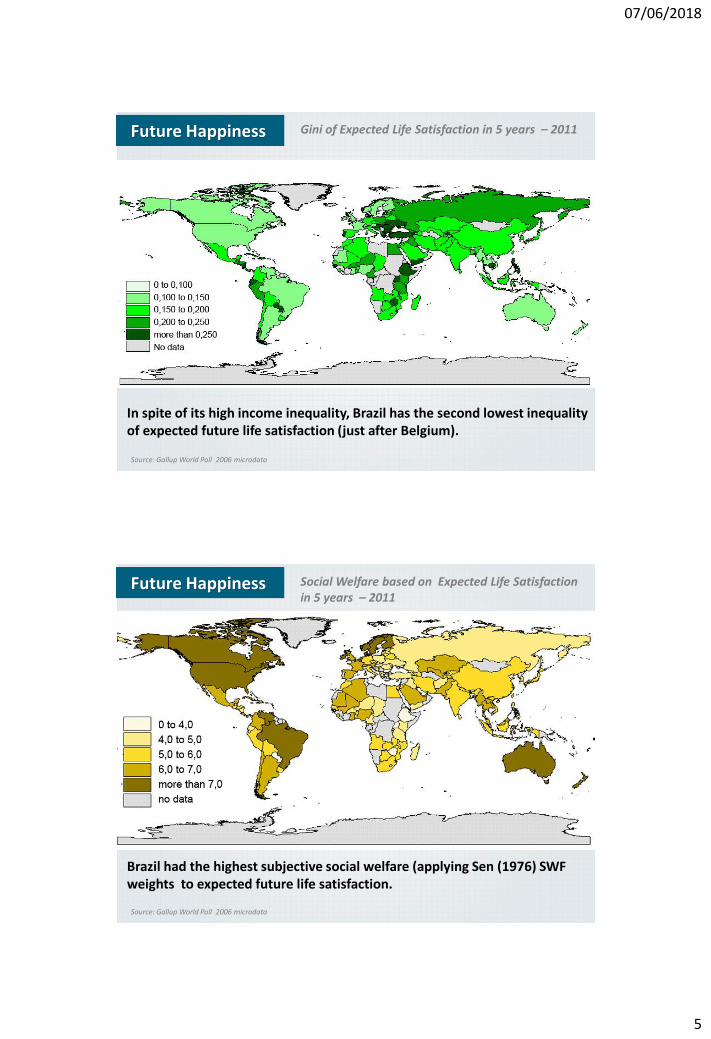
Future Happiness Gini of Expected Life Satisfaction in 5 years – 2011
In spite of its high income inequality, Brazil has the second lowest inequality of expected future life satisfaction (just after Belgium).
Source: Gallup World Poll 2006 microdata
Future Happiness Social Welfare based on Expected Life Satisfactionin 5 years – 2011
Brazil had the highest subjective social welfare (applying Sen (1976) SWF weights to expected future life satisfaction.
07/06/2018
6
Fonte: SAE a partir dos microdados da PNAD/IBGE
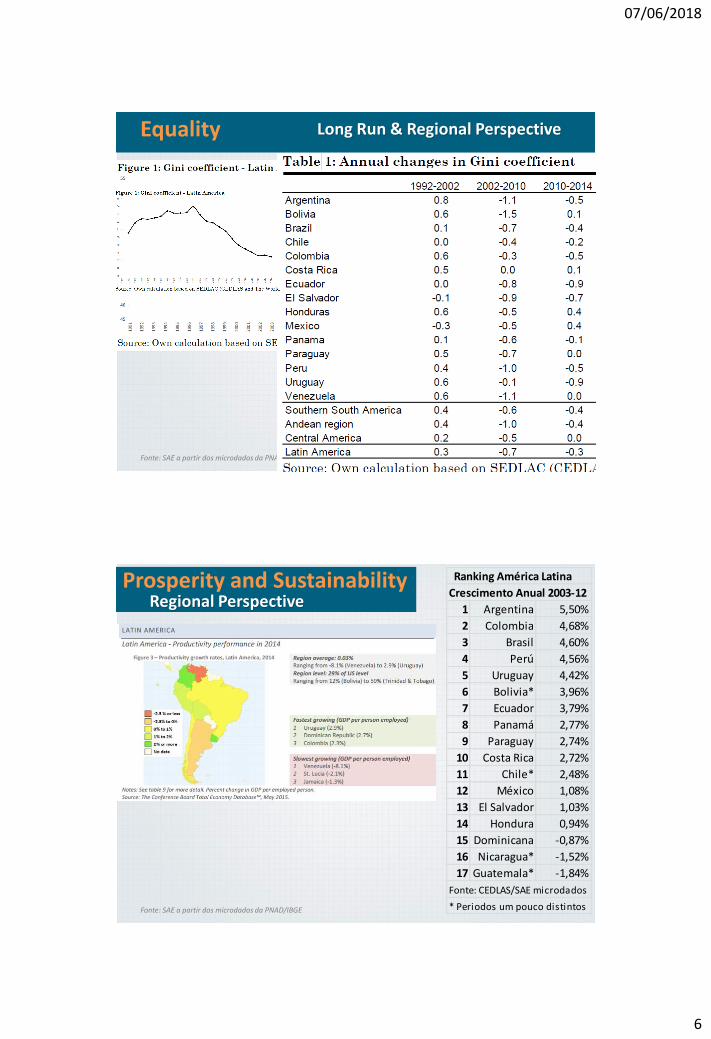
Long Run & Regional PerspectiveEquality
Fonte: SAE a partir dos microdados da PNAD/IBGE
Ranking América Latina
Crescimento Anual 2003-12
1 Argentina 5,50%
2 Colombia 4,68%
3 Brasil 4,60%
4 Perú 4,56%
5 Uruguay 4,42%
6 Bolivia* 3,96%
7 Ecuador 3,79%
8 Panamá 2,77%
9 Paraguay 2,74%
10 Costa Rica 2,72%
11 Chile* 2,48%
12 México 1,08%
13 El Salvador 1,03%
14 Hondura 0,94%
15Rep. Dominicana -0,87%
16 Nicaragua* -1,52%
17 Guatemala* -1,84%
Fonte: CEDLAS/SAE microdados
* Periodos um pouco distintos
Regional PerspectiveProsperity and Sustainability
07/06/2018
7
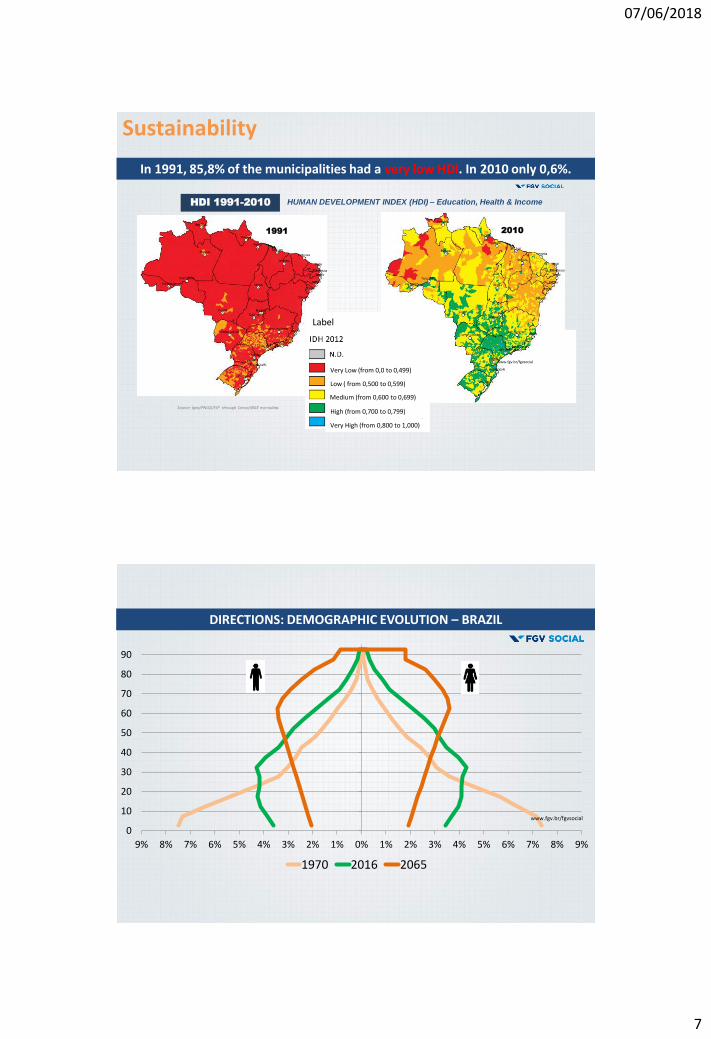
HUMAN DEVELOPMENT INDEX (HDI) – Education, Health & IncomeHDI 1991-2010
www.fgv.br/fgvsocial
Source: Ipea/PNUD/FJP through Censo/IBGE microdata.
20101991
In 1991, 85,8% of the municipalities had a very low HDI. In 2010 only 0,6%.
Label
Very High (from 0,800 to 1,000)
Very Low (from 0,0 to 0,499)
Low ( from 0,500 to 0,599)
Medium (from 0,600 to 0,699)
High (from 0,700 to 0,799)
Sustainability
0
10
20
30
40
50
60
70
80
90
9% 8% 7% 6% 5% 4% 3% 2% 1% 0% 1% 2% 3% 4% 5% 6% 7% 8% 9%
1970 2016 2065
DIRECTIONS: DEMOGRAPHIC EVOLUTION – BRAZIL
www.fgv.br/fgvsocial
07/06/2018
8
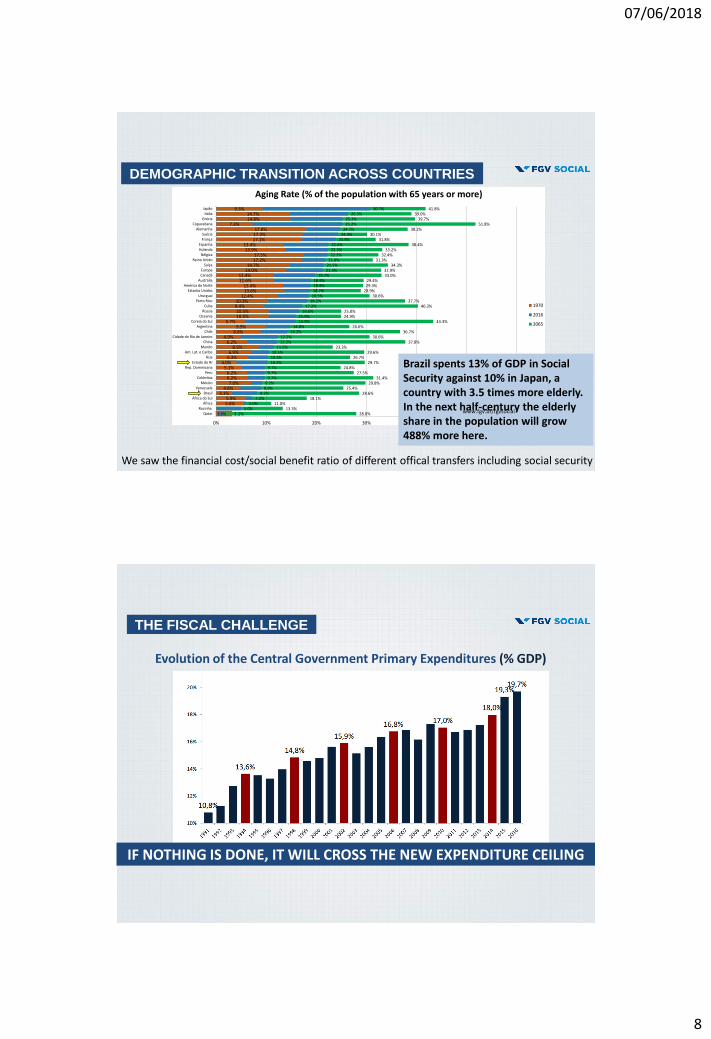
DEMOGRAPHIC TRANSITION ACROSS COUNTRIES
28.0%13.3%
11.0%18.1%
28.6%25.4%
29.8%31.4%
27.5%24.8%
29.7%26.7%
29.6%23.3%
37.8%30.6%
36.7%26.6%
43.3%24.9%25.0%
40.3%37.7%
30.6%28.9%
29.3%29.4%
33.0%32.9%
34.3%31.3%
32.4%33.2%
38.4%31.8%
30.1%38.2%
51.8%39.7%
39.0%41.8%
1.5%5.0%
6.0%7.2%
8.2%8.9%9.2%
9.7%9.7%9.7%
10.2%10.3%10.5%
11.5%12.2%12.2%
14.2%14.8%
15.9%15.9%
16.6%17.2%
18.2%18.5%18.7%18.8%18.9%
19.7%21.3%21.5%21.8%
22.2%22.3%22.4%
23.9%24.3%24.7%
25.2%25.2%
26.3%30.7%
3.1%
5.6%5.9%
3.1%4.8%
7.0%6.2%6.2%
5.1%4.0%
6.3%6.9%
8.5%6.2%
4.9%8.8%
9.9%5.7%
10.5%10.5%
9.4%10.3%
12.4%13.6%13.4%
11.6%11.4%
14.0%14.7%
17.2%17.5%
13.9%13.4%
17.1%17.3%17.8%
7.3%14.8%14.7%
9.3%
0% 10% 20% 30% 40% 50% 60%
QatarRocinha
ÁfricaÁfrica do Sul
BrasilVenezuela
MéxicoColômbia
PeruRep. Dominicana
Estado do RJÁsia
Am. Lat. e CaribeMundo
ChinaCidade do Rio de Janeiro
ChileArgentina
Coreia do SulOceania
RússiaCuba
Porto RicoUrurguai
Estados UnidosAmérica do Norte
AustráliaCanadáEuropa
SuíçaReino Unido
BélgicaHolandaEspanha
FrançaSuécia
AlemanhaCopacabana
GréciaItália
Japão
Taxas de envelhecimento (% da população com 65 anos ou mais)
1970
2016
2065
Brazil spents 13% of GDP in Social Security against 10% in Japan, a country with 3.5 times more elderly. In the next half-century the elderlyshare in the population will grow488% more here.
www.fgv.br/fgvsocial
Aging Rate (% of the population with 65 years or more)
We saw the financial cost/social benefit ratio of different offical transfers including social security
THE FISCAL CHALLENGE
Evolution of the Central Government Primary Expenditures (% GDP)
IF NOTHING IS DONE, IT WILL CROSS THE NEW EXPENDITURE CEILING
07/06/2018
9
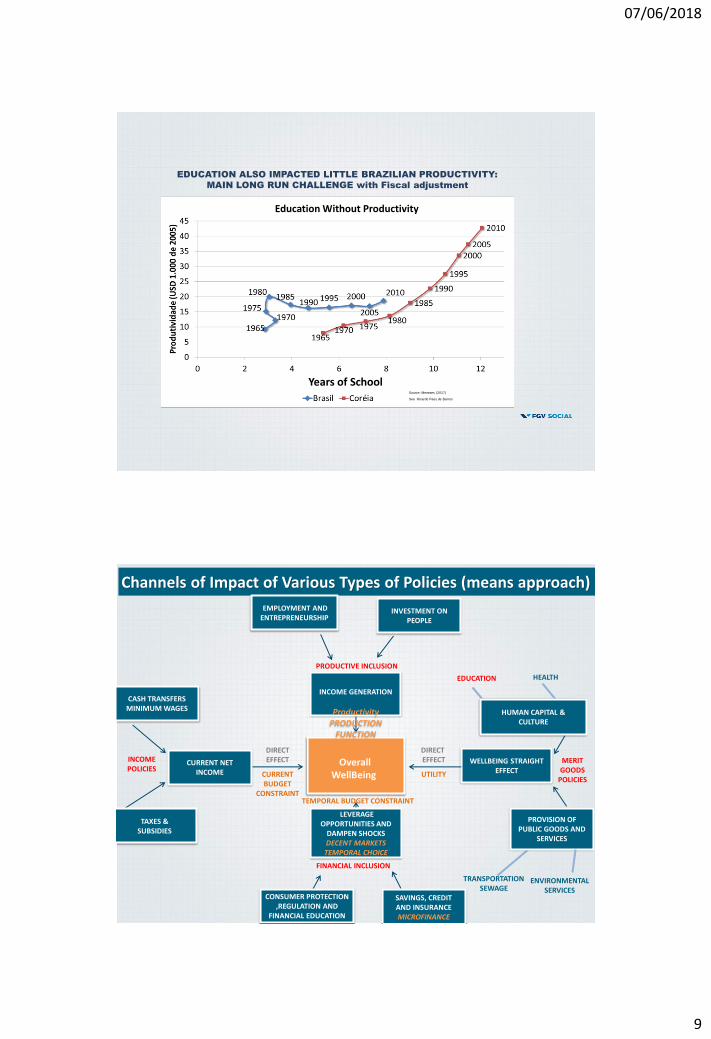
EDUCATION ALSO IMPACTED LITTLE BRAZILIAN PRODUCTIVITY:
MAIN LONG RUN CHALLENGE with Fiscal adjustment
Education Without Productivity
Source: Menezes (2017)
See Ricardo Paes de Barros
Years of School
Channels of Impact of Various Types of Policies (means approach)
OverallWellBeing
INVESTMENT ON PEOPLE
WELLBEING STRAIGHT EFFECT
PROVISION OF PUBLIC GOODS AND
SERVICES
EMPLOYMENT AND ENTREPRENEURSHIP
CASH TRANSFERSMINIMUM WAGES
CURRENT NET INCOME
TAXES &SUBSIDIES
SAVINGS, CREDIT AND INSURANCEMICROFINANCE
CONSUMER PROTECTION ,REGULATION AND
FINANCIAL EDUCATION
INCOME GENERATION
ProductivityPRODUCTION
FUNCTION
TRANSPORTATIONSEWAGE
HEALTH
LEVERAGE OPPORTUNITIES AND
DAMPEN SHOCKSDECENT MARKETSTEMPORAL CHOICE
DIRECT EFFECT
UTILITY
DIRECTEFFECT
CURRENTBUDGET
CONSTRAINT
PRODUCTIVE INCLUSION
TEMPORAL BUDGET CONSTRAINT
FINANCIAL INCLUSION
INCOMEPOLICIES
MERITGOODS
POLICIES
ENVIRONMENTALSERVICES
EDUCATION
HUMAN CAPITAL &CULTURE