Embed Size (px)
Citation preview
Global Snap Shot Gaseous Fuels
Warring Neilsen
Corporate Affairs Manager
Elgas – Linde Group

Autogas Shifting Global demand in last 5 years
A significant increase in Autogas consumption
Source: WLPGA
9.8%
23.1%
8.3%
11.3%
0%
10%
20%
30%
2006 2007 2008 2009 2010 2011 2012
Autogas Domestic
87.3%
42.8%
23.1%
0%
20%
40%
60%
80%
100%
2006200720082009201020112012
Fleet Stations Autogas
23.119.770 67.927 23.843.000

Global LPG Supply

Autogas – 25.8 Million Tonnes

Shale Gas: Key European Reserves
Source: EIA The chart above shows some of the locations of key European shale deposits
Country
Amount of
Shale
estimated (in trillion cubic
feet)
1 Russia 287
2 Ukraine 128
3 Romania 51
4 Poland 148
5 Germany 17
6 Denmark 32
7 Netherlands 26
8 France 137
9 UK 26
• In order to reduce its dependence on Russian natural gas resources, local governments step up efforts to tap their region's shale gas deposits.
• While other alternative fuels like LPG continue to be high cost to import, shale continues be a more near term solution. As accessing nearby shale gas resources would be cheaper than other option

LNG Forecast

Global Mega Trends Impacting Powertrain
Car Sharing/Car Pooling
New Micro Mobility products
Integrated Mobility Solutions
E-Mobility
Connected and Wireless Planet
Sustainable Public Transportation and BRT
Urbanization
New Energy Sources (Shale gas) Power to the Middle Class and Gen
Y
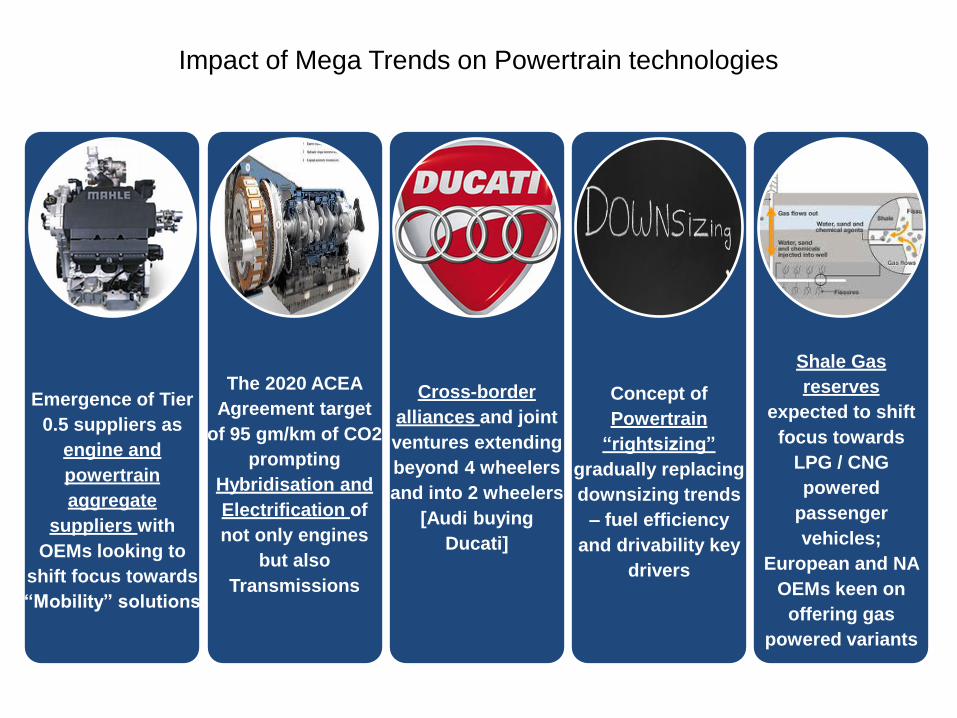
Impact of Mega Trends on Powertrain technologies
Emergence of Tier
0.5 suppliers as
engine and
powertrain
aggregate
suppliers with
OEMs looking to
shift focus towards
“Mobility” solutions
The 2020 ACEA
Agreement target
of 95 gm/km of CO2
prompting
Hybridisation and
Electrification of
not only engines
but also
Transmissions
Cross-border
alliances and joint
ventures extending
beyond 4 wheelers
and into 2 wheelers
[Audi buying
Ducati]
Concept of
Powertrain
“rightsizing”
gradually replacing
downsizing trends
– fuel efficiency
and drivability key
drivers
Shale Gas
reserves
expected to shift
focus towards
LPG / CNG
powered
passenger
vehicles;
European and NA
OEMs keen on
offering gas
powered variants

European Energy Mix and Trends
Key Influencing factors: regional policies, oil price etc.
European
Energy
Fuel Mix
National / Supranational energy
policies
Gas price indexation to Oil price
Country specific incentives,
especially towards renewables EU Emission Targets
Reducing dependence on imports
by increasing share of renewable
and unconventional sources
Company Lobbies

LPG and CNG - Market Drivers and Restraints Government incentives play a key role in the success of alternative fuels in countries like Germany , Italy and the
Netherlands.
Driv
ers
R
estra
ints
Driv
ers
R
estra
ints
Total LPG and CNG Market: Key Market Drivers and Restraints, Europe, 2014–2020
Denotes long-term impact
Denotes current impact
Source: Frost & Sullivan
Existing
infrastructure Availability and
proximity of reserves
and plants
Structured
government
incentives for
Private and
Fleet
OEMs’ need to
reduce Carbon
Emission
vehicles
Dominance of diesel
and gasoline Poor utilization of
infrastructure
Lack of organized
NGV policy by
government
officials
Limited
Refueling
network
Trend towards
blends and
hybrids
Total cost of
ownership

Future opportunities for gaseous fuels in Europe by 2020 Market Impact of Top Growth Trends for gaseous fuels - Transportation
Projected Impact on the
Transportation Industry
(fuel market)
High Impact
Low Impact
Certainty
Low High
LPG vehicles
Shale gas within transportation
Gas 2 Liquid
CNG vehicles
Hydrogen Gas
Bio Fuel Blends
High Growth Impact
Low Growth Impact
Medium Growth Impact
Source: Frost & Sullivan.

24% 25% 26% 30% 33% 36% 37% 38% 39% 76% 75% 74% 70%
67%
64% 63%
62% 61%
0
100,000
200,000
300,000
400,000
500,000
600,000
700,000
800,000
900,000
2012 2013 2014 2015 2016 2017 2018 2019 2020
CNG LPG
Total LPG and CNG Unit Shipment Snapshot - 2020 vision in Europe The growth of alternative fuel vehicle in Europe can be attributed to the introduction of new models and revamped
infrastructure in several regions.
2014
74%
26%
52%
48%
350-375 Thousand
units
CNG and LPG Market: Unit Shipment Forecast, Europe, 2012–2020
CAGR = 13.8%
• The overall market scenario in Europe is much better than the rest of the world with close to 5% more alternative fuel vehicles than other regions.
• The high growth rate among the various EU countries can be attributed to the stringent Euro norms and individual government interest in the fuel as a means to reduce dependency on oil fuels.
2020
61%
39%
*Range used due to the fluctuating nature of the number.
Year
Un
its
Note: All figures are rounded. The base year is 2013. Source: Frost & Sullivan
800-850 Thousand
units
2020
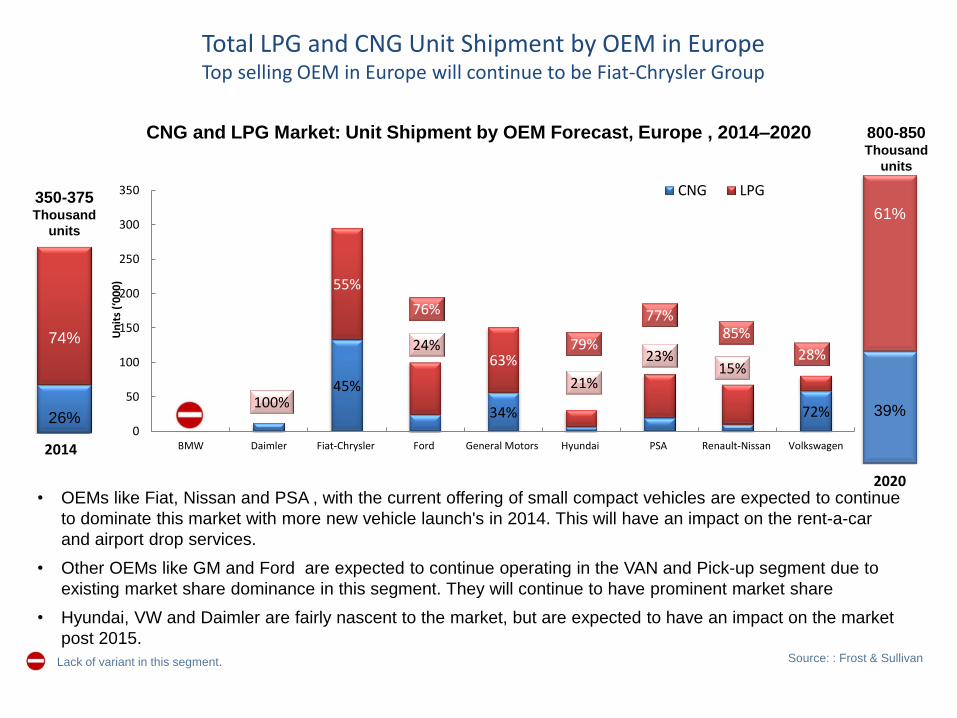
100% 45%
24%
34%
21%
23% 15%
72%
55%
76%
63% 79%
77% 85%
28%
0
50
100
150
200
250
300
350
BMW Daimler Fiat-Chrysler Ford General Motors Hyundai PSA Renault-Nissan Volkswagen
Un
its
(‘0
00
)
CNG LPG
Total LPG and CNG Unit Shipment by OEM in Europe Top selling OEM in Europe will continue to be Fiat-Chrysler Group
• OEMs like Fiat, Nissan and PSA , with the current offering of small compact vehicles are expected to continue
to dominate this market with more new vehicle launch's in 2014. This will have an impact on the rent-a-car
and airport drop services.
• Other OEMs like GM and Ford are expected to continue operating in the VAN and Pick-up segment due to
existing market share dominance in this segment. They will continue to have prominent market share
• Hyundai, VW and Daimler are fairly nascent to the market, but are expected to have an impact on the market
post 2015.
CNG and LPG Market: Unit Shipment by OEM Forecast, Europe , 2014–2020
Lack of variant in this segment. Source: : Frost & Sullivan
2014
74%
26%
350-375 Thousand
units
61%
39%
800-850 Thousand
units

European LPG Conversion Centres


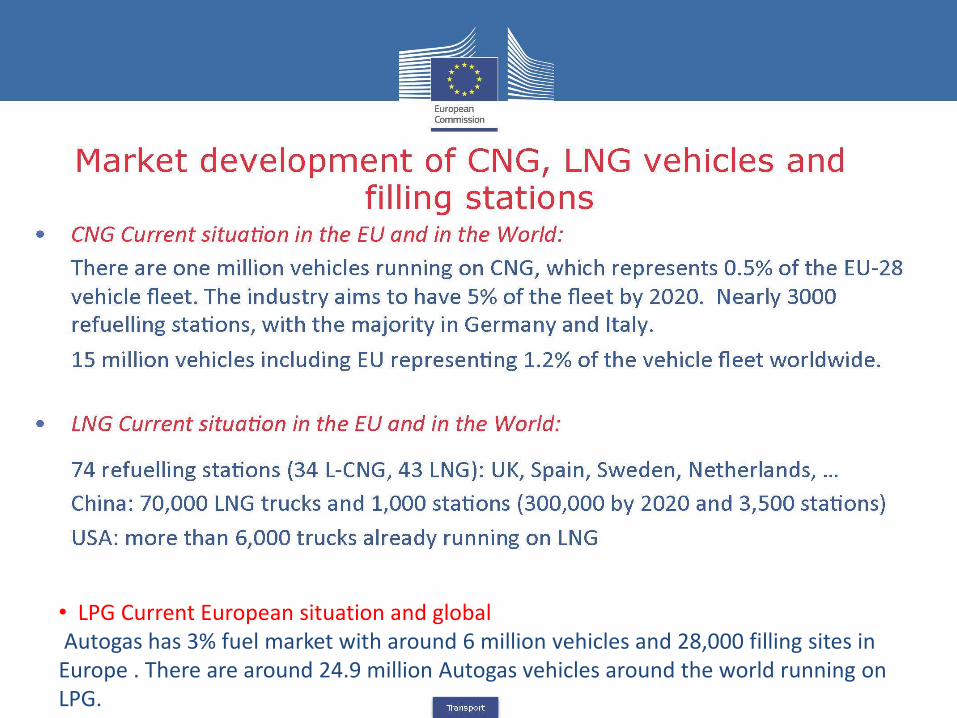
• LPG Current European situation and global Autogas has 3% fuel market with around 6 million vehicles and 28,000 filling sites in Europe . There are around 24.9 million Autogas vehicles around the world running on LPG.


Europe Infrastructure

Canada

USA

LNG –CNG- LPG Options Dedicated or Dual fuel
DAF Mitsubishi
Iveco Isuzu
MAN Hino
Mercedes Toyota
Renault Nissan
Volvo International Cummins Detroit Diesel
Sinotruk Scania
Hyundai
LNG – CNG -

Number of converted trucks: 22
Annual running expenses: € 350,- per truck
Annual machinery breakdown insurance: € 500,- per truck
Breakeven point reached in 15 months
No conspicuous repairs in the 27 months of this case study
Additional savings with on-site FLAGA LPG filling station
Diesel Blending LPG –
McDonald‘s HAVI Logistics – Austria


Thank You
Questions ?