Embed Size (px)
Citation preview
National Center on Birth Defects and Developmental Disabilities
Global Situation of Birth Defects and Initiatives for Prevention
Mike Cannon, PhD
Team Lead, Prevention Research Team
National Center on Birth Defects and Developmental Disabilities, CDC
August 9, 2016
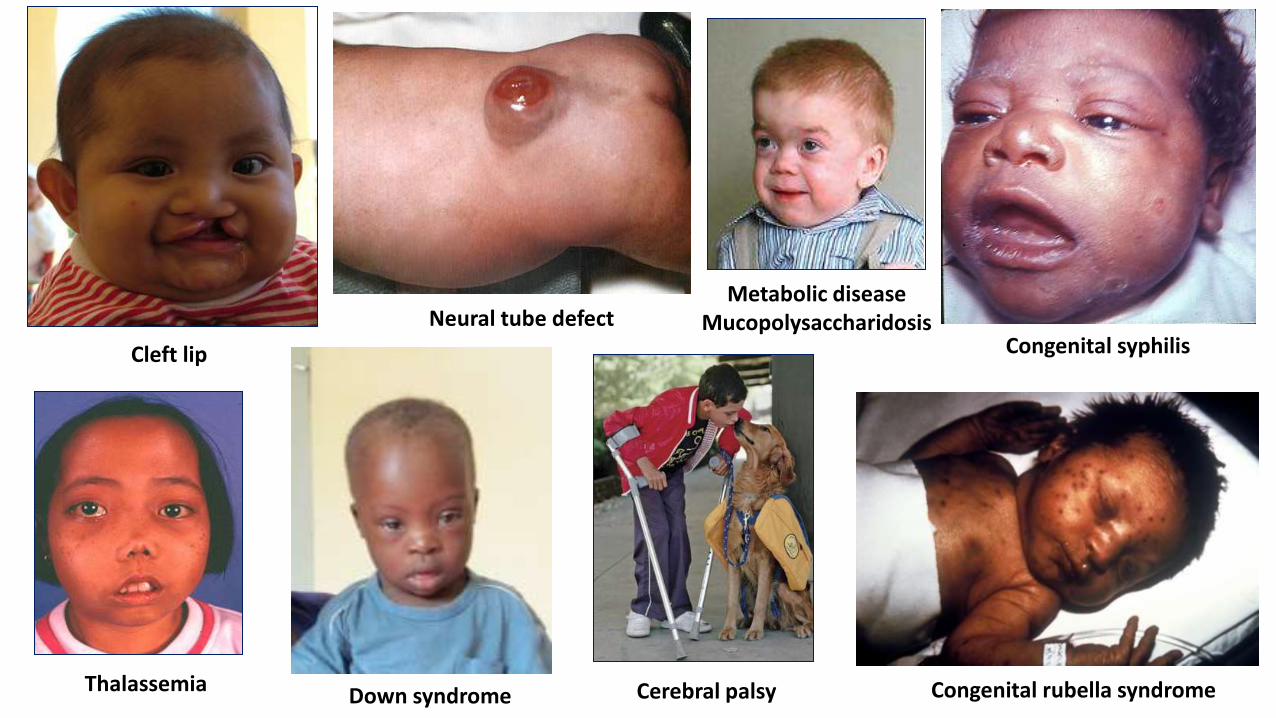
Metabolic disease Mucopolysaccharidosis
Cerebral palsy Thalassemia
Cleft lip
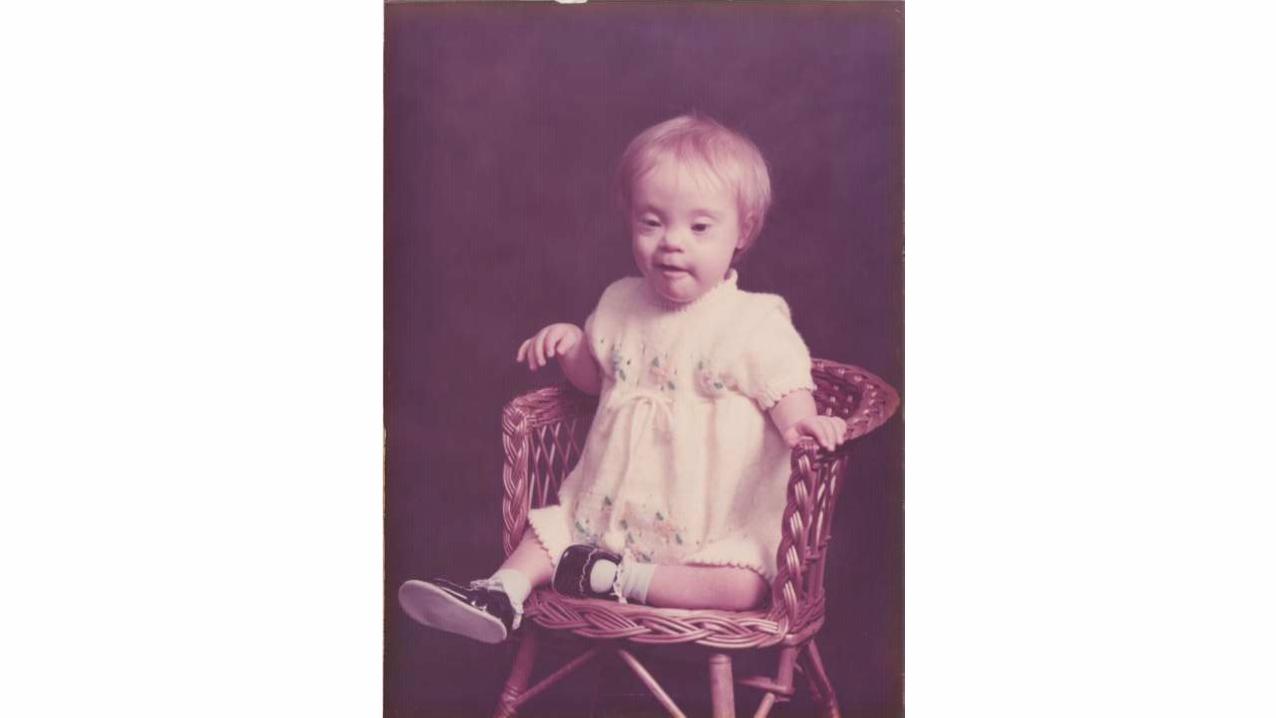
Down syndrome
Neural tube defect Congenital syphilis
Congenital rubella syndrome
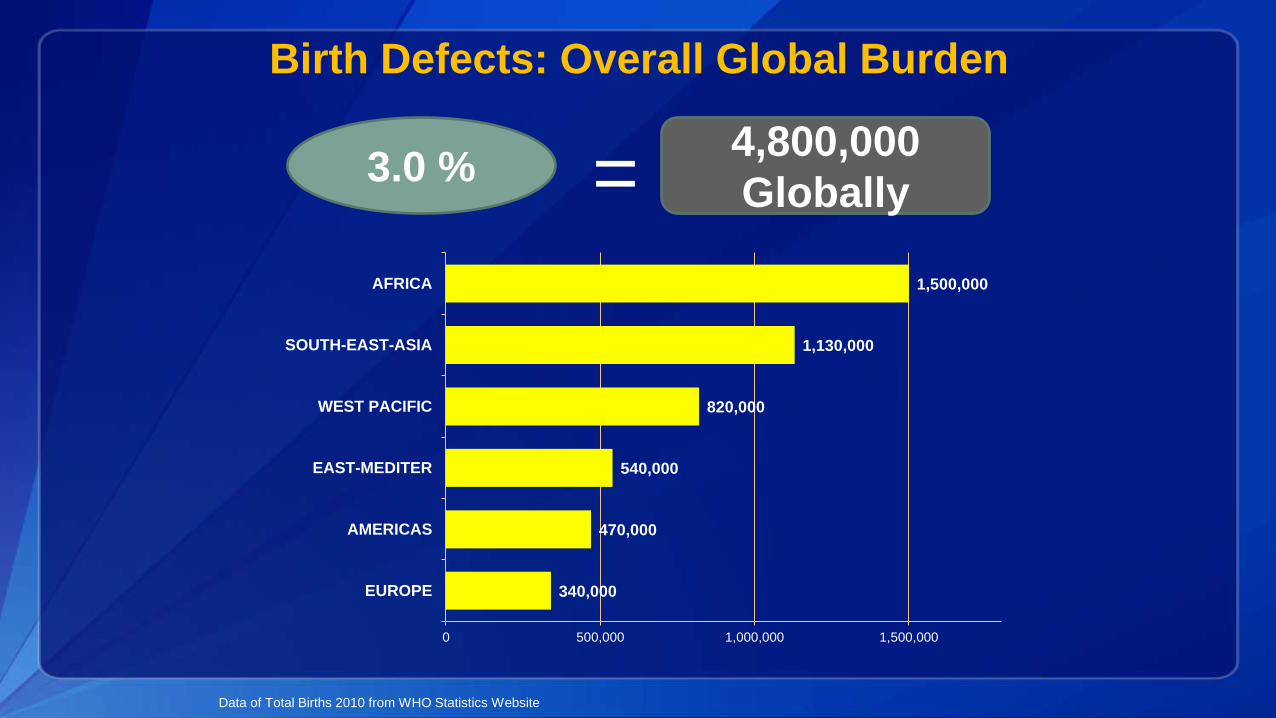
Birth Defects: Overall Global Burden
3.0 %
340,000
470,000
540,000
820,000
1,130,000
1,500,000
0 500,000 1,000,000 1,500,000
EUROPE
AMERICAS
EAST-MEDITER
WEST PACIFIC
SOUTH-EAST-ASIA
AFRICA
4,800,000
Globally =
Data of Total Births 2010 from WHO Statistics Website
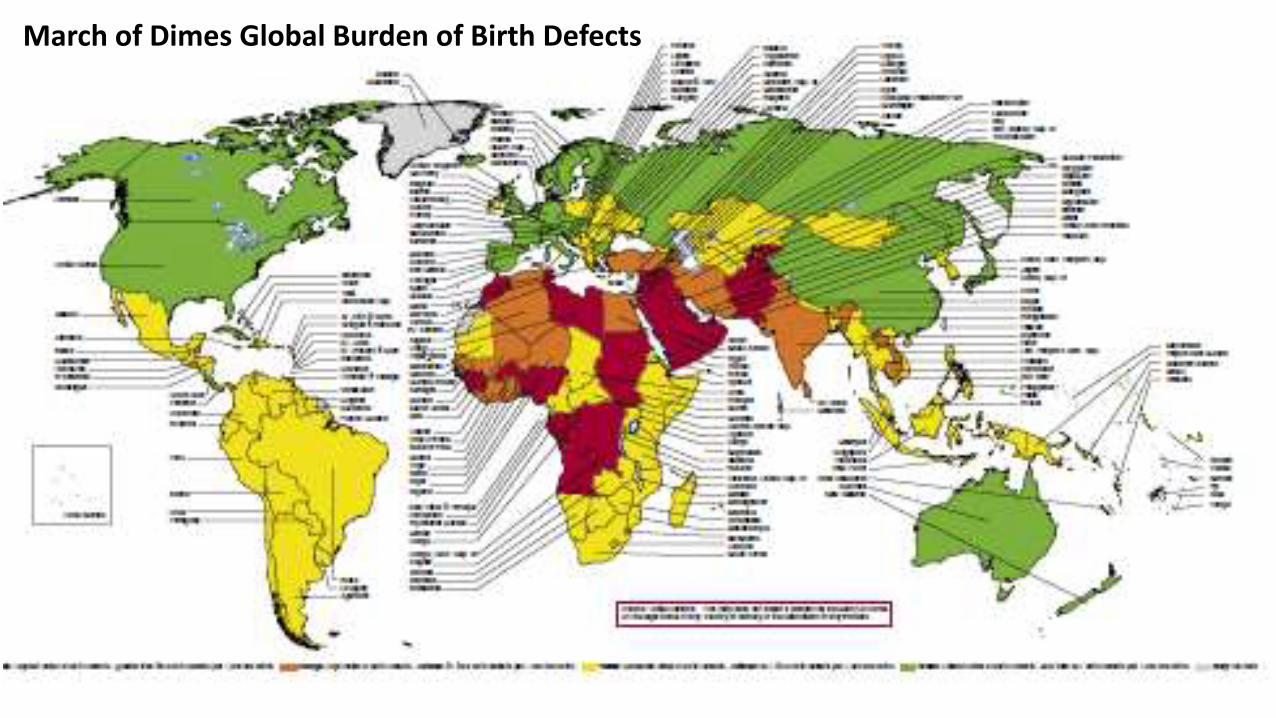
March of Dimes Global Burden of Birth Defects
0
10
20
30
40
50
60
70
80P
reva
len
ce
per
1,0
00
bir
ths
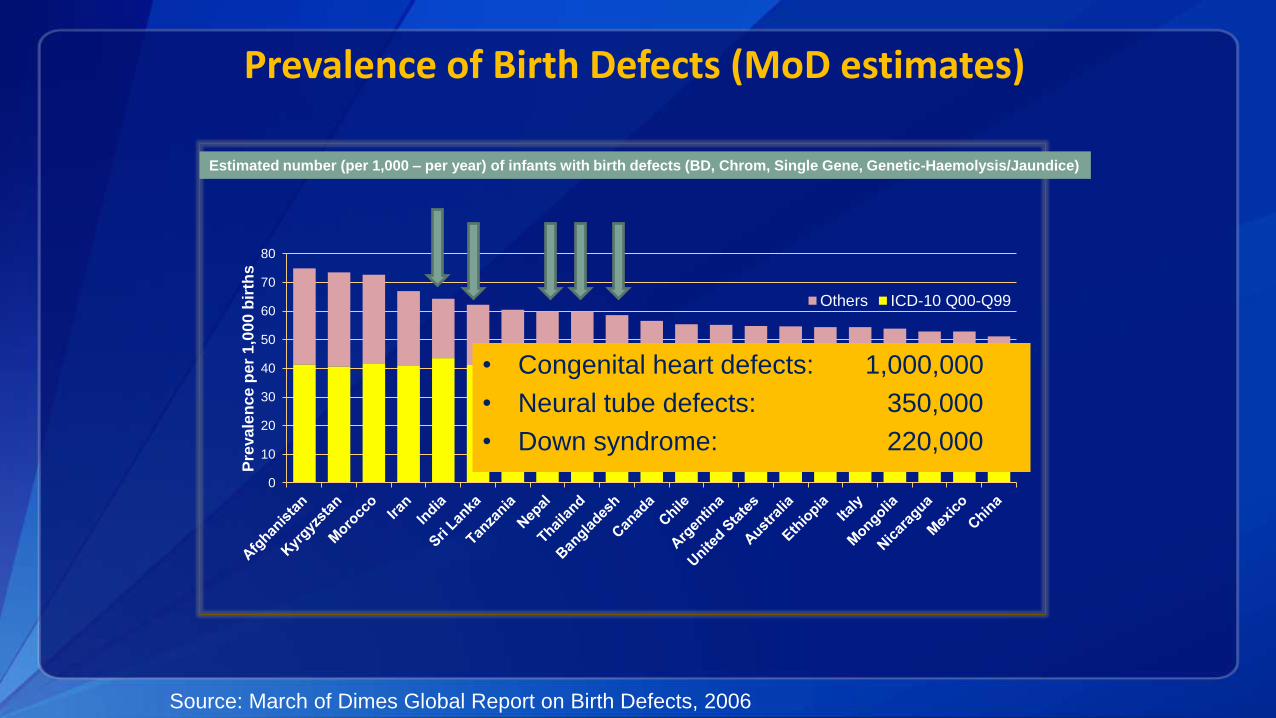
Others ICD-10 Q00-Q99
Estimated number (per 1,000 – per year) of infants with birth defects (BD, Chrom, Single Gene, Genetic-Haemolysis/Jaundice)
Source: March of Dimes Global Report on Birth Defects, 2006
• Congenital heart defects: 1,000,000
• Neural tube defects: 350,000
• Down syndrome: 220,000
Prevalence of Birth Defects (MoD estimates)
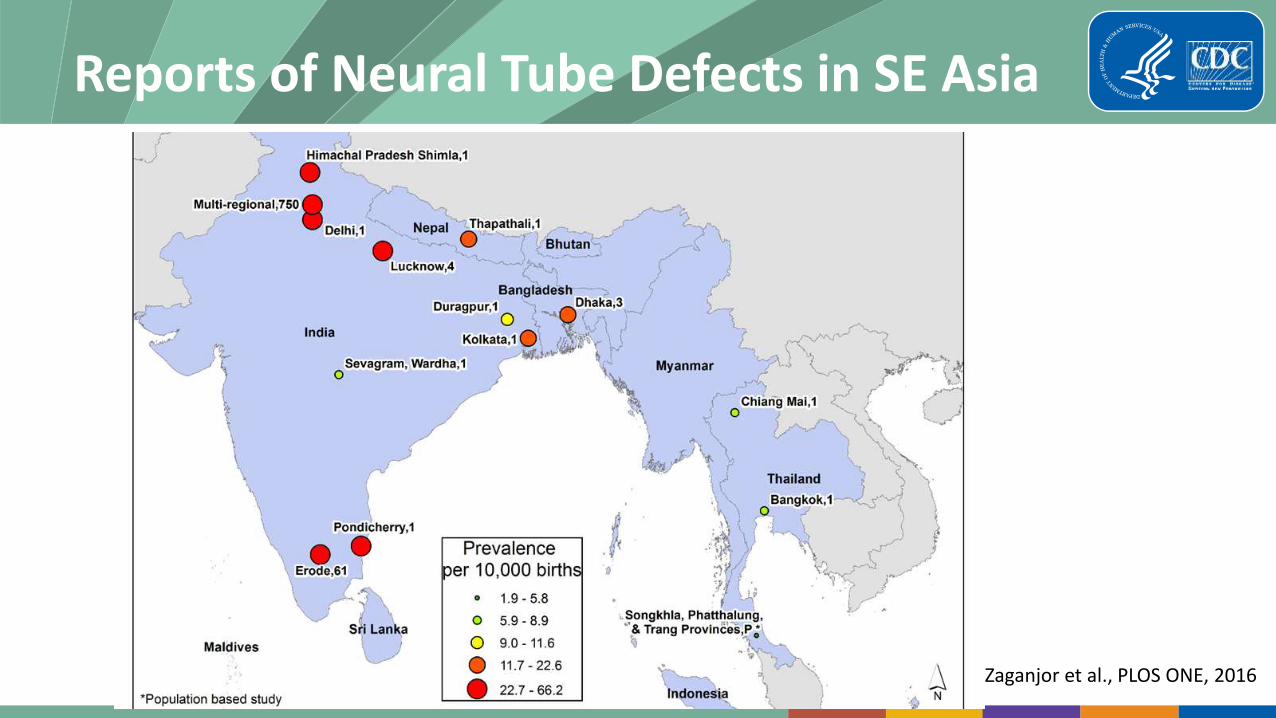
Reports of Neural Tube Defects in SE Asia
Zaganjor et al., PLOS ONE, 2016
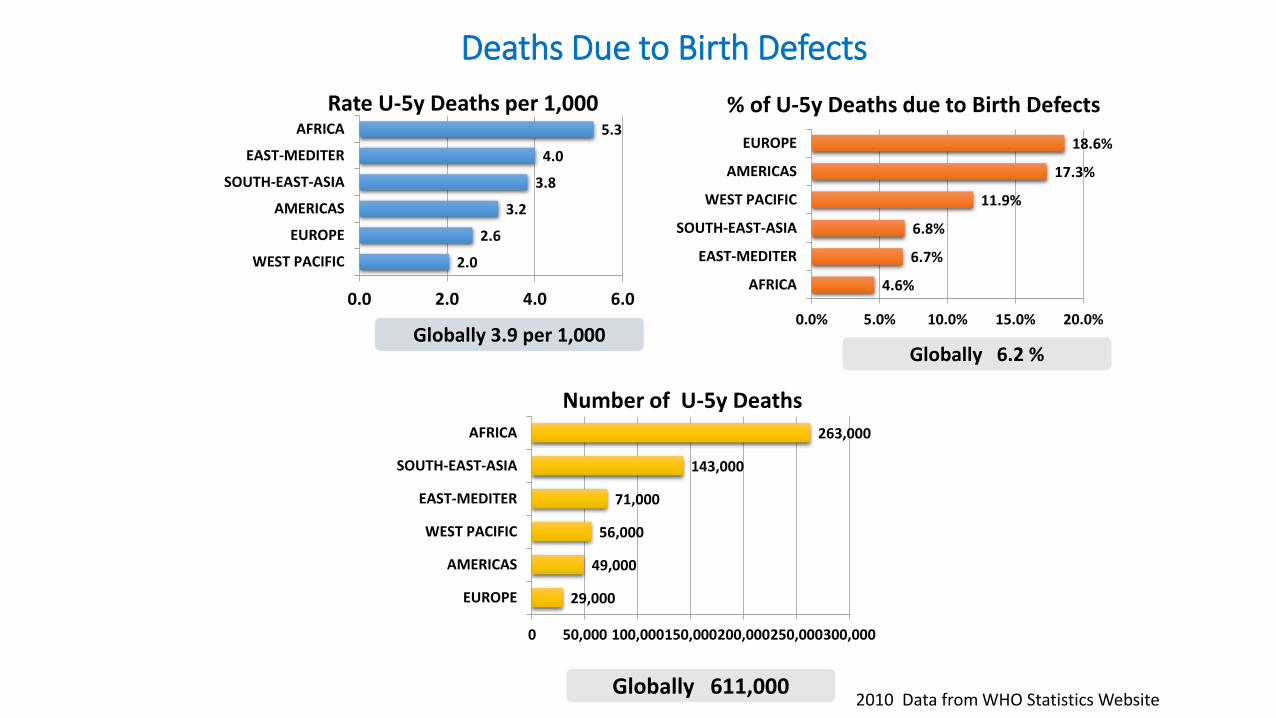
Deaths Due to Birth Defects
2.0
2.6
3.2
3.8
4.0
5.3
0.0 2.0 4.0 6.0
WEST PACIFIC
EUROPE
AMERICAS
SOUTH-EAST-ASIA
EAST-MEDITER
AFRICA
Rate U-5y Deaths per 1,000
Globally 3.9 per 1,000
29,000
49,000
56,000
71,000
143,000
263,000
0 50,000 100,000150,000200,000250,000300,000
EUROPE
AMERICAS
WEST PACIFIC
EAST-MEDITER
SOUTH-EAST-ASIA
AFRICA
Number of U-5y Deaths
Globally 611,000
4.6%
6.7%
6.8%
11.9%
17.3%
18.6%
0.0% 5.0% 10.0% 15.0% 20.0%
AFRICA
EAST-MEDITER
SOUTH-EAST-ASIA
WEST PACIFIC
AMERICAS
EUROPE
% of U-5y Deaths due to Birth Defects
Globally 6.2 %
2010 Data from WHO Statistics Website
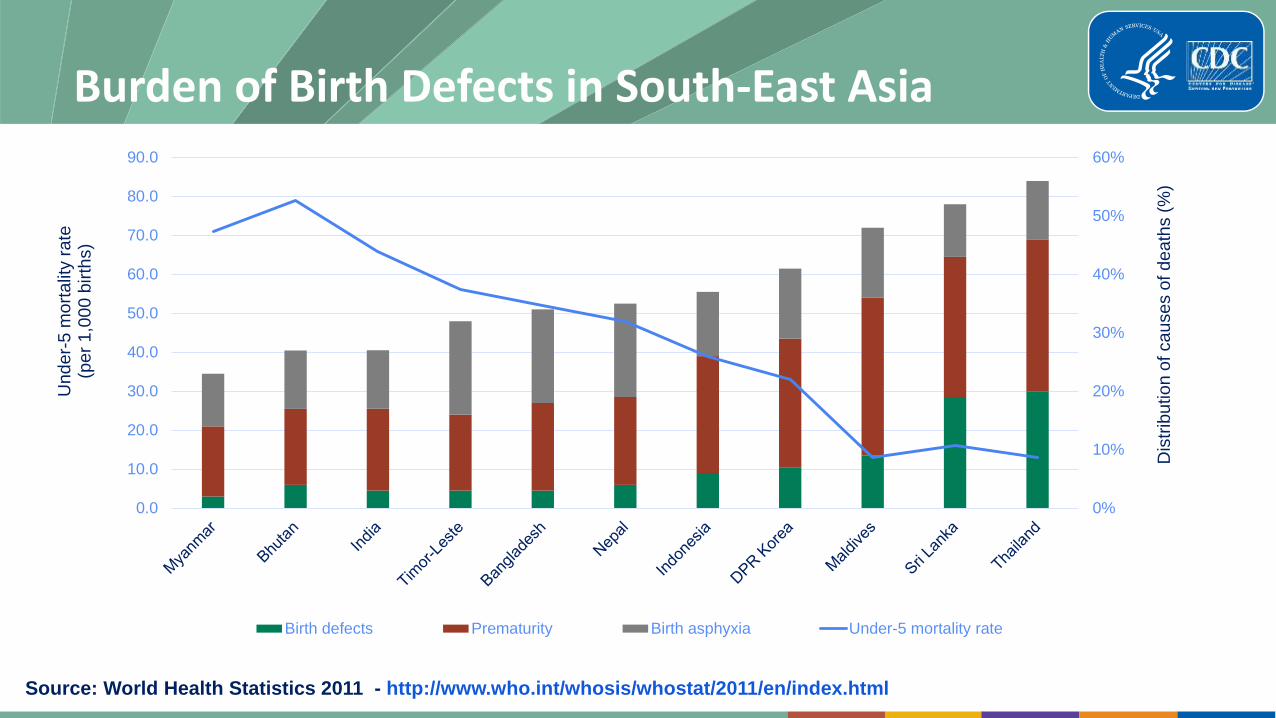
Burden of Birth Defects in South-East Asia
0%
10%
20%
30%
40%
50%
60%
0.0
10.0
20.0
30.0
40.0
50.0
60.0
70.0
80.0
90.0
Dis
trib
utio
n o
f ca
use
s o
f d
ea
ths (
%)
Und
er-
5 m
ort
alit
y r
ate
(p
er
1,0
00 b
irth
s)
Birth defects Prematurity Birth asphyxia Under-5 mortality rate
Source: World Health Statistics 2011 - http://www.who.int/whosis/whostat/2011/en/index.html
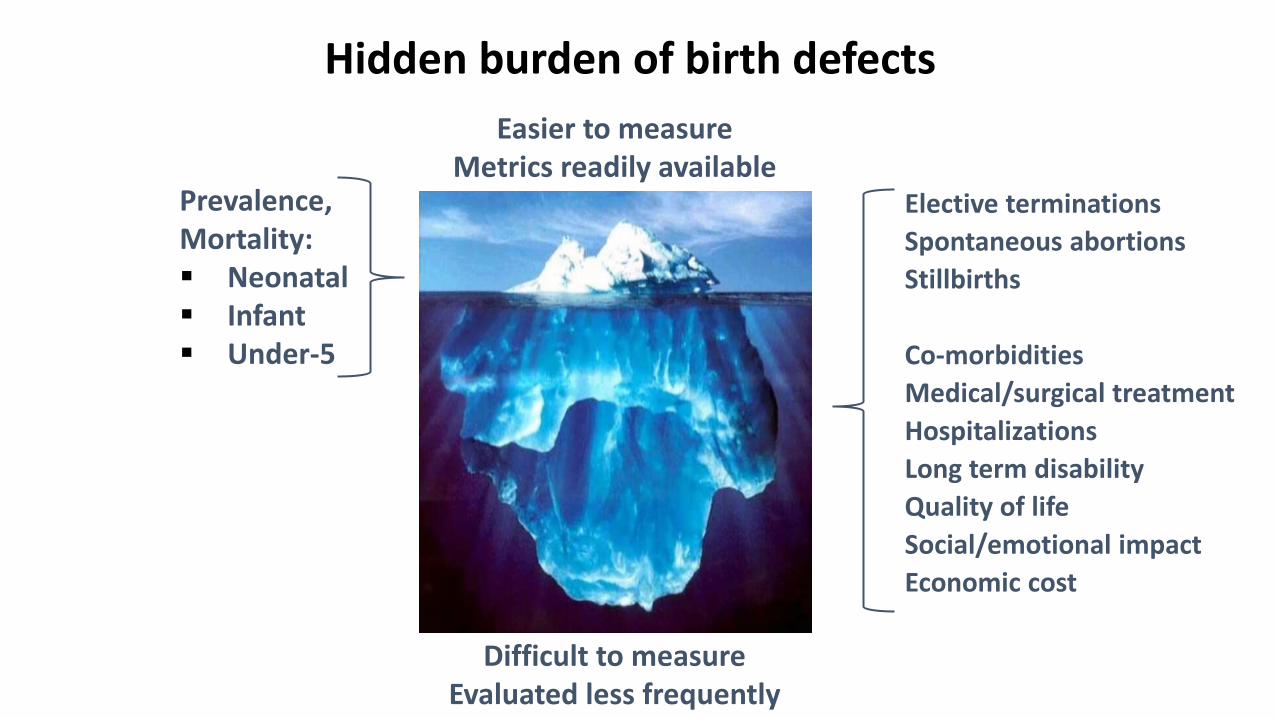
Hidden burden of birth defects
Elective terminations
Spontaneous abortions
Stillbirths
Co-morbidities
Medical/surgical treatment
Hospitalizations
Long term disability
Quality of life
Social/emotional impact
Economic cost
Easier to measure Metrics readily available
Difficult to measure Evaluated less frequently
Prevalence, Mortality: Neonatal Infant Under-5

Many birth defects can be
swept away
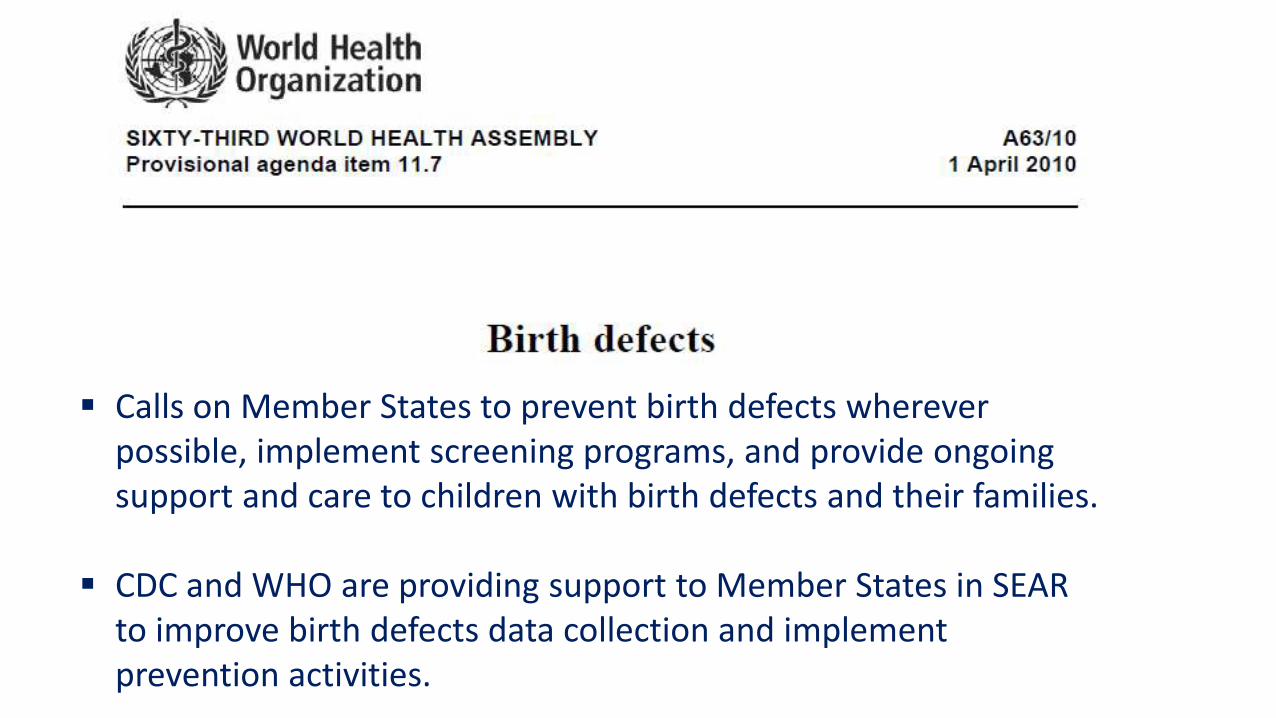
Calls on Member States to prevent birth defects wherever possible, implement screening programs, and provide ongoing support and care to children with birth defects and their families.
CDC and WHO are providing support to Member States in SEAR
to improve birth defects data collection and implement prevention activities.

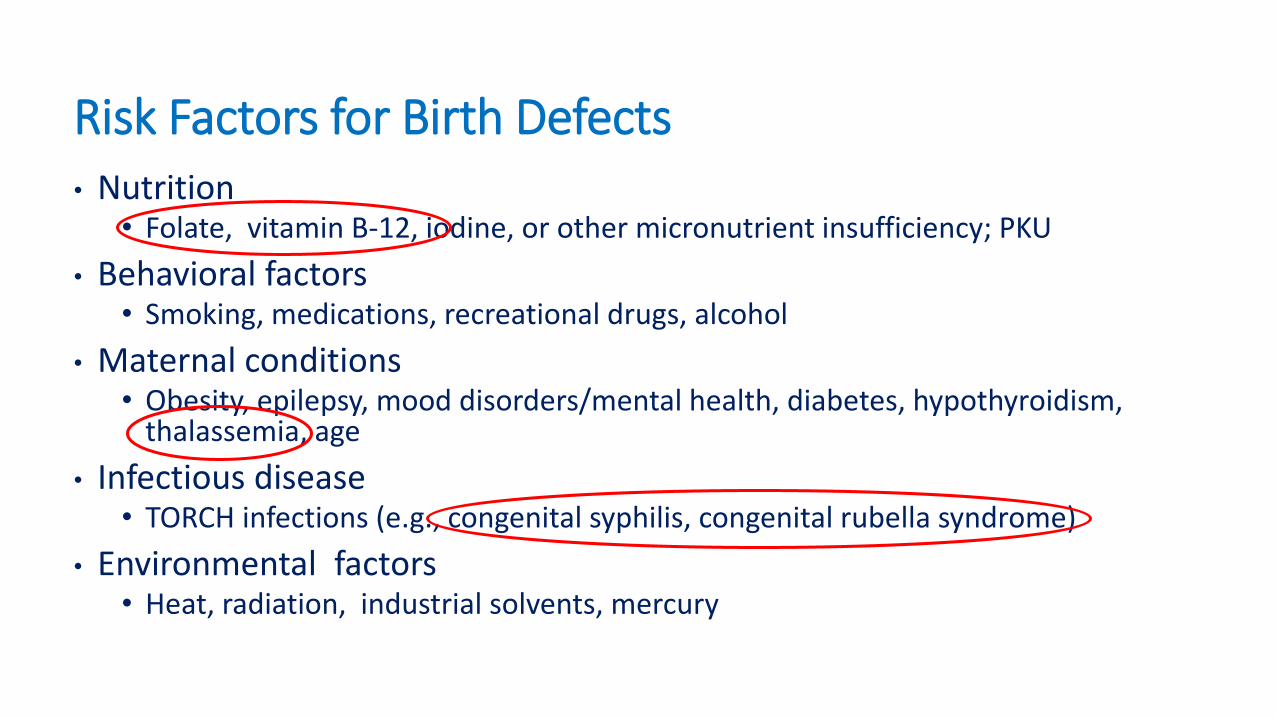
Risk Factors for Birth Defects • Nutrition
• Folate, vitamin B-12, iodine, or other micronutrient insufficiency; PKU
• Behavioral factors • Smoking, medications, recreational drugs, alcohol
• Maternal conditions • Obesity, epilepsy, mood disorders/mental health, diabetes, hypothyroidism,
thalassemia, age
• Infectious disease • TORCH infections (e.g., congenital syphilis, congenital rubella syndrome)
• Environmental factors • Heat, radiation, industrial solvents, mercury
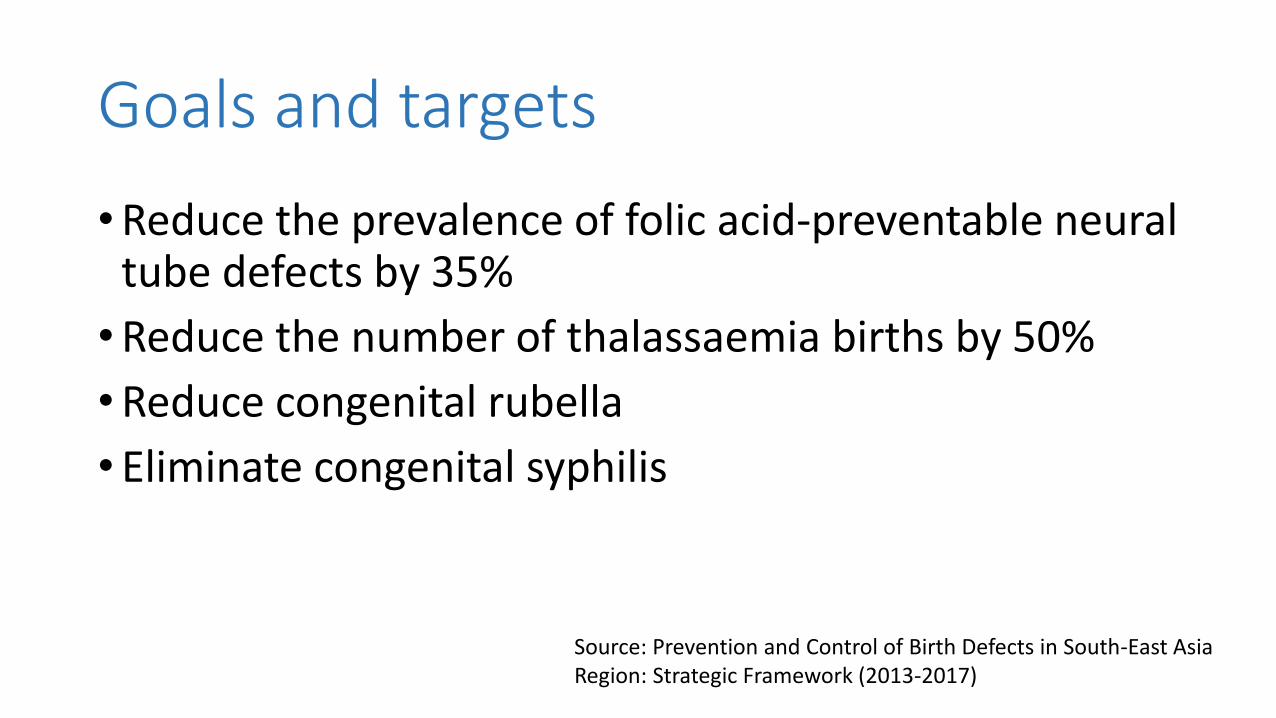
Goals and targets
•Reduce the prevalence of folic acid-preventable neural tube defects by 35%
•Reduce the number of thalassaemia births by 50%
•Reduce congenital rubella
• Eliminate congenital syphilis
Source: Prevention and Control of Birth Defects in South-East Asia Region: Strategic Framework (2013-2017)
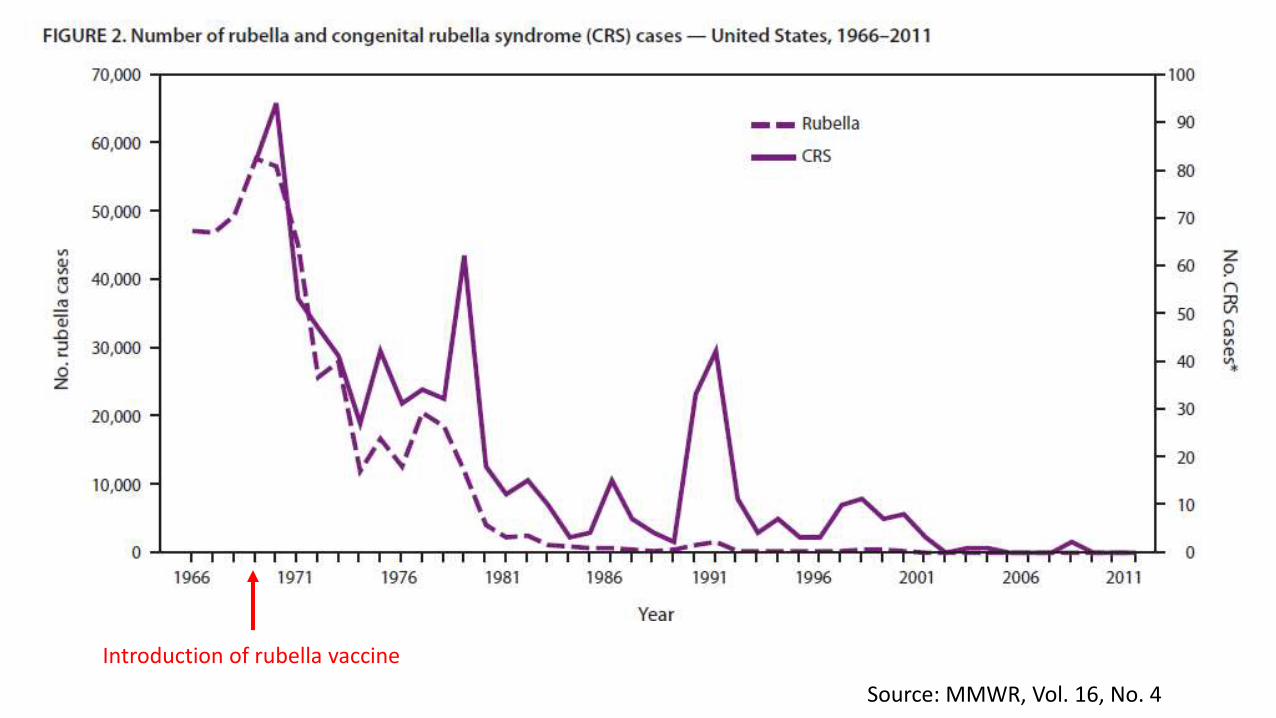
Source: MMWR, Vol. 16, No. 4
Introduction of rubella vaccine
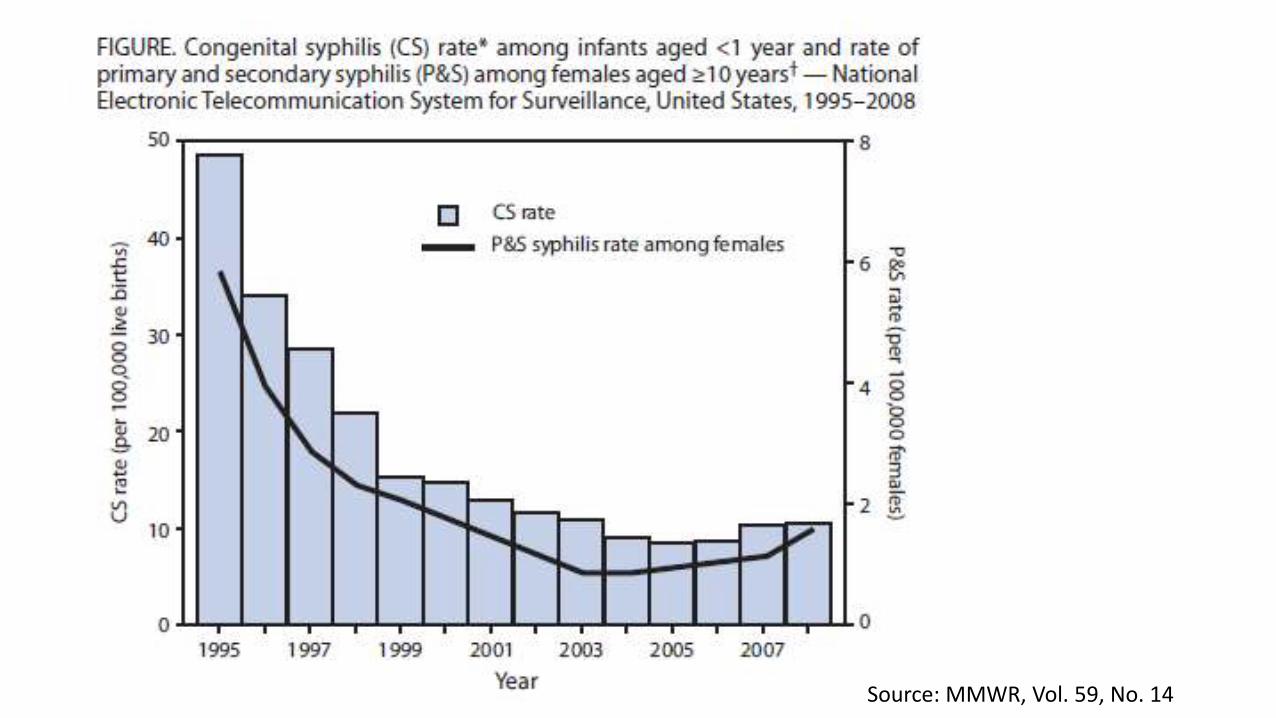
Source: MMWR, Vol. 59, No. 14
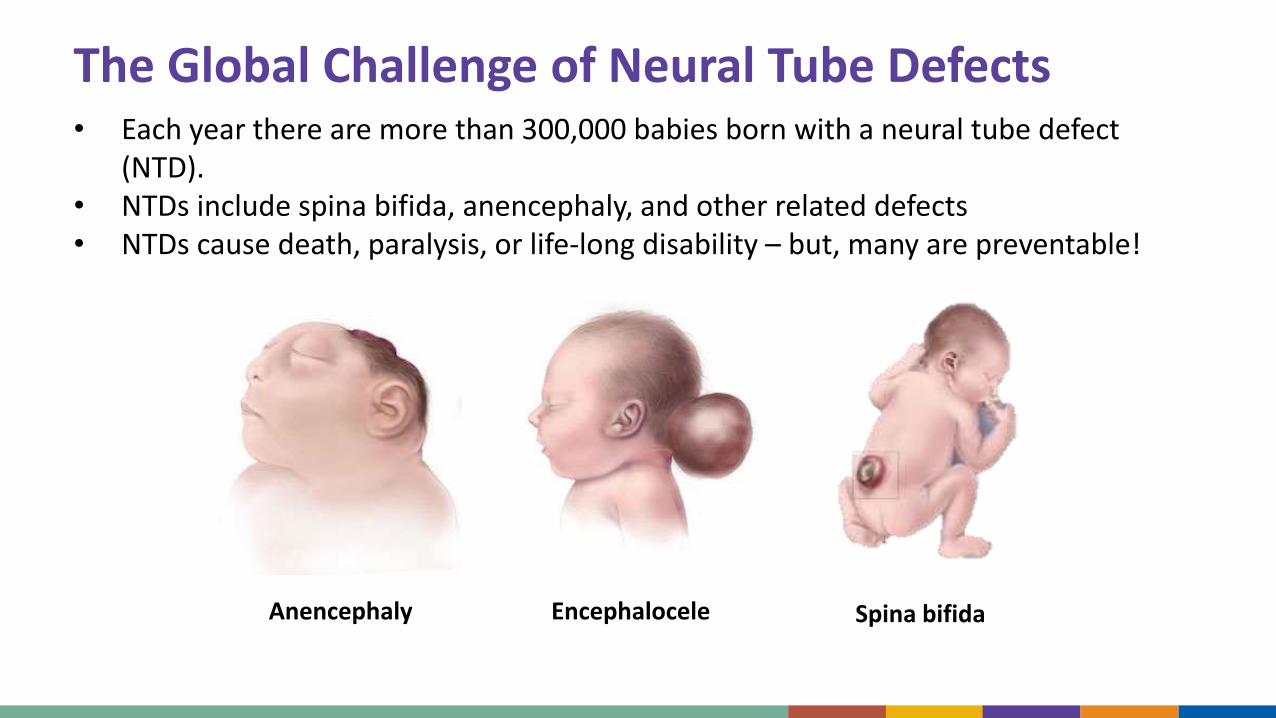
The Global Challenge of Neural Tube Defects • Each year there are more than 300,000 babies born with a neural tube defect
(NTD). • NTDs include spina bifida, anencephaly, and other related defects • NTDs cause death, paralysis, or life-long disability – but, many are preventable!
Anencephaly Encephalocele Spina bifida
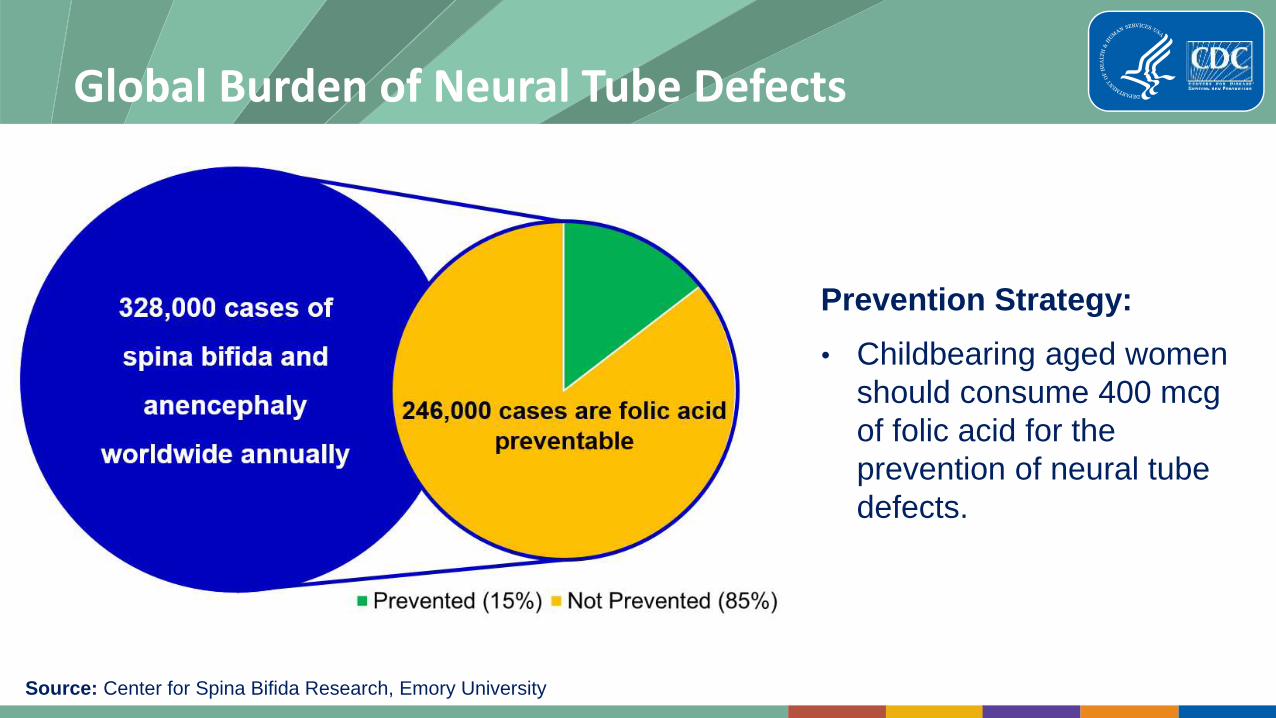
Global Burden of Neural Tube Defects
Source: Center for Spina Bifida Research, Emory University
Prevention Strategy:
• Childbearing aged women
should consume 400 mcg
of folic acid for the
prevention of neural tube
defects.
1
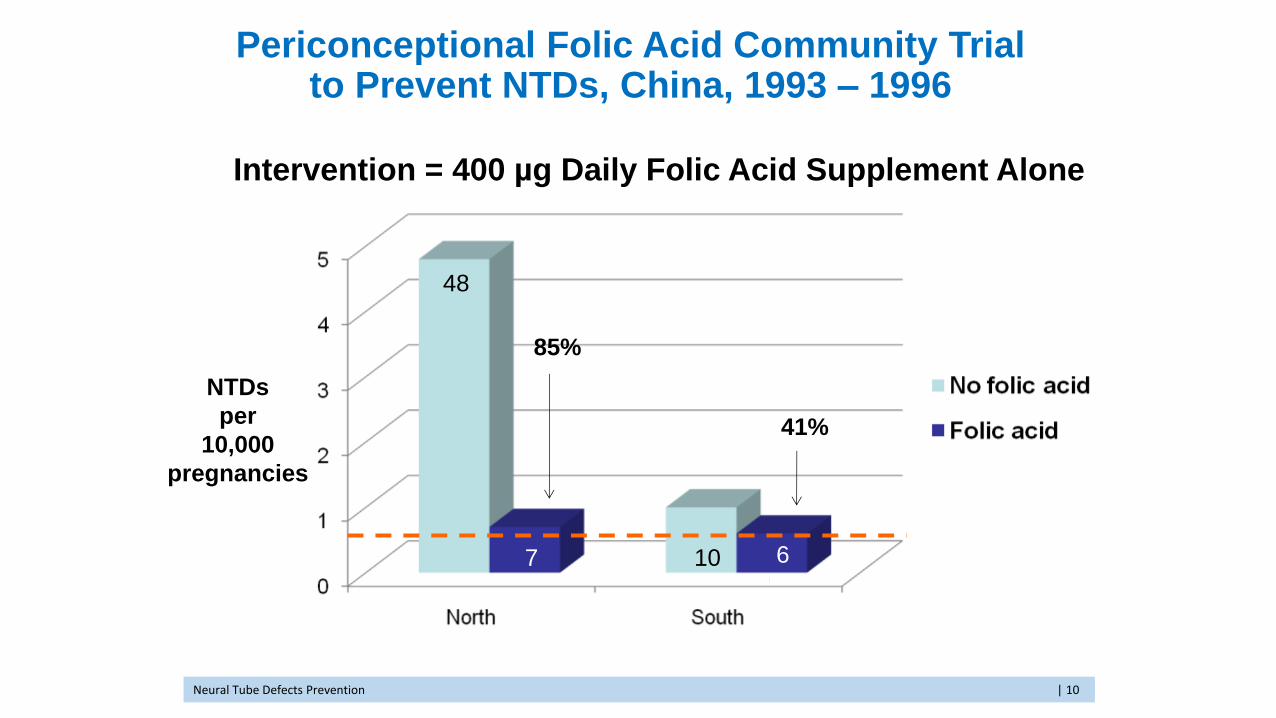
Intervention = 400 µg Daily Folic Acid Supplement Alone
NTDs
per
10,000
pregnancies
48
7 10 6
85%
41%
Periconceptional Folic Acid Community Trial to Prevent NTDs, China, 1993 – 1996
Neural Tube Defects Prevention | 10

22
Diet…natural foods,
vegetables, fruits, beans,
yeast, liver
Fortification … folic
acid added to foods -
flour, rice, pasta,
breakfast cereals
Pills… folic acid-containing
dietary supplements
Approaches to Increase Folate/Folic Acid Intake
CDC. MMWR Recomm Rep 1992 Sep 11;41(RR-14):1-7
Neural Tube Defects Prevention | 122
1
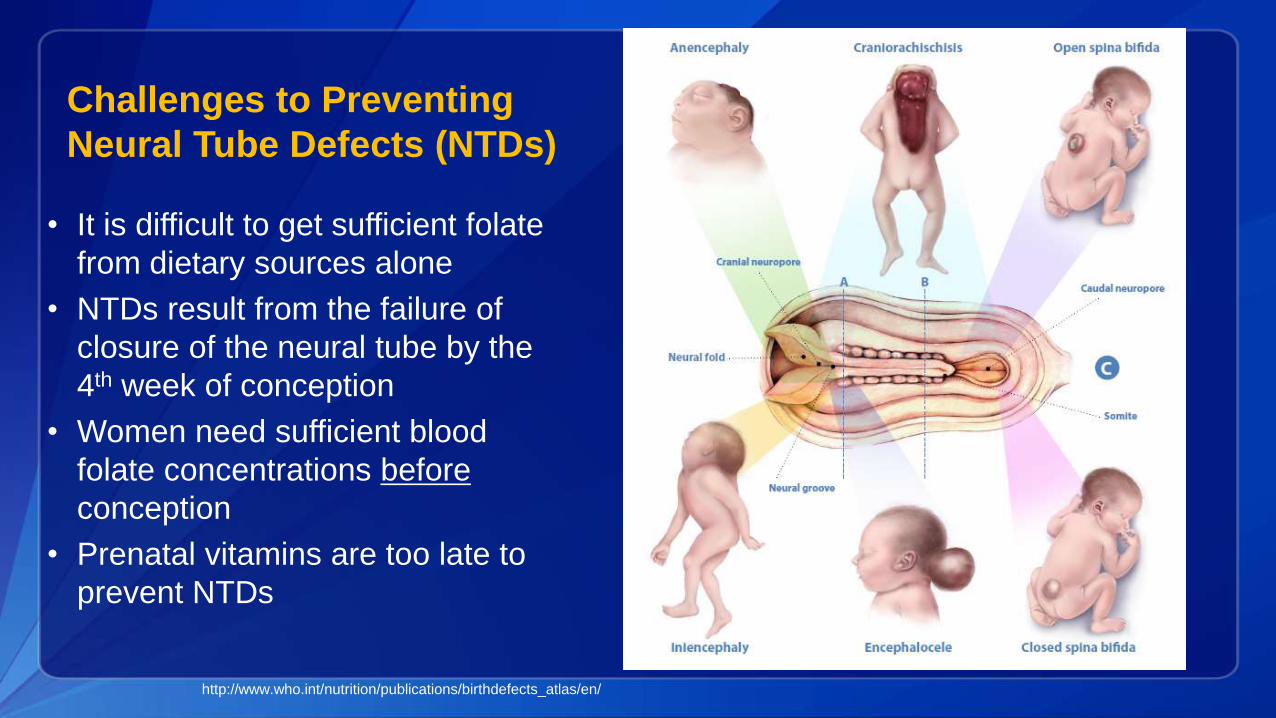
Challenges to Preventing
Neural Tube Defects (NTDs)
• It is difficult to get sufficient folate
from dietary sources alone
• NTDs result from the failure of
closure of the neural tube by the
4th week of conception
• Women need sufficient blood
folate concentrations before
conception
• Prenatal vitamins are too late to
prevent NTDs
http://www.who.int/nutrition/publications/birthdefects_atlas/en/
1
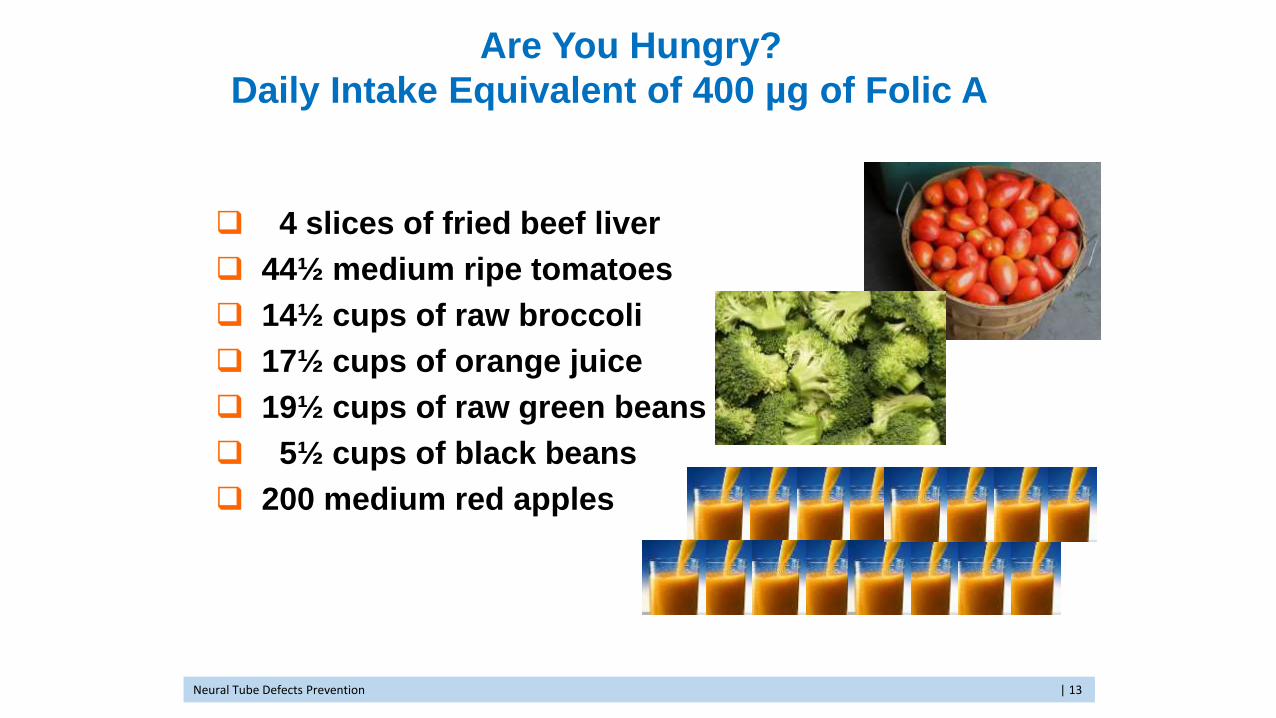
Are You Hungry?
Daily Intake Equivalent of 400 µg of Folic Acid
4 slices of fried beef liver
44½ medium ripe tomatoes
14½ cups of raw broccoli
17½ cups of orange juice
19½ cups of raw green beans
5½ cups of black beans
200 medium red apples
Neural Tube Defects Prevention | 13
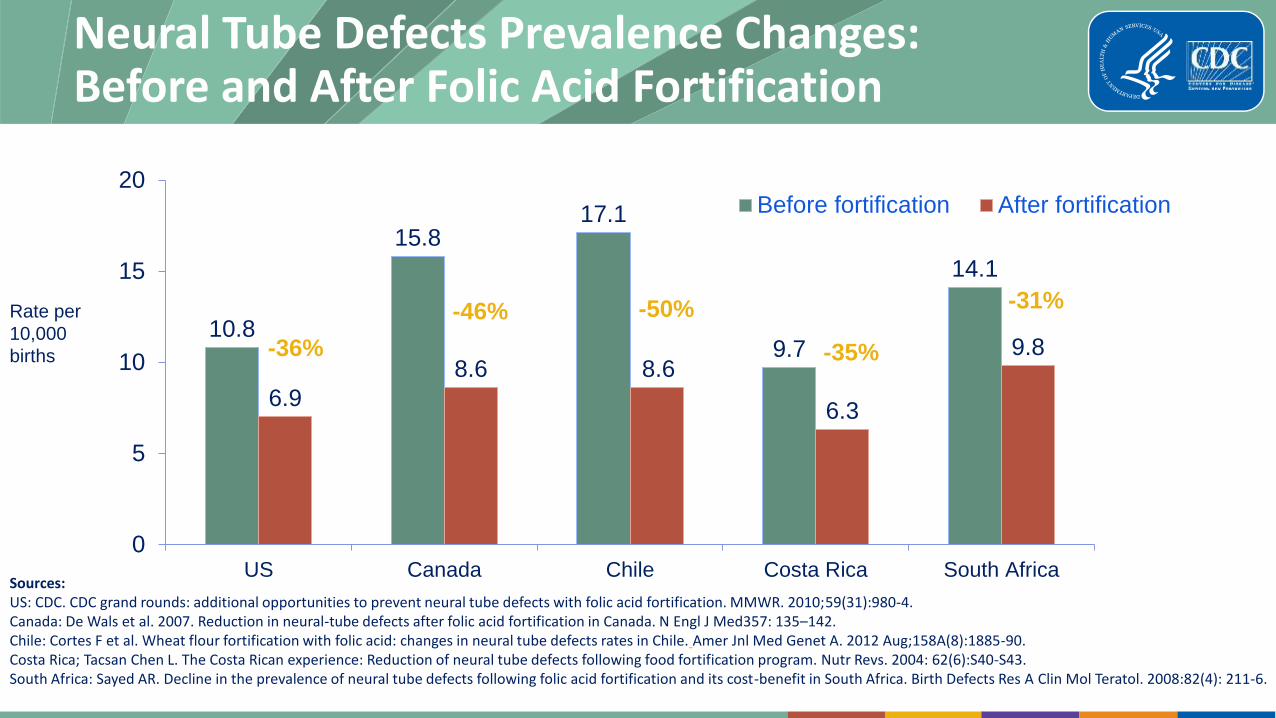
Neural Tube Defects Prevalence Changes: Before and After Folic Acid Fortification
10.8
15.8 17.1
9.7
14.1
6.9
8.6 8.6
6.3
9.8
0
5
10
15
20
US Canada Chile Costa Rica South Africa
Before fortification After fortification
Rate per
10,000
births -36%
-46% -50%
-35%
-31%
Sources: US: CDC. CDC grand rounds: additional opportunities to prevent neural tube defects with folic acid fortification. MMWR. 2010;59(31):980-4. Canada: De Wals et al. 2007. Reduction in neural-tube defects after folic acid fortification in Canada. N Engl J Med357: 135–142. Chile: Cortes F et al. Wheat flour fortification with folic acid: changes in neural tube defects rates in Chile. Amer Jnl Med Genet A. 2012 Aug;158A(8):1885-90. Costa Rica; Tacsan Chen L. The Costa Rican experience: Reduction of neural tube defects following food fortification program. Nutr Revs. 2004: 62(6):S40-S43. South Africa: Sayed AR. Decline in the prevalence of neural tube defects following folic acid fortification and its cost-benefit in South Africa. Birth Defects Res A Clin Mol Teratol. 2008:82(4): 211-6.
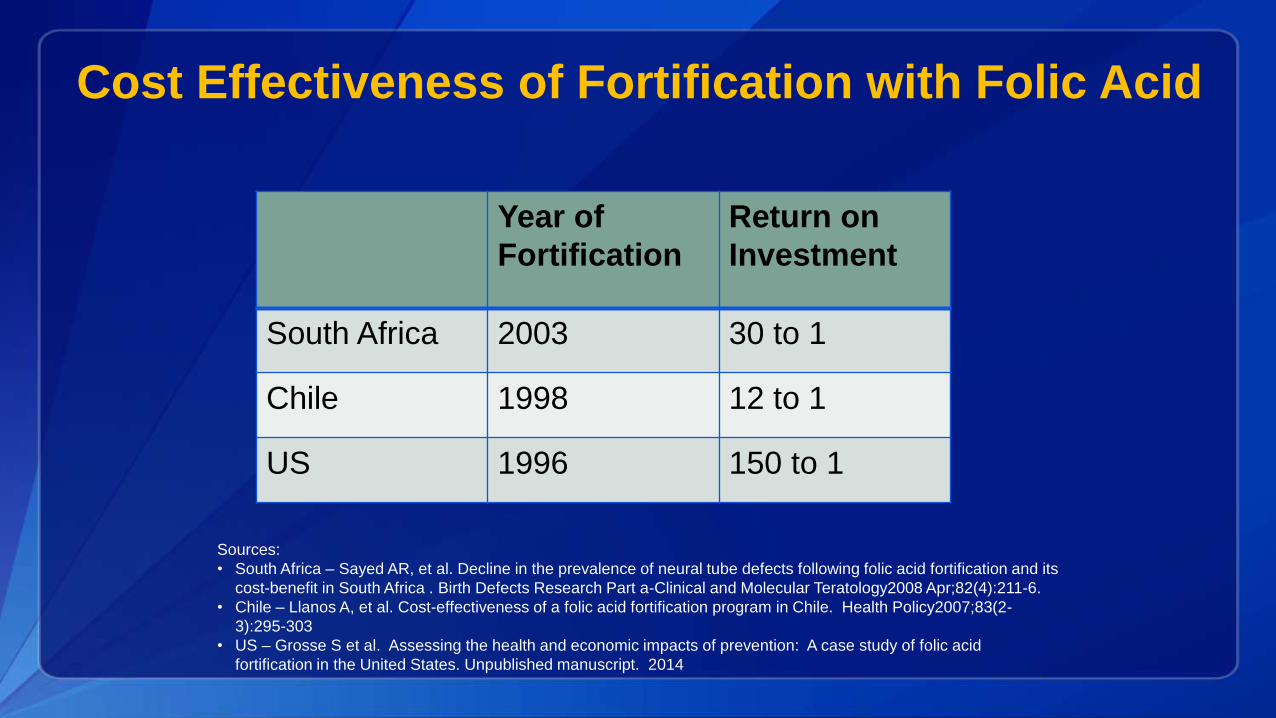
Year of
Fortification
Return on
Investment
South Africa 2003 30 to 1
Chile 1998 12 to 1
US 1996 150 to 1
Cost Effectiveness of Fortification with Folic Acid
Sources:
• South Africa – Sayed AR, et al. Decline in the prevalence of neural tube defects following folic acid fortification and its
cost-benefit in South Africa . Birth Defects Research Part a-Clinical and Molecular Teratology2008 Apr;82(4):211-6.
• Chile – Llanos A, et al. Cost-effectiveness of a folic acid fortification program in Chile. Health Policy2007;83(2-
3):295-303
• US – Grosse S et al. Assessing the health and economic impacts of prevention: A case study of folic acid
fortification in the United States. Unpublished manuscript. 2014
Summary
Birth defects are an important cause of morbidity and mortality in SE Asia
Effective interventions can be implemented to prevent • Neural tube defects
• Congenital rubella
• Congenital syphilis
• Thalassaemia
Surveillance is a key piece of prevention
For more information, contact CDC 1-800-CDC-INFO (232-4636) TTY: 1-888-232-6348 www.cdc.gov The findings and conclusions in this report are those of the authors and do not necessarily represent the official position of the Centers for Disease Control and Prevention.
Questions?
Mike Cannon [email protected]


![Hospital-based Birth Defects · PDF fileHospital-based birth defects surveillance: ... Birth defects are one type of congenital conditions. [Slides 5-6] ... • Congenital malformations:](https://img.pdfslide.us/doc/110x75/5ab1551c7f8b9a7e1d8c4658/hospital-based-birth-defects-birth-defects-surveillance-birth-defects-are-one.jpg)