Embed Size (px)
Citation preview

428 www.newphytologist.org
Research
Blackwell Publishing LtdGlobal response patterns of terrestrial plant species to nitrogen addition
Jianyang Xia and Shiqiang WanState Key Laboratory of Vegetation and Environmental Change, Institute of Botany, Chinese Academy of Sciences, Xiangshan, Beijing 100093, China
Summary
• Better understanding of the responses of terrestrial plant species under globalnitrogen (N) enrichment is critical for projection of changes in structure, functioning,and service of terrestrial ecosystems.• Here, a meta-analysis of data from 304 studies was carried out to reveal thegeneral response patterns of terrestrial plant species to the addition of N.• Across 456 terrestrial plant species included in the analysis, biomass and Nconcentration were increased by 53.6 and 28.5%, respectively, under N enrichment.However, the N responses were dependent upon plant functional types, with signific-antly greater biomass increases in herbaceous than in woody species. Stimulation ofplant biomass by the addition of N was enhanced when other resources wereimproved. In addition, the N responses of terrestrial plants decreased with increasinglatitude and increased with annual precipitation.• Dependence of the N responses of terrestrial plants on biological realms, func-tional types, tissues, other resources, and climatic factors revealed in this study canhelp to explain changes in species composition, diversity, community structure andecosystem functioning under global N enrichment. These findings are critical inimproving model simulation and projection of terrestrial carbon sequestration and itsfeedbacks to global climate change, especially when progressive N limitation is takeninto consideration.
Key words: biological realm, biomass, functional type, latitude, nitrogen, plant species,precipitation, temperature.
New Phytologist (2008) 179: 428–439
© The Authors (2008). Journal compilation © New Phytologist (2008) doi: 10.1111/j.1469-8137.2008.02488.x
Author for correspondence:Shiqiang WanTel: +86 10 6283 6512Fax: +86 10 8259 6146Email: [email protected]
Received: 1 February 2008Accepted: 30 March 2008
Introduction
Element nutrient has long been identified as one of the abioticfactors constraining plant growth, ever since Liebig’s ‘law ofthe minimum’, which describes crop production as beinglimited by the nutrient in the shortest supply. Among themineral nutrient elements, nitrogen (N) is recognized as themost widely limiting nutrient for plant growth both on landand in the sea (Vitousek & Howarth, 1991). Therefore, Nfertilization is widely used to improve soil N availability andincrease plant growth and productivity (Frink et al., 1999).With regard to the unprecedented global climate changerevealed by the four assessment reports of IntergovermentalPanel of Climate Change (IPCC) since 1990, it is of greatconcern whether the terrestrial biosphere acts as a net C sink
or source, that is, whether it poses negative or positivefeedback to climate change. The third assessment reportof the IPCC predicted 260–450 Pg C accumulation interrestrial ecosystems under atmospheric CO2 and climatechange, 16–34% of the expected anthropogenic CO2 emissionsin an intermediate emissions scenario (Cramer et al., 2001;IPCC, 2001). Based on the theory of ecological stoichiometry(Sterner & Elser, 2002), the CO2-climate projections on Caccumulation require 2.3–16.9 Pg N, which may not be metunder natural conditions (Hungate et al., 2003). Elevatedatmospheric CO2 concentration can increase N immobilizationby long-lived plant biomass and soil organic matter bystimulating plant growth, reducing N release and return tosoil from litter decomposition, and decreasing N fixation overtime (Hungate et al., 2004). Consequently, soil N availability
© The Authors (2008). Journal compilation © New Phytologist (2008) www.newphytologist.org New Phytologist (2008) 179: 428–439
Research 429
will gradually decline and progressively constrain plantgrowth and net primary production (NPP; Luo et al., 2004;Reich et al., 2006), leading to lower C sequestration interrestrial ecosystems than previously predicted. Thus, thecentral question of carbon–climate interactions is how Navailability impacts the capacity of the terrestrial ecosystem tosequester C from the atmosphere (Gruber & Galloway, 2008;Heimann & Reichstein, 2008). Therefore, better understandingof how and to what extent N restrains terrestrial plant growthand NPP (Elser et al., 2007; LeBauer & Treseder, 2008)is critical for a convincing projection of terrestrial Csequestration.
Along with global climate change, the global N cycle hasalso been profoundly altered by anthropogenic activities(Vitousek et al. 1997; Gruber & Galloway, 2008). Global Nenrichment has been widely found to cause changes in com-munity structure, reductions in species richness, and losses ofbiodiversity in various terrestrial biomes (Wedin & Tilman,1996, Robbink et al., 1998; Gough et al., 2000; Zavaletaet al., 2003; Stevens et al., 2004; Suding et al., 2005). Giventhe positive relationship of biodiversity and ecosystem stability(Tilman et al., 2006), declines in plant diversity under Ndeposition/addition may result in greater variability (lowerstability in reverse) in ecosystem function and services underenvironmental perturbations. Moreover, changes in communitystructure and biodiversity imply differential responses ofgrowth of terrestrial plant species and their competitive abilityunder N addition. Therefore, understanding how terrestrialplant species respond to N addition can help to explain thechanges in biodiversity, structure and functioning in terrestrialecosystems.
There are more than 300 000 plant species across the world(Millennium Ecosystem Assessment, 2005), which can becategorized into different biological realms (e.g. seed plant,spore plant) and various functional types (e.g. growth forms,life history, and photosynthetic pathways). These categoriesdiffer in their N use strategy and grow in highly variablehabitats depending on latitude and climate. Both habitatsand plant functional types can impact plant responses to Naddition and/or global change (Shaver & Chapin, 1980; Reichet al., 2001, 2003, 2004; Van Wijk et al., 2003). Regional andglobal patterns of tissue N concentrations of terrestrial plantshave been widely reported along geographic and climaticgradients (Güsewell, 2004; McGroddy et al., 2004; Reich &Oleksyn, 2004; Wright et al., 2004; He et al., 2006; Lovelocket al., 2007). Moreover, N fertilization has long been conductedfor a wide variety of plant species and terrestrial ecosystems(Frink et al., 1999; Reich et al., 2003). However, we still lackgeneral response patterns of terrestrial plants at the specieslevel to N addition (but, for NPP response, see Gough et al.,2000; Elser et al., 2007; LeBauer & Treseder, 2008), thusimpeding the simulation and projection of climate-terrestrialC cycling feedback loops as well as changes in terrestrialecosystem structure and functioning.
To reveal general response patterns of plant biomass and Nconcentration, we conducted a mixed-model meta-analysisusing data from 456 terrestrial plant species (not includingagricultural or horticultural, see Supplementary material,Tables S1–S3) in 304 published papers (see Text S1 and S2).In analyzing the response patterns of plant biomass and tissueN concentration to N addition, we incorporated factors suchas geographic regions (latitude), climate (precipitation andtemperature) gradients, biological realms (seed plant vs sporeplant), growth forms (woody vs herbaceous species, grass,forb, shrub, and tree), life histories (annual herb vs perennialherb), photosynthetic pathways (C3 herb vs C4 herb) andother functional types (broadleaved tree vs coniferous tree,deciduous tree vs evergreen tree, legume vs nonlegume).
Materials and Methods
Data collection
We extracted results for plant biomass and tissue Nconcentration from N addition studies after building adatabase by searching the Science Citation Index (SCI) of theInstitute of Scientific Information. References cited in a largenumber of N review articles and books were cross-checked toensure inclusion of pre-1987 articles, which are not listed inthe SCI. Any article published before June 2007 that metthe following criteria was included in our analysis: reportedresponses of biomass and/or N concentration at the specieslevel; species reported in the studies were those occurring innatural terrestrial ecosystems; means, standard deviations orstandard errors with sampling sizes for both control and Naddition treatments were provided. Articles that reportedresults on whole plants and parts of plants (e.g. leaf, shoot,root) were also included in our database. For the biomassanalyses, different methods of biomass estimation (e.g. directharvest for most herbaceous species and use of allometricrelationships for some tree species) were accepted because wedid not consider this to be a significant source of error in thisanalysis. Tree species at different ages were accepted. On thebasis of these criteria, articles that reported responses to Naddition at community level (Elser et al., 2007; LeBauer &Treseder, 2008) and agricultural and horticultural specieswere excluded from our analysis. In addition, results fromother proxy variables were not included in our analysis. Forexample, plant height or size was not included in biomassanalysis, and tissue N content (e.g. g per plant) was not usedin the analysis of N concentration. For biomass, the preferredmetric was biomass per unit area (g m!2), and other biomassdata (e.g. g per plant) were transformed if information on plotarea was provided in the paper. Otherwise, these data (e.g. gper plant) were also included in our analysis. Nitrogenconcentration was transformed as N percentage (%) and usedfor analysis. Data with means and standard deviations forboth control and N addition groups provided in the original
New Phytologist (2008) 179: 428–439 www.newphytologist.org © The Authors (2008). Journal compilation © New Phytologist (2008)
Research430
articles were used directly. Data (means and some measures ofvariance) presented in graphs were extracted by digitizing thefigures using SigmaScan (Systat Software Inc., San Jose, CA,USA).
In meta-analyses, independence of the data being synthesizedis assumed, and including multiple results from a single studyviolates this assumption, leading to alterations in the structureof the data, inflating samples and significance levels for sta-tistical tests (Wolf, 1986; Vander Werf, 1992). Thereforesome researchers have advocated the inclusion of only oneresult from each study (Vander Werf, 1992; Koricheva et al.,1998; Liao et al., 2008) when considering the lack of inde-pendence to be a serious problem for meta-analysis. However,the loss of information caused by the omission of multipleresults in each study may become a more serious problem thanthat caused by violating the assumption of independence(Hedges & Olkin, 1985; Gurevitch et al., 1992). Thus, manyresearchers have included more than one result from a singlestudy in their meta-analyses (Gurevitch et al., 1992; Wooster,1994; Curtis, 1996; Curtis & Wang, 1998; Maestre et al.,2005; Wang, 2007). Even though we made efforts to excludeduplicate results in different publications (e.g. some resultspublished as figures in one paper and as tables in another), alarge number of comparisons were used in our analysisbecause individual papers usually provided data from morethan one treatment (e.g. varying N concentrations), differentplant tissues (e.g. leaf, root), and/or different growing stages.Therefore, our estimates are not wholly independent. However,in order to minimize the degree of nonindependence in ourstudy, we first averaged those data obtained in the sameyear for the same species under identical N treatment.Then, we conducted the analyses between biological realmsand functional types again and found those patterns wereunchanged (data not shown) when compared with the resultsusing all data. On the other hand, we compared responses andsample sizes of different tissue types (leaf, root, branch/twigs,and wood) across woody species, in which distribution oftissue types could be more complex than herbaceous species.Although the uneven distributions of tissue types withincategories could result in statistical biases, the proportions ofeach tissue type did not change substantially between categories(Table S4). Thus, all the results reported in our study wereobtained by analyzing the data of all growing stages and tissuetypes.
We divided these data into two datasets: dataset 1 includedonly N addition without other resources (Text S1), and dataset2 contained studies on N addition together with otherresources (Text S2). In studies in dataset 2, if an effect of addi-tional resources (e.g. CO2 enrichment) on plants was given,we took this effect as the control, and the combined treatment(e.g. CO2 enrichment plus N addition) as the N additiontreatment. For dataset 1, because various parts of plants wereincluded, we first roughly divided all data into above-groundtissue, below-ground tissue, and whole plants. We then
compared responses between above-ground and below-groundgroups. We found that the responses among functional typeswere not changed except for N concentration among growthforms (Fig. S1). We also detected that responses betweenabove- and below-ground tissues were similar within a plantfunctional type. For example, biomass responses were greaterfor above- than for below-ground tissues in most plant func-tional types, whereas N concentration responses showed nodifferences between above- and below-ground groups in mostfunctional types (Fig. S1). On the other hand, sample sizes ofbelow-ground tissues were much smaller than above-groundtissues in all functional types. Thus, all the three categories(above-ground tissues, below-ground tissues, and whole plants)of plant biomass and N concentration were included in ourdatabase to increase the number of plant categories.
There is substantial variability (from 1 g m!2 in Lowe et al.(2003) to 100 g m!2 in Loveland & Ungar (1983)) in theamount of N added among different studies. In order to testwhether the amount of N added has an impact on plantresponses, we first roughly partitioned added N into low(< 10 g N m!2) and high amounts (> 10 g N m!2) with similarsample size (Table S5). In addition, the large sample size of someplant functional types (herbaceous species, woody species,grass, forb, tree, and shrub) allowed us to further divide Namount into the following classes: < 5, 5–10, 10–15, 15–20,20–25, and > 25 g N m!2. For dataset 2, we categorized the Naddition treatments into control (added N alone), facilitated(added N together with other resources), and limited(added N but limited by other abiotic factors). Because of thelarge sample size, we further tested the responses of added Ntogether with phosphorus (P) addition and CO2 enrichment.
We also collected other background information relevantto the data from the papers, including latitude, temperatureand precipitation. For those studies with no geographical andclimate information, we used data from the study sites wherethe experiments were conducted. Treatments that containedadding water or changing temperature were not included inthe analysis of the impact of climate on plant N responses. Forthis type of analysis, we divided this background informationinto the following classes – latitude: 0–10, 10–20, 20–30,30–40, 40–50, 50–60, and 60–70°; mean annual temperature(MAT): < 0, 0–5, 5–10, 10–15, 15–20, 20–25, and > 25°C;and mean annual precipitation (MAP): < 300, 300–600,600–900, 900–1200, 1200–1500, and > 1500 mm.
Meta-analysis
The meta-analysis followed the techniques described in Wanet al. (2001). We used the natural log-transformed ratio(loge r) of plant biomass and tissue N concentration atelevated (Xe) to ambient (Xc) N to estimate the effect size ofN treatment. A mixed-effects model was used in this analysiswith the assumption that there are random variations in effectsizes among the diverse studies included in this synthesis.

© The Authors (2008). Journal compilation © New Phytologist (2008) www.newphytologist.org New Phytologist (2008) 179: 428–439
Research 431
Each individual observation is weighted by the reciprocal ofthe mixed-model variance (Curtis & Wang, 1998). The totalheterogeneity of effect sizes among studies (QT) is partitionedinto within-group (Qw) and between-group (Qb) heterogeneity.The Q statistic approximately follows a "2 distribution, whichallows a significance test of the null hypothesis that allresponse ratios are equal. If Qb is larger than a critical value,an independent variable has a significant influence on theresponse ratio (Gurevitch & Hedges, 1993). Confidenceinterval (CI) on effect-size estimates was generated bybootstrapping the data using MetaWin 2.1 (Sinauer AssociatesInc., Sunderland, MA, USA). Nitrogen addition was consideredto have a significant effect on a variable if the bootstrap CI ofits percentage changes did not overlap zero. Responses ofplant species were considered to significantly differ if theirbootstrap CIs did not overlap (Gurevitch & Hedges, 1993).Statistical significance was tested at the P < 0.05 level.
Results
Dependence of N responses of terrestrial plants on biological realms and functional types
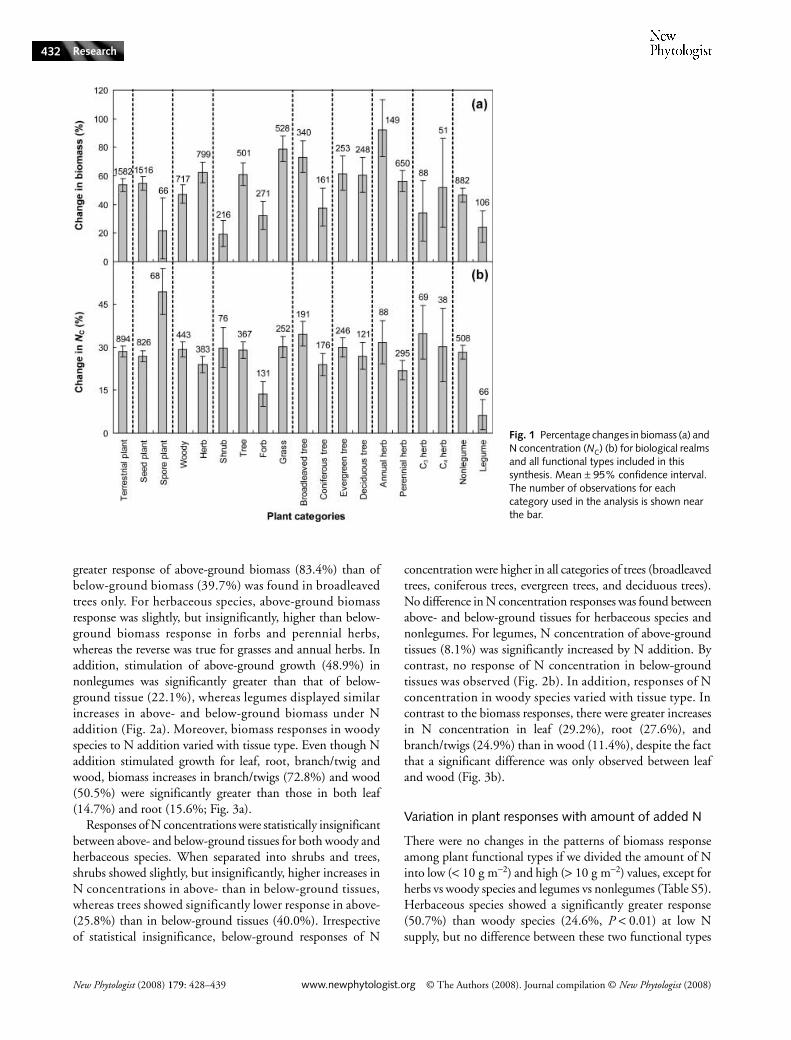
Across all the terrestrial plant species included in the presentstudy, N addition increased biomass and N concentration by53.6 and 28.5%, respectively. However, plants respondeddifferently between the biological realms (Table 1, Fig. 1). Naddition stimulated more biomass in seed plants (54.7%)than in spore plants (21.4%). However, a greater increase inN concentration in spore plants (49.4%) than in seed plants(26.8%) was observed in response to N addition (Fig. 1).
Nitrogen responses of terrestrial plants also varied withgrowth forms. Biomass responses of herbaceous species(62.3%) were greater than those of woody species (47.2%;Fig. 1a). By contrast, N addition increased tissue N con-centration more in woody (29.2%) than in herbaceous species(23.9%; Table 1, Fig. 1b). N addition-induced enhancementof biomass in trees (61.0%) and grasses (78.7%) was muchhigher than that in shrubs (19.3%) and forbs (32.1%; Fig. 1a).
Positive responses of N concentration in forbs (13.6%) weresignificantly lower than those in grasses (30.1%), shrubs(29.8%), and trees (29.0%; Table 1, Fig. 1b).
For tree species, broadleaved trees responded more positivelythan coniferous trees in term of both biomass (73.1 vs 37.5%)and N concentration (34.6 vs 24.0%). However, no differencesin the responses of either biomass or tissue N concentrationwere found between evergreen and deciduous trees (Fig. 1b).For herbaceous species, N addition caused greater increases inN concentration in annual (31.6%) than in perennial herbs(21.9%), and consequently led to much higher biomassstimulation for annual (92.4%) than perennial (56.1%) herbs.Nevertheless, responses of C3 herbs did not differ from C4herbs in either biomass or N concentration (Table 1 andFig. 1). It is expected that the competitive ability of N-fixingspecies will decrease under N addition compared withnonN-fixing species. Consistent with this proposition is thefact that growth stimulation of legumes by N addition wassignificantly lower than that of nonlegumes in both biomass(23.9 vs 46.5%) and tissue N concentration (6.3 vs 28.4%;Table 1, Fig. 1).
N responses of above- and below-ground plant tissues varied with functional groups
Between-group (plant functional types) N response patternsof above-ground tissues were similar to those of below-groundtissues (Fig. S1). When comparing within each group, biomassresponses to N addition in seed plants were significantlygreater in above- (56.1%) than in below-ground tissue (35.5%),but no differences in the responses of N concentration werefound between above- and below-ground tissues (Fig. 2).Most functional types showed lower biomass responses inbelow- than in above-ground tissues. Response of above-groundbiomass (47.9%) was significantly higher than that ofbelow-ground biomass (23.0%) in woody species, whileno difference was observed in herbaceous species. For woodyspecies, there was a greater increase in above- than in below-ground biomass in both shrubs and trees. For tree species, a
Table 1 Between-group heterogeneity (Qb) of nitrogen (N) effect size of biomass and N concentration across different biological realms and functional types
Categories
Biomass N concentration
Qb P Qb P
Biological realms Seed plant, spore plant 7.3 < 0.01 34.2 < 0.001Growth forms Woody, herbaceous 9.6 < 0.01 7.0 < 0.01
Grass, forb, shrub, tree 95.8 < 0.001 39.7 < 0.001Life history Annual herb, perennial herb 13.2 < 0.001 5.5 < 0.05Photosynthesis pathways C3 herb, C4 herb 1.0 0.32 0.4 0.55Other functional types Broadleaved, coniferous tree 15.5 < 0.001 13.2 < 0.001
Deciduous, evergreen tree 0.0 0.90 1.0 0.31Legume, nonlegume 12.3 < 0.001 51.3 < 0.001
New Phytologist (2008) 179: 428–439 www.newphytologist.org © The Authors (2008). Journal compilation © New Phytologist (2008)
Research432
greater response of above-ground biomass (83.4%) than ofbelow-ground biomass (39.7%) was found in broadleavedtrees only. For herbaceous species, above-ground biomassresponse was slightly, but insignificantly, higher than below-ground biomass response in forbs and perennial herbs,whereas the reverse was true for grasses and annual herbs. Inaddition, stimulation of above-ground growth (48.9%) innonlegumes was significantly greater than that of below-ground tissue (22.1%), whereas legumes displayed similarincreases in above- and below-ground biomass under Naddition (Fig. 2a). Moreover, biomass responses in woodyspecies to N addition varied with tissue type. Even though Naddition stimulated growth for leaf, root, branch/twig andwood, biomass increases in branch/twigs (72.8%) and wood(50.5%) were significantly greater than those in both leaf(14.7%) and root (15.6%; Fig. 3a).
Responses of N concentrations were statistically insignificantbetween above- and below-ground tissues for both woody andherbaceous species. When separated into shrubs and trees,shrubs showed slightly, but insignificantly, higher increases inN concentrations in above- than in below-ground tissues,whereas trees showed significantly lower response in above-(25.8%) than in below-ground tissues (40.0%). Irrespectiveof statistical insignificance, below-ground responses of N
concentration were higher in all categories of trees (broadleavedtrees, coniferous trees, evergreen trees, and deciduous trees).No difference in N concentration responses was found betweenabove- and below-ground tissues for herbaceous species andnonlegumes. For legumes, N concentration of above-groundtissues (8.1%) was significantly increased by N addition. Bycontrast, no response of N concentration in below-groundtissues was observed (Fig. 2b). In addition, responses of Nconcentration in woody species varied with tissue type. Incontrast to the biomass responses, there were greater increasesin N concentration in leaf (29.2%), root (27.6%), andbranch/twigs (24.9%) than in wood (11.4%), despite the factthat a significant difference was only observed between leafand wood (Fig. 3b).
Variation in plant responses with amount of added N
There were no changes in the patterns of biomass responseamong plant functional types if we divided the amount of Ninto low (< 10 g m!2) and high (> 10 g m!2) values, except forherbs vs woody species and legumes vs nonlegumes (Table S5).Herbaceous species showed a significantly greater response(50.7%) than woody species (24.6%, P < 0.01) at low Nsupply, but no difference between these two functional types
Fig. 1 Percentage changes in biomass (a) and N concentration (NC) (b) for biological realms and all functional types included in this synthesis. Mean ± 95% confidence interval. The number of observations for each category used in the analysis is shown near the bar.

© The Authors (2008). Journal compilation © New Phytologist (2008) www.newphytologist.org New Phytologist (2008) 179: 428–439
Research 433
was found at high N supply. Consistent with the overallpattern between legumes and nonlegumes, both legumes(18.5%) and nonlegumes (23.4%) were stimulated by additionof low amounts of N. High amounts of N increased biomassof nonlegumes (43.3%), but did not affect legume growth.
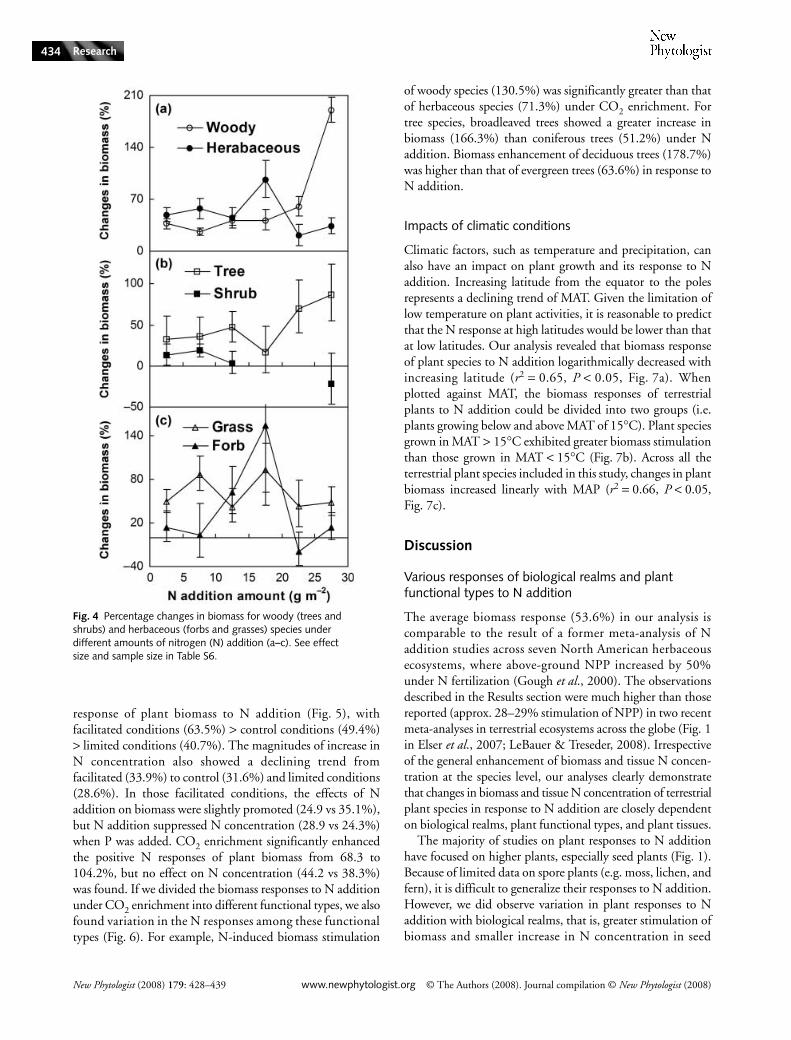
When plotted along the N addition gradient, biomassresponses of herbaceous species reached a peak when theadded N was between 15 and 20 g m!2 (Fig. 4a). Furthermore,woody species showed an increasing trend of biomass stimu-lation along the gradient of added N (Fig. 4a). For woodyspecies, responses of trees tended to increase with amountof N, with the exception of 15–20 g N m!2. Because of thesample size, we could not test the response of shrubs at 15–20and 20–25 g N m!2. However, growth of shrubs was onlystimulated under the addition of < 10 g N m!2, and therewere no responses to the addition of 10–15 and > 25 g N m!2
(Fig. 4b). For herbaceous species, all amounts of supplied Nstimulated grass growth, whereas only amounts of between 10and 20 g N m!2 showed a significantly positive effect on forbgrowth (Fig. 4c).
Impacts of other resources
Growth of terrestrial plants is under the influence of multipleabiotic factors in addition to N availability. Irrespective ofstatistical insignificance, we detected relative differences in the
Fig. 2 Comparisons of above- (open bars) and below-ground (closed bars) responses to nitrogen (N) addition within plant functional types in biomass (a) and N concentration (NC) (b). Mean ± 95% confidence interval. The number of observations for each category used in the analysis is shown near the bar.
Fig. 3 Percentage changes in biomass (a) and N concentration (NC) (b) for different tissue types of woody species. Mean ± 95% confidence interval. The number of observations for each category used in the analysis is shown near the bar.
New Phytologist (2008) 179: 428–439 www.newphytologist.org © The Authors (2008). Journal compilation © New Phytologist (2008)
Research434
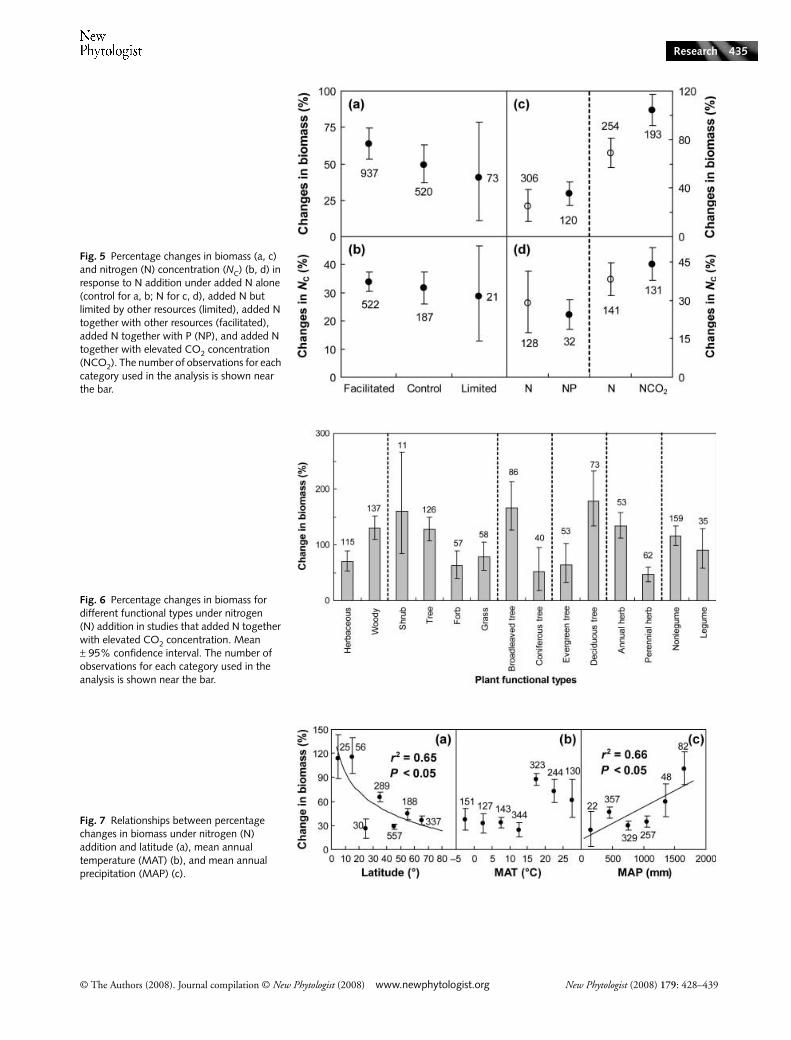
response of plant biomass to N addition (Fig. 5), withfacilitated conditions (63.5%) > control conditions (49.4%)> limited conditions (40.7%). The magnitudes of increase inN concentration also showed a declining trend fromfacilitated (33.9%) to control (31.6%) and limited conditions(28.6%). In those facilitated conditions, the effects of Naddition on biomass were slightly promoted (24.9 vs 35.1%),but N addition suppressed N concentration (28.9 vs 24.3%)when P was added. CO2 enrichment significantly enhancedthe positive N responses of plant biomass from 68.3 to104.2%, but no effect on N concentration (44.2 vs 38.3%)was found. If we divided the biomass responses to N additionunder CO2 enrichment into different functional types, we alsofound variation in the N responses among these functionaltypes (Fig. 6). For example, N-induced biomass stimulation
of woody species (130.5%) was significantly greater than thatof herbaceous species (71.3%) under CO2 enrichment. Fortree species, broadleaved trees showed a greater increase inbiomass (166.3%) than coniferous trees (51.2%) under Naddition. Biomass enhancement of deciduous trees (178.7%)was higher than that of evergreen trees (63.6%) in response toN addition.
Impacts of climatic conditions
Climatic factors, such as temperature and precipitation, canalso have an impact on plant growth and its response to Naddition. Increasing latitude from the equator to the polesrepresents a declining trend of MAT. Given the limitation oflow temperature on plant activities, it is reasonable to predictthat the N response at high latitudes would be lower than thatat low latitudes. Our analysis revealed that biomass responseof plant species to N addition logarithmically decreased withincreasing latitude (r2 = 0.65, P < 0.05, Fig. 7a). Whenplotted against MAT, the biomass responses of terrestrialplants to N addition could be divided into two groups (i.e.plants growing below and above MAT of 15°C). Plant speciesgrown in MAT > 15°C exhibited greater biomass stimulationthan those grown in MAT < 15°C (Fig. 7b). Across all theterrestrial plant species included in this study, changes in plantbiomass increased linearly with MAP (r2 = 0.66, P < 0.05,Fig. 7c).
Discussion
Various responses of biological realms and plant functional types to N addition
The average biomass response (53.6%) in our analysis iscomparable to the result of a former meta-analysis of Naddition studies across seven North American herbaceousecosystems, where above-ground NPP increased by 50%under N fertilization (Gough et al., 2000). The observationsdescribed in the Results section were much higher than thosereported (approx. 28–29% stimulation of NPP) in two recentmeta-analyses in terrestrial ecosystems across the globe (Fig. 1in Elser et al., 2007; LeBauer & Treseder, 2008). Irrespectiveof the general enhancement of biomass and tissue N concen-tration at the species level, our analyses clearly demonstratethat changes in biomass and tissue N concentration of terrestrialplant species in response to N addition are closely dependenton biological realms, plant functional types, and plant tissues.
The majority of studies on plant responses to N additionhave focused on higher plants, especially seed plants (Fig. 1).Because of limited data on spore plants (e.g. moss, lichen, andfern), it is difficult to generalize their responses to N addition.However, we did observe variation in plant responses to Naddition with biological realms, that is, greater stimulation ofbiomass and smaller increase in N concentration in seed
Fig. 4 Percentage changes in biomass for woody (trees and shrubs) and herbaceous (forbs and grasses) species under different amounts of nitrogen (N) addition (a–c). See effect size and sample size in Table S6.
© The Authors (2008). Journal compilation © New Phytologist (2008) www.newphytologist.org New Phytologist (2008) 179: 428–439
Research 435
Fig. 5 Percentage changes in biomass (a, c) and nitrogen (N) concentration (NC) (b, d) in response to N addition under added N alone (control for a, b; N for c, d), added N but limited by other resources (limited), added N together with other resources (facilitated), added N together with P (NP), and added N together with elevated CO2 concentration (NCO2). The number of observations for each category used in the analysis is shown near the bar.
Fig. 6 Percentage changes in biomass for different functional types under nitrogen (N) addition in studies that added N together with elevated CO2 concentration. Mean ± 95% confidence interval. The number of observations for each category used in the analysis is shown near the bar.
Fig. 7 Relationships between percentage changes in biomass under nitrogen (N) addition and latitude (a), mean annual temperature (MAT) (b), and mean annual precipitation (MAP) (c).

New Phytologist (2008) 179: 428–439 www.newphytologist.org © The Authors (2008). Journal compilation © New Phytologist (2008)
Research436
plants than in spore plants (Fig. 1). Nevertheless, because ofthe limited number of case studies and sample size in sporeplants in comparison with the seed plants, we are not able todraw a solid conclusion about how N addition will affect therelationship between seed and spore plants, community struc-ture and ecosystem functioning in natural terrestrial ecosystemswhere they coexist.
The differential responses among growth forms suggestthat N enrichment has the potential to change plant speciescomposition, community structure, and biodiversity in terres-trial ecosystems (Wedin & Tilman, 1996; Robbink et al.,1998; Gough et al., 2000; Zavaleta et al., 2003; Stevens et al.,2004; Suding et al., 2005). Our finding of greater biomassresponse in herbaceous than in woody species is inconsistentwith those observed at the ecosystem level, in which NPP isenhanced more in forests and shrublands than in grasslands(Fig. 2 in Elser et al., 2007). However, our results showed thatgrowth responses of herbaceous species are enhanced morethan woody species at relatively low N supply (< 20 g N m!2),whereas biomass increases in woody species are greater thanthose of herbaceous species at high N supply (Fig. 4). Thisresult indicates that herbaceous species need less N thanwoody species, possibly owing to their smaller stature, drybiomass, and N demand as well as faster N turnover via litterdecomposition and release. For herbaceous species, grassgrowth was stimulated by all of the N supply levels, whileincreases in forb growth occurred exclusively at the medianlevels, suggesting that grasses, as a whole, are well adapted tostronger fluctuations in soil N availability than are forbs. Forwoody species, our findings that N addition stimulatedgreater biomass in trees than in shrubs are inconsistent withthe observed findings in a former meta-analysis focusing ontropical ecosystems, in which shrubs respond more stronglythan trees in respect of biomass accumulation (Lawrence,2003). Tree growth was stimulated by almost all amountsof N supplied, while biomass of shrub (Fig. 4) was onlyincreased by low amounts of N, indicating that tree growth ismore sensitive to N supply than that of shrubs.
Differences in life history for herbaceous species can affecttheir N use strategy and responses to changes in N supply. Incomparison with perennial herbs that maximize resourceconservation, annual herbs have greater resource (e.g. N)acquisition (Chapin, 1980). As a consequence, annual herbsusually have higher N concentrations and lower N use efficiencythan perennial herbs under similar N supply conditions.Therefore, annual herbs are likely to show greater biomassstimulation than perennial herbs under improved soil Navailability (Fig. 1a). It has been predicted that N additionfavors C3 species more than C4 species because of the lower Nuse efficiency of C3 species (Wedin & Tilman, 1996; Sage &Kubien, 2003). However, in this analysis, there were insignif-icant differences between C3 and C4 species. The greaterresponses of nonlegumes than legumes are in line with theprediction that legumes will lose their advantage over other
nonlegume species if N availability is increased (Suding et al.,2005). For woody species, our results showing no differencebetween the responses of deciduous and evergreen trees areinconsistent with the prediction that evergreen trees havemore efficient at absorbing and utilizing mineral nutrientresources (Chapin, 1980) than deciduous trees. The greaterresponses of broadleaved than coniferous trees suggest anadvantage of broadleaved over coniferous trees under N addi-tion. The different responses between those covarying groups(e.g. broadleaved vs deciduous trees, coniferous vs evergreentrees) could be caused by the various responses in the subcate-gories, which include evergreen broadleaved trees (+91.5%),deciduous broadleaved trees (+61.5%), evergreen coniferoustrees (+37.7%), and deciduous coniferous trees (+51.9%).
N responses of terrestrial plants vary with tissues
Greater stimulation of above-ground than below-groundgrowth in seed plants suggests amelioration of below-groundresource limitation and changes in above- and below-groundresource allocation under N addition. Greater resourceallocation to above-ground growth indicates that N additioncould shift below-ground competition for nutrients to above-ground competition for light resources (Tilman, 1987; Sudinget al., 2005). These results suggest that N addition mayincrease the risk of local extinction for those species that areable to tolerate low below-ground amounts of N (e.g. perennialherb, C4 herb, and legumes) (Chapin, 1980; Craine et al.,2002; Suding et al., 2005).
Different tissues and organs function differently in woodyspecies. As absorbing tissues for resources (water, nutrient,and carbon), roots (especially fine roots) and leaves aremetabolically more active than branches and wood (trunk)and need more N for physiological activities. Therefore, Naddition leads to greater increases in N concentration in rootsand leaves than in branches and wood (Fig. 3b). Enhancedplant C uptake as a consequence of improved soil N availabilityand tissue N concentration results in stimulation of plantgrowth, which is mainly reflected by increased biomass accu-mulation in branches and wood (Fig. 3a) that function asstructure, storage, and supporting organs (Chapin et al., 2002).
Impacts of other resources on N effect
Based on Liebig’s ‘law of the minimum’, many ecosystems inwhich biological processes were once limited by N are nowlimited more by other resources under N addition (Vitouseket al., 1997). Our analysis demonstrates that the positiveresponse of plants to N addition can be enhanced orsuppressed when other resources are provided or limited,suggesting mediation of the growth responses of terrestrialplant species to N addition by other resources (water, P, K,CO2, etc.). The augmented positive N effect under additionof P observed in this study is consistent with the observations
© The Authors (2008). Journal compilation © New Phytologist (2008) www.newphytologist.org New Phytologist (2008) 179: 428–439
Research 437
at the ecosystem level reported by Elser et al. (2007) thatsimulation of NPP in response to N addition is significantlyenhanced by P fertilization. The greater responses of plantbiomass to N addition together with CO2 enrichment suggestthat the capacity of C sequestration in the terrestrial biosphereunder elevated atmospheric CO2 concentration can beenhanced by sustainable N supply (Reich et al., 2006). Thesignificantly greater biomass stimulation of woody species(130.1%) induced by N addition than herbaceous species(70.3%) under elevated CO2 (Fig. 6) indicates that woodyvegetation could sequester more C than herbaceous vegetationunder elevated CO2 as long as soil N availability can meet therequirements for plant uptake. By contrast, progressive Nlimitation (Luo et al. 2004) is more likely to occur in woodythan in herbaceous vegetation if soil N supply is notsustainable for plant uptake.
Influences of geographical and climatic factors on plant N responses
Given its impact on numerous biological processes, temperaturecan influence plant growth and its responses to N addition.We observed a logarithmically declining trend of plantresponses to N addition along the latitude gradient fromthe equator to the poles representing temperature gradients(Fig. 7a), suggesting constraints of low rather than hightemperature on plant growth and its N response across theglobe. Our result is inconsistent with a recent meta-analysis(LeBauer & Treseder, 2008), which found no correlationbetween N response of ANPP and latitude across all studies.In addition, given that N addition usually tends to favorspecies with lower N use efficiency (Wedin & Tilman, 1996),changes in leaf N concentration (the reverse is N use efficiency)along geographic gradients (McGroddy et al., 2004; Reich &Oleksyn, 2004; Wright et al., 2004; Lovelock et al., 2007) canalso impact the geographical patterns of plant response to Naddition. Linear increases in N concentrations in greenmangrove leaf tissue with increasing latitude from 4 to 37°(Lovelock et al., 2007) imply lower N use efficiency and thusgreater biomass responses at high-latitude regions. However,our analysis showed a declining trend of biomass stimulationof terrestrial plants along the latitudinal gradient, suggestingthat temperature plays a more important role than plantN traits in regulating biomass stimulation under N additionalong the latitudinal gradient.
However, the obvious division into two groups of the Nresponses of terrestrial plants (lower at low temperature andhigher at high temperature) by a temperature threshold of15°C (Fig. 7b) suggests some confounding factors mayinfluence the effect of temperature on the growth responses ofterrestrial plants to N addition. Similarly, MAT explains verylittle of the total variation in leaf N concentration of plants(Reich & Oleksyn, 2004). In a recent meta-analysis (LeBauer& Treseder, 2008), the greatest responses of forest NPP to N
addition occurred between 15 and 20°C, irrespective of thelinear increase in the N effect with MAT. Although geographicdistribution of plant species could contribute to the patternsunder different MAT (e.g. herbaceous vs woody species orevergreen vs deciduous species; Reich & Oleksyn, 2004),there was no distinct difference in species distribution between10–15 and 15–20°C in our analysis (data not shown). Thus,the underlying mechanisms for the step increases in the Nresponses of terrestrial plants around MAT of 15°C remain tobe elucidated in the future.
The linear increases in the responses of plant biomass to Naddition along the precipitation gradient (Fig. 7c) suggestthat growth of terrestrial plants is co-limited by N and wateravailability. Water availability can be more important than Navailability in regulating plant growth in regions with lowannual precipitation, where the positive responses of plantgrowth to N addition are likely to be suppressed by waterlimitation. When water availability is no longer a limiting factorfor plant growth under high annual precipitation, terrestrialplants often exhibit greater stimulation of biomass productionin response to improved soil N availability. The increasingtrend of the N responses of terrestrial plants with mean annualprecipitation across the globe demonstrated in our meta-analysis is inconsistent with those findings by Hooper &Johnson (1999), who found that there is no increase in therelative response of above-ground net primary productivity(ANPP) to N with increasing precipitation based on severalfertilization experiments in arid, semi-arid, and subhumidecosystems.
Conclusions
The intensive alteration of global N cycles associated withanthropogenic activities (Vitousek et al., 1997; Gruber &Galloway, 2008) has the potential to profoundly change plantgrowth and NPP in terrestrial ecosystems, with consequentimpacts on global C cycles and climate change. Although it isdifficult to extrapolate our species-level responses to terrestrialecosystems directly, our results and previous findings (Elseret al., 2007; LeBauer & Treseder, 2008) indicate that Nlimitation for plant growth is widespread at both the speciesand ecosystem levels in terrestrial biomes (Vitousek &Howarth, 1991). In addition, our observations of substantialvariation in the plant responses to N addition with biologicalrealms, plant functional types, plant tissues, other resources,and climate factors are critical for understanding the changesin plant species composition, diversity, community structure,and ecosystem functioning in terrestrial biomes. The findingsin this and previous data syntheses (Elser et al., 2007;LeBauer & Treseder, 2008) will facilitate model simulationand projection of terrestrial C sequestration and its feedbacksto global climate change, especially when progressive Nlimitation is taken into consideration (Hungate et al., 2003;Luo et al., 2004; Reich et al., 2006).
New Phytologist (2008) 179: 428–439 www.newphytologist.org © The Authors (2008). Journal compilation © New Phytologist (2008)
Research438
Acknowledgements
Peter Curtis, Xianzhong Wang, Shuli Niu, Hongjun Wang,and three anonymous reviewers provided valuable commentsand suggestions on earlier versions of this manuscript. Theauthors thank Wenjing Cheng for help with data collection.This study was supported financially by the National NaturalScience Foundation of China (30521002, 90511006) andChinese Academy of Science (Hundred Talents Program).
References
Chapin FS III. 1980. The mineral nutrition of wild plants. Annual Review of Ecology, Evolution, and Systematics 11: 233–260.
Chapin FS III, Matson PA, Mooney HA. 2002. Principles of terrestrial ecosystem ecology. New York, NY, USA: Springer-Verlag New York, Inc.
Craine JM, Tilman D, Wedin D, Reich P, Tjoelker M, Knops J. 2002. Functional traits, productivity and effects on nitrogen cycling of 33 grassland species. Functional Ecology 16: 563–574.
Cramer W, Bondeau A, Woodward FI, Prentice IC, Betts RA, Brovkin V, Cox PM, Fisher V, Foley JA, Friend AD et al. 2001. Global response of terrestrial ecosystem structure and function to CO2 and climate change: results from six dynamic global vegetation models. Global Change Biology 7: 357–373.
Curtis PS. 1996. A meta-analysis of leaf gas exchange and N in trees grown under elevated carbon dioxide. Plant, Cell & Environment 19: 127–137.
Curtis PS, Wang XZ. 1998. A meta-analysis of elevated CO2 effects on woody plant mass, form, and physiology. Oecologia 113: 299–313.
Elser JJ, Bracken MES, Cleland EE, Gruner DS, Harpole WS, Hillebrand H, Ngai JT, Seabloom EW, Shurin JB, Smith JE. 2007. Global analysis of nitrogen and phosphorus limitation of primary producers in freshwater, marine and terrestrial ecosystems. Ecology Letters 10: 1135–1142.
Frink CR, Waggoner PE, Ausubel JH. 1999. Nitrogen fertilizer: retrospect and prospect. Proceedings of the National Academy of Sciences, USA 96: 1175–1180.
Gough L, Osenberg CW, Gross KL, Collins SL. 2000. Fertilization effects on species density and primary productivity in herbaceous plant communities. Oikos 89: 428–439.
Gruber N, Galloway JN. 2008. An earth-system perspective of the global nitrogen cycle. Nature 451: 293–296.
Gurevitch J, Hedges LV. 1993. Meta-analysis: combining the results of independent experiments. In: Scheiner SM, Gurevitch J, eds. Design and analysis of ecological experiments. New York, NY, USA: Chapman and Hall, 378–389.
Gurevitch J, Morrow LL, Wallace A, Walsh JS. 1992. A meta-analysis of competition in field experiments. The American Naturalist 140: 539–572.
Güsewell S. 2004. N:P ratios in terrestrial plants: variation and functional significance. New Phytologist 164: 243–266.
He JS, Fang JY, Wang ZH, Flynn DFB, Geng Z. 2006. Stoichiometry and large-scale patterns of leaf carbon and nitrogen in the grassland biomes of China. Oecologia 149: 115–122.
Hedges L, Olkin I. 1985. Statistical methods for metaanalysis. Orlando, FL, USA: Academic Press.
Heimann M, Reichstein M. 2008. Terrestrial ecosystem carbon dynamics and climate feedbacks. Nature 451: 289–292.
Hooper D, Johnson L. 1999. Nitrogen limitation in dryland ecosystems: responses to geographical and temporal variation in precipitation. Biogeochemistry 46: 247–293.
Hungate BA, Dukes JS, Shaw MR, Luo Y, Field CB. 2003. Nitrogen and climate change. Science 302: 1512–1513.
Hungate BA, Stiling PD, Dijkstra P, Johnson DW, Ketterer ME, Hymus GJ, Hinkle CR, Drake BG. 2004. CO2 elicits long-term decline in nitrogen fixation. Science 304: 1291.
IPCC (Intergovernmental Panel on Climate Change). 2001. Climate change 2001: the scientific basis. New York, NY, USA: Cambridge University Press.
Koricheva J, Larsson S, Haukioja E, Keinanen M. 1998. Regulation of woody plant secondary metabolism by resource availability: hypothesis testing by means of meta-analysis. Oikos 83: 212–226.
Lawrence D. 2003. The response of tropical tree seedlings to nutrient supply: meta-analysis for understanding a changing tropical landscape. Journal of Tropical Ecology 19: 239–250.
LeBauer DS, Treseder KK. 2008. Nitrogen limitation of net primary productivity in terrestrial ecosystems is globally distributed. Ecology 89: 371–379.
Liao C, Peng R, Luo Y, Zhou X, Wu X, Fang C, Chen J, Li B. 2008. Altered ecosystem carbon and nitrogen cycles by plant invasion: a meta-analysis. New Phytologist 177: 706–714.
Loveland DG, Ungar IA. 1983. The effect of nitrogen fertilization on the production of Halophytes in an inland salt marsh. American Midland Naturalist 109: 346–354.
Lovelock CE, Feller IC, Ball MC, Ellis J, Sorrell B. 2007. Testing the growth rate vs. geochemical hypothesis for latitudinal variation in plant nutrients. Ecology Letters 10: 1154–1163.
Lowe PN, Lauenroth WK, Burke IC. 2003. Effects of nitrogen availability on competition between Bromus tectorum and Bouteloua gracilis. Plant Ecology 167: 247–254.
Luo YQ, Su B, Currie WS, Dukes JS, Finzi A, Hartwig U, Hungate B, McMurtrie RE, Oren R, Parton WJ et al. 2004. Progressive nitrogen limitation of ecosystem responses to rising atmospheric carbon dioxide. BioScience 54: 731–739.
Maestre FT, Valladares F, Reynolds JF. 2005. Is the changes of plant-plant interactions with abiotic stress predictable? A meta-analysis of field results in arid environments. Journal of Ecology 93: 748–757.
McGroddy ME, Daufresne T, Hedin LO. 2004. Scaling of C: N: P stoichiometry in forests worldwide: implications of terrestrial Redfield-type ratios. Ecology 85: 2390–2401.
Millennium Ecosystem Assessment. 2005. Ecosystems and human well-being. Washington, DC, USA: Global Assessment Reports Island Press.
Reich PB, Buschena C, Tjoelker MG, Warge K, Knops J, Tilman D, Machado JL. 2003. Variation in growth rate and ecophysiology among 34 grassland and savanna species under contrasting N supply: a test of functional group differences. New Phytologist 157: 617–631.
Reich PB, Hobbie SE, Ellsworth TLDS, West JB, Tilman D, Knops JMH, Naeem S, Trost J. 2006. Nitrogen limitation constrains sustainability of ecosystem response to CO2. Nature 440: 922–925.
Reich PB, Oleksyn J. 2004. Global patterns of plant leaf N and P in relation to temperature and latitude. Proceedings of the National Academy of Sciences, USA 101: 11 001–11 006.
Reich PB, Tilman D, Craine J, Ellsworth D, Tjoelker MG, Knops J, Wedin D, Naeem S, Bahauddin D, Goth J et al. 2001. Do species and functional groups differ in acquisition and use of C, N and water under varying atmospheric CO2 and N availability regimes? A field test with 16 grassland species. New Phytologist 150: 435– 448.
Reich PB, Tilman D, Naeem S, Ellsworth DS, Knops J, Craine J, Wedin D, Trost J. 2004. Species and functional group diversity independently influence biomass accumulation and its response to CO2 and N. Proceedings of the National Academy of Sciences, USA 101: 10101–10106.
Robbink R, Hornung M, Roelofs JGM. 1998. The effects of air-borne nitrogen pollutants on species diversity in natural and semi-natural European vegetation. Journal of Ecology 86: 717–738.
Sage RF, Kubien DS. 2003. Quo vadis C4? An ecophysiological perspective on global change and the future of C4 plants. Photosynthesis Research 77: 209–225.
Shaver GR, Chapin FS III. 1980. Response to fertilization by various plant growth forms in an Alaskan tundra: nutrient accumulation and growth. Ecology 61: 662–675.
© The Authors (2008). Journal compilation © New Phytologist (2008) www.newphytologist.org New Phytologist (2008) 179: 428–439
Research 439
Sterner RW, Elser JJ. 2002. Ecological stoichiometry: the biology of elements from molecules to the biosphere. Princeton, NJ, USA: Princeton University Press.
Stevens CJ, Dise NB, Mountford JO, Gowing DJ. 2004. Impact of nitrogen deposition on the species richness of grasslands. Science 303: 1876–1879.
Suding KN, Collins SL, Gough L, Clark C, Cleland EE, Gross KL, Milchunas DG, Pennings S. 2005. Functional- and abundance-based mechanisms explain diversity loss due to N fertilization. Proceedings of the National Academy of Sciences, USA 102: 4387–4392.
Tilman D. 1987. Secondary succession and the pattern of plant dominance along experimental nitrogen gradients. Ecological Monographs 57: 189–214.
Tilman D, Reich PB, Knops JMH. 2006. Biodiversity and ecosystem stability in a decade-long grassland experiment. Nature 441: 629–632.
Van Wijk MT, Clemmensen KE, Shaver GR, Williams W, Callaghan TV, Chapin FS III, Cornelissen JHC, Gough L, Hobbie SE, Jonasson S et al. 2003. Long-term ecosystem level experiments at Toolik Lake, Alaska, and at Abisko, northern Sweden: generalizations and differences in ecosystem and plant type responses to global change. Global Change Biology 10: 105–123.
Vander Werf E. 1992. Lack’s clutch size hypothesis: an examination of the evidence using meta-analysis. Ecology 73: 1699–1705.
Vitousek PM, Aber J, Howarth RW, Likens GE, Matson PA, Schindler DW, Schlesinger WH, Tilman D. 1997. Human alteration of the global nitrogen cycling: sources and consequences. Ecological Applications 7: 737–750.
Vitousek PM, Howarth RW. 1991. Nitrogen limitation on land and in the sea: how can it occur? Biogeochemistry 13: 87–115.
Wan SQ, Hui D, Luo Y. 2001. Fire effects on nitrogen pools and dynamics in terrestrial ecosystems: a meta-analysis. Ecological Applications 11: 1349–1365.
Wang XZ. 2007. Effects of species richness and elevated carbon dioxide on biomass accumulation: a synthesis using meta-analysis. Oecologia 152: 595–605.
Wedin DA, Tilman D. 1996. Influence of nitrogen loading and species composition on the carbon balance of grasslands. Science 274: 1720–1723.
Wolf FM. 1986. Meta-analysis: quantitative methods for research synthesis. Beverly Hills, CA, USA: SAGE Publications.
Wooster D. 1994. Predator impacts on stream benthic prey. Oecologia 99: 7–15.
Wright IJ, Reich PB, Westoby M, Ackerly DD, Baruch Z, Bongers F, Cavender-Bares J, Chapin T, Cornelissen JHC, Diemer M et al. 2004. The worldwide leaf economics spectrum. Nature 428: 821–827.
Zavaleta ES, Shaw MR, Chiariello NR, Mooney HA, Field CB. 2003. Additive effects of simulated climate changes, elevated CO2, and nitrogen deposition on grassland diversity. Proceedings of the National Academy of Sciences, USA 100: 7650–7654.
Supplementary Material
The following supplementary material is available for thisarticle:
Fig. S1 Two figures showing between-group N responses forabove- and below-ground tissues.
Text S1 List of studies used for analyzing effects of Naddition treatment only in this meta-analysis.
Text S2 List of studies used for analyzing impacts of otherresources on the N responses in this meta-analysis.
Table S1 List of plant species used for biomass in this meta-analysis
Table S2 List of plant species used for N concentration inthis meta-analysis.
Table S3 Raw data in Excel format used in the meta-analysis.
Table S4 Distribution of sample size for different tissue typesin woody species in this meta-analysis
Table S5 Weighted biomass response ratios (RR++) andnumber of observations for all plant categories at low and highamounts of N
Table S6 Weighted response ratios (RR++) and number ofobservations in biomass for some functional types(herbaceous species, woody species, grass, forb, tree, andshrub) under different amounts of added N
This material is available as part of the online article from:http://www.blackwell-synergy.com/doi/abs/10.1111/j.1469-8137.2008.02488.x(This link will take you to the article abstract).
Please note: Blackwell Publishing are not responsible for thecontent or functionality of any supplementary materialssupplied by the authors. Any queries (other than missingmaterial) should be directed to the journal at New PhytologistCentral Office.