Embed Size (px)
Citation preview
GLOBAL REFINERY CATALYST MARKET (2009-2014)
CH 1059 | $4650 | 2010
MarketsandMarkets Research
108 West 13th Street, Wilmington, DE 19801, County of New Castle
Tel. No.: 1-888-989-8004
Email: [email protected]
R e p o r t D e s c r i p t i o n
T a b l e o f C o n t e n t s
L i s t o f T a b l e s
S a m p l e T a b l e s
R e l a t e d R e p o r t s
A b o u t M a r k e t s a n d M a r k e t s
The intended audience of this report includes:
• Refinery catalyst producers
• Crude oil refining companies
• Metal suppliers
• Chemical companies
• Research laboratories
Stakeholders
2
• To define the global refinery catalysts market and other aligned
markets
• To measure the global refinery catalysts market and its various
sub-segments and components.
• To analyze the market structure and the factors driving and
inhibiting overall market growth
• To identify the trends, gaps. and opportunities in each micro-
markets
• To analyze and forecast the revenues of market segments with
• To track and analyze recent developments such as alliances, jointrespect to North America, Europe Middle East Africa (EMEA),
ventures, mergers and acquisitions in the industry.Asia Pacific (APAC) and Rest of the World (RoW)
• To strategically profile market players and analyze their core
competencies in each segment of the refinery catalysts market
Report Description
Global Refinery Catalyst Market (2009-2014)
CH 1059 | $4650 | 2010
Key Take Away
The changing trends in the refinery catalyst industry have been environmental pollution. Though the refinery catalyst market is
largely shaped by the increased rate of production and already witnessing a rising trend of development, the companies in
consumption of petroleum-based products, coupled with the this market will still be required to make substantial R&D
growing environmental concerns and the depleting natural crude investments to keep pace with the dynamic petroleum refining
oil reserves. Once driven by oversupply and low profit margins, industry. Refinery catalysts are expected to continue being the
the refinery catalyst industry is now led by increased demand and lifeline of the petroleum refinery industry.
profit margins. Refinery catalysts have enabled the petroleum
industry to simultaneously increase throughputs while reducing
Report Description
Markets Covered
This report segments the global refinery catalyst market into the
submarkets for products and ingredients. It details all the major
types of refinery catalysts, including fluid catalytic cracking (FCC),
h y d r o p r o c e s s i n g , i s o m e r i z a t i o n , a l k y l a t i o n , a n d
hydrodesulphurization catalysts. The report also covers the
markets for major catalysts ingredients, including different types of
metals, zeolites, and chemical compounds. An in-depth
geographic analysis is conducted for each market and its sub-
segments in the four major regional markets of North America,
EMEA, APAC, and RoW.
Table of Contents
2. Summary
3. Market overview
3.1 Defining The Global Refinery Catalyst Market 3.8 Key Factors Influencing The Refinery Catalyst Market3.2 Structure Of The Refinery Catalyst Market
3.9 Major R&d Initiatives3.3 Refinery Catalyst Application Market Prospects3.10 Geographic Analysis3.4 Relative Potential Matrix3.11 Fcc Receiving Maximum Patents3.5 Opportunity Analysis
3.6 Factors Inhibiting Market Growth
3.7 Competitive Landscape
3
1. Introduction
Market Overview Competitive Landscape
Refinery Catalyst Market Dynamics Geographic Analysis
Refinery Catalysts Environmental Issues
Major Ingredients For Refinery Catalyst Oil Industry Trends
Selection Parameters For Refinery Catalysts Patent Analysis
EXECUTIVE SUMMARY
1.1 Key take aways
1.2 Report description
1.3 Market Covered
1.4 Stakeholders
1.5 Research Methodology
Global Refinery Catalyst Market (2009-2014)
CH 1059 | $4650 | 2010
4. Refinery Catalyst Market Dynamics
4.1 Drivers 4.2 Restraints
4.1.1 Environmental Regulations 4.2.1 Depleting Crude Oil Reserves
4.1.2 Changing Trends 4.2.2 Increased Manufacturing Costs
4.1.3 Surging Energy Demand 4.2.3 Weakening Global Economy
4.1.4 Rising Consumption of Petroleum-based 4.3 OpportunitiesDerivatives 4.3.1 R&D To Reduce Cost And Improve Quality of
4.1.5 Demand For Maintaining High Octane CatalystsNumber 4.3.2 Backward Integration
4.1.6 Technology Developments 4.3.3 Catalyst Specifications
4
Table of Contents
5.1 Crude Oil Refining Process 5.7.1 Steam/hydrocarbon Reforming
5.2 Fluid Catalytic Cracking (fcc) Catalyst 5.7.1.1 Desulfurization
5.3 Hydroprocessing Catalyst 5.7.1.2 Catalytic steam reforming
5.3.1 Hydrotreating Catalyst 5.7.1.3 Shift conversion
5.3.2 Hydrocracking Catalyst 5.7.1.4 Gas purification
5.4 Hydrodesulphurization Catalyst 5.7.1.5 Methanation
5.4.1 Sweetening Catalyst 5.7.1.6 Use of refinery catalysts insteam/hydrocarbon reforming5.5 Isomerization Catalyst
5.8 Other Refinery Catalysts5.6 Alkylation Catalyst5.8.1 Environmental Safety Catalyst5.7 Hydrogen Manufacturing5.8.2 Sulfur Recovery Catalyst
5. Types Of Refinery Catalysts
Global Refinery Catalyst Market (2009-2014)
CH 1059 | $4650 | 2010
6. Major Ingredients For Refinery Catalyst
6.1 Zeolites 6.2.3.3 Cobalt (Co)
6.1.1 Natural Zeolites 6.2.3.4 Nickel (Ni)
6.1.2 Synthetic Zeolites 6.2.3.5 Other transition and base metals
6.2 Metals 6.2.3.5.1 Iron (Fe)
6.2.1 Precious Metals 6.2.3.5.2 Zirconium (Zr)
6.2.1.1 Platinum (Pt) 6.2.3.6 Manganese (Mn)
6.2.1.2 Palladium (Pd) 6.2.3.6.1 Chromium (cr)
6.2.1.3 Gold (Au) 6.2.3.6.2 Potassium (k)
6.2.1.4 Rhenium (Re) 6.2.3.6.3 Phosphorus (P)
6.2.1.5 Other precious metals 6.2.3.6.4 Bismuth (Bi)
6.2.2 Rare Earth Metals 6.3 Chemical Compounds
6.2.3 Transition And Base Metals 6.3.1 Sulfuric Acid (h2so4) And Hydrofluoric Acid
6.2.3.1 Molybdenum (Mo) 6.3.2 Calcium Carbonate (caco3)
6.2.3.2 Tungsten (W) 6.3.3 Other Chemical Compounds
7. Parameters For Selection Of Refinery Catalysts
7.1 Chemical Structure Of The Final Fuel Product 7.5 Surface Area
7.2 Regioselectivity 7.6 Other Parameters
7.3 Stereospecificity
7.4 Reactivity
5
Table of Contents
11. Oil Industry Trends
10. Environmental Issues
Global Refinery Catalyst Market (2009-2014)
CH 1059 | $4650 | 2010
8. Competitive Landscape
8.1 Developments In Hydrocracking Catalysts (2008-2009)
8.2 Market Share Analysis
8.3 Benchmarking Analysis of Key Industry Players
8.4 Competitive Positioning of Top Players
9. Geographical Analysis
9.1 Global Refinery Catalyst Capacity 9.4 APAC Refinery Catalyst Market
9.2 North American Refinery Catalyst Market 9.5 Row Refinery Catalyst Market
9.3 EMEA Refinery Catalyst Market
10.1 Overview 10.3 Opportunities
10.2 Regulatory Measures To Reduce Environmental 10.4 Impact of RegulationsPollution
11.1 Consumption Trends 11.2.1 Refinery Capacity Is The Key Factor
11.1.1 Production Trends 11.2.2 Opportunities In Emerging Economies
11.2 Transition In Market Potential
12. Company Profiles
12.1 ALBEMARLE CORP. 12.12 KUWAIT CATALYST CO.
12.2 AXENS 12.13 MERICHEM CO.
12.3 BASF CATALYST LLC 12.14 NIPPON KETJEN CO. LTD.
12.4 CATALYTIC DISTILLATION TECHNOLOGIES 12.15 OMG UK LTD.
12.5 CHEVRON LUMMUS GLOBAL LLC 12.16 SHELL GLOBAL SOLUTIONS
12.6 EXXON MOBIL CORP. 12.17 SINOPEC CATALYST CO.
12.7 HALDOR TOPSOE 12.18 SUD-CHEMIE AG
12.8 HEADWATERS TECHNOLOGY INNOVATION 12.19 UNICAT CATALYST TECHNOLOGIES, INC.GROUP 12.20 UOP LLC
12.9 INTERCAT 12.21 W R GRACE & CO.12.10 JGC 12.22 ZEOLYST12.11 JOHNSON MATTHEY PLC
6
Table of Contents
Global Refinery Catalyst Market (2009-2014)
CH 1059 | $4650 | 2010
13. Patent Analysis
13.1 U.S. Leads The Global Patent Scenario
13.2 Uop Llc Leads The Global Patents Scenario
Appendix
Patents For United States
Patents For Europe
Patents For Japan
7
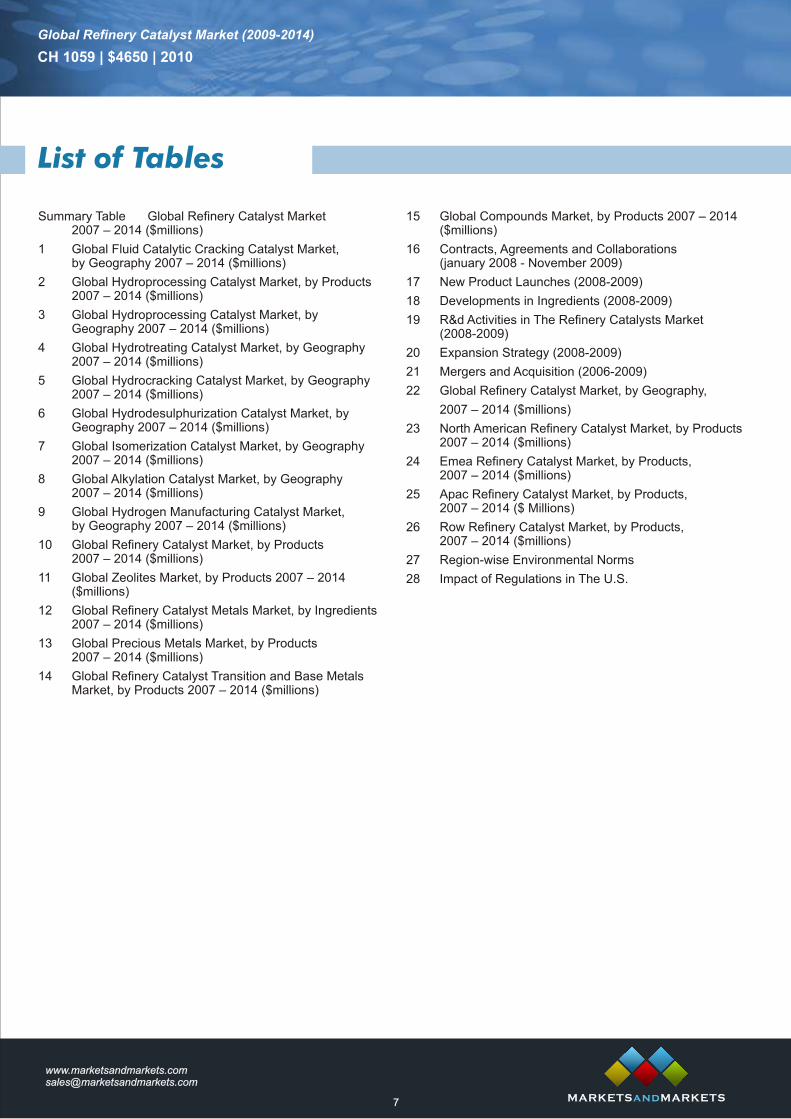
Summary Table Global Refinery Catalyst Market 15 Global Compounds Market, by Products 2007 – 20142007 – 2014 ($millions) ($millions)
1 Global Fluid Catalytic Cracking Catalyst Market, 16 Contracts, Agreements and Collaborationsby Geography 2007 – 2014 ($millions) (january 2008 - November 2009)
2 Global Hydroprocessing Catalyst Market, by Products 17 New Product Launches (2008-2009)2007 – 2014 ($millions) 18 Developments in Ingredients (2008-2009)
3 Global Hydroprocessing Catalyst Market, by 19 R&d Activities in The Refinery Catalysts MarketGeography 2007 – 2014 ($millions) (2008-2009)
4 Global Hydrotreating Catalyst Market, by Geography 20 Expansion Strategy (2008-2009)2007 – 2014 ($millions)
21 Mergers and Acquisition (2006-2009)5 Global Hydrocracking Catalyst Market, by Geography
22 Global Refinery Catalyst Market, by Geography,2007 – 2014 ($millions)2007 – 2014 ($millions)6 Global Hydrodesulphurization Catalyst Market, by
Geography 2007 – 2014 ($millions) 23 North American Refinery Catalyst Market, by Products 2007 – 2014 ($millions)7 Global Isomerization Catalyst Market, by Geography
2007 – 2014 ($millions) 24 Emea Refinery Catalyst Market, by Products,2007 – 2014 ($millions)8 Global Alkylation Catalyst Market, by Geography
2007 – 2014 ($millions) 25 Apac Refinery Catalyst Market, by Products,2007 – 2014 ($ Millions)9 Global Hydrogen Manufacturing Catalyst Market,
by Geography 2007 – 2014 ($millions) 26 Row Refinery Catalyst Market, by Products,2007 – 2014 ($millions)10 Global Refinery Catalyst Market, by Products
2007 – 2014 ($millions) 27 Region-wise Environmental Norms
11 Global Zeolites Market, by Products 2007 – 2014 28 Impact of Regulations in The U.S.($millions)
12 Global Refinery Catalyst Metals Market, by Ingredients 2007 – 2014 ($millions)
13 Global Precious Metals Market, by Products2007 – 2014 ($millions)
14 Global Refinery Catalyst Transition and Base Metals Market, by Products 2007 – 2014 ($millions)
List of Tables
Global Refinery Catalyst Market (2009-2014)
CH 1059 | $4650 | 2010
8
List of Figures
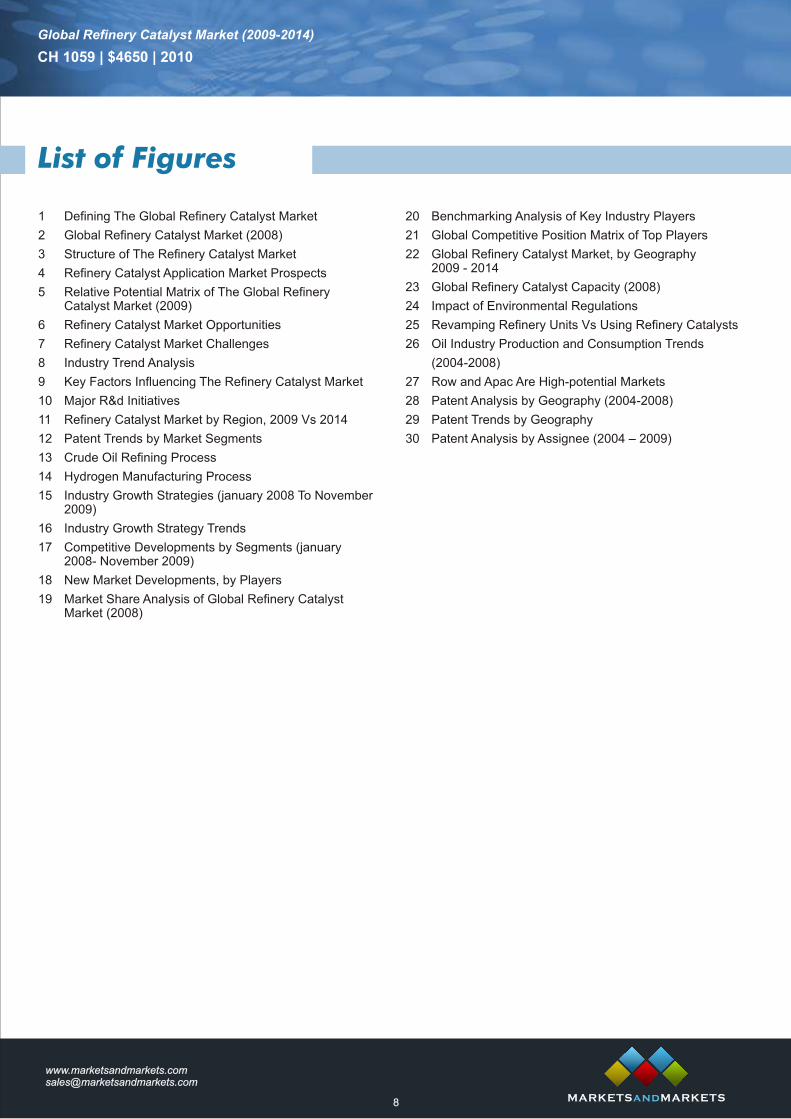
1 Defining The Global Refinery Catalyst Market 20 Benchmarking Analysis of Key Industry Players
2 Global Refinery Catalyst Market (2008) 21 Global Competitive Position Matrix of Top Players
3 Structure of The Refinery Catalyst Market 22 Global Refinery Catalyst Market, by Geography2009 - 20144 Refinery Catalyst Application Market Prospects
23 Global Refinery Catalyst Capacity (2008)5 Relative Potential Matrix of The Global Refinery Catalyst Market (2009) 24 Impact of Environmental Regulations
6 Refinery Catalyst Market Opportunities 25 Revamping Refinery Units Vs Using Refinery Catalysts
7 Refinery Catalyst Market Challenges 26 Oil Industry Production and Consumption Trends
8 Industry Trend Analysis (2004-2008)
9 Key Factors Influencing The Refinery Catalyst Market 27 Row and Apac Are High-potential Markets
10 Major R&d Initiatives 28 Patent Analysis by Geography (2004-2008)
11 Refinery Catalyst Market by Region, 2009 Vs 2014 29 Patent Trends by Geography
12 Patent Trends by Market Segments 30 Patent Analysis by Assignee (2004 – 2009)
13 Crude Oil Refining Process
14 Hydrogen Manufacturing Process
15 Industry Growth Strategies (january 2008 To November 2009)
16 Industry Growth Strategy Trends
17 Competitive Developments by Segments (january2008- November 2009)
18 New Market Developments, by Players
19 Market Share Analysis of Global Refinery CatalystMarket (2008)
Global Refinery Catalyst Market (2009-2014)
CH 1059 | $4650 | 2010
9
Sample Tables
Global refinery catalyst market
2007 2008 2009 2014 CAGR 2009-2014
Fluid Catalytic Cracking(FCC) catalysts
Hydroprocessing Catalysts
Isomerization Catalysts
Alkylation Catalysts
Hydrodesulphurization catalysts
Hydrogen manufacturing catalysts
Others
Total
p e Tes
Sam labl
Global refinery hydroprocessing catalysts market
2007 2008 2009 2014 CAGR 2009-2014
Hydrotreating catalysts
Hydrocracking catalysts
Total Sample Tables
Refinery catalysts by ingredients
2007 2008 2009 2014 CAGR 2009-2014
Metals
Zeolites
Acids and compounds
Total
Sample TablesProduct
Global Refinery Catalyst Market (2009-2014)
CH 1059 | $4650 | 2010
10
Sample Tables
Global refinery catalysts market by Geography
2007 2008 2009 2014 CAGR 2009-2014
North America
EMEA
APAC
ROW
Total
eSampl Tables
Product
Global zeolite market for refinery catalysts
2007 2008 2009 2014 CAGR 2009-2014
Precious metals
Rare earth metals
Transition and other metals
Total
m e bl sSa pl Ta e
Global Refinery Catalyst Market (2009-2014)
CH 1059 | $4650 | 2010
11
Key Questions
The Report Answers The Following Questions:
• Which are the high growth segments/cash cows?
• How is the market segmented in terms of products (catalysts), and ingredients?
• What are market estimates and forecast?
• Which markets are doing well and which are not?
• Where are the gaps and opportunities?
• Which are the key playing fields?
• How is the competitive outlook?
• Who are the main players in each of the segments?
Global Refinery Catalyst Market (2009-2014)
CH 1059 | $4650 | 2010
12
Disclaimer
Global Refinery Catalyst Market (2009-2014)
CH 1059 | $4650 | 2010
MarketsandMarkets strategic analysis services are limited publications containing valuable market information provided to a
select group of customers in response to orders. Our customers acknowledge when ordering that MarketsandMarkets strategic
analysis services are for our customers’ internal use and not for general publication or disclosure to third parties.
Quantitative market information is based primarily on interviews and therefore, is subject to fluctuation.
MarketsandMarkets takes no responsibility for any incorrect information supplied to us by manufacturers or users.
No part of this strategic analysis service may be given, lent, resold or disclosed to non-customers without written permission.
Furthermore, no part may be reproduced, stored in a retrieval system or transmitted in any form or by any means, electronic,
mechanical, photocopying, recording or otherwise, without the permission of the publisher.
For information regarding permission, contact:
Tel: 1-888-989-8004
Email: [email protected]
Copyright © 2010 MarketsandMarkets
All Rights Reserved. This document contains highly confidential information and is the sole property of MarketsandMarkets.
No part of it may be circulated, copied, quoted, or otherwise reproduced without the approval of MarketsandMarkets.
13
About MarketsandMarkets
We publish about 120 reports a Our clients value our reports
year across 10 main industries. especially for the market insight
The reports are exhaustive, we provide along with the market
detailing about 50 micro markets n u m b e r s . O u r t e a m s o f
and product segments, and specialized market analysts and
featuring about 80 to 100 market domain experts work within a
data summary tables, 50 short structured research process to
company profiles, a five-level deliver well-analyzed market
market breakdown, overviews of r e p o r t s t o F o r t u n e 1 0 0 0
more than 300 patents, as well as companies globally.
analyses of the strategic and
competitive landscape.Click here to learn more about us
Related Reports
Renewable Chemicals (2009 - 2014)
Industrial biotechnology or white biotechnology uses
cells and enzymes to produce bioenergy, biomaterials
and other industrial products. The report will analyze
the commercialization of the applications,
technologies and products like renewable chemicals.
Report code: CH 1052 Price: $4650
Global Electroact ive Polymers Market
(2009 - 2014)
Electroactive Polymers (EAPs) are used as sensors;
and may be used in the future to build artificial
muscles. They can be reshaped if a voltage is passed
through them. This report will provide a global view of
the future applications and trends of EAPs, main
players in this space and the latest technologies used
in manufacturing these polymers.
Report code: CH 1055 Price: $4650
Global Refinery Catalyst Market (2009-2014)
CH 1059 | $4650 | 2010