Embed Size (px)
Citation preview
DISCLOSURE APPENDIX AT THE BACK OF THIS REPORT CONTAINS IMPORTANT DISCLOSURES, ANALYST CERTIFICATIONS, AND THE STATUS OF NON-US ANALYSTS. US Disclosure: Credit Suisse does and seeks to do business with companies covered in its research reports. As a result, investors should be aware that the Firm may have a conflict of interest that could affect the objectivity of this report. Investors should consider this report as only a single factor in making their investment decision.
CREDIT SUISSE SECURITIES RESEARCH & ANALYTICS BEYOND INFORMATION®
Client-Driven Solutions, Insights, and Access
20 April 2016
Asia Pacific/Thailand
Equity Research
Electric Utilities (Utilities TH (Asia))
Global Power Synergy
(GPSC.BK) INITIATION
Organic growth powerhouse
■ Initiate with OUTPERFORM. We initiate coverage on GPSC, a utilities
flagship under PTT group, with an OUTPERFORM rating and a DCF-based
target price of Bt34 (potential upside of 30.8%). Standing out from its Thai
peers, GPSC is geared up to strike organic growth from both existing
committed capacities and growing demand from PTT group. GPSC is our
new top pick in the sector, replacing EGCO.
■ Widening margin is structural. Margins of GPSC’s electricity sales to
industrial customers (IUs) are on a structurally rising trend. Selling price of
electricity to IUs are based on government’s announced tariffs, which will
likely rise with higher portion of expensive renewable power in Thailand’s
total power generation. This would result in expanding margins as a major
portion of its costs is natural gas. Electricity sales to IUs account for 35% of
FY16E revenue and is expected to witness a 17% CAGR in 2016E-18E. The
expected rise in tariffs is estimated to account for Bt6/share in our DCF-
based NAV.
■ Growing demand from PTT group. Apart from the committed capacity
expansion of 579 MW, a minimum of 120 MW of high-margin cogeneration
plants may have to be built to support potential new demand from PTT
group. Another Bt5 could be added into our DCF-based NAV from these
potential new demands from PTT group.
■ Valuation reasonable relative to growth. GPSC's premium valuation can
be explained by superior growth; core earnings is expected to witness 29%
CAGR in 2016-18E, vs peers’ -0.9% to 6%. To us, the market has not yet
factored in the benefit from structural margin expansion, and more clarity on
its growth plans. Key risks are development risks and plants' reliability.
Share price performance
80
90
100
110
120
22
24
26
28
May-15 Sep-15 Jan-16
Price (LHS) Rebased Rel (RHS)
The price relative chart measures performance against the
THAILAND SET IDX which closed at 1413.97 on 20/04/16
On 20/04/16 the spot exchange rate was Bt34.92/US$1
Performance over 1M 3M 12M Absolute (%) 2.0 15.0 — — Relative (%) 0.5 1.5 — —
Financial and valuation metrics
Year 12/15A 12/16E 12/17E 12/18E Revenue (Bt mn) 22,443.7 21,369.0 26,753.7 33,033.9 EBITDA (Bt mn) 3,162.6 3,677.0 4,669.5 5,913.8 EBIT (Bt mn) 2,080.3 2,485.8 3,019.3 4,033.2 Net profit (Bt mn) 1,906.0 2,163.7 2,684.3 3,606.5 EPS (CS adj.) (Bt) 1.40 1.44 1.79 2.41 Change from previous EPS (%) n.a. Consensus EPS (Bt) n.a. 1.43 1.70 2.36 EPS growth (%) -0.5 3.2 24.1 34.4 P/E (x) 18.6 18.0 14.5 10.8 Dividend yield (%) 3.7 3.7 3.9 4.6 EV/EBITDA (x) 13.5 12.4 10.2 7.7 P/B (x) 1.0 1.0 1.0 1.0 ROE (%) 6.0 5.8 7.0 9.0 Net debt/equity (%) 10.2 17.2 22.8 16.7
Source: Company data, Thomson Reuters, Credit Suisse estimates.
Rating OUTPERFORM* [V] Price (20 Apr 16, Bt) 26.00 Target price (Bt) 34.00¹ Upside/downside (%) 30.8 Mkt cap (Bt mn) 38,956 (US$ 1,116) Enterprise value (Bt mn) 45,450 Number of shares (mn) 1,498.30 Free float (%) 25.0 52-week price range 27.8 - 21.5 ADTO - 6M (US$ mn) 2.8
*Stock ratings are relative to the coverage universe in each
analyst's or each team's respective sector.
¹Target price is for 12 months.
[V] = Stock considered volatile (see Disclosure Appendix).
Research Analysts
Wattana Punyawattanakul
66 2 614 6215
20 April 2016
Global Power Synergy
(GPSC.BK) 2
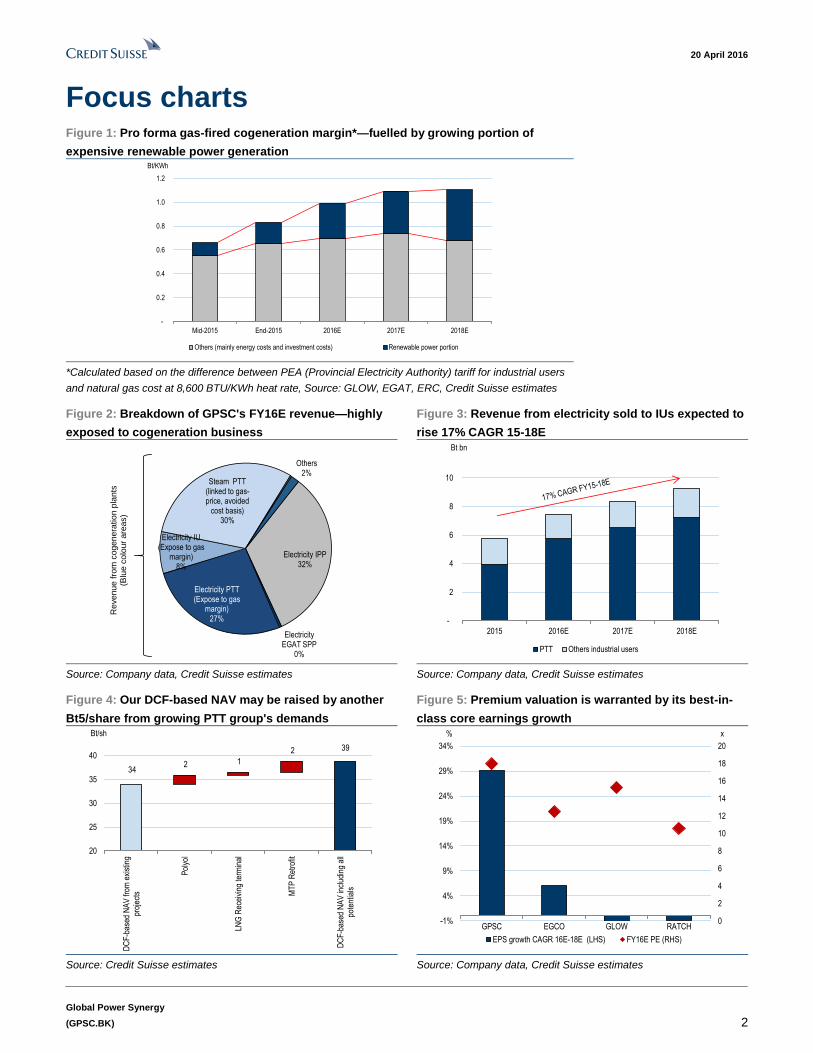
Focus charts Figure 1: Pro forma gas-fired cogeneration margin*—fuelled by growing portion of
expensive renewable power generation
-
0.2
0.4
0.6
0.8
1.0
1.2
Mid-2015 End-2015 2016E 2017E 2018E
Bt/KWh
Others (mainly energy costs and investment costs) Renewable power portion
*Calculated based on the difference between PEA (Provincial Electricity Authority) tariff for industrial users
and natural gas cost at 8,600 BTU/KWh heat rate, Source: GLOW, EGAT, ERC, Credit Suisse estimates
Figure 2: Breakdown of GPSC's FY16E revenue—highly
exposed to cogeneration business
Figure 3: Revenue from electricity sold to IUs expected to
rise 17% CAGR 15-18E
Electricity IPP32%
Electricity EGAT SPP
0%
Electricity PTT(Expose to gas
margin)27%
Electricity IU(Expose to gas
margin)8%
Steam PTT(linked to gas-price, avoided
cost basis)30%
Others2%
Revenue f
rom
cogenera
tion p
lants
(Blu
e c
olo
ur
are
as)
-
2
4
6
8
10
2015 2016E 2017E 2018E
Bt bn
PTT Others industrial users
Source: Company data, Credit Suisse estimates Source: Company data, Credit Suisse estimates
Figure 4: Our DCF-based NAV may be raised by another
Bt5/share from growing PTT group's demands
Figure 5: Premium valuation is warranted by its best-in-
class core earnings growth
34 2 1
2 39
20
25
30
35
40
DC
F-b
ased
NA
V fr
om e
xist
ing
proj
ects
Pol
yol
LNG
Rec
eivi
ng te
rmin
al
MT
P R
etro
fit
DC
F-b
ased
NA
V in
clud
ing
all
pote
ntia
ls
Bt/sh
0
2
4
6
8
10
12
14
16
18
20
-1%
4%
9%
14%
19%
24%
29%
34%
GPSC EGCO GLOW RATCH
x%
EPS growth CAGR 16E-18E (LHS) FY16E PE (RHS)
Source: Credit Suisse estimates Source: Company data, Credit Suisse estimates
20 April 2016
Global Power Synergy
(GPSC.BK) 3
Organic growth powerhouse Initiate with OUTPERFORM
We initiate coverage on Global Power Synergy (GPSC), a utilities flagship under PTT
group, with an OUTPERFORM rating and a DCF-based target price of Bt34 (30.8%
potential upside). Standing out from its Thai peers, GPSC is geared up to strike organic
growth from both existing committed capacities and growing demand from PTT group.
GPSC is our new top pick in the sector, replacing EGCO.
Widening cogeneration margin is structural
Margins of GPSC’s electricity sales to industrial customers (IUs) are on a structurally rising
trend. Selling price for electricity units to IUs is based on government’s announced tariffs
which will be rising with higher portion of expensive renewable power in Thailand’s total
power generation. Nearly 1,800 MW of new renewable power capacity are planned to start
operation in 2016-17. Power generation from renewable energy sources now accounts for
7% of total power generation in Thailand, and is projected to reach 12% in 2018. This
would result in expanding margins as a major portion of its costs is natural gas. Electricity
sales to IUs accounts for 35% of FY16E revenue and is expected to rise 17% CAGR 16E-
18E. The expected rise in tariffs is estimated to account for Bt6/share in our DCF-based
NAV.
Growing demands from PTT group
Among its peers, GPSC is likely to grow most in the domestic market, regardless of
government's policy. GPSC is different from other utilities because it has PTT group as a
cornerstone customer.
GPSC can ride on the new investment cycle with companies under the same group such
as PTTGC. A minimum of 120 MW of high-margin cogeneration plants could be built to
support rising demand from PTT Group, including Polyol project and Map Tha Put retrofit
project at PTTGC and LNG receiving terminal phase 2 at PTT's parent company.
Importantly, electricity and steam from cogeneration power plants sold to PTT group earn
higher margin and could further benefit from the structurally widening cogeneration margin.
Apart from the committed capacity expansion of 579 MW, a minimum of 120 MW of high-
margin cogeneration plants may have to be built to support potential new demand from
PTT group. Another Bt5 could be added into our DCF-based NAV from this potential new
demand from PTT group.
Valuation reasonable relative to growth
It warrants a premium valuation thanks to its superior earnings growth. GPSC’s core
earnings are expected to witness 29% CAGR (16E-18E), whereas those of its Thai peers
are expected to be at only -0.9% to 6%. GPSC is trading at FY16E P/E 17.7x, versus Thai
peers’ average of 13.9x. We see improving sentiment towards the stock, and the recent
rally in share price is believed to be a result of higher-than-expected dividend payment and
cyclical margin expansion from lower gas costs (shown in 4Q15 results). GPSC has still
underperformed EGCO and GLOW by 7-8% in the past three months. We believe that the
market is yet to likely factor in the benefit from long-term structural margin expansion (as a
result of larger mix of renewable power generation) and potential new demands from PTT
group. GPSC is an under-owned name. The stock has not yet appeared in the radar of
foreign investors. Foreign ownership lodges at less than 1%, and presently, there are only
5 analysts tracking the name (according to Bloomberg). Key risks are development risks
and plants' reliability.
GPSC is our new top pick
for the sector, replacing
EGCO
GPSC is on course for a
structural tailwind benefit
from long-term margin
expansions at its
cogeneration business.
Minimum of 120 MW of
high-margin cogeneration
plants could be built to
support expanding demand
from PTT group
GPSC’s core earnings is
expected to grow 29%
CAGR (16E-18E), where
those of its Thai peers is
expected to be at only
-0.9% to 6%
20 April 2016
Global Power Synergy
(GPSC.BK) 4
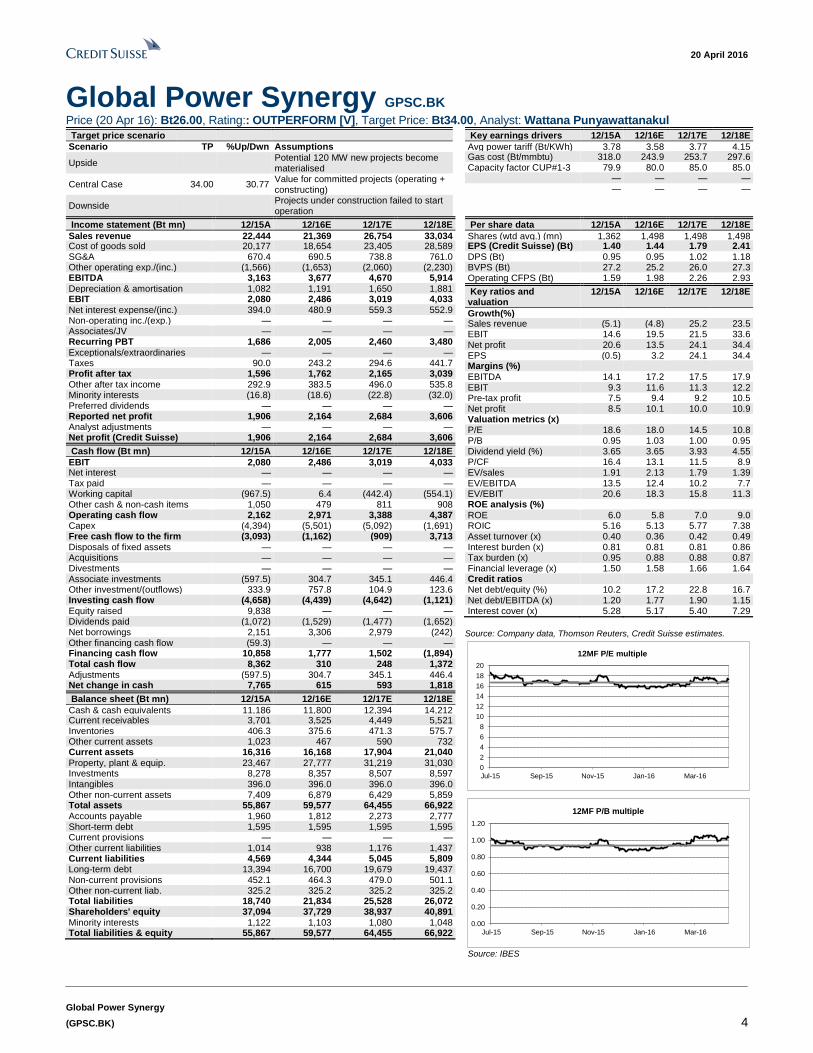
Global Power Synergy GPSC.BK Price (20 Apr 16): Bt26.00, Rating:: OUTPERFORM [V], Target Price: Bt34.00, Analyst: Wattana Punyawattanakul
Target price scenario
Scenario TP %Up/Dwn Assumptions
Upside Potential 120 MW new projects become materialised
Central Case 34.00 30.77 Value for committed projects (operating + constructing)
Downside Projects under construction failed to start operation
Key earnings drivers 12/15A 12/16E 12/17E 12/18E
Avg power tariff (Bt/KWh) 3.78 3.58 3.77 4.15 Gas cost (Bt/mmbtu) 318.0 243.9 253.7 297.6 Capacity factor CUP#1-3 (%)
79.9 80.0 85.0 85.0 — — — — — — — —
Income statement (Bt mn) 12/15A 12/16E 12/17E 12/18E
Sales revenue 22,444 21,369 26,754 33,034 Cost of goods sold 20,177 18,654 23,405 28,589 SG&A 670.4 690.5 738.8 761.0 Other operating exp./(inc.) (1,566) (1,653) (2,060) (2,230) EBITDA 3,163 3,677 4,670 5,914 Depreciation & amortisation 1,082 1,191 1,650 1,881 EBIT 2,080 2,486 3,019 4,033 Net interest expense/(inc.) 394.0 480.9 559.3 552.9 Non-operating inc./(exp.) — — — — Associates/JV — — — — Recurring PBT 1,686 2,005 2,460 3,480
Exceptionals/extraordinaries — — — — Taxes 90.0 243.2 294.6 441.7 Profit after tax 1,596 1,762 2,165 3,039 Other after tax income 292.9 383.5 496.0 535.8 Minority interests (16.8) (18.6) (22.8) (32.0) Preferred dividends — — — — Reported net profit 1,906 2,164 2,684 3,606 Analyst adjustments — — — — Net profit (Credit Suisse) 1,906 2,164 2,684 3,606
Cash flow (Bt mn) 12/15A 12/16E 12/17E 12/18E
EBIT 2,080 2,486 3,019 4,033 Net interest — — — — Tax paid — — — — Working capital (967.5) 6.4 (442.4) (554.1) Other cash & non-cash items 1,050 479 811 908 Operating cash flow 2,162 2,971 3,388 4,387 Capex (4,394) (5,501) (5,092) (1,691) Free cash flow to the firm (3,093) (1,162) (909) 3,713 Disposals of fixed assets — — — — Acquisitions — — — — Divestments — — — — Associate investments (597.5) 304.7 345.1 446.4 Other investment/(outflows) 333.9 757.8 104.9 123.6 Investing cash flow (4,658) (4,439) (4,642) (1,121) Equity raised 9,838 — — — Dividends paid (1,072) (1,529) (1,477) (1,652) Net borrowings 2,151 3,306 2,979 (242) Other financing cash flow (59.3) — — — Financing cash flow 10,858 1,777 1,502 (1,894) Total cash flow 8,362 310 248 1,372 Adjustments (597.5) 304.7 345.1 446.4 Net change in cash 7,765 615 593 1,818
Balance sheet (Bt mn) 12/15A 12/16E 12/17E 12/18E
Cash & cash equivalents 11,186 11,800 12,394 14,212 Current receivables 3,701 3,525 4,449 5,521 Inventories 406.3 375.6 471.3 575.7 Other current assets 1,023 467 590 732 Current assets 16,316 16,168 17,904 21,040 Property, plant & equip. 23,467 27,777 31,219 31,030 Investments 8,278 8,357 8,507 8,597 Intangibles 396.0 396.0 396.0 396.0 Other non-current assets 7,409 6,879 6,429 5,859 Total assets 55,867 59,577 64,455 66,922 Accounts payable 1,960 1,812 2,273 2,777 Short-term debt 1,595 1,595 1,595 1,595 Current provisions — — — — Other current liabilities 1,014 938 1,176 1,437 Current liabilities 4,569 4,344 5,045 5,809 Long-term debt 13,394 16,700 19,679 19,437 Non-current provisions 452.1 464.3 479.0 501.1 Other non-current liab. 325.2 325.2 325.2 325.2 Total liabilities 18,740 21,834 25,528 26,072 Shareholders' equity 37,094 37,729 38,937 40,891 Minority interests 1,122 1,103 1,080 1,048 Total liabilities & equity 55,867 59,577 64,455 66,922
Per share data 12/15A 12/16E 12/17E 12/18E
Shares (wtd avg.) (mn) 1,362 1,498 1,498 1,498 EPS (Credit Suisse) (Bt) 1.40 1.44 1.79 2.41 DPS (Bt) 0.95 0.95 1.02 1.18 BVPS (Bt) 27.2 25.2 26.0 27.3 Operating CFPS (Bt) 1.59 1.98 2.26 2.93
Key ratios and valuation
12/15A 12/16E 12/17E 12/18E
Growth(%) Sales revenue (5.1) (4.8) 25.2 23.5 EBIT 14.6 19.5 21.5 33.6 Net profit 20.6 13.5 24.1 34.4 EPS (0.5) 3.2 24.1 34.4 Margins (%) EBITDA 14.1 17.2 17.5 17.9 EBIT 9.3 11.6 11.3 12.2 Pre-tax profit 7.5 9.4 9.2 10.5 Net profit 8.5 10.1 10.0 10.9 Valuation metrics (x) P/E 18.6 18.0 14.5 10.8 P/B 0.95 1.03 1.00 0.95 Dividend yield (%) 3.65 3.65 3.93 4.55 P/CF 16.4 13.1 11.5 8.9 EV/sales 1.91 2.13 1.79 1.39 EV/EBITDA 13.5 12.4 10.2 7.7 EV/EBIT 20.6 18.3 15.8 11.3 ROE analysis (%) ROE 6.0 5.8 7.0 9.0 ROIC 5.16 5.13 5.77 7.38 Asset turnover (x) 0.40 0.36 0.42 0.49 Interest burden (x) 0.81 0.81 0.81 0.86 Tax burden (x) 0.95 0.88 0.88 0.87 Financial leverage (x) 1.50 1.58 1.66 1.64 Credit ratios Net debt/equity (%) 10.2 17.2 22.8 16.7 Net debt/EBITDA (x) 1.20 1.77 1.90 1.15 Interest cover (x) 5.28 5.17 5.40 7.29
Source: Company data, Thomson Reuters, Credit Suisse estimates.
0
2
4
6
8
10
12
14
16
18
20
Jul-15 Sep-15 Nov-15 Jan-16 Mar-16
12MF P/E multiple
0.00
0.20
0.40
0.60
0.80
1.00
1.20
Jul-15 Sep-15 Nov-15 Jan-16 Mar-16
12MF P/B multiple
Source: IBES

20 April 2016
Global Power Synergy
(GPSC.BK) 5
Widening cogeneration margin is structural Margins of GPSC’s electricity sales to industrial customers (IUs) are on a structurally rising
trend. Selling price of electricity units to IUs is based on government’s announced tariffs, which
will be rising with higher portion of expensive renewable power in Thailand’s total power
generation. Nearly 1,800 MW of new renewable power capacity are planned to start operation
in 2016-17. Power generation from renewable energy sources now accounts for 7% of total
power generation in Thailand, and is projected to reach 12% in 2018. This would result in
expanding margins as a major portion of its costs is natural gas. Electricity sales to IUs
accounts for 35% of FY16E revenue and is expected to witness a 17% CAGR in 2016E-18E.
The expected rise in tariffs is estimated to account for Bt6/share in our DCF-based NAV.
Driven by Thailand's increasing share of power
generation from renewable energy sources
Over the past three years, Thailand has seen a surge in new renewable capacity – 82%
rise in installed capacity between 2012 and 2015 (Figure 6). Particularly, solar farms and
wind farms grew 277% and 109% over the same period. Power generation from
renewable energy sources now accounts for 7% of total power generation in Thailand
(Figure 7), rising from 5% in 2015 and less than 3% in 2012.
Figure 6: Thailand's installed capacity for renewable
power plants – grew 82% between 2012 and 2015
Figure 7: 7% of Thailand's power generation comes from
renewable energy sources
0.0
0.5
1.0
1.5
2.0
2.5
3.0
3.5
4.0
4.5
5.0
2012 2013 2014 2015
GW
Solar Wind Biomass Biogas WTE
Hydro2%
Coal19%
Gas64%
Imported8% Renewable
7%
Others0%
Source: DEDE Source: EPPO
Accelerated renewable power generation was a consequence of generous financial
support. Thailand incentivised the private sector by giving out contracts with premium-
price tariffs on top of the usual announced power tariff (known as 'adder', between 2007
and 2015) and a fixed-rate tariff (known as 'Feed-in tariff', between 2015 and present).
Note that we see only a slight probability for the government to adjust terms in the
awarded contracts. Hence, the government will have to be responsible for the committed
subsidies until contracts end.
These financial supports have spiked power tariff. Compared to the average power tariff in the
country, the government is paying 0.8-3.2x higher prices to purchase power from renewable
energy sources (Figure 8). All of these purchasing costs, in turn, are embedded in the power
tariff. The structure of power tariff in Thailand allows all costs that arise from power generation,
including fuel costs and all types of subsidies, to be passed through (Figure 9).
GPSC sees costless rise in
revenue, driven by Thailand
having increasing share of
power generation from
renewable power sources
Thailand has seen a surge
in new renewable capacity –
82% rise in installed
capacity between 2012-15
All of subsidies for
renewable power generation
are embedded in power
tariff

20 April 2016
Global Power Synergy
(GPSC.BK) 6
Figure 8: Costs of purchasing power from renewable
energy sources are high
Figure 9: Thailand's power tariff structure - subsidies for
renewable power are embedded in power tariff.
0
2
4
6
8
10
12
14
Impo
rted
hyd
ro
Nuc
lear
Coa
l
Gas
CC
GT
FY
16E
avg
pow
er ta
riff
Sol
ar fa
rm (
2009
con
trac
ts)
Sol
ar fa
rm (
2010
con
trac
ts)
Win
d fa
rm
WT
E
Bio
mas
s
Bio
gas
Win
d F
iT (
smal
l-sca
led)
Sol
ar F
iT
WT
E F
iT
Bio
mas
s F
iT
Bio
gas
FiT
Bt/KWh
Premium on-top of normal power tariff ('Adder')
Old scheme (for contracts awarded
Current scheme (Feed-in tariff)
Source: Ministry of Energy, ERC, Credit Suisse estimates Source: Credit Suisse
Costless benefit for cogeneration business
Thailand, having a larger mix of power generation from renewable sources, benefits
cogeneration power producers through its higher electricity selling price to IUs.
Negotiations for the selling price are conducted on business-to-business commercial terms
basis, and is benchmarked with Provincial Electricity Authority's (PEA) tariff for IUs (a type
of power tariff charged to the large users outside Bangkok, normally at a discount to
Thailand's averaged power tariff). PEA tariff changes every four months through Fuel Tariff
(Ft) adjustment, capturing movement in energy costs and any subsidies paid by the
government.
Costs involved for cogeneration power plants are mainly from natural gas, and higher
subsidies from renewable power generation have no impact on production costs. As such,
by having a larger pie of power generation from renewable sources could lead to higher
electricity margin for the cogeneration business (Figure 10).
Figure 10: Simplified structure of electricity revenue-costs dynamic for cogeneration
power plants.
Selling price (linked to PEA tariff) Production costs
- Energy costs (natural gas, coal,
hydro, fuel oil, diesel)
- EGAT's investment costs
- IPP purchasing costs
- Natural gas costs
Renewable power generation
Regular margin
Expanding margins from larger mixed of renewable power generation
Source: Credit Suisse
More subsidies government
required to pay for
renewable power generation
translate to higher electricity
selling price for
cogeneration power plants

20 April 2016
Global Power Synergy
(GPSC.BK) 7
The period of rising margin has just begun
The period of momentous changes in the margin lift for SPP cogeneration has just begun.
A bunch of wind and solar farms are due to set in motion in 2017, and the maximum
benefit from Thailand having a larger pie of renewable power is unlikely to come until
2018. Nearly 1,800 MW of new renewable power capacity have been planned to start
operation in 2016-17 (Figure 11), most of which are wind farms with Bt3.5/KWh premium
on top of the normal power tariff ('Adder') and solar farms under government/co-op
scheme with Feed-in tariff at Bt5.66/KWh. A portion of subsidies for renewable energy
sources in power tariff is estimated to reach Bt0.35/KWh and Bt0.42/KWh in 2017 and
2018, respectively, from Bt0.22/KWh in Jan-Apr 2016 (Figure 13).
Figure 11: Planned annual start-up of private renewable
capacity under PDP 2015—start-up from renewable is not
yet at the peak
Figure 12: Power generation from renewable power
source is projected to reach 12% in 2018.
-
200
400
600
800
1,000
1,200
2016
2017
2018
2019
2020
2021
2022
2023
2024
2025
2026
2027
2028
2029
2030
2031
2032
2033
2034
2035
2036
MW
Mostly commercial-scaled wind farms with subsidy ('Adder') of Bt3.5/KWh above the average power tariff and gov't/co-op solar farms.
0
2
4
6
8
10
12
2012
2013
2014
2015
Cur
rent
2016
E
2017
E
2018
E
(%)
Source: PDP 2015, Credit Suisse research Source: EPPO, PDP 2015
Figure 13: Average power tariff assumption*
3.0
3.2
3.4
3.6
3.8
4.0
4.2
Mid-2015 End-2015 Jan-Apr 2016 2016E 2017E 2018E
Bt/KWh
Others components (energy and investment costs) Renewable power
*Normally at a premium to PEA tariff for industrial users, Source: PDP 2015, Credit Suisse estimates
The maximum benefit from
Thailand having larger pie of
renewable power should be
in 2018

20 April 2016
Global Power Synergy
(GPSC.BK) 8
The subsidies will provide a 30-38% boost to our pro-forma margins for gas-fired
cogeneration plants, contributing to the increases in 2016-17 and cushion against an
expected drop in 2018 (as a result of higher gas price) (Figure 14). Our pro-forma margin
for gas-fired cogeneration power plants is calculated based on the difference between
PEA tariff for industrial users, which is normally at a discount to Thailand's average power
tariff, and natural gas cost at 8,600 BTU/KWh heat rate.
Figure 14: Pro forma gas-fired cogeneration margin*—fuelled by growing subsidies for
renewable power generation.
-
0.2
0.4
0.6
0.8
1.0
1.2
Mid-2015 End-2015 2016E 2017E 2018E
Bt/KWh
Others (mainly energy costs and investment costs) Renewable power portion
*Calculated based on the difference between PEA (Provincial Electricity Authority) tariff for industrial users
and natural gas cost at 8,600 BTU/KWh heat rate.
Source: GLOW, EGAT, ERC, Credit Suisse estimates
GPSC—weighty exposure
GPSC owns a weighty and a rising exposure from electricity sales to industrial customers
under its cogeneration business. 35% of its sales revenue are electricity sold to IUs (who
is mainly PTT group) (Figure 15), which could see benefit from higher electricity margin
from cogeneration plants. Like other cogeneration power producers, selling prices for
electricity sold to IUs are benchmarked to government's announced PEA power tariff,
while having natural gas as feedstock.
The subsidies provide 30-
38% boost to our pro-forma
margins for gas-fired
cogeneration plants
35% of its revenue is
electricity sold to IUs, which
will benefit from higher
electricity margin from gas-
fired cogeneration plants
20 April 2016
Global Power Synergy
(GPSC.BK) 9
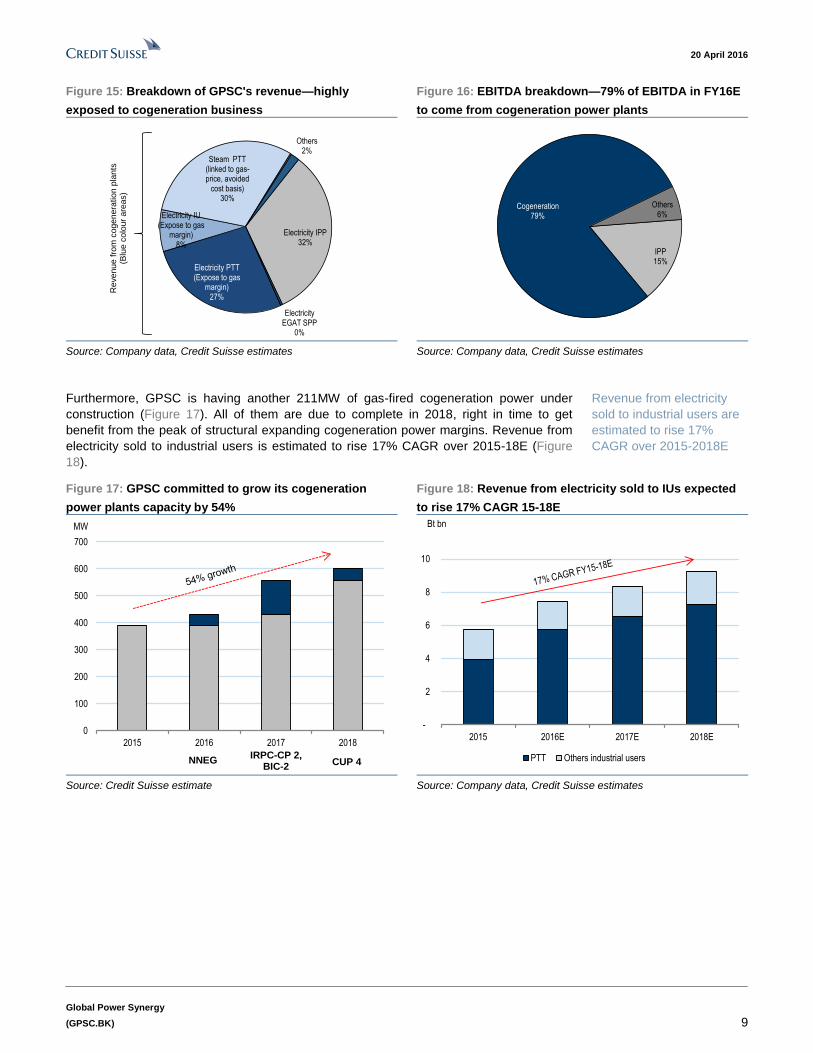
Figure 15: Breakdown of GPSC's revenue—highly
exposed to cogeneration business
Figure 16: EBITDA breakdown—79% of EBITDA in FY16E
to come from cogeneration power plants
Electricity IPP32%
Electricity EGAT SPP
0%
Electricity PTT(Expose to gas
margin)27%
Electricity IU(Expose to gas
margin)8%
Steam PTT(linked to gas-price, avoided
cost basis)30%
Others2%
Revenue f
rom
cogenera
tion p
lants
(Blu
e c
olo
ur
are
as)
IPP15%
Cogeneration79%
Others6%
Source: Company data, Credit Suisse estimates Source: Company data, Credit Suisse estimates
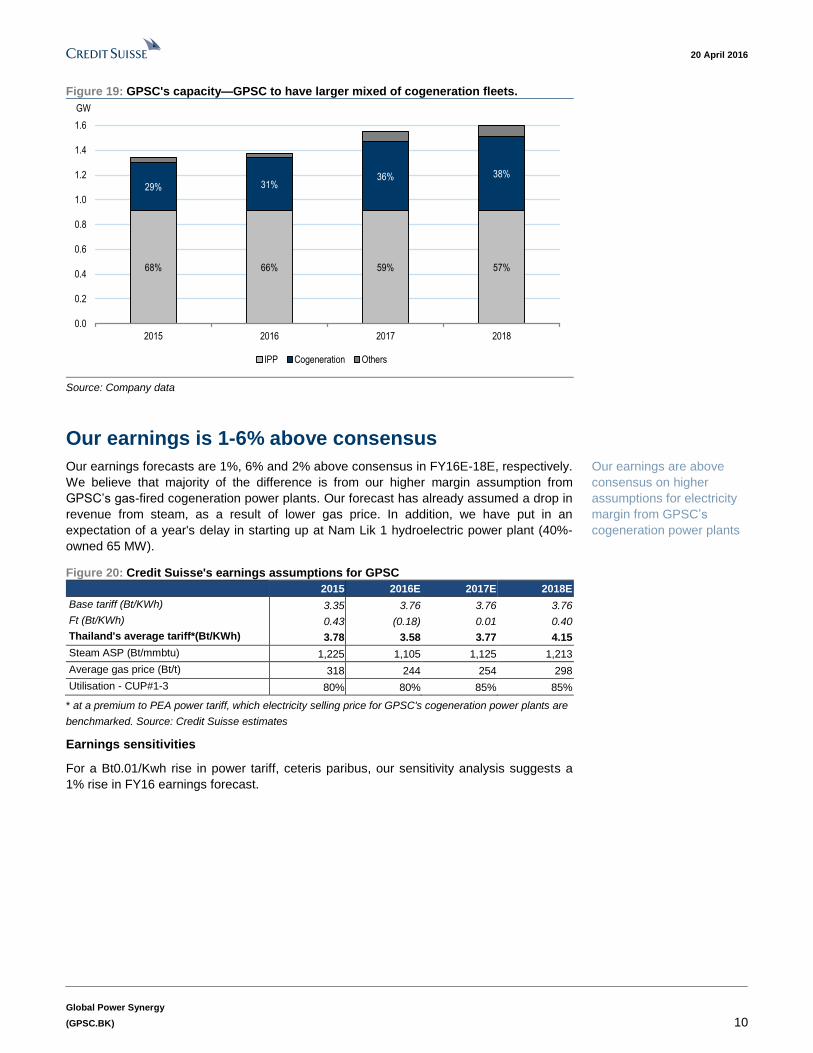
Furthermore, GPSC is having another 211MW of gas-fired cogeneration power under
construction (Figure 17). All of them are due to complete in 2018, right in time to get
benefit from the peak of structural expanding cogeneration power margins. Revenue from
electricity sold to industrial users is estimated to rise 17% CAGR over 2015-18E (Figure
18).
Figure 17: GPSC committed to grow its cogeneration
power plants capacity by 54%
Figure 18: Revenue from electricity sold to IUs expected
to rise 17% CAGR 15-18E
0
100
200
300
400
500
600
700
2015 2016 2017 2018
MW
NNEGIRPC-CP 2,
BIC-2CUP 4
-
2
4
6
8
10
2015 2016E 2017E 2018E
Bt bn
PTT Others industrial users
Source: Credit Suisse estimate Source: Company data, Credit Suisse estimates
Revenue from electricity
sold to industrial users are
estimated to rise 17%
CAGR over 2015-2018E
20 April 2016
Global Power Synergy
(GPSC.BK) 10
Figure 19: GPSC's capacity—GPSC to have larger mixed of cogeneration fleets.
68% 66% 59% 57%
29% 31%36% 38%
0.0
0.2
0.4
0.6
0.8
1.0
1.2
1.4
1.6
2015 2016 2017 2018
GW
IPP Cogeneration Others
Source: Company data
Our earnings is 1-6% above consensus
Our earnings forecasts are 1%, 6% and 2% above consensus in FY16E-18E, respectively.
We believe that majority of the difference is from our higher margin assumption from
GPSC’s gas-fired cogeneration power plants. Our forecast has already assumed a drop in
revenue from steam, as a result of lower gas price. In addition, we have put in an
expectation of a year's delay in starting up at Nam Lik 1 hydroelectric power plant (40%-
owned 65 MW).
Figure 20: Credit Suisse's earnings assumptions for GPSC
2015 2016E 2017E 2018E
Base tariff (Bt/KWh) 3.35 3.76 3.76 3.76
Ft (Bt/KWh) 0.43 (0.18) 0.01 0.40
Thailand's average tariff*(Bt/KWh) 3.78 3.58 3.77 4.15
Steam ASP (Bt/mmbtu) 1,225 1,105 1,125 1,213
Average gas price (Bt/t) 318 244 254 298
Utilisation - CUP#1-3 80% 80% 85% 85%
* at a premium to PEA power tariff, which electricity selling price for GPSC's cogeneration power plants are
benchmarked. Source: Credit Suisse estimates
Earnings sensitivities
For a Bt0.01/Kwh rise in power tariff, ceteris paribus, our sensitivity analysis suggests a
1% rise in FY16 earnings forecast.
Our earnings are above
consensus on higher
assumptions for electricity
margin from GPSC’s
cogeneration power plants

20 April 2016
Global Power Synergy
(GPSC.BK) 11
Growing demand from PTT group Among its peers, GPSC is likely to grow most in the domestic market, regardless of
government's policy. GPSC is different from other utilities in which it has PTT group as a
cornerstone customer.
GPSC can ride on the new investment cycle with companies under the same group such
as PTTGC. A minimum of 120 MW of high-margin cogeneration plants could be built to
support rising demand from PTT Group, including Polyol project and Map Tha Put retrofit
project at PTTGC and LNG receiving terminal phase 2 at PTT parent company (Figure
21). Importantly, electricity and steam from cogeneration power plants sold to PTT group
earn high margin and could further benefit from the structurally widening cogeneration
margin. The potential increase in capacity is equivalent to 20% rise in capacity for GPSC's
committed cogeneration power plants.
Figure 21: 120 MW of SPP cogeneration plants could be built to support expanding demand from PTT Group
Clients Project Estimated
demand
Expected
COD Note
Committed capacity
PTTGC Phenol and LLDPE projects 45 MW 1Q18 CUP#4 Phase 1 (Already FID, and under development)
Potential capacity
PTTGC Polyol project 40 MW 2019 CUP# 4 Phase 2. (Polyol project is under FEED, PTTGC
expects for FID in mid-2016)
PTTGC Map Tha Put retrofit At least
50 MW ~2020
Under negotiation, To require integrated-cracker cogen
plant
PTT LNG Receiving terminal 30 MW N/A
CUP# 5 (LNG Receiving Terminal 1 is currently using
electricity supply from PEA, however, PTT is studying to
switch from PEA to GPSC for power security purpose once
PTT develops LNG Receiving terminal 2)
Source: Company data, Credit Suisse estimates
Figure 22: Our DCF-based NAV may be raised by another Bt5/share if PTT group makes
final investment decisions for all potential projects
34
2 1
2 39
20
25
30
35
40
DC
F-b
ased
NA
Vfr
om e
xist
ing
proj
ects P
olyo
l
LNG
Rec
eivi
ngte
rmin
al
MT
P R
etro
fit
DC
F-b
ased
NA
Vin
clud
ing
all
pote
ntia
ls
Bt/sh
Source: Credit Suisse estimates
GPSC is capable to finance these investments to support growing demand from PTT
group mainly by debt. Assuming 100% debt financing, GPSC's net debt-to-equity would be
at only 0.46x in FY16E, below its threshold at 2.75x.
Minimum of 120 MW of
high-margin cogeneration
plants could be built to
support expanding demand
from PTT group

20 April 2016
Global Power Synergy
(GPSC.BK) 12
Myanmar to be inorganic 'Big Win'
GPSC has been actively looking for investment opportunities in Myanmar, as part of its
‘Big Win’ strategy. We acknowledge that most of the projects are unlikely to see any
conclusion in the near future. However, GPSC could somewhat take a benefit from being a
first-mover. According to the company, Croco project, 400 MW (Phase 1: 140 MW)
combined cycle gas-fired power plants, has seen the greatest development. Management
is expecting to conclude on this potential investments by the end of 2016. The project is a
mid-size combined cycle gas-fired power plant, aimed at supporting growth at Thilawa
special economic zone.
Figure 23: GPSC is actively looking into three potential projects in Myanmar
Project Location Type Approx. Capacity (MW) Customer SCOD Status
Croco Thanlyin Combined Cycle Gas Turbine 400 MW (Phase 1: 140 MW) MEPE 2020 FSR Clarification & MOA negotiation
X-Cite Myeik Coal-fired power plant 2,500 MW MEPE, EGAT 2021-22 MOA negotiation
L Kyaiklat Combined Cycle Gas Turbine Approx. 500 MW MEPE 2020 MOA Execution
Source: Company data
Croco project, 400 MW
(Phase 1: 140 MW)
combined cycle gas-fired
power plants, has seen the
greatest development
20 April 2016
Global Power Synergy
(GPSC.BK) 13
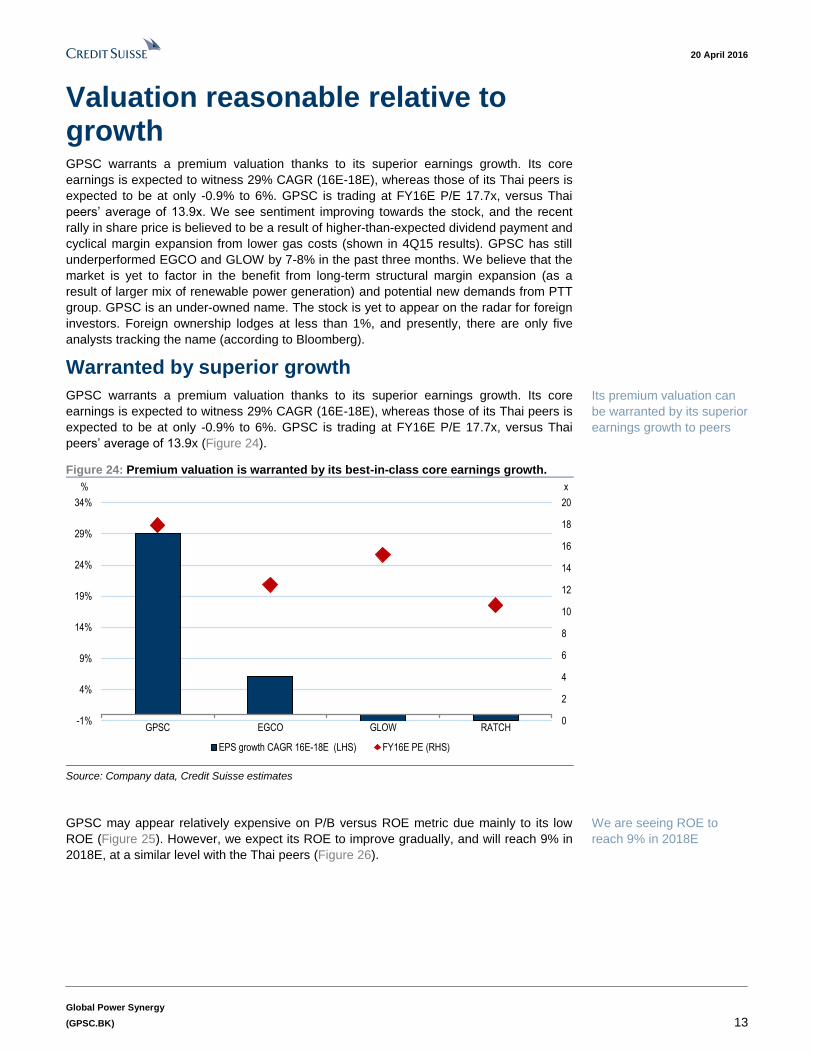
Valuation reasonable relative to growth GPSC warrants a premium valuation thanks to its superior earnings growth. Its core
earnings is expected to witness 29% CAGR (16E-18E), whereas those of its Thai peers is
expected to be at only -0.9% to 6%. GPSC is trading at FY16E P/E 17.7x, versus Thai
peers’ average of 13.9x. We see sentiment improving towards the stock, and the recent
rally in share price is believed to be a result of higher-than-expected dividend payment and
cyclical margin expansion from lower gas costs (shown in 4Q15 results). GPSC has still
underperformed EGCO and GLOW by 7-8% in the past three months. We believe that the
market is yet to factor in the benefit from long-term structural margin expansion (as a
result of larger mix of renewable power generation) and potential new demands from PTT
group. GPSC is an under-owned name. The stock is yet to appear on the radar for foreign
investors. Foreign ownership lodges at less than 1%, and presently, there are only five
analysts tracking the name (according to Bloomberg).
Warranted by superior growth
GPSC warrants a premium valuation thanks to its superior earnings growth. Its core
earnings is expected to witness 29% CAGR (16E-18E), whereas those of its Thai peers is
expected to be at only -0.9% to 6%. GPSC is trading at FY16E P/E 17.7x, versus Thai
peers’ average of 13.9x (Figure 24).
Figure 24: Premium valuation is warranted by its best-in-class core earnings growth.
0
2
4
6
8
10
12
14
16
18
20
-1%
4%
9%
14%
19%
24%
29%
34%
GPSC EGCO GLOW RATCH
x%
EPS growth CAGR 16E-18E (LHS) FY16E PE (RHS)
Source: Company data, Credit Suisse estimates
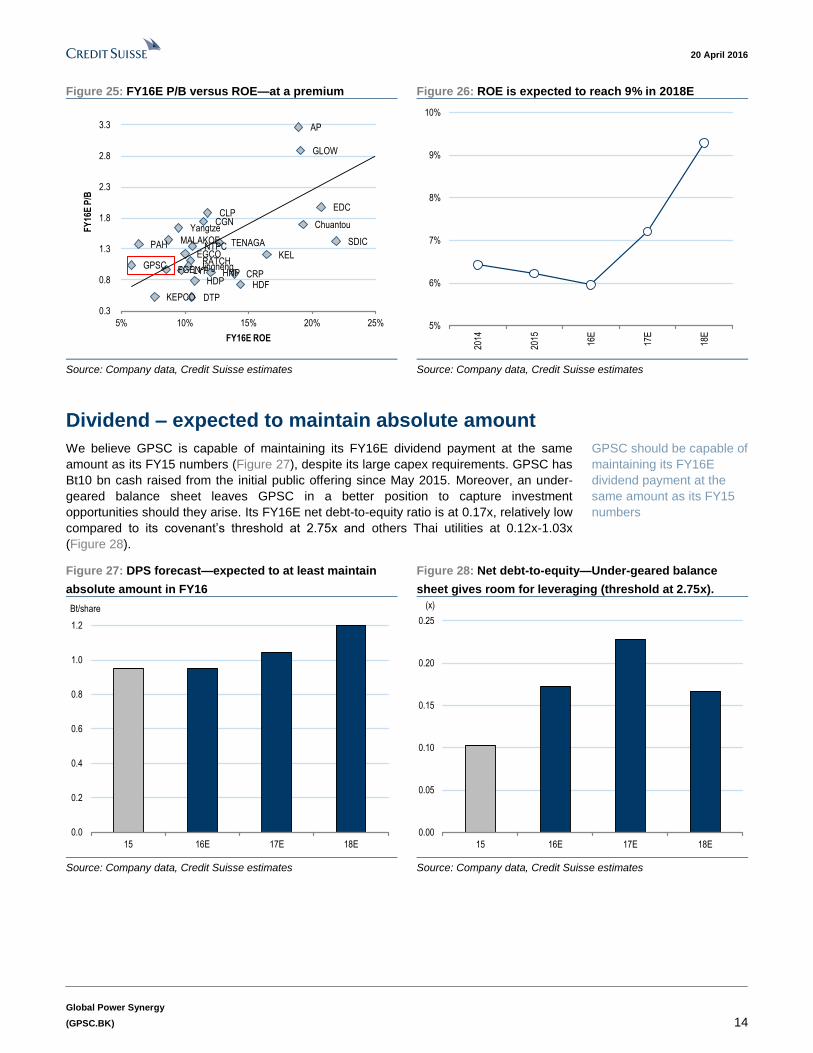
GPSC may appear relatively expensive on P/B versus ROE metric due mainly to its low
ROE (Figure 25). However, we expect its ROE to improve gradually, and will reach 9% in
2018E, at a similar level with the Thai peers (Figure 26).
Its premium valuation can
be warranted by its superior
earnings growth to peers
We are seeing ROE to
reach 9% in 2018E
20 April 2016
Global Power Synergy
(GPSC.BK) 14
Figure 25: FY16E P/B versus ROE—at a premium Figure 26: ROE is expected to reach 9% in 2018E
EGCO
GLOW
RATCHGPSCCRP
HDP
DTP
HNPLYP
HDF
CGN
SDIC
Chuantou
Jingneng
Yangtze
CLP
PAH TENAGAMALAKOF
FGEN
AP
EDC
KEPCO
NTPCKEL
0.3
0.8
1.3
1.8
2.3
2.8
3.3
5% 10% 15% 20% 25%
FY
16E
P/B
FY16E ROE
5%
6%
7%
8%
9%
10%
2014
2015
16E
17E
18E
Source: Company data, Credit Suisse estimates Source: Company data, Credit Suisse estimates
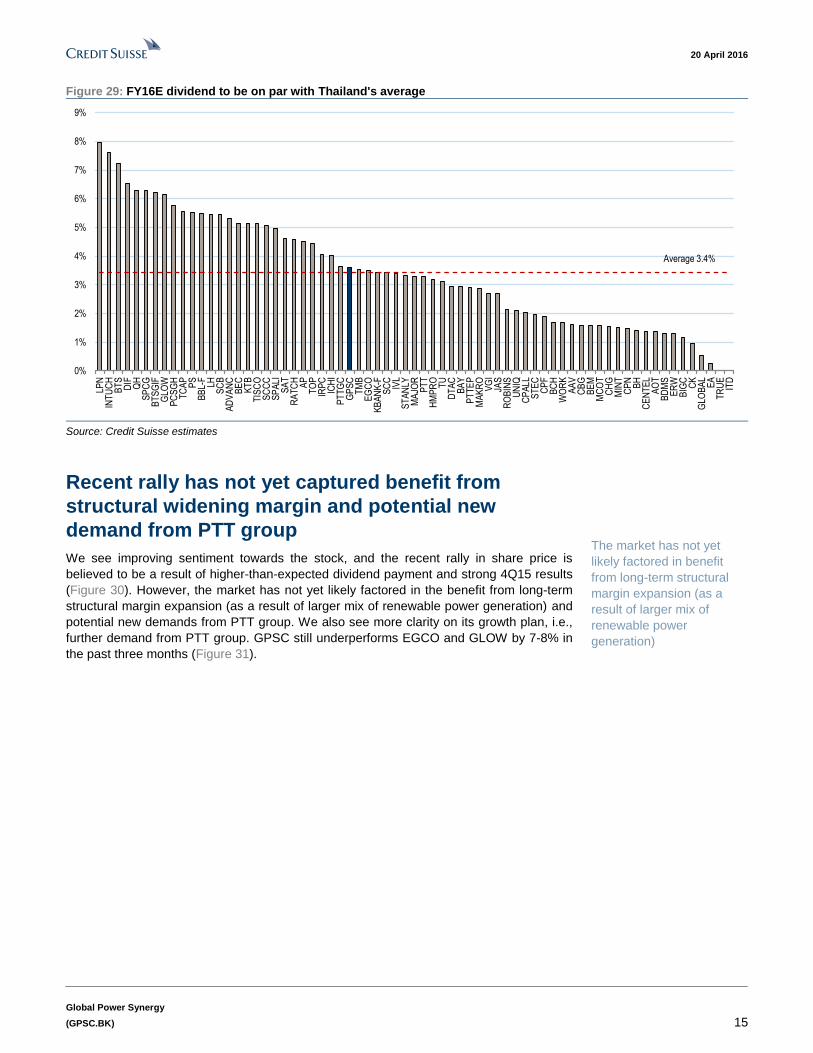
Dividend – expected to maintain absolute amount
We believe GPSC is capable of maintaining its FY16E dividend payment at the same
amount as its FY15 numbers (Figure 27), despite its large capex requirements. GPSC has
Bt10 bn cash raised from the initial public offering since May 2015. Moreover, an under-
geared balance sheet leaves GPSC in a better position to capture investment
opportunities should they arise. Its FY16E net debt-to-equity ratio is at 0.17x, relatively low
compared to its covenant’s threshold at 2.75x and others Thai utilities at 0.12x-1.03x
(Figure 28).
Figure 27: DPS forecast—expected to at least maintain
absolute amount in FY16
Figure 28: Net debt-to-equity—Under-geared balance
sheet gives room for leveraging (threshold at 2.75x).
0.0
0.2
0.4
0.6
0.8
1.0
1.2
15 16E 17E 18E
Bt/share
0.00
0.05
0.10
0.15
0.20
0.25
15 16E 17E 18E
(x)
Source: Company data, Credit Suisse estimates Source: Company data, Credit Suisse estimates
GPSC should be capable of
maintaining its FY16E
dividend payment at the
same amount as its FY15
numbers
20 April 2016
Global Power Synergy
(GPSC.BK) 15
Figure 29: FY16E dividend to be on par with Thailand's average
0%
1%
2%
3%
4%
5%
6%
7%
8%
9%
LPN
INT
UC
HB
TS
DIF
QH
SP
CG
BT
SG
IFG
LOW
PC
SG
HT
CA
PP
SB
BL-
FLH
SC
BA
DV
AN
CB
EC
KT
BT
ISC
OS
CC
CS
PA
LIS
AT
RA
TC
HA
PT
OP
IRP
CIC
HI
PT
TG
CG
PS
CT
MB
EG
CO
KB
AN
K-F
SC
CIV
LS
TA
NLY
MA
JOR
PT
TH
MP
RO TU
DT
AC
BA
YP
TT
EP
MA
KR
OV
GI
JAS
RO
BIN
SU
NIQ
CP
ALL
ST
EC
CP
FB
CH
WO
RK
AA
VC
BG
BE
MM
CO
TC
HG
MIN
TC
PN
BH
CE
NT
EL
AO
TB
DM
SE
RW
BIG
CC
KG
LOB
AL
EA
TR
UE
ITD
Average 3.4%
Source: Credit Suisse estimates
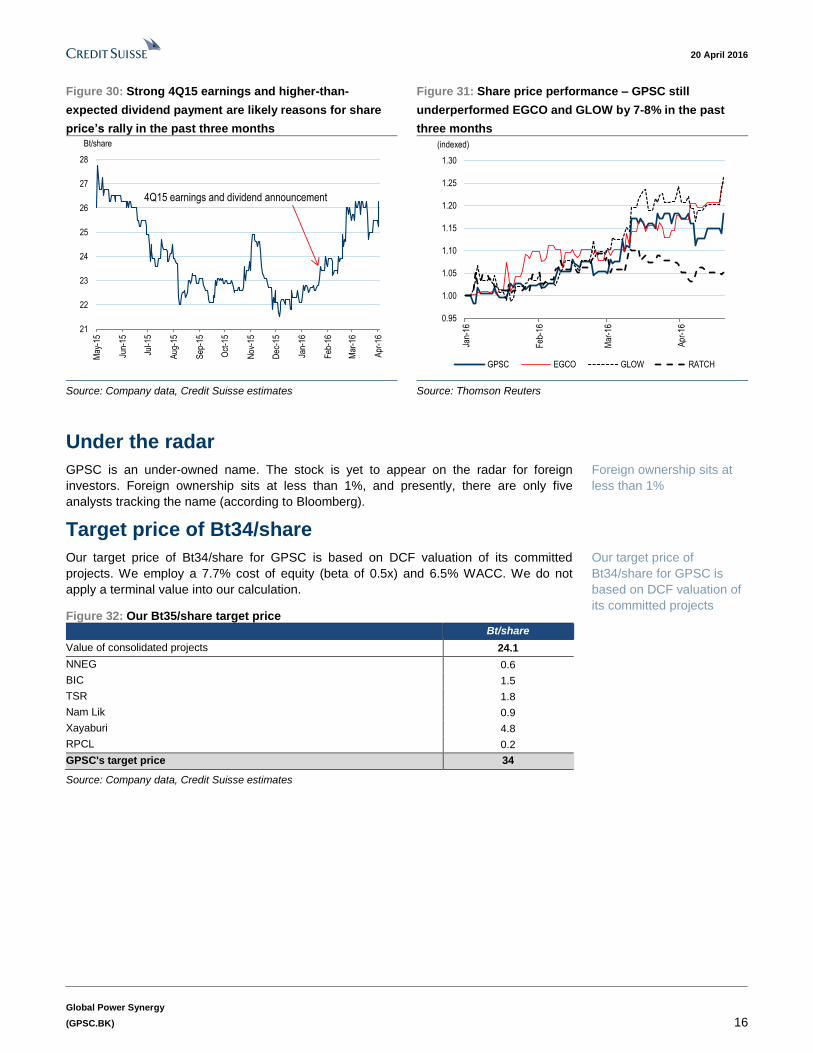
Recent rally has not yet captured benefit from
structural widening margin and potential new
demand from PTT group
We see improving sentiment towards the stock, and the recent rally in share price is
believed to be a result of higher-than-expected dividend payment and strong 4Q15 results
(Figure 30). However, the market has not yet likely factored in the benefit from long-term
structural margin expansion (as a result of larger mix of renewable power generation) and
potential new demands from PTT group. We also see more clarity on its growth plan, i.e.,
further demand from PTT group. GPSC still underperforms EGCO and GLOW by 7-8% in
the past three months (Figure 31).
The market has not yet
likely factored in benefit
from long-term structural
margin expansion (as a
result of larger mix of
renewable power
generation)
20 April 2016
Global Power Synergy
(GPSC.BK) 16
Figure 30: Strong 4Q15 earnings and higher-than-
expected dividend payment are likely reasons for share
price’s rally in the past three months
Figure 31: Share price performance – GPSC still
underperformed EGCO and GLOW by 7-8% in the past
three months
21
22
23
24
25
26
27
28
May
-15
Jun-
15
Jul-1
5
Aug
-15
Sep
-15
Oct
-15
Nov
-15
Dec
-15
Jan-
16
Feb
-16
Mar
-16
Apr
-16
Bt/share
4Q15 earnings and dividend announcement
0.95
1.00
1.05
1.10
1.15
1.20
1.25
1.30
Jan-
16
Feb
-16
Mar
-16
Apr
-16
(indexed)
GPSC EGCO GLOW RATCH
Source: Company data, Credit Suisse estimates Source: Thomson Reuters
Under the radar
GPSC is an under-owned name. The stock is yet to appear on the radar for foreign
investors. Foreign ownership sits at less than 1%, and presently, there are only five
analysts tracking the name (according to Bloomberg).
Target price of Bt34/share
Our target price of Bt34/share for GPSC is based on DCF valuation of its committed
projects. We employ a 7.7% cost of equity (beta of 0.5x) and 6.5% WACC. We do not
apply a terminal value into our calculation.
Figure 32: Our Bt35/share target price
Bt/share
Value of consolidated projects 24.1
NNEG 0.6
BIC 1.5
TSR 1.8
Nam Lik 0.9
Xayaburi 4.8
RPCL 0.2
GPSC's target price 34
Source: Company data, Credit Suisse estimates
Foreign ownership sits at
less than 1%
Our target price of
Bt34/share for GPSC is
based on DCF valuation of
its committed projects

20 April 2016
Global Power Synergy
(GPSC.BK) 17
Figure 33: Regional valuation comparison table Target U/D Mkt Cap FCF yield ROE (%) Net D/E Net D/EBITDA EV/IC (x) ROIC (%)
Company Ticker Rat. FX Price Price US$ mn 16E 17E 16E 16E 17E 16E 17E 16E 17E 16E 17E 16E 16E 16E 16E 16E
Thailand
Electricity Generating EGCO.BK N THB 190.0 185.0 -3% 2,865 3.4% 3.6% -1.2% 12.5 11.7 86% 7% 1.2 1.2 19.2 16.6 10% 103% 8.8 1.08 2.8%
Glow Energy PCL GLOW.BK O THB 93.5 109.0 17% 3,917 6.1% 6.1% 9.5% 15.2 15.0 8% 2% 2.9 2.8 9.8 9.6 19% 75% 2.3 1.86 12.7%
Ratchaburi Electricity Generating Holding PCL RATCH.BK N THB 50.0 51.0 2% 2,076 4.6% 4.6% 7.4% 10.6 10.3 115% 2% 1.1 1.0 9.5 9.3 10% 12% 0.9 1.15 7.3%
Global Power Synergy GPSC.BK O THB 26.3 34.0 30% 1,126 3.3% 3.3% -3.2% 18.4 15.4 3% 24% 1.1 1.0 11.9 9.9 6% 17% 1.8 0.98 4.9%
Average - Thailand 4.7% 4.8% 5.2% 12.8 12.3 69% 4% 1.7 1.7 12.8 11.8 13% 64% 4.0 1.36 7.6%
China
China Resources Power Holdings 0836.HK U HKD 14.5 14.0 -3% 8,974 6.2% 5.8% -21.5% 6.5 7.4 6% -13% 0.9 0.8 5.6 5.6 14% 109% 3.3 0.78 7.7%
Huadian Power International 1071.HK U HKD 4.5 3.5 -22% 7,998 5.5% 4.5% -5.2% 7.3 8.5 -36% -14% 0.8 0.7 6.9 6.9 11% 193% 4.8 0.86 5.7%
Datang International Power Generation Co. Ltd. 0991.HK N HKD 2.3 2.6 12% 7,644 7.7% 7.4% 0.6% 5.0 4.7 25% 4% 0.5 0.5 9.6 9.4 11% 283% 7.8 0.86 4.1%
Huaneng Power International Inc 0902.HK U HKD 6.5 5.6 -14% 16,576 6.5% 5.9% 18.7% 7.6 8.4 -25% -9% 0.9 0.9 6.8 6.8 12% 141% 4.0 1.02 6.9%Longyuan Power 0916.HK O HKD 5.9 8.0 36% 6,113 2.0% 3.7% -10.9% 9.8 6.8 40% 44% 1.0 0.9 7.8 6.8 10% 152% 5.1 0.89 6.0%Huadian Fuxin Energy Corporation Limited 0816.HK O HKD 2.0 3.1 58% 2,125 4.0% 5.4% -48.0% 5.1 3.7 30% 37% 0.7 0.6 8.5 7.7 14% 313% 7.1 0.68 5.1%SDIC Power Holdings 600886.SS N CNY 6.6 12.2 84% 6,960 5.4% 5.6% 8.8% 6.5 6.2 8% 4% 1.4 1.2 7.5 7.1 22% 217% 5.7 0.79 7.7%Sichuan Chuantou Energy 600674.SS N CNY 8.5 12.8 50% 5,809 1.7% 1.7% 0.5% 8.8 9.0 5% -2% 1.7 1.5 71.6 71.3 19% 20% 7.6 1.56 1.5%Beijing Jingneng Power Co Ltd 600578.SS N CNY 5.0 6.9 39% 3,536 3.5% 4.5% -2.0% 9.9 8.9 -3% 12% 1.0 1.1 7.5 5.3 10% 47% 3.0 0.67 5.1%China Yangtze Power Co Ltd 600900.SS N CNY 12.5 16.4 32% 31,829 5.2% 5.2% 12.2% 17.3 14.5 4% 19% 1.6 1.7 12.3 9.4 10% 110% 5.6 0.78 4.9%
Average - China 4.5% 4.7% -4.0% 9.0 8.3 6% 9% 1.1 1.0 14.4 13.4 13% 157% 5.6 0.88 5.4%
Hong Kong
CLP Holdings Limited 0002.HK N HKD 73.0 66.0 -10% 23,762 3.8% 3.8% 5.2% 16.0 15.6 -26% 2% 1.9 1.8 10.9 10.5 12% 49% 2.4 1.52 8.7%
Power Assets Holdings Limited 0006.HK O HKD 81.0 86.0 6% 22,288 3.4% 3.5% 0.6% 21.6 21.2 4% 2% 1.4 1.4 88.9 91.6 6% -46% (44.3) 1.67 1.9%
Average - Hong Kong 3.6% 3.7% 2.9% 18.8 18.4 -11% 2% 1.6 1.6 49.9 51.0 9% 2% (21.0) 1.59 5.3%
Malaysia
Tenaga TENA.KL U MYR 14.4 12.0 -17% 20,989 2.4% 2.6% 1.4% 11.0 12.1 9% -9% 1.4 1.3 7.0 7.2 13% 34% 1.3 1.38 10.5%
Malakoff Bhd MALA.KL N MYR 1.7 1.7 2% 2,157 5.1% 4.6% 27.6% 16.5 21.7 6% -24% 1.4 1.4 8.4 8.7 9% 221% 5.2 1.16 5.7%
Average - Malaysia 3.7% 3.6% 14.5% 13.8 16.9 8% -16% 1.4 1.4 7.7 8.0 11% 128% 3.2 1.27 8.1%
Philippines
First Gen Corporation FGEN.PS O PHP 21.0 28.6 36% 1,665 1.6% 1.6% -4.9% 10.9 9.8 19% 11% 0.9 0.9 5.4 5.1 9% 112% 3.2 0.81 9.4%
Aboitiz Power Corp AP.PS N PHP 44.0 42.5 -3% 7,014 3.8% 3.8% 3.7% 17.2 16.4 14% 5% 3.3 3.1 12.2 11.4 19% 63% 2.0 2.31 13.0%
Energy Development Corporation EDC.PS O PHP 5.8 9.8 68% 2,366 3.7% 4.0% 9.8% 9.4 8.8 24% 7% 2.0 1.7 6.5 5.8 21% 75% 1.8 1.62 15.5%
Manila Electric (Meralco) MER.PS N PHP 333 280 -16% 8,120 4.6% 4.6% 4.6% 20.2 19.7 0% 3% 4.6 4.5 10.2 9.8 23% -36% (0.9) 6.61 34.9%
Average - Philippines 3.4% 3.5% 3.3% 14.4 13.7 14% 6% 2.7 2.5 8.6 8.0 18% 54% 1.6 2.84 18.2%
Korea
Korea Electric Power 015760.KS O KRW 59,900 68,000 14% 33,947 2.5% 2.5% 3.5% 7.0 6.7 -58% 4% 0.5 0.5 4.9 4.9 8% 71% 2.8 0.79 5.8%
Average - Korea 2.5% 2.5% 3.5% 7.0 6.7 -58% 4% 0.5 0.5 4.9 4.9 8% 71% 2.8 0.79 5.8%
India
NTPC Ltd NTPC.BO O INR 139 160 15% 17,353 4.2% 4.3% -20.0% 12.7 12.3 4% 3% 1.3 1.3 11.6 12.3 11% 133% 5.8 1.00 5.3%
Average - India 4.2% 4.3% -20.0% 12.7 12.3 4% 3% 1.3 1.3 11.6 12.3 11% 133% 5.8 1.00 5.3%
Pakistan
Hub Power Company HPWR.KA O PKR 104 118 13% 1,154 9.6% 11.5% 15.7% 10.3 8.4 6% 23% 3.5 3.3 8.1 7.1 34% 104% 2.0 2.20 21.5%
K-Electric KELE.KA O PKR 7.2 11.0 53% 1,899 1.8% 2.2% -0.9% 7.3 6.6 76% 11% 1.2 1.0 6.2 5.3 16% 41% 1.6 1.15 18.5%
Average - Pakistan 5.7% 6.9% 7.4% 8.8 7.5 41% 17% 2.4 2.2 7.1 6.2 25% 72% 1.8 1.67 20.0%Average 4.2% 4.4% 0.7% 11.4 11.1 14% 6% 1.6 1.5 14.5 13.9 14% 106% 2.2 1.38 9.0%
DY P/E (x) EPS growth (%) P/B (x) EV/EBITDA (x)
Source: Company data, Credit Suisse estimates
HOLT® valuation
We use CS HOLT®, a Credit Suisse valuation tool that derives the stock price based on a
company's cash flow return on investment (CFROI®) and estimated asset growth rates.
Based on our modelled assumptions, CS HOLT® would value GPSC at Bt34/share (Figure
34), which is in-line with our DCF-based valuation methodology.

20 April 2016
Global Power Synergy
(GPSC.BK) 18
Figure 34: Relative wealth chart and HOLT®-derived valuation
Current Price: THB 25.25 Warranted Price: THB 34.10 Valuation date: 19-Apr-16
Sales Growth (parallel % point change to forecasts) Dec 14A Dec 15A Dec 16E Dec 17E Dec 18E
THB -2.0% -1.0% 0.0% 1.0% 2.0% Sales Growth, % -9.8 -5.1 -2.4 21.4 22.7
EBITDA Mgn, % 12.1 12.8 17.2 17.5 17.9
Asset Turns, x 0.49 0.4 0.3 0.4 0.4
CFROI®, % 3.5 2.8 2.9 3.5 5.1
Disc Rate, % 4.2 4.7 4.3 4.3 4.3
Asset Grth, % 1.9 29.9 6.2 5.8 0.4
Value/Cost, x 0.3 1.0 1.1 1.1 1.0
Economic PE, x 9.8 35.6 38.0 31.4 20.4
Leverage, % 0.0 28.7 33.2 36.7 36.6
HO
LT
-
C
red
it S
uis
se A
naly
st
Scen
ari
o D
ata
GLOBAL POWER SYNERGY PCL
(GPSC)
EB
ITD
A M
arg
in (
para
llel
% p
oin
t ch
an
ge
to f
ore
casts
)
-2.0% 9.0% 13.6% 18.7% 24.3%
48.8%
30.4%
-1.0% 16.1% 21.3% 26.9% 33.0% 39.6%
0.0% 23.3% 29.0% 35.1% 41.6%
67.0%
1.0% 30.6% 36.6% 43.2% 50.2% 57.9%
2.0% 37.8% 44.3% 51.3% 58.8%
More than
10%
downside
Within 10%More than
10% upside
Source: Credit Suisse HOLT®. CFROI and HOLTare trademarks or registered trademarks of Credit Suisse Group AG or its affiliates in the United States and other countries.
-15
-10
-5
0
5
10
15
20
25
2013 2015 2017 2019
Sales Growth (%)
0
5
10
15
20
25
2013 2015 2017 2019
EBITDA Margin
0.0
0.1
0.2
0.3
0.4
0.5
0.6
2013 2015 2017 2019
Asset Turns (x)
0
1
2
3
4
5
6
7
2013 2015 2017 2019Historical CFROI Historical Transaction CFROIForecast CFROI Forecast CFROICFROI Discount Rate
CFROI & Discount Rate (in %)
-5
0
5
10
15
20
25
30
35
2013 2015 2017 2019
Historical Asset Growth Rate Forecast GrowthForecast Growth RAGRNormalised Growth Rate
Asset Growth (in %)
Source: Credit Suisse HOLT
®

20 April 2016
Global Power Synergy
(GPSC.BK) 19
Risks Operating risk: Reliability and efficiency of plants
The biggest risk for GPSC’s operation is plant reliability. Sriracha gas-fired IPP power
plant has a guaranteed return without price or demand risk under the 25 years power
Purchase Agreement (PPAs) with EGAT. We estimate that 26% of GPSC’s earnings is
being generated from this IPP business. EGAT is committed to paying 'Availability
Payment' to IPPs as long as its plants are available for dispatch regardless of the actual
dispatch. Its cogeneration business, which supply electricity and steam to PTT group and
other industrial users, has a minimum take-or-pay agreement to protect the risk from lower
demand. However, the segment may experience a temporary margin squeeze during the
period of rising energy price. Revenue is linked to tariffs of the Provincial Electricity
Authority (PEA) as announced by the Energy Regulatory Commission (ERC). ERC may
delay tariff increase to calm public sentiment.
Risk from PTT group
GPSC is heavily relying on PTT group as its main customer. 56% of GPSC’s revenue
came from sales to PTT group companies in 2015. Potential risks from PTT group are
demand risk and risk of PTT group renegotiating sales contracts.
PTT group, with most of its operations in the petrochem and related business, is the major
client of GPSC. Petrochemical business is cyclical in nature, and as they often have
similar maintenance plan. There is a minimum take-or-pay agreements (75-80% of the
contracted volume) with its customers, as well; GPSC has scheduled its maintenance plan
in accordance with the maintenance schedule of its clients.
There is a risk that PTT group may renegotiate terms for sales contracts with GPSC for a
lower price. However, under securities laws concerning connected transactions, any
changes demanded by PTT group which could cause significant impact to GPSC will
require shareholder approval.
The government has never renegotiated prices after the PPAs were signed
Regulatory risk is low. EGAT (33% of GPSC’s FY16E revenue) has never renegotiated
guaranteed prices or returns in any PPAs with the private sector after constructions have
started, even in tough economic periods such as 1997 or 2009. There is also no history of
default in payment to private power producers.
Development risk: delay and cost overrun
579 MW (30%) of GPSC’s capacity portfolio is being under construction stage, of which
347 MW is hydroelectric power plants in Laos including Xayaburi (25%-owned 1,285 MW)
and Nam Lik 1 (40%-owned 65 MW).
Xayaburi is the first run-of-the-river dam located in the Lower Mekong River, and is facing
strong public scrutiny over environmental impact. Recently, the concerns raised by The
Mekong River Commission and Laos government to the project owners will result in
additional investment costs for this project of Bt19 bn. We have already factored in the
increased costs into our forecast. We have valued Xayaburi with a set of conservative
assumptions, resulting in an estimated equity IRR of only 7% (versus 10%+ guidance).
Our DCF-based NAV has Bt4.8/share contribution from Xayaburi project.
Nam Lik 1 project could also experience a delay in construction. We have assumed the
plant to begin operation in 2H18, one year delay from current guidance. Nam Lik 1 project
contributes Bt0.8/share to our DCF-based NAV calculation.
The biggest risk for GPSC’s
operation is plant reliability
Potential risks from PTT
group are demand risk and
risk of PTT group
renegotiating sales
contracts
Low regulatory risk
We have already factored in
a potential cost overrun and
delay of its development of
hydroelectric power plants in
Laos
20 April 2016
Global Power Synergy
(GPSC.BK) 20
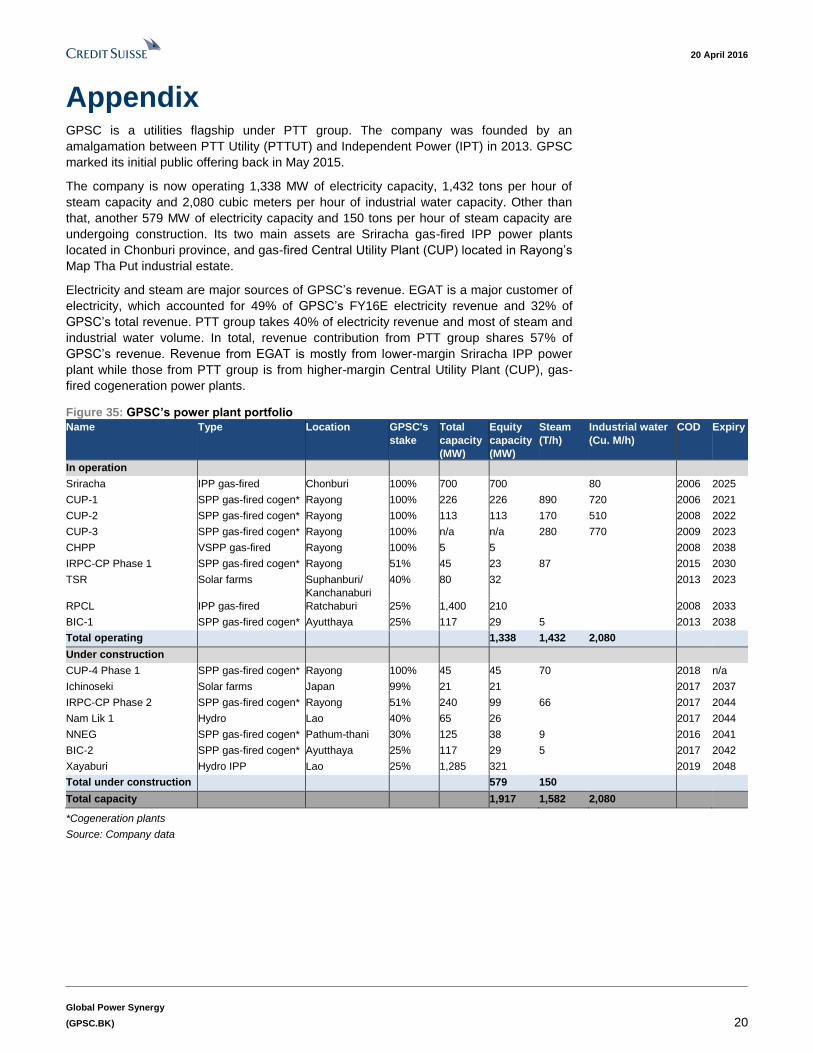
Appendix GPSC is a utilities flagship under PTT group. The company was founded by an
amalgamation between PTT Utility (PTTUT) and Independent Power (IPT) in 2013. GPSC
marked its initial public offering back in May 2015.
The company is now operating 1,338 MW of electricity capacity, 1,432 tons per hour of
steam capacity and 2,080 cubic meters per hour of industrial water capacity. Other than
that, another 579 MW of electricity capacity and 150 tons per hour of steam capacity are
undergoing construction. Its two main assets are Sriracha gas-fired IPP power plants
located in Chonburi province, and gas-fired Central Utility Plant (CUP) located in Rayong’s
Map Tha Put industrial estate.
Electricity and steam are major sources of GPSC’s revenue. EGAT is a major customer of
electricity, which accounted for 49% of GPSC’s FY16E electricity revenue and 32% of
GPSC’s total revenue. PTT group takes 40% of electricity revenue and most of steam and
industrial water volume. In total, revenue contribution from PTT group shares 57% of
GPSC’s revenue. Revenue from EGAT is mostly from lower-margin Sriracha IPP power
plant while those from PTT group is from higher-margin Central Utility Plant (CUP), gas-
fired cogeneration power plants.
Figure 35: GPSC’s power plant portfolio
Name Type Location GPSC's
stake
Total
capacity
(MW)
Equity
capacity
(MW)
Steam
(T/h)
Industrial water
(Cu. M/h)
COD Expiry
In operation
Sriracha IPP gas-fired Chonburi 100% 700 700 80 2006 2025
CUP-1 SPP gas-fired cogen* Rayong 100% 226 226 890 720 2006 2021
CUP-2 SPP gas-fired cogen* Rayong 100% 113 113 170 510 2008 2022
CUP-3 SPP gas-fired cogen* Rayong 100% n/a n/a 280 770 2009 2023
CHPP VSPP gas-fired Rayong 100% 5 5 2008 2038
IRPC-CP Phase 1 SPP gas-fired cogen* Rayong 51% 45 23 87 2015 2030
TSR Solar farms Suphanburi/
Kanchanaburi
40% 80 32 2013 2023
RPCL IPP gas-fired Ratchaburi 25% 1,400 210 2008 2033
BIC-1 SPP gas-fired cogen* Ayutthaya 25% 117 29 5 2013 2038
Total operating 1,338 1,432 2,080
Under construction
CUP-4 Phase 1 SPP gas-fired cogen* Rayong 100% 45 45 70 2018 n/a
Ichinoseki Solar farms Japan 99% 21 21 2017 2037
IRPC-CP Phase 2 SPP gas-fired cogen* Rayong 51% 240 99 66 2017 2044
Nam Lik 1 Hydro Lao 40% 65 26 2017 2044
NNEG SPP gas-fired cogen* Pathum-thani 30% 125 38 9 2016 2041
BIC-2 SPP gas-fired cogen* Ayutthaya 25% 117 29 5 2017 2042
Xayaburi Hydro IPP Lao 25% 1,285 321 2019 2048
Total under construction 579 150
Total capacity 1,917 1,582 2,080
*Cogeneration plants
Source: Company data
20 April 2016
Global Power Synergy
(GPSC.BK) 21
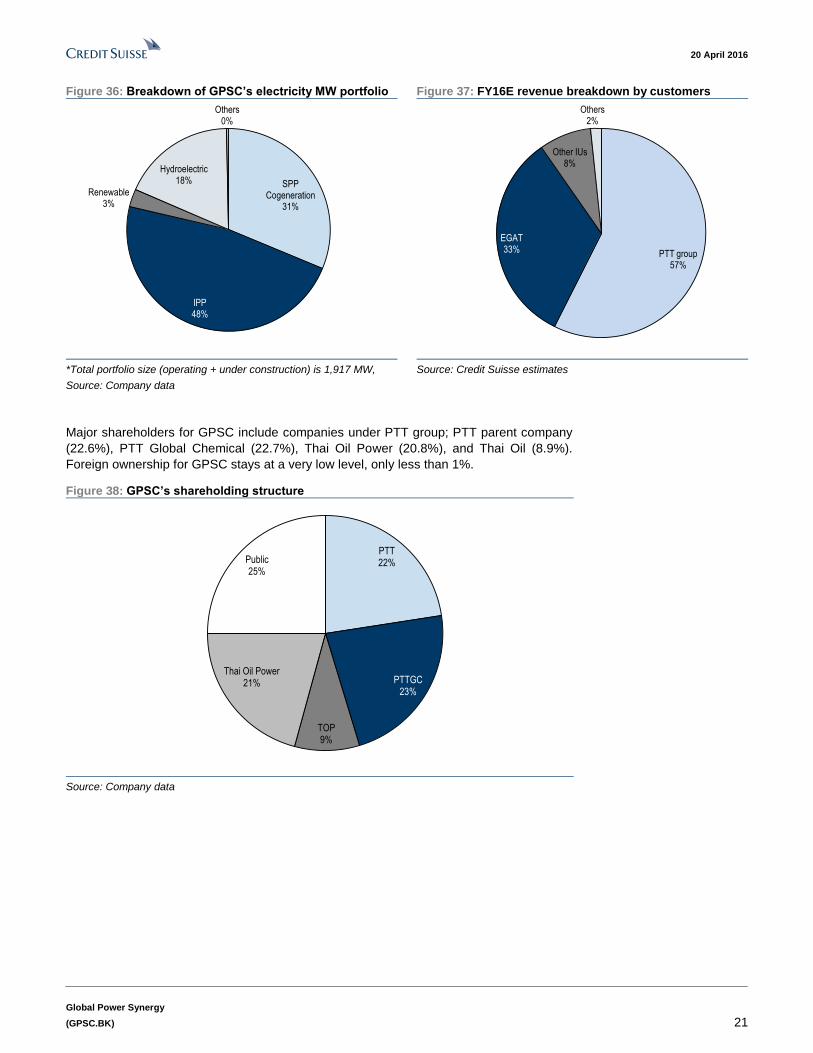
Figure 36: Breakdown of GPSC’s electricity MW portfolio Figure 37: FY16E revenue breakdown by customers
SPP Cogeneration
31%
IPP48%
Renewable3%
Hydroelectric18%
Others0%
PTT group57%
EGAT33%
Other IUs8%
Others2%
*Total portfolio size (operating + under construction) is 1,917 MW,
Source: Company data
Source: Credit Suisse estimates
Major shareholders for GPSC include companies under PTT group; PTT parent company
(22.6%), PTT Global Chemical (22.7%), Thai Oil Power (20.8%), and Thai Oil (8.9%).
Foreign ownership for GPSC stays at a very low level, only less than 1%.
Figure 38: GPSC’s shareholding structure
PTT22%
PTTGC23%
TOP9%
Thai Oil Power21%
Public25%
Source: Company data
20 April 2016
Global Power Synergy
(GPSC.BK) 22
Companies Mentioned (Price as of 20-Apr-2016)
Aboitiz Power Corp (AP.PS, P43.85) Beijing Jingneng Power Co Ltd (600578.SS, Rmb4.76) CLP Holdings Limited (0002.HK, HK$72.65) China Resources Power Holdings (0836.HK, HK$14.24) China Yangtze Power Co Ltd (600900.SS, Rmb12.47) Datang International Power Generation Co. Ltd. (0991.HK, HK$2.27) Electricity Generating (EGCO.BK, Bt190.0) Energy Absolute (EAm.BK, Bt21.8) Energy Development Corporation (EDC.PS, P5.79) First Gen Corporation (FGEN.PS, P21.0) Global Power Synergy (GPSC.BK, Bt26.0, OUTPERFORM[V], TP Bt34.0) Glow Energy PCL (GLOW.BK, Bt94.0) Huadian Fuxin Energy Corporation Limited (0816.HK, HK$1.98) Huadian Power International (1071.HK, HK$4.27) Huaneng Power International Inc (0902.HK, HK$6.37) Hub Power Company (HPWR.KA, PRs104.53) K-Electric (KELE.KA, PRs7.22) Korea Electric Power (015760.KS, W59,900) Longyuan Power (0916.HK, HK$5.66) Malakoff Bhd (MALA.KL, RM1.68) Manila Electric (Meralco) (MER.PS, P336.0) NTPC Ltd (NTPC.BO, Rs141.2) Power Assets Holdings Limited (0006.HK, HK$80.15) Ratchaburi Electricity Generating Holding PCL (RATCH.BK, Bt50.25) SDIC Power Holdings (600886.SS, Rmb6.46) SPCG (SPCG.BK, Bt20.6) Sichuan Chuantou Energy (600674.SS, Rmb8.37) Tenaga (TENA.KL, RM14.4)
Disclosure Appendix
Important Global Disclosures
I, Wattana Punyawattanakul, certify that (1) the views expressed in this report accurately reflect my personal views about all of the subject companies and securities and (2) no part of my compensation was, is or will be directly or indirectly related to the specific recommendations or views expressed in this report.
The analyst(s) responsible for preparing this research report received Compensation that is based upon various factors including Credit Suisse's total revenues, a portion of which are generated by Credit Suisse's investment banking activities
As of December 10, 2012 Analysts’ stock rating are defined as follows:
Outperform (O) : The stock’s total return is expected to outperform the relevant benchmark* over the next 12 months.
Neutral (N) : The stock’s total return is expected to be in line with the relevant benchmark* over the next 12 months.
Underperform (U) : The stock’s total return is expected to underperform the relevant benchmark* over the next 12 months.
*Relevant benchmark by region: As of 10th December 2012, Japanese ratings are based on a stock’s total return relative to the analyst's coverage universe which consists of all companies covered by the analyst within the relevant sector, with Outperforms representing the most attractiv e, Neutrals the less attractive, and Underperforms the least attractive investment opportunities. As of 2nd October 2012, U.S. and Canadian as well as European ra tings are based on a stock’s total return relative to the analyst's coverage universe which consists of all companies covered by the analyst within the relevant sector, with Outperforms representing the most attractive, Neutrals the less attractive, and Underperforms the least attractive investment opportunities. For Latin Ame rican and non-Japan Asia stocks, ratings are based on a stock’s total return relative to the average total return of the relevant country or regional benchmark; prior to 2nd October 2012 U.S. and Canadian ratings were based on (1) a stock’s absolute total return potential to its current share price and (2) the relative attractiveness of a stock’s total return potential within an analyst’s coverage universe. For Australian and New Zealand stocks, the expected total return (ETR) calculation includes 1 2-month rolling dividend yield. An Outperform rating is assigned where an ETR is greater than or equal to 7.5%; Underperform where an ETR less than or equal to 5%. A Neutral may be a ssigned where the ETR is between -5% and 15%. The overlapping rating range allows analysts to assign a rating that puts ETR in the context of associated risks. Prior to 18 May 2015, ETR ranges for Outperform and Underperform ratings did not overlap with Neutral thresholds between 15% and 7.5%, wh ich was in operation from 7 July 2011.
Restricted (R) : In certain circumstances, Credit Suisse policy and/or applicable law and regulations preclude certain types of communications, including an investment recommendation, during the course of Credit Suisse's engagement in an investment banking transaction and in certain other circumstances.
Volatility Indicator [V] : A stock is defined as volatile if the stock price has moved up or down by 20% or more in a month in at least 8 of the past 24 months or the analyst expects significant volatility going forward.
Analysts’ sector weightings are distinct from analysts’ stock ratings and are based on the analyst’s expectations for the fundamentals and/or valuation of the sector* relative to the group’s historic fundamentals and/or valuation:
Overweight : The analyst’s expectation for the sector’s fundamentals and/or valuation is favorable over the next 12 months.
Market Weight : The analyst’s expectation for the sector’s fundamentals and/or valuation is neutral over the next 12 months.
20 April 2016
Global Power Synergy
(GPSC.BK) 23
Underweight : The analyst’s expectation for the sector’s fundamentals and/or valuation is cautious over the next 12 months.
*An analyst’s coverage sector consists of all companies covered by the analyst within the relevant sector. An analyst may cover multiple sectors.
Credit Suisse's distribution of stock ratings (and banking clients) is:
Global Ratings Distribution
Rating Versus universe (%) Of which banking clients (%)
Outperform/Buy* 57% (39% banking clients)
Neutral/Hold* 32% (28% banking clients)
Underperform/Sell* 10% (50% banking clients)
Restricted 1%
*For purposes of the NYSE and NASD ratings distribution disclosure requirements, our stock ratings of Outperform, Neutral, and Unde rperform most closely correspond to Buy, Hold, and Sell, respectively; however, the meanings are not the same, as our stock ratings are determined on a relative basis. (Please refer to definitions above.) An investor's decision to buy or sell a security should be based on investment objectives, current holdin gs, and other individual factors.
Credit Suisse’s policy is to update research reports as it deems appropriate, based on developments with the subject company, the sector or the market that may have a material impact on the research views or opinions stated herein.
Credit Suisse's policy is only to publish investment research that is impartial, independent, clear, fair and not misleading. For more detail please refer to Credit Suisse's Policies for Managing Conflicts of Interest in connection with Investment Research: http://www.csfb.com/research-and-analytics/disclaimer/managing_conflicts_disclaimer.html
Credit Suisse does not provide any tax advice. Any statement herein regarding any US federal tax is not intended or written to be used, and cannot be used, by any taxpayer for the purposes of avoiding any penalties.
This material is intended for your use only and not for general distribution. This material is not intended to promote or procure a particular outcome in the UK referendum on membership of the European Union (the “Referendum”). Credit Suisse does not promote or endorse either campaign in the Referendum. This material does not constitute, and should not be interpreted as, a recommendation by Credit Suisse as to the merits of a particular outcome of the Referendum.
Target Price and Rating Valuation Methodology and Risks: (12 months) for Global Power Synergy (GPSC.BK)
Method: Our DCF (discounted cash flow)-based target price for Global Power Synergy is Bt34/share. We employ a 7.7% cost of equity (beta of 0.5x) and 6.5% WACC (weighted average cost of capital). We do not apply terminal value into our calculation. We do not include any value from potential non-committed projects. Our OUTPERFORM rating is due to its strong organic growth outlook.
Risk: Key risks to our target price for GPSC of Bt34/share and OUTPERFORM rating include: (1) potential amendment or abide to PPA from PTT group; (2) risk from construction delay and cost overrun; and (3) production disruption resulting in lower than- expected revenue under the Availability Payment scheme.
Please refer to the firm's disclosure website at https://rave.credit-suisse.com/disclosures for the definitions of abbreviations typically used in the target price method and risk sections.
See the Companies Mentioned section for full company names
The subject company (GPSC.BK, RATCH.BK, GLOW.BK, SPCG.BK, EGCO.BK) currently is, or was during the 12-month period preceding the date of distribution of this report, a client of Credit Suisse.
Credit Suisse provided investment banking services to the subject company (GLOW.BK) within the past 12 months.
Credit Suisse has received investment banking related compensation from the subject company (GLOW.BK) within the past 12 months
Credit Suisse expects to receive or intends to seek investment banking related compensation from the subject company (GPSC.BK, RATCH.BK, GLOW.BK, SPCG.BK, EAm.BK, EGCO.BK) within the next 3 months.
Please visit https://credit-suisse.com/in/researchdisclosure for additional disclosures mandated vide Securities And Exchange Board of India (Research Analysts) Regulations, 2014
Credit Suisse may have interest in (NTPC.BO)
For other important disclosures concerning companies featured in this report, including price charts, please visit the website at https://rave.credit-suisse.com/disclosures or call +1 (877) 291-2683.
Important Regional Disclosures
Singapore recipients should contact Credit Suisse AG, Singapore Branch for any matters arising from this research report.
The analyst(s) involved in the preparation of this report may participate in events hosted by the subject company, including site visits. Credit Suisse does not accept or permit analysts to accept payment or reimbursement for travel expenses associated with these events.
20 April 2016
Global Power Synergy
(GPSC.BK) 24
Restrictions on certain Canadian securities are indicated by the following abbreviations: NVS--Non-Voting shares; RVS--Restricted Voting Shares; SVS--Subordinate Voting Shares.
Individuals receiving this report from a Canadian investment dealer that is not affiliated with Credit Suisse should be advised that this report may not contain regulatory disclosures the non-affiliated Canadian investment dealer would be required to make if this were its own report.
For Credit Suisse Securities (Canada), Inc.'s policies and procedures regarding the dissemination of equity research, please visit https://www.credit-suisse.com/sites/disclaimers-ib/en/canada-research-policy.html.
Credit Suisse has acted as lead manager or syndicate member in a public offering of securities for the subject company (GLOW.BK) within the past 3 years.
As of the date of this report, Credit Suisse acts as a market maker or liquidity provider in the equities securities that are the subject of this report.
Principal is not guaranteed in the case of equities because equity prices are variable.
Commission is the commission rate or the amount agreed with a customer when setting up an account or at any time after that.
For Thai listed companies mentioned in this report, the independent 2014 Corporate Governance Report survey results published by the Thai Institute of Directors Association are being disclosed pursuant to the policy of the Office of the Securities and Exchange Commission: Global Power Synergy () , Ratchaburi Electricity Generating Holding PCL (Excellent) , Glow Energy PCL (Good) , SPCG (Good) , Energy Absolute () , Electricity Generating (Excellent)
To the extent this is a report authored in whole or in part by a non-U.S. analyst and is made available in the U.S., the following are important disclosures regarding any non-U.S. analyst contributors: The non-U.S. research analysts listed below (if any) are not registered/qualified as research analysts with FINRA. The non-U.S. research analysts listed below may not be associated persons of CSSU and therefore may not be subject to the NASD Rule 2711 and NYSE Rule 472 restrictions on communications with a subject company, public appearances and trading securities held by a research analyst account.
Credit Suisse Securities (Thailand) Limited ................................................................................................................... Wattana Punyawattanakul
Important Credit Suisse HOLT Disclosures
With respect to the analysis in this report based on the Credit Suisse HOLT methodology, Credit Suisse certifies that (1) the views expressed in this report accurately reflect the Credit Suisse HOLT methodology and (2) no part of the Firm’s compensation was, is, or will be directly related to the specific views disclosed in this report.
The Credit Suisse HOLT methodology does not assign ratings to a security. It is an analytical tool that involves use of a set of proprietary quantitative algorithms and warranted value calculations, collectively called the Credit Suisse HOLT valuation model, that are consistently applied to all the companies included in its database. Third-party data (including consensus earnings estimates) are systematically translated into a number of default algorithms available in the Credit Suisse HOLT valuation model. The source financial statement, pricing, and earnings data provided by outside data vendors are subject to quality control and may also be adjusted to more closely measure the underlying economics of firm performance. The adjustments provide consistency when analyzing a single company across time, or analyzing multiple companies across industries or national borders. The default scenario that is produced by the Credit Suisse HOLT valuation model establishes the baseline valuation for a security, and a user then may adjust the default variables to produce alternative scenarios, any of which could occur.
Additional information about the Credit Suisse HOLT methodology is available on request.
The Credit Suisse HOLT methodology does not assign a price target to a security. The default scenario that is produced by the Credit Suisse HOLT valuation model establishes a warranted price for a security, and as the third-party data are updated, the warranted price may also change. The default variable may also be adjusted to produce alternative warranted prices, any of which could occur.
CFROI®, HOLT, HOLTfolio, ValueSearch, AggreGator, Signal Flag and “Powered by HOLT” are trademarks or service marks or registered trademarks or registered service marks of Credit Suisse or its affiliates in the United States and other countries. HOLT is a corporate performance and valuation advisory service of Credit Suisse.
For Credit Suisse disclosure information on other companies mentioned in this report, please visit the website at https://rave.credit-suisse.com/disclosures or call +1 (877) 291-2683.

20 April 2016
Global Power Synergy
(GPSC.BK) 25
References in this report to Credit Suisse include all of the subsidiaries and affiliates of Credit Suisse operating under its investment banking division. For more information on our structure, please use the following link: https://www.credit-suisse.com/who-we-are This report may contain material that is not directed to, or intended for distribution to or use by, any person or entity who is a citizen or resident of or located in any locality, state, country or other jurisdiction where such distribution, publication, availability or use would be contrary to law or regulation or which would subject Credit Suisse AG or its affiliates ("CS") to any registration or licensing requirement within such jurisdiction. All material presented in this report, unless specifically indicated otherwise, is under copyright to CS. None of the material, nor its content, nor any copy of it, may be altered in any way, transmitted to, copied or distributed to any other party, without the prior express written permission of CS. All trademarks, service marks and logos used in this report are trademarks or service marks or registered trademarks or service marks of CS or its affiliates. The information, tools and material presented in this report are provided to you for information purposes only and are not to be used or considered as an offer or the solicitation of an offer to sell or to buy or subscribe for securities or other financial instruments. CS may not have taken any steps to ensure that the securities referred to in this report are suitable for any particular investor. CS will not treat recipients of this report as its customers by virtue of their receiving this report. The investments and services contained or referred to in this report may not be suitable for you and it is recommended that you consult an independent investment advisor if you are in doubt about such investments or investment services. Nothing in this report constitutes investment, legal, accounting or tax advice, or a representation that any investment or strategy is suitable or appropriate to your individual circumstances, or otherwise constitutes a personal recommendation to you. CS does not advise on the tax consequences of investments and you are advised to contact an independent tax adviser. Please note in particular that the bases and levels of taxation may change. Information and opinions presented in this report have been obtained or derived from sources believed by CS to be reliable, but CS makes no representation as to their accuracy or completeness. CS accepts no liability for loss arising from the use of the material presented in this report, except that this exclusion of liability does not apply to the extent that such liability arises under specific statutes or regulations applicable to CS. This report is not to be relied upon in substitution for the exercise of independent judgment. CS may have issued, and may in the future issue, other communications that are inconsistent with, and reach different conclusions from, the information presented in this report. Those communications reflect the different assumptions, views and analytical methods of the analysts who prepared them and CS is under no obligation to ensure that such other communications are brought to the attention of any recipient of this report. Some investments referred to in this report will be offered solely by a single entity and in the case of some investments solely by CS, or an associate of CS or CS may be the only market maker in such investments. Past performance should not be taken as an indication or guarantee of future performance, and no representation or warranty, express or implied, is made regarding future performance. Information, opinions and estimates contained in this report reflect a judgment at its original date of publication by CS and are subject to change without notice. The price, value of and income from any of the securities or financial instruments mentioned in this report can fall as well as rise. The value of securities and financial instruments is subject to exchange rate fluctuation that may have a positive or adverse effect on the price or income of such securities or financial instruments. Investors in securities such as ADR's, the values of which are influenced by currency volatility, effectively assume this risk. Structured securities are complex instruments, typically involve a high degree of risk and are intended for sale only to sophisticated investors who are capable of understanding and assuming the risks involved. The market value of any structured security may be affected by changes in economic, financial and political factors (including, but not limited to, spot and forward interest and exchange rates), time to maturity, market conditions and volatility, and the credit quality of any issuer or reference issuer. Any investor interested in purchasing a structured product should conduct their own investigation and analysis of the product and consult with their own professional advisers as to the risks involved in making such a purchase. Some investments discussed in this report may have a high level of volatility. High volatility investments may experience sudden and large falls in their value causing losses when that investment is realised. Those losses may equal your original investment. Indeed, in the case of some investments the potential losses may exceed the amount of initial investment and, in such circumstances, you may be required to pay more money to support those losses. Income yields from investments may fluctuate and, in consequence, initial capital paid to make the investment may be used as part of that income yield. Some investments may not be readily realisable and it may be difficult to sell or realise those investments, similarly it may prove difficult for you to obtain reliable information about the value, or risks, to which such an investment is exposed. This report may provide the addresses of, or contain hyperlinks to, websites. Except to the extent to which the report refers to website material of CS, CS has not reviewed any such site and takes no responsibility for the content contained therein. Such address or hyperlink (including addresses or hyperlinks to CS's own website material) is provided solely for your convenience and information and the content of any such website does not in any way form part of this document. Accessing such website or following such link through this report or CS's website shall be at your own risk. This report is issued and distributed in Europe (except Switzerland) by Credit Suisse Securities (Europe) Limited, One Cabot Square, London E14 4QJ, England, which is authorised by the Prudential Regulation Authority and regulated by the Financial Conduct Authority and the Prudential Regulation Authority. This report is issued and distributed in Europe (except Switzerland) by Credit Suisse International, One Cabot Square, London E14 4QJ, England, which is authorised by the Prudential Regulation Authority and regulated by the Financial Conduct Authority and the Prudential Regulation Authority. This report is being distributed in Germany by Credit Suisse Securities (Europe) Limited Niederlassung Frankfurt am Main regulated by the Bundesanstalt fuer Finanzdienstleistungsaufsicht ("BaFin"). This report is being distributed in the United States and Canada by Credit Suisse Securities (USA) LLC; in Switzerland by Credit Suisse AG; in Brazil by Banco de Investimentos Credit Suisse (Brasil) S.A or its affiliates; in Mexico by Banco Credit Suisse (México), S.A. (transactions related to the securities mentioned in this report will only be effected in compliance with applicable regulation); in Japan by Credit Suisse Securities (Japan) Limited, Financial Instruments Firm, Director-General of Kanto Local Finance Bureau (Kinsho) No. 66, a member of Japan Securities Dealers Association, The Financial Futures Association of Japan, Japan Investment Advisers Association, Type II Financial Instruments Firms Association; elsewhere in Asia/ Pacific by whichever of the following is the appropriately authorised entity in the relevant jurisdiction: Credit Suisse (Hong Kong) Limited, Credit Suisse Equities (Australia) Limited, Credit Suisse Securities (Thailand) Limited, regulated by the Office of the Securities and Exchange Commission, Thailand, having registered address at 990 Abdulrahim Place, 27th Floor, Unit 2701, Rama IV Road, Silom, Bangrak, Bangkok 10500, Thailand, Tel. +66 2614 6000, Credit Suisse Securities (Malaysia) Sdn Bhd, Credit Suisse AG, Singapore Branch, Credit Suisse Securities (India) Private Limited (CIN no. U67120MH1996PTC104392) regulated by the Securities and Exchange Board of India as Research Analyst (registration no. INH 000001030) and as Stock Broker (registration no. INB230970637; INF230970637; INB010970631; INF010970631), having registered address at 9th Floor, Ceejay House, Dr.A.B. Road, Worli, Mumbai - 18, India, T- +91-22 6777 3777, Credit Suisse Securities (Europe) Limited, Seoul Branch, Credit Suisse AG, Taipei Securities Branch, PT Credit Suisse Securities Indonesia, Credit Suisse Securities (Philippines ) Inc., and elsewhere in the world by the relevant authorised affiliate of the above. Credit Suisse (Hong Kong) Limited ("CSHK") is licensed and regulated by the Securities and Futures Commission of Hong Kong under the laws of Hong Kong, which differ from Australian laws. CSHKL does not hold an Australian financial services licence (AFSL) and is exempt from the requirement to hold an AFSL under the Corporations Act 2001 (the Act) under Class Order 03/1103 published by the ASIC in respect of financial services provided to Australian wholesale clients (within the meaning of section 761G of the Act). Research on Taiwanese securities produced by Credit Suisse AG, Taipei Securities Branch has been prepared by a registered Senior Business Person. Research provided to residents of Malaysia is authorised by the Head of Research for Credit Suisse Securities (Malaysia) Sdn Bhd, to whom they should direct any queries on +603 2723 2020. This report has been prepared and issued for distribution in Singapore to institutional investors, accredited investors and expert investors (each as defined under the Financial Advisers Regulations) only, and is also distributed by Credit Suisse AG, Singapore branch to overseas investors (as defined under the Financial Advisers Regulations). By virtue of your status as an institutional investor, accredited investor, expert investor or overseas investor, Credit Suisse AG, Singapore branch is exempted from complying with certain compliance requirements under the Financial Advisers Act, Chapter 110 of Singapore (the "FAA"), the Financial Advisers Regulations and the relevant Notices and Guidelines issued thereunder, in respect of any financial advisory service which Credit Suisse AG, Singapore branch may provide to you. This information is being distributed by Credit Suisse AG (DIFC Branch), duly licensed and regulated by the Dubai Financial Services Authority (“DFSA”). Related financial services or products are only made available to Professional Clients or Market Counterparties, as defined by the DFSA, and are not intended for any other persons. Credit Suisse AG (DIFC Branch) is located on Level 9 East, The Gate Building, DIFC, Dubai, United Arab Emirates. This research may not conform to Canadian disclosure requirements. In jurisdictions where CS is not already registered or licensed to trade in securities, transactions will only be effected in accordance with applicable securities legislation, which will vary from jurisdiction to jurisdiction and may require that the trade be made in accordance with applicable exemptions from registration or licensing requirements. Non-U.S. customers wishing to effect a transaction should contact a CS entity in their local jurisdiction unless governing law permits otherwise. U.S. customers wishing to effect a transaction should do so only by contacting a representative at Credit Suisse Securities (USA) LLC in the U.S. Please note that this research was originally prepared and issued by CS for distribution to their market professional and institutional investor customers. Recipients who are not market professional or institutional investor customers of CS should seek the advice of their independent financial advisor prior to taking any investment decision based on this report or for any necessary explanation of its contents. This research may relate to investments or services of a person outside of the UK or to other matters which are not authorised by the Prudential Regulation Authority and regulated by the Financial Conduct Authority and the Prudential Regulation Authority or in respect of which the protections of the Prudential Regulation Authority and Financial Conduct Authority for private customers and/or the UK compensation scheme may not be available, and further details as to where this may be the case are available upon request in respect of this report. CS may provide various services to US municipal entities or obligated persons ("municipalities"), including suggesting individual transactions or trades and entering into such transactions. Any services CS provides to municipalities are not viewed as "advice" within the meaning of Section 975 of the Dodd-Frank Wall Street Reform and Consumer Protection Act. CS is providing any such services and related information solely on an arm's length basis and not as an advisor or fiduciary to the municipality. In connection with the provision of the any such services, there is no agreement, direct or indirect, between any municipality (including the officials, management, employees or agents thereof) and CS for CS to provide advice to the municipality. Municipalities should consult with their financial, accounting and legal advisors regarding any such services provided by CS. In addition, CS is not acting for direct or indirect compensation to solicit the municipality on behalf of an unaffiliated broker, dealer, municipal securities dealer, municipal advisor, or investment adviser for the purpose of obtaining or retaining an engagement by the municipality for or in connection with Municipal Financial Products, the issuance of municipal securities, or of an investment adviser to provide investment advisory services to or on behalf of the municipality. If this report is being distributed by a financial institution other than Credit Suisse AG, or its affiliates, that financial institution is solely responsible for distribution. Clients of that institution should contact that institution to effect a transaction in the securities mentioned in this report or require further information. This report does not constitute investment advice by Credit Suisse to the clients of the distributing financial institution, and neither Credit Suisse AG, its affiliates, and their respective officers, directors and employees accept any liability whatsoever for any direct or consequential loss arising from their use of this report or its content. Principal is not guaranteed. Commission is the commission rate or the amount agreed with a customer when setting up an account or at any time after that. Copyright © 2016 CREDIT SUISSE AG and/or its affiliates. All rights reserved.
Investment principal on bonds can be eroded depending on sale price or market price. In addition, there are bonds on which investment principal can be eroded due to changes in redemption amounts. Care is required when investing in such instruments. When you purchase non-listed Japanese fixed income securities (Japanese government bonds, Japanese municipal bonds, Japanese government guaranteed bonds, Japanese corporate bonds) from CS as a seller, you will be requested to pay the purchase price only.
UT0421.doc