Embed Size (px)
Citation preview

Global Ports Holding Update Presentation
July 2016 | Strictly Private and Confidential

Disclaimer
The information contained in this document has been prepared by Global Ports Holdings (GPH) and has not been independently verified. No representation
or warranty, express or implied, is made as to, and no reliance should be placed on, the fairness, accuracy, completeness or correctness of the information or
opinions contained in this document. This document may also contain certain forward-looking statements concerning the future performance of GPH and
should be considered as good faith estimates. These forward-looking statements reflect management expectations and are based upon current data. Actual
results are subject to future events and uncertainties, which could materially impact GPH’s actual performance.
GPH, and its affiliates, advisors or representatives, shall have no liability whatsoever for any loss howsoever arising from any use of this document or its
contents or otherwise arising in connection with this document. GPH undertakes no obligation to update any forward-looking statements, whether as a result
of new information, future events or otherwise. Therefore you should not place undue reliance upon such statements.
1
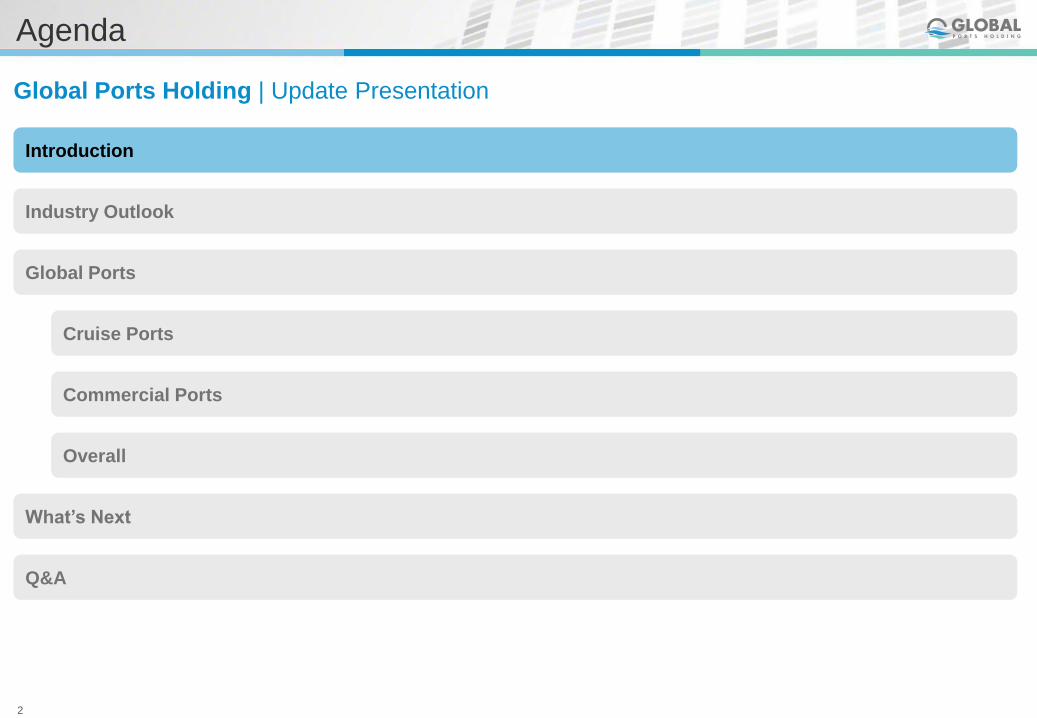
Agenda
Global Ports Holding | Update Presentation
Commercial Ports
Overall
What’s Next
Q&A
Introduction
Industry Outlook
Global Ports
Cruise Ports
2

Today’s Presenters
Previously served as Chief Business Development Officer at Vimpelcom, Amsterdam, and Senior Advisor at Verizon, New York
Held various high-level positions such as Chief Commercial Officer, Consumer and Chief Commercial Officer, Corporate Services in
Turkcell, reporting directly to the CEO, for seven years
Acted as General Manager of Kodak, CMO of Microsoft Turkey and variety of high level positions in Unilever within the Marketing and
Management of Chain Stores
BSc degree in Industrial Engineering from Boğaziçi University and a postgraduate degree in Systems Engineering from Rutgers and
Princeton Universities
Previously served as Head of Investment Banking in Global Securities and Head of Business Development in Global Yatirim Holding
Held various executive positions including CEO, in leading energy and mining groups for five years
BSc degree in Electrical and Electronics Engineering and a MBA degree from Bilkent University
Head of Corporate Finance at Global Securities, part of GIH, and advisor to the GPH Board
Previously led the Structured Finance activities of Fresenius VAMED Germany
Held various positions at IEG in Berlin, Barclays Capital Investment Banking Division and Deutsche Bahn
Master’s degree from ESCP Europe
EBRD
Partnership
EBRD
Partnership Mehmet Ali Deniz
Director, Head of Global
Strategy & M&A
since 2014
EBRD
Partnership Jan Fomferra
Advisor to the GPH Board
3
Emre Sayın
GPH CEO since 2016
Source: Company Information.

Introducing Global Ports Holding (1/2)
Between
2007-16
Cruise Insight
Magazine
Best Turnaround
Port Operations
Barcelona, Valletta
and Singapore
Cruise Ports
Commercial Ports
Who we are What we do How we do it
Established cruise port operations in the Mediterranean and Asia-Pacific regions
Targeted commercial port operations in Turkey and Montenegro
Drive inorganic growth through careful selection of ports for acquisition
Drive value creation through leverage of network and development of new products and services
Consolidate position as the world’s largest cruise port operator2 by:
Being a real partner for cruise lines offering a compelling value proposition
Enriching the journey of those who use our ports as their gateway to the city
Bringing significant value to the port’s host city through branded initiatives / products / services
Diversified holding company
with interests in cruise and
commercial ports as well as their
surrounding ecosystems
Established in 2004
89.2% owned by Global
Investment Holdings (GIH) which
is listed on the Borsa Istanbul
(BIST)
EBRD acquired the remaining
10.8% shares in September 20151
Source: Company Information.
Note: 1. Represents the signing date. 2. By passenger numbers as of 2015. 4
54%55%
46%45%
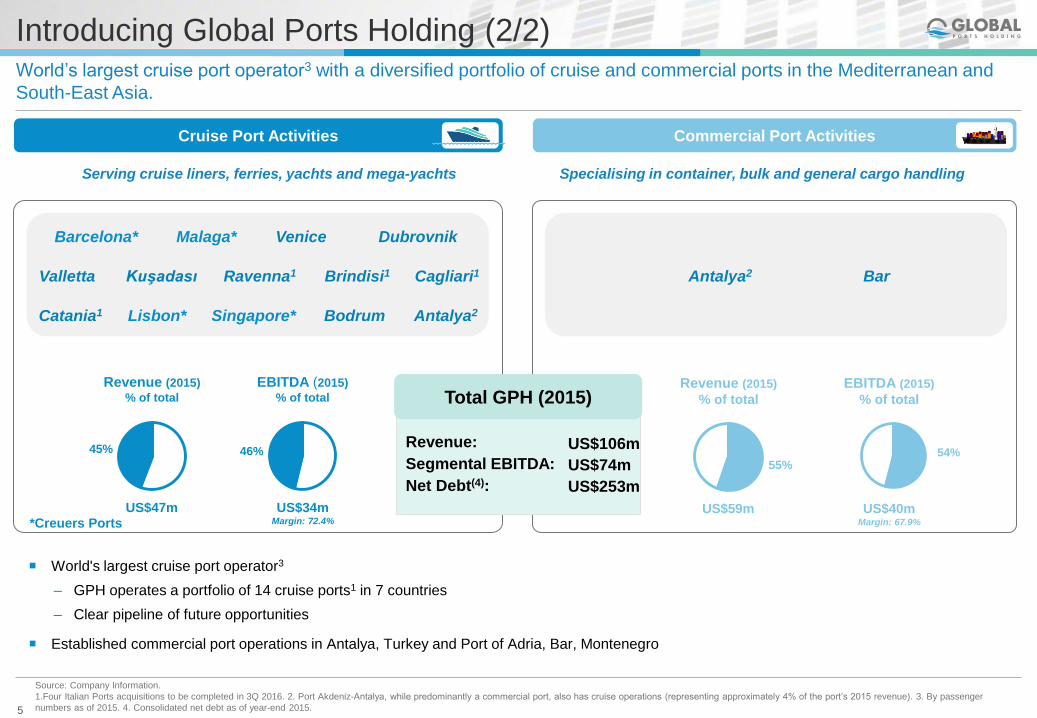
Introducing Global Ports Holding (2/2)
Cruise Port Activities
Serving cruise liners, ferries, yachts and mega-yachts
US$47m
Source: Company Information.
1.Four Italian Ports acquisitions to be completed in 3Q 2016. 2. Port Akdeniz-Antalya, while predominantly a commercial port, also has cruise operations (representing approximately 4% of the port’s 2015 revenue). 3. By passenger
numbers as of 2015. 4. Consolidated net debt as of year-end 2015.
Specialising in container, bulk and general cargo handling
Commercial Port Activities
US$59m *Creuers Ports
Antalya2 Bar
US$34m Margin: 72.4%
US$40m Margin: 67.9%
Revenue (2015)
% of total
EBITDA (2015)
% of total Revenue (2015)
% of total
EBITDA (2015)
% of total
World’s largest cruise port operator3 with a diversified portfolio of cruise and commercial ports in the Mediterranean and
South-East Asia.
World's largest cruise port operator3
– GPH operates a portfolio of 14 cruise ports1 in 7 countries
– Clear pipeline of future opportunities
Established commercial port operations in Antalya, Turkey and Port of Adria, Bar, Montenegro
Revenue:
Segmental EBITDA:
Net Debt(4):
Barcelona* Dubrovnik Venice Malaga*
Ravenna1 Kuşadası Valletta Brindisi1 Cagliari1
Bodrum Singapore* Antalya2 Lisbon* Catania1
Total GPH (2015)
US$106m
US$74m
US$253m
5
Agenda
Commercial Ports
Overall
What’s Next
Q&A
Introduction
Industry Outlook
Global Ports
Cruise Ports
6
Global Ports Holding | Update Presentation
Key Statistics
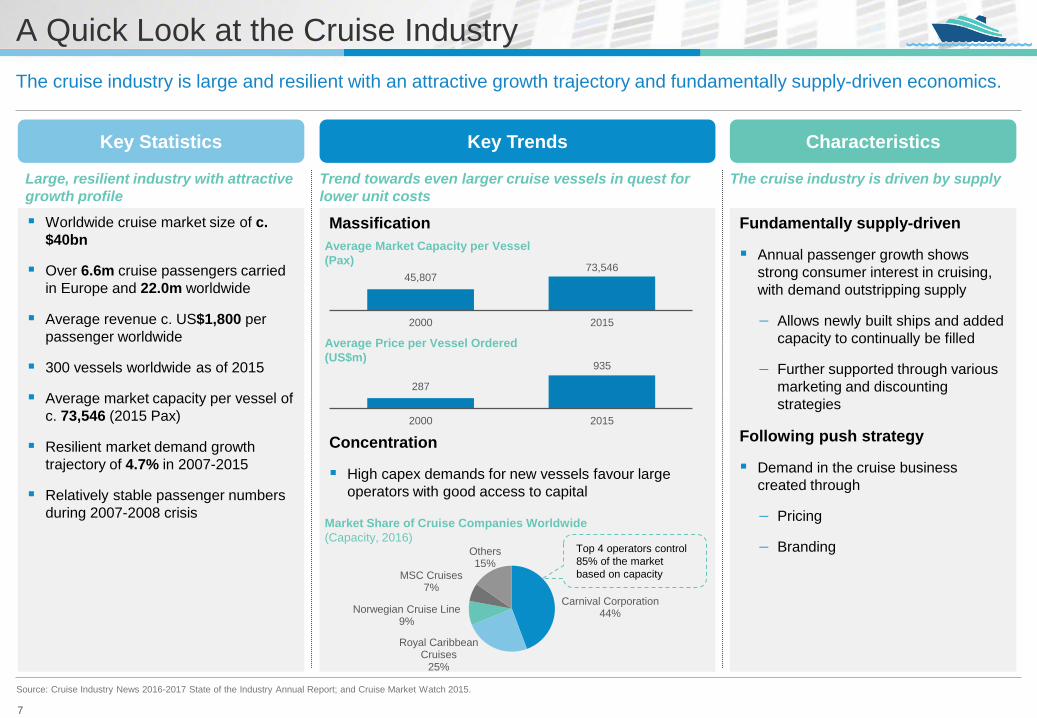
Source: Cruise Industry News 2016-2017 State of the Industry Annual Report; and Cruise Market Watch 2015.
A Quick Look at the Cruise Industry
The cruise industry is large and resilient with an attractive growth trajectory and fundamentally supply-driven economics.
Characteristics Key Trends
Fundamentally supply-driven
Annual passenger growth shows
strong consumer interest in cruising,
with demand outstripping supply
Allows newly built ships and added
capacity to continually be filled
Further supported through various
marketing and discounting
strategies
Following push strategy
Demand in the cruise business
created through
Pricing
Branding
The cruise industry is driven by supply
Worldwide cruise market size of c.
$40bn
Over 6.6m cruise passengers carried
in Europe and 22.0m worldwide
Average revenue c. US$1,800 per
passenger worldwide
300 vessels worldwide as of 2015
Average market capacity per vessel of
c. 73,546 (2015 Pax)
Resilient market demand growth
trajectory of 4.7% in 2007-2015
Relatively stable passenger numbers
during 2007-2008 crisis
Massification
Concentration
High capex demands for new vessels favour large
operators with good access to capital
Large, resilient industry with attractive
growth profile
Market Share of Cruise Companies Worldwide
(Capacity, 2016)
Carnival Corporation44%
Royal Caribbean Cruises
25%
Norwegian Cruise Line9%
MSC Cruises7%
Others15%
Trend towards even larger cruise vessels in quest for
lower unit costs
Average Market Capacity per Vessel
(Pax)
Average Price per Vessel Ordered
(US$m)
45,80773,546
2000 2015
287
935
2000 2015
Top 4 operators control
85% of the market
based on capacity
7
0.0%
0.5%
1.0%
1.5%
2.0%
2.5%
3.0%
3.5%
4.0%
4.5%
0.0 20.0 40.0 60.0 80.0 100.0 120.0
Cru
ise P
enetr
ation (
%)
GDP/Capita ('000 US$)
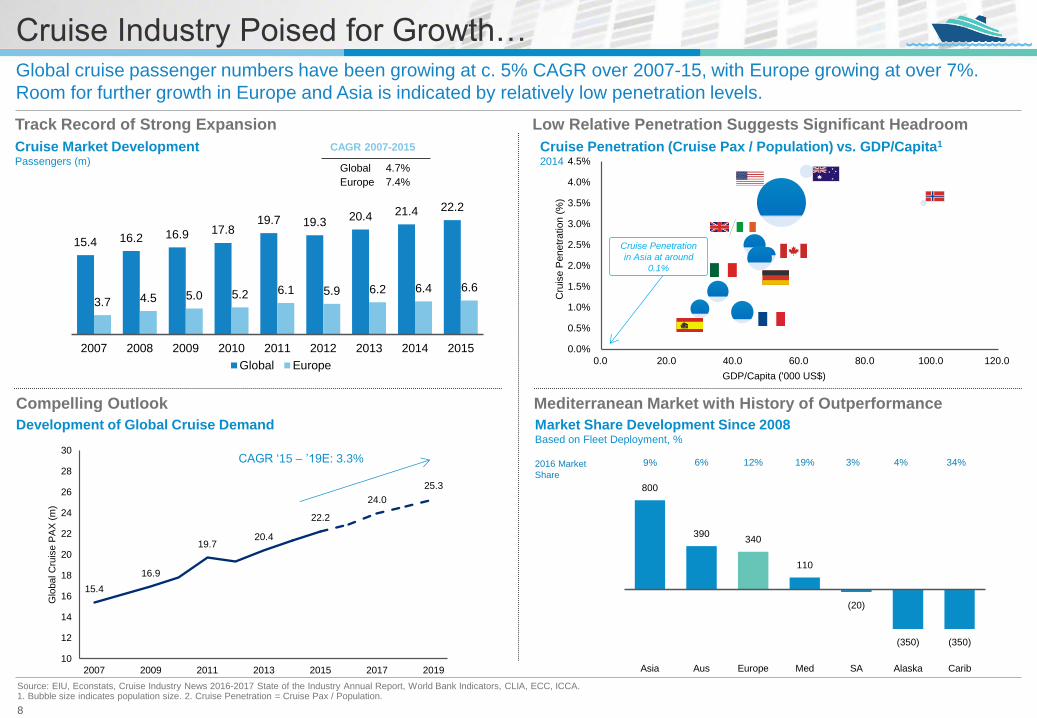
15.4 16.2 16.9 17.8 19.7 19.3
20.4 21.4 22.2
3.7 4.5 5.0 5.2 6.1 5.9 6.2 6.4 6.6
2007 2008 2009 2010 2011 2012 2013 2014 2015
Global Europe
15.4
16.9
19.7 20.4
22.2
24.0
25.3
10
12
14
16
18
20
22
24
26
28
30
2007 2009 2011 2013 2015 2017 2019
Glo
bal C
ruis
e P
AX
(m
)
Compelling Outlook
Global cruise passenger numbers have been growing at c. 5% CAGR over 2007-15, with Europe growing at over 7%.
Room for further growth in Europe and Asia is indicated by relatively low penetration levels.
Source: EIU, Econstats, Cruise Industry News 2016-2017 State of the Industry Annual Report, World Bank Indicators, CLIA, ECC, ICCA. 1. Bubble size indicates population size. 2. Cruise Penetration = Cruise Pax / Population.
Cruise Market Development Passengers (m)
4.7%
CAGR 2007-2015
Global
7.4% Europe
Cruise Penetration (Cruise Pax / Population) vs. GDP/Capita1 2014
Development of Global Cruise Demand
CAGR ‘15 – ’19E: 3.3%
Cruise Penetration
in Asia at around
0.1%
Market Share Development Since 2008 Based on Fleet Deployment, %
800
390 340
110
(20)
(350) (350)
9% 6% 12% 19% 3% 4% 34%
Asia Aus Europe Med SA Alaska Carib
2016 Market
Share
Track Record of Strong Expansion Low Relative Penetration Suggests Significant Headroom
Mediterranean Market with History of Outperformance
Cruise Industry Poised for Growth…
8

27.6 25.15.8
51.8
18.8
129.1
3.323.3
22.5
21.227.6 28.3 29.1
74.4
40.0
2016E 2017E 2018E 2019E 2020E Total
Continued
Expansion Reflected
in Strong Vessel
Pipeline
Port Revenues
Supported by High
Vessel Occupancy
Rates
Carnival and Royal Caribbean Occupancy (2001 – 2017E)
Global Order Book Total Ship Capacity ‘000 PAX
Source: Seatrade Insider, Cruise Industry News 2016-2017 State of the Industry Annual Report, Industry data, EIU, CLIA UK & Ireland, CLIA Europe, Cruise Market Watch 2015, Association of Mediterranean Cruise Ports, Wall Street research.
1. Excludes order book vessels not yet assigned to a region. 2. Available Passenger Cruise Days = Double Occupancy per Cabin * the Number of Cruise Days.
GPH is well-positioned to capture the attractive growth in vessel calls and passengers driven by the continued expansion
of the cruise industry supply and ongoing high occupancy rate.
European Order Book Total Ship Capacity ‘000 PAX
Carnival and Royal Caribbean Ticket Revenue
(per APCD2, 2003 – 2017E)
13.4 8.94.4
36.9 5.8
69.4
2016E 2017E 2018E 2019E 2020E Total
Region of deployment announced
Region of deployment to be announced
European
capacity as % of
global capacity
being deployed1
(20%)
(10%)
0%
10%
20%
30%
40%
2003 2007 2011 2015
CCL RCL
Highly Visible Industry Expansion… …with Europe Set to be Prime Beneficiary
Robust Occupancy Rates… …Supported by Flexible Ticket Pricing
New vessel
deployment
highlights
continued industry
growth…
…and increased
demand for cruise
port capacity
Passenger
numbers are a
key driver of
cruise port
revenues
Cruise lines are
strongly focused
on maximizing
vessel occupancy
rate and adjust
price accordingly 0%
20%
40%
60%
80%
100%
120%
2001 2005 2009 2013 2017E
CCL RCL
Historical Average: 104.8%
Flexible ticket pricing supports
robust occupancy rates
Average 2015-2017E: 105.0%
…with Highly Supportive Dynamics
Equals to 26.5% of
current capacity
deployed (2015)
48.5% 35.4% 76.1% 71.1% 31.1% 53.8%
9

Global container trade experienced a significant expansion over the past decade and represented 20% of total seaborne
trade volumes in 2014.
Significant Expansion in Commercial Seaborne Trade
67% 67% 68% 68%
68% 70%
71%
73%
60%
64%
68%
72%
76%
500
700
900
1,100
1,300
2012 2013 2014 2015 2016E 2017E 2018E 2019E
Utilis
ation
('000 T
EU
)
Throughput Capacity Utilisation
Global Port Volume Development
Global Container Trade by Region
Containerised Trade as % of Seaborne Trade (Volume)
3% 11%20%
1980 2000 2014
APAC Europe N America Latin America Mid-East Africa
1980 2000 2015
29%
31%
25%
6%5% 4%
56%
17%
8%
6%
9%4%
50%
22%
13%
7%5% 3%
Container Trade Development
(15)
(10)
(5)
0
5
10
15
20
2001 2002 2003 2004 2005 2006 2007 2008 2009 2010 2011 2012 2013 2014
Gro
wth
(%
)
GDP Growth Seaborne Trade Growth Container Throughput Growth
Total Volume:
38.7m TEU
Total Volume:
235.9m TEU
Total Volume:
708.3m TEU
CAGR:
9.4%
CAGR:
7.6%
CAGR
2001–2014 2.6% 3.9% 8.2%
CAGR
2012–2019 4.6% 3.4% 1.2%
Source: EIU, Drewry Container Market Review and Forecaster 2015, UNCTAD Review of Maritime Transport 2015.
10
Agenda
Commercial Ports
Overall
What’s Next
Q&A
Introduction
Industry Outlook
Global Ports
Cruise Ports
11
Global Ports Holding | Update Presentation
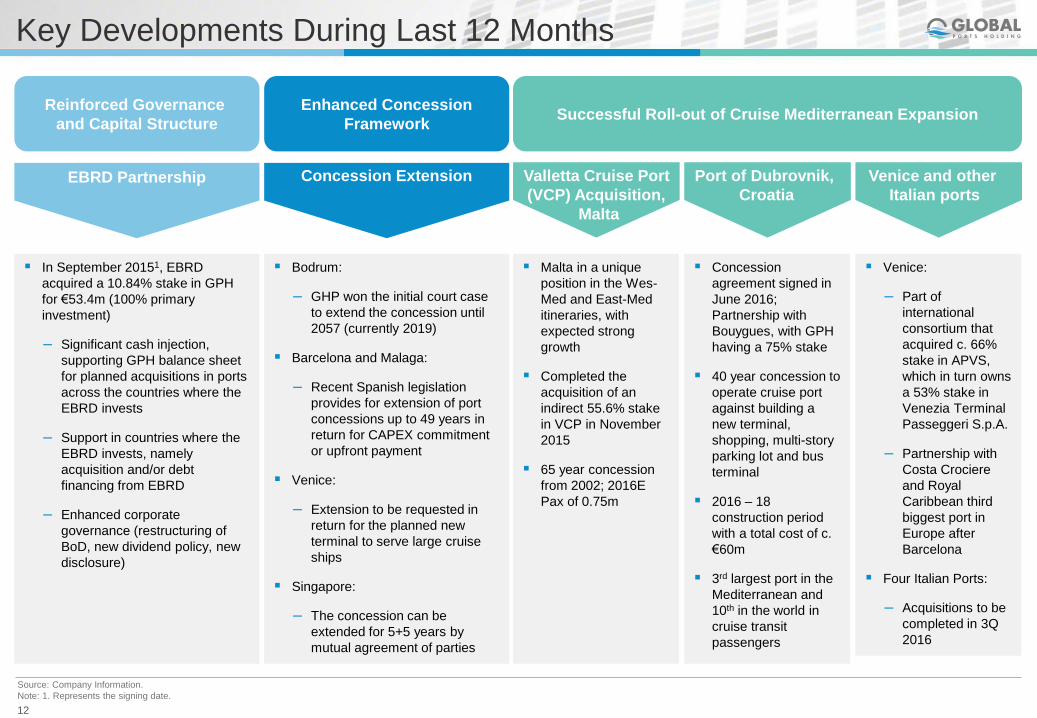
Key Developments During Last 12 Months
Reinforced Governance
and Capital Structure Successful Roll-out of Cruise Mediterranean Expansion
Enhanced Concession
Framework
In September 20151, EBRD
acquired a 10.84% stake in GPH
for €53.4m (100% primary
investment)
– Significant cash injection,
supporting GPH balance sheet
for planned acquisitions in ports
across the countries where the
EBRD invests
– Support in countries where the
EBRD invests, namely
acquisition and/or debt
financing from EBRD
– Enhanced corporate
governance (restructuring of
BoD, new dividend policy, new
disclosure)
Malta in a unique
position in the Wes-
Med and East-Med
itineraries, with
expected strong
growth
Completed the
acquisition of an
indirect 55.6% stake
in VCP in November
2015
65 year concession
from 2002; 2016E
Pax of 0.75m
Concession
agreement signed in
June 2016;
Partnership with
Bouygues, with GPH
having a 75% stake
40 year concession to
operate cruise port
against building a
new terminal,
shopping, multi-story
parking lot and bus
terminal
2016 – 18
construction period
with a total cost of c.
€60m
3rd largest port in the
Mediterranean and
10th in the world in
cruise transit
passengers
Venice:
– Part of
international
consortium that
acquired c. 66%
stake in APVS,
which in turn owns
a 53% stake in
Venezia Terminal
Passeggeri S.p.A.
– Partnership with
Costa Crociere
and Royal
Caribbean third
biggest port in
Europe after
Barcelona
Four Italian Ports:
– Acquisitions to be
completed in 3Q
2016
Concession Extension Valletta Cruise Port
(VCP) Acquisition,
Malta
Port of Dubrovnik,
Croatia
Venice and other
Italian ports EBRD Partnership
Bodrum:
– GHP won the initial court case
to extend the concession until
2057 (currently 2019)
Barcelona and Malaga:
– Recent Spanish legislation
provides for extension of port
concessions up to 49 years in
return for CAPEX commitment
or upfront payment
Venice:
– Extension to be requested in
return for the planned new
terminal to serve large cruise
ships
Singapore:
– The concession can be
extended for 5+5 years by
mutual agreement of parties
12
Source: Company Information.
Note: 1. Represents the signing date.

Agenda
Commercial Ports
Overall
What’s Next
Q&A
Introduction
Industry Outlook
Global Ports
Cruise Ports
13
Global Ports Holding | Update Presentation
29%
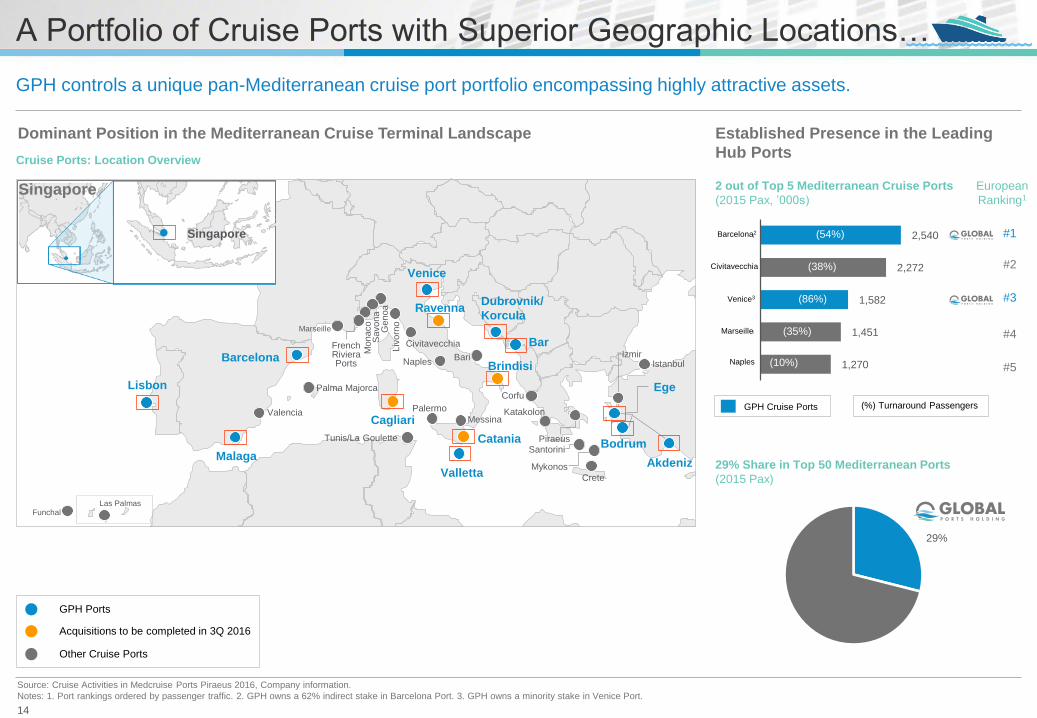
A Portfolio of Cruise Ports with Superior Geographic Locations…
Palma Majorca Corfu
Dubrovnik/
Korcula
Genoa
Funchal
Marseille
Messina
French Riviera Ports Naples
Palermo Katakolon
Piraeus
Civitavecchia
Valencia
Venice
Crete
Bari
Liv
orn
o
Istanbul Izmir
Santorini
Mykonos
Las Palmas
Bar
Tunis/La Goulette
Savona
Monaco
GPH controls a unique pan-Mediterranean cruise port portfolio encompassing highly attractive assets.
Cruise Ports: Location Overview
Source: Cruise Activities in Medcruise Ports Piraeus 2016, Company information.
Notes: 1. Port rankings ordered by passenger traffic. 2. GPH owns a 62% indirect stake in Barcelona Port. 3. GPH owns a minority stake in Venice Port.
Other Cruise Ports
GPH Ports
2 out of Top 5 Mediterranean Cruise Ports
(2015 Pax, ’000s)
Lisbon
Malaga
Barcelona
Ege
Bodrum
Akdeniz
Acquisitions to be completed in 3Q 2016
Brindisi
Ravenna
Catania
Cagliari
European
Ranking1
GPH Cruise Ports
Dominant Position in the Mediterranean Cruise Terminal Landscape Established Presence in the Leading
Hub Ports
(54%)
(38%)
(86%)
(35%)
(10%)
(%) Turnaround Passengers
Singapore
Singapore
Valletta 29% Share in Top 50 Mediterranean Ports
(2015 Pax)
2,540
2,272
1,582
1,451
1,270
Barcelona
Civitavecchia
Venice
Marseille
Naples
#1 (54%)
(38%)
(86%)
(35%)
(10%)
#2
#3
#4
#5
Barcelona2
Civitavecchia
Venice3
Marseille
Naples
14
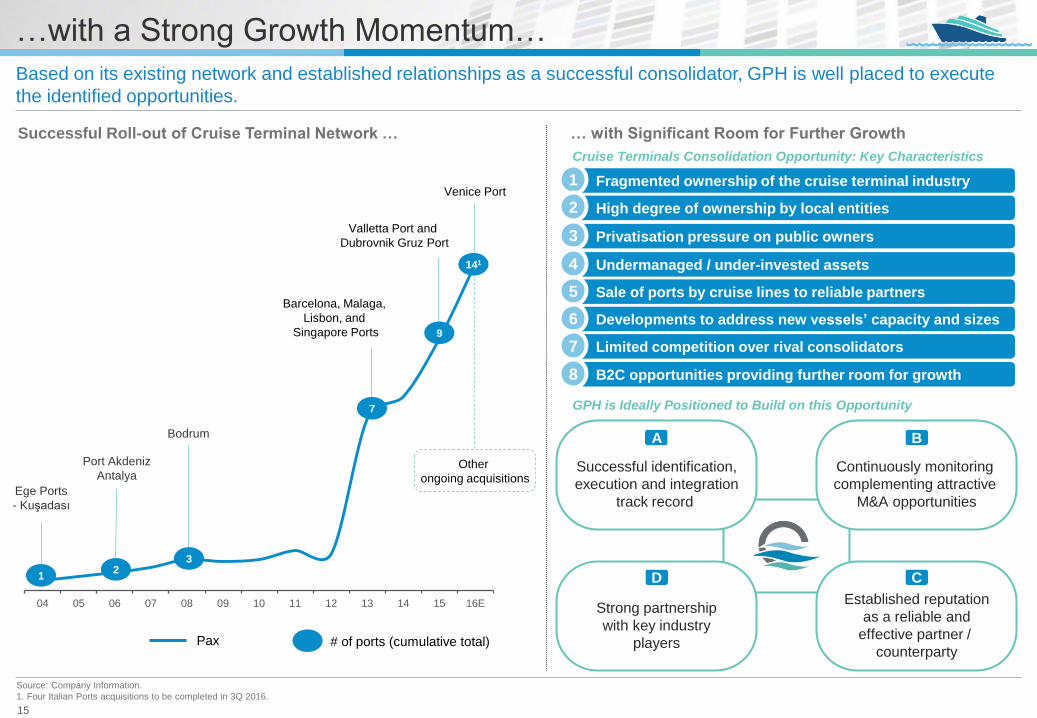
04 05 06 07 08 09 10 11 12 13 14 15 16E
Based on its existing network and established relationships as a successful consolidator, GPH is well placed to execute
the identified opportunities.
…with a Strong Growth Momentum…
Successful Roll-out of Cruise Terminal Network …
Ege Ports
- Kuşadası
Port Akdeniz
Antalya
Bodrum
Barcelona, Malaga,
Lisbon, and
Singapore Ports
Valletta Port and
Dubrovnik Gruz Port
Other
ongoing acquisitions
Fragmented ownership of the cruise terminal industry 1
High degree of ownership by local entities 2
Privatisation pressure on public owners 3
Undermanaged / under-invested assets 4
Sale of ports by cruise lines to reliable partners 5
Developments to address new vessels’ capacity and sizes 6
Limited competition over rival consolidators 7
… with Significant Room for Further Growth
Cruise Terminals Consolidation Opportunity: Key Characteristics
GPH is Ideally Positioned to Build on this Opportunity
Continuously monitoring
complementing attractive
M&A opportunities
Successful identification,
execution and integration
track record
Strong partnership
with key industry
players
Established reputation
as a reliable and
effective partner /
counterparty
D C
A B
B2C opportunities providing further room for growth 8
1 2
3
7
9
1
Venice Port
Pax
Source: Company Information.
1. Four Italian Ports acquisitions to be completed in 3Q 2016.
141
15
# of ports (cumulative total)

…and a Significant Opportunity for Value Creation
… with Substantial Upside from New and Innovative
Revenue Streams
Improve capacity utilization through size of ports portfolio and
negotiating power with cruise lines
Enhanced pricing power given scale of premium asset
portfolio
One-stop shop capabilities for large cruise operators
Established practices to optimize efficiency and enhance retail
revenue opportunities coupled with low-capex business plan
Cost synergies realized through consolidating administrative
tasks and marketing overheads
GPH is the largest global cruise port operator1 and sole consolidator in a fragmented market where most ports are owned
by government entities, delivering a unique value creation proposition.
Expected Benefits of GPH’s Integrated Cruise Port Network
Blueprint for Value Creation…
Source: Company Information.
Note: 1. By passenger numbers as of 2015.
For Cruise Lines For Cruise Ships
For Passengers For the Public
Bundle Offerings
as One-stop Shop
Cost Effective / Must
Have Services to
Ships
Services to Improve
Passenger
Experience
Position Port as a
Point of Interest
16
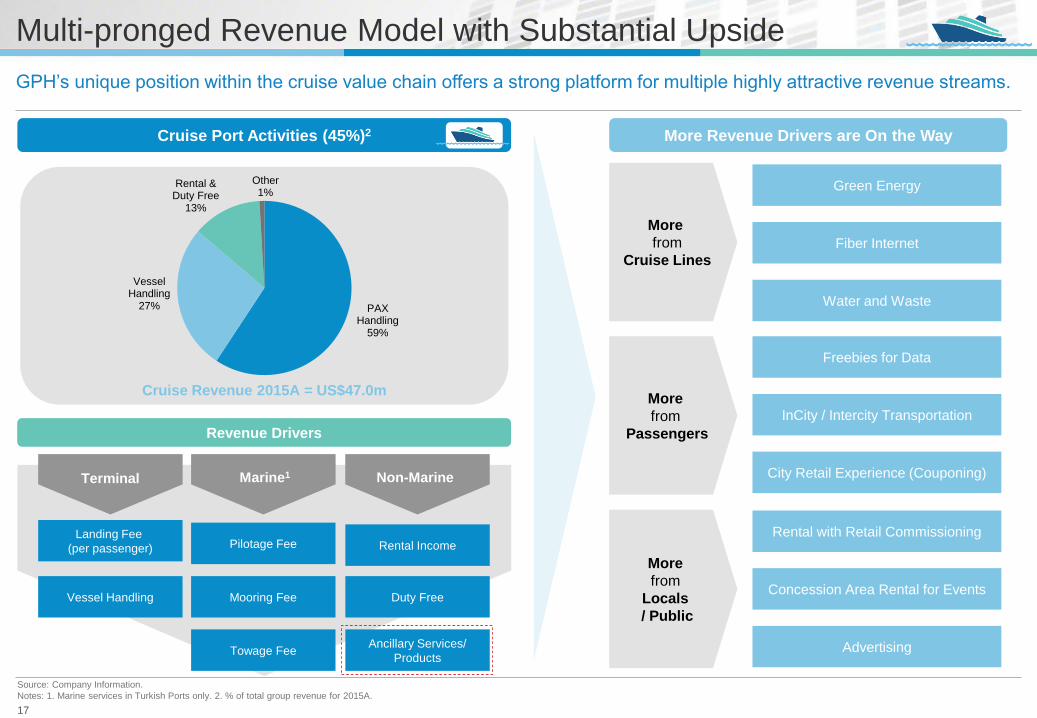
GPH’s unique position within the cruise value chain offers a strong platform for multiple highly attractive revenue streams.
Multi-pronged Revenue Model with Substantial Upside
Cruise Port Activities (45%)2
PAX Handling
59%
Vessel Handling
27%
Rental & Duty Free
13%
Other1%
Cruise Revenue 2015A = US$47.0m
Landing Fee
(per passenger)
Vessel Handling
Pilotage Fee
Mooring Fee
Towage Fee
Rental Income
Duty Free
Terminal Marine1 Non-Marine
Revenue Drivers
Ancillary Services/
Products
Source: Company Information.
Notes: 1. Marine services in Turkish Ports only. 2. % of total group revenue for 2015A.
More Revenue Drivers are On the Way
Freebies for Data
InCity / Intercity Transportation
City Retail Experience (Couponing)
More
from
Passengers
Rental with Retail Commissioning
Concession Area Rental for Events
Advertising
More
from
Locals
/ Public
Green Energy
Fiber Internet
Water and Waste
More
from
Cruise Lines
17

Agenda
Commercial Ports
Overall
What’s Next
Q&A
Introduction
Industry Outlook
Global Ports
Cruise Ports
18
Global Ports Holding | Update Presentation

Containers70%
Cement15%
Coal7%
Woodchips2%
Aluminum2%
Other4%
Malta
Turkey
Syria
Cyprus
Limassol
Aliaga
Port-Akdeniz
Mersin Iskenderum
Malta
Valletta
D400 D685 D650
D635
D350 D400
D400 D400
D695
D695
D696 D330
D330 D715
D330 D696
D300
D400
D685 D650
D350
D330
D320
D625 D650
D685
D330 D585 D320
D595
D350 D585 D330
Strategically Located Commercial Port Operations…
Strategically located with limited regional competition, GPH’s ports provide excellent connectivity into hinterlands with
strong origin / destination cargo flows. GHP has an increasingly diversified cargo mix.
Strategically located on the Southern coast of Turkey with lack of direct competition in immediate
vicinity
High speed rail link (expected completion by 2023) to significantly expand catchment area
While strategically positioned to capture the maritime exports of the majority of the quarries in
Antalya, Akdeniz is currently focussed on diversifying its cargo base, increasing imports share by 5%
in 2015, mainly driven by PVC and furniture imports
Source: Company information.
1.Point to point distance on land. 2. Over 200 marble mines are operating in the hinterland.
Located within a Free Zone regime with significant benefits including exemption from customs
duties, taxes and other duties
Important link for regional intermodal transport to inland capitals including Belgrade and Sarajevo
Benefits from local steel and aluminium exports as well as automotive manufacturing in Serbia
Belgrade
Sarajevo
Prishtina
Skopje
Bosnia and
Herzegovina
Serbia
Macedonia
(FYROM)
Split
Croatia
Dubrovnik
Podgorica
Boljare
Sozina Tunnel
Rijeka
Italy
Montenegro
Port-Akdeniz Port-Akdeniz Competitor Ports Road Transport Infrastructure
Cement Plants Key Marble mines2 Road Transport Infrastructure
Competitor Ports Port Adria-Bar
Bar – Belgrade Railway
Carg
o M
ix3
Carg
o M
ix3
Port of Akdeniz (Turkey) Port of Adria-Bar (Montenegro)
2015A 2015A
Containers61%
Steel Coils26%
Cement7%
Aluminium3%
Other3%
Port Adria
19

NA NA NA
2.6
2.2
2011 2012 2013 2014 2015
3531
33
39 39
2011 2012 2013 2014 2015
54
126
169186
217189 178
2006 2010 2011 2012 2013 2014 2015
…with a Track Record of Value Creation
Acquisition of 62% Stake for
€8.1m, December 2013
Source: Company information, including for Port of Adria for 2011-2013 information.
Note: (1) Port of Adria-Bar EBITDA in 2015 improved 3% in its operating currency EUR, but declined 14% in USD due to unfavourable exchange rate movements.(2) Includes EBITDA from cruise operations accounting for c. 4% of total in 2015.
Loss making prior to 2014
GPH has demonstrated its ability to significantly improve the operational performance of commercial ports, creating
shareholder value through acquisitions.
2010
acquired
c. 60% stake
for $56m
2006
acquired
c. 40% stake
for $21m
EB
ITD
A(2
)
US
$m
Co
nta
ine
r
Vo
lum
e
‘000 T
EU
s
EB
ITD
A
US
$m
Co
nta
ine
r
Vo
lum
e
‘000 T
EU
s
Increase Tariffs P
Cargo Diversification P
Modernize Equipment P
Key Initiatives
Tariff Rationalization P
Operational Overhaul P
Cost Base Optimization P
Port of Akdeniz (Turkey) Port of Adria (Montenegro)
Enhanced Marketing Strategy P Enhanced Marketing Strategy P
31
40 41 39
2006 2010 2011 2012 2013 2014 2015
Increase in TEU throughput
at 5.4% YoY quarterly
between 1Q 15-2016
(1)
20
Agenda
Commercial Ports
Overall
What’s Next
Q&A
Introduction
Industry Outlook
Global Ports
Cruise Ports
21
Global Ports Holding | Update Presentation
Venice
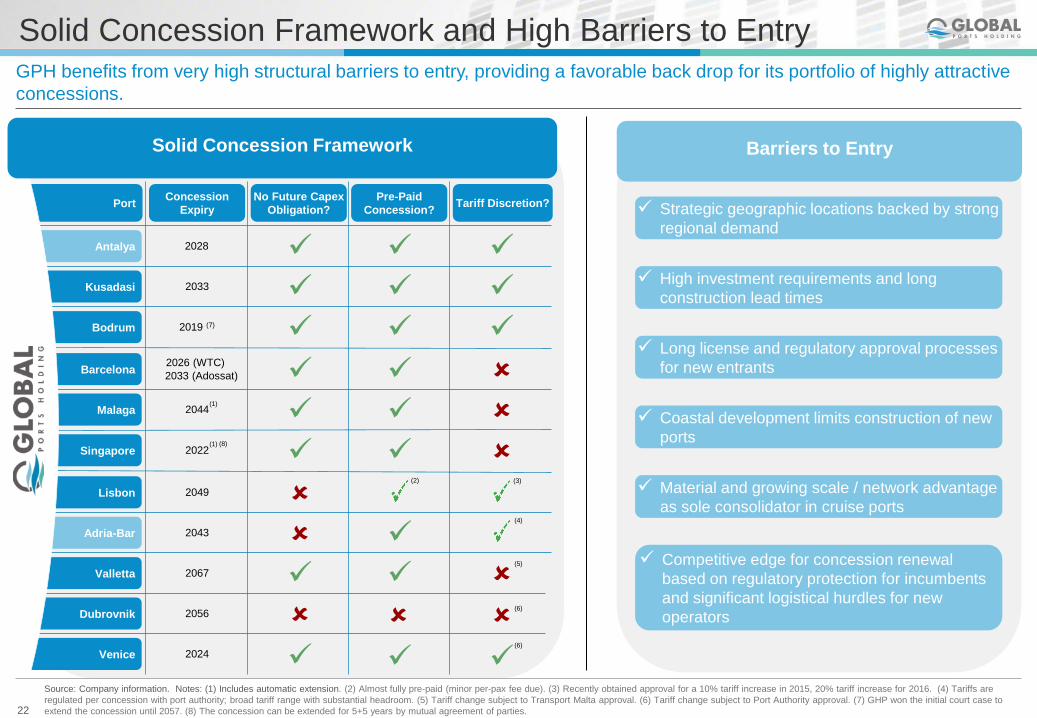
Solid Concession Framework and High Barriers to Entry GPH benefits from very high structural barriers to entry, providing a favorable back drop for its portfolio of highly attractive
concessions.
Competitive edge for concession renewal
based on regulatory protection for incumbents
and significant logistical hurdles for new
operators
Coastal development limits construction of new
ports
High investment requirements and long
construction lead times
Long license and regulatory approval processes
for new entrants
Strategic geographic locations backed by strong
regional demand
Material and growing scale / network advantage
as sole consolidator in cruise ports
Barriers to Entry
Dubrovnik
Valletta
Adria-Bar
Malaga
Singapore
Lisbon
Barcelona
Kusadasi
Bodrum
Antalya
No Future Capex
Obligation?
Pre-Paid
Concession? Tariff Discretion?
Concession
Expiry
2028
2049
(2) (3)
2043 (4)
Port
2022 (1)
2044 (1)
2026 (WTC)
2033 (Adossat)
2019 (7)
2033
2067 2056 2024
Solid Concession Framework
Source: Company information. Notes: (1) Includes automatic extension. (2) Almost fully pre-paid (minor per-pax fee due). (3) Recently obtained approval for a 10% tariff increase in 2015, 20% tariff increase for 2016. (4) Tariffs are
regulated per concession with port authority; broad tariff range with substantial headroom. (5) Tariff change subject to Transport Malta approval. (6) Tariff change subject to Port Authority approval. (7) GHP won the initial court case to
extend the concession until 2057. (8) The concession can be extended for 5+5 years by mutual agreement of parties.
(5)
(6)
(6)
(8)
22

15.8%
30.8%
7.3%
Note: Selected Port Operators include SIPG, DP World, Adani port and SEZ, ICTSI, Pipavav. Selected Airport Operators include: Airports of Thailand, Shanghai International Airport, Shenzhen Airport, Auckland International Airport, OMA.
Cruise Operators include: Carnival Corp, Royal Caribbean Cruises, Norwegian Cruise Line. 1. Cash Conversion Pro Forma. Calculated excluding the acquisition of Valletta Cruise Port from Capex. 2. Commercial. 3. Calculated using
the Consolidated EBITDA.
GPH Compares Favourably to its Broader Operator Universe
Revenue Growth 12-15A
EBITDA Margin 2015
GPH Selected Airport Operators Selected Port Operators
Significant and
consistent revenue
growth
outperformance
Margins materially
superior to broad
universe of
comparables
GPH’s capex-light operating model, high growth track record and superior operating profitability position it favorably
against a broad universe of transportation infrastructure providers and cruise operators.
Cruise Operators
Cash Conversion1 2015
Strong cash
generation based
on Capex-light
operating model
9.7%
5.1%
11.0%
88.2% 86.5%
Total Comm.2 Cruise Selected Port
Operator Average
Selected Airport
Operator Average
Cruise Operator
Average
Total Comm.2 Cruise
Total Comm.2 Cruise
67.5% 72.3%67.9%
47.3%56.4%
26.4%
51.1%
78.7%
23.2%53.7%
17.0%
85.1%
Selected Port
Operator Average
Selected Airport
Operator Average
Cruise Operator
Average
Selected Port
Operator Average
Selected Airport
Operator Average
Cruise Operator
Average
(3)
23

Agenda
Commercial Ports
Overall
What’s Next
Q&A
Introduction
Industry Outlook
Global Ports
Cruise Ports
24
Global Ports Holding | Update Presentation

Next Steps: Inorganic Expansion Strategy and Initiatives
GPH’s stronghold
Focus on marquee ports and expansion
Regional shift from East to Mid/West Mediterranean Strong interest in Caribbean
Seeking a home port to
penetrate the market
Interest in Asia
Seeking assets around main regional home
ports (e.g. Singapore, Shanghai, Hong Kong
etc.)
Type of Ports / Projects
Preference for existing
ports and expansion
projects
Partners vs. Standalone
Focus on partnerships to
enhance footprint and
increase success rate
Preference for majority
ownership
Marquee vs. Secondary
Preference for marquee
ports to enter new
markets
Focus on financial profile
when assessing
secondary port
opportunities
Sub-region
Focus on regional
diversification
Create natural sub-
regional hedge
Adjacent Businesses
Focus on businesses
that can bring strategic
advantages and
synergies:
– Cruise booking
– Ground handling
– Agencies
– Supply companies
– Marine services
Other Regions – Opportunity Road Map
M&A Outlook
GPH aims to enhance its network through targeted acquisitions at selected strategic locations across the globe.
Source: Company Information.
25
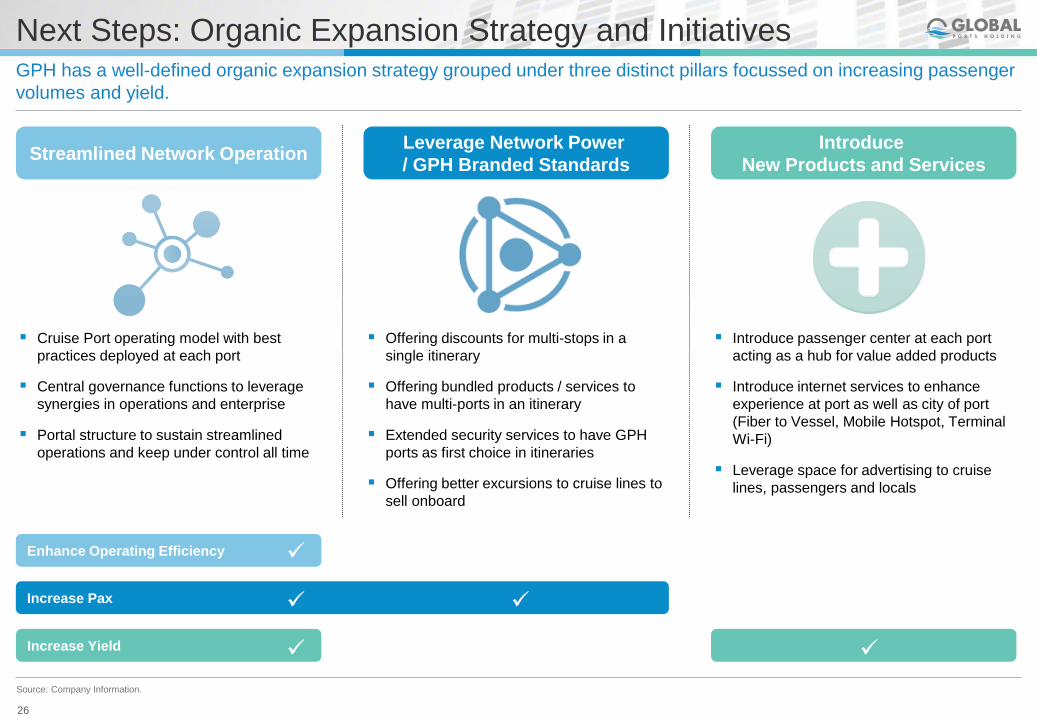
Next Steps: Organic Expansion Strategy and Initiatives
Cruise Port operating model with best
practices deployed at each port
Central governance functions to leverage
synergies in operations and enterprise
Portal structure to sustain streamlined
operations and keep under control all time
Offering discounts for multi-stops in a
single itinerary
Offering bundled products / services to
have multi-ports in an itinerary
Extended security services to have GPH
ports as first choice in itineraries
Offering better excursions to cruise lines to
sell onboard
Introduce passenger center at each port
acting as a hub for value added products
Introduce internet services to enhance
experience at port as well as city of port
(Fiber to Vessel, Mobile Hotspot, Terminal
Wi-Fi)
Leverage space for advertising to cruise
lines, passengers and locals
GPH has a well-defined organic expansion strategy grouped under three distinct pillars focussed on increasing passenger
volumes and yield.
Streamlined Network Operation Leverage Network Power
/ GPH Branded Standards
Introduce
New Products and Services
Source: Company Information.
Enhance Operating Efficiency
Increase Pax
Increase Yield
26
Agenda
Commercial Ports
Overall
What’s Next
Q&A
Introduction
Industry Outlook
Global Ports
Cruise Ports
27
Global Ports Holding | Update Presentation
Q&A Q&A
28

Appendix

Global Ports Holding
Source: Company information.
1. 35.5% of Container Terminal General Cargo JSC-Bar is listed on the Montenegro Stock Exchange and publicly held.
2. Yüksel Çağlar (a Turkish businessman and entrepreneur) holds 30% of the shares in Bodrum Liman and Setur (duty-free operator owned by the Koç Group of Turkey) holds 10%.
3. Two privately held investment vehicles with 36.4% and 8.0% shares, respectively.
4. Türkiye Denizcilik İşletmeleri holds 1 share in Ortadoğu Antalya Liman İşletmeleri A.Ş. and Ege Liman İşletmeleri A.Ş.
5. Port Akdeniz-Antalya also has cruise operations. 6. Concession agreement to be closed in 2H 2016. 7. GPH owns minority stake in Venice.
Ortadoğu Antalya Liman
İşletmeleri A.Ş.
(Port Akdeniz-Antalya)5
Port of Adria-Bar5
Bodrum Liman
İşletmeleri A.Ş.
(Bodrum Cruise Port)
Ege Liman
İşletmeleri A.Ş.
(Ege Ports-Kusadasi)
Valletta Cruise Port Plc
(Valletta Cruise
Port-Malta)
Dubrovnik Gruz Port Creuers del Port de
Barcelona S.A.
(Barcelona Cruise Port)
SATS-Creuers Cruise
Services Pte. Ltd.
(Singapore Cruise Port)
Cruceros Málaga S.A.
(Málaga Cruise Port)
Lisbon Cruise Terminals
LDA
(Lisbon Cruise Port)
Barcelona Port
Investments S.L.
Dubrovnik Cruise Port
Investment d.o.o.
(DCPI)6
Public
Shareholders1 Others2 Others3
Cruise port
Commercial port
99.9% (4) 64.5% 60% 62% 72.5%4 55.6% 75% 35.5% 40% 38% 27.49%
44.4% 25%
10% 40% 80% 60%
20%
30% 40%
Accounted for
Using Equity
Pickup Method
GPH Effective
46.2%
GPH Effective
24.8%
GPH Effective
49.6%
100% 100%
10.84%
89.16%
Venice(7)
29

Global Investments Holding
Overview
Mehmet Kutman and GIH have been doing business in Turkey since 1990
The Group’s roots are in equity brokerage and investment banking, but through
the years Mr. Kutman has grown the business into an investment platform
Source: Company information.
1.Four Italian Ports acquisitions to be completed in 3Q 2016.
Corporate Governance
GIH is a publicly listed company on the Borsa Istanbul (BIST); hence it is
required by the Capital Markets Board to maintain high standards of corporate
governance in order to protect the interests of its minority shareholders
The board of directors of GIH comprises professionals and independent board
members who look out for the interest of the company and its shareholders
The GIH board also has sub-committees which comprise independent and/or
non-executive board members for internal audit and corporate governance
purposes
GIH is audited by Deloitte on a semi-annual basis
Board of Directors
Name Role
Mehmet Kutman Chairman
Erol Goker Vice Chairman
Aysegul Bensel Non-Executive Board Member
Serdaz Kirmaz Executive Board Member
Adnan Nas Non-Executive Board Member
Jerome Bayle Independent Board Member
Oguz Satici Independent Board Member
Committee Members
Audit
Committee
Oguz Satici
Jerome Bayle
Corporate
Governance
Committee
Jerome Bayle
Aysegul Bensel
Adnan Nas
Description of GIH’s Businesses
Ports
Focused on operations of cruise and commercial port facilities
through GIH’s subsidiary Global Ports Holding (“GPH”)
Operates a portfolio of 10 cruise ports1 and 2 commercial
ports, with 4 more cruise ports in 3Q 2016
Power
Tres Energy offers power generation solutions based on build-
operate model including design, construction and operation of
small to mid-size combined heat and power facilities
(cogeneration / trigeneration) for industrial and commercial
customers
Mavi bayrak and Ra Solar encompass a renewable portfolio of
bio-mass and solar energy, which are at construction phase
Tenera is engaged in power wholesale and trading activities
Gas Largest CNG network in Turkey and 2nd largest world-wide
Also engaged in gas trading and LNG
Real Estate
Current operating and ongoing investments portfolio includes
commercial, multi−use commercial and residential, and
high−end summer residence and hotel development projects
Other
Comprises non-banking financial services
Global Securities, an ISE-listed company which provides
brokerage, financial advisory, corporate finance and research
services
Global Asset Management (JV between Turkish Police
pension fund and GIH)
Straton Maden is engaged in feldspar mining, being among
the top three feldspar producers in Turkey
30

Cruise Operations
GPH has a diversified and strategically located asset portfolio, forming the world’s largest cruise port network.
Highly Visible Industry Expansion…
1. Full year 2014. Singapore Fiscal Year ends in March.
2. Includes automatic extensions.
3. Includes ferry pax.
Cruise, ferry and mega-yacht port
located on Turkey's Aegean coast,
near one of Turkey's most popular
seaside resorts
Pax 2015A: 173,2793
Revenue 2015A: $2.8m
End of concession: 2019 (subj to
extension to 2057)
Concession of the three cruise
terminals of Port of Málaga; boarding,
unloading & billing of passengers, and
luggage management
Pax 2015A: 418,231
Revenue 2015A: $3.1m1
End of concession: 20442
Busiest cruise port in Turkey, located
near Ephesus and the House of the
Blessed Virgin Mary, both major tourist
attractions
Pax 2015A: 637,7023
Revenue 2015A: $17.3m
End of concession: 2033
Bodrum Cruise Port A Málaga Cruise Port B Ege Ports-Kuşadası C
One of the largest cruise homeports;
operates 5 cruise terminals of the Port
of Barcelona (4 as a concessionaire)
Pax 2015A: 1,780,510
Revenue 2015A: $22.6m1
End of concession: 2026 (WTC wharf),
20332 (Adossat wharf)
Port of call for cruises; operates three
cruise terminals and a new terminal is
expected to be completed in 2016
Pax 2015A: 512,128
End of concession: 2049
The operation of Terminal Marina Bay
Cruise Centre in Singapore
Pax 2015A: 344,391
Revenue 2015A: $8.5m1
End of concession: 2022 (applied for
5-year extension, with high likelihood of
approval)
Barcelona Cruise Port D Lisbon Cruise Port E Singapore Cruise Port F
Significant cruise operations with more
than 20% turnaround
Pax 2015A: 639,000
Revenue 2015A: $10m
End of concession: 2067
Key destination in the Adriatic Sea; a
Marquee port located c. 3km away
from the Old Town
40-year concession against building a
new terminal, shopping complex
(15,000m2 leasable area), multi-storey
parking lot, and a bus terminal
Pax 2015A: 757,741
End of concession: 2056
High capacity commercial port with a
dominant position in export traffic for its
hinterland. Also active in cruise
operations
Pax 2015A: 167,524
Revenue 2015A: $2.1m
End of concession: 2028
Valletta Cruise Port Malta G Gruz Port Dubrovnik H Antalya Cruise Operations I
Cagliari, Brindisi, Ravenna Catania
Small-medium size operations
Pax 2015A: 540,576
Revenue 2015A: $2m
End of concession: 2021 to 2026
The largest homeport operations in the
Med based on Pax
Pax 2015A: 1,582,000
Revenue 2015A: $35m
End of concession: 2024 (with an
extension option)
Four Italian Cruise Ports J Venice Cruise Port K Creuers Ports
E D
B
G
K
J
J
H
C
J
J A
I
Singapore
F Acquisitions to be completed in 3Q 2016
31

Commercial Ports
Well equipped sea port along the 700km Turkish Aegean-Mediterranean coast
Sole furniture customs clearance port in Turkey
Superior location ensuring limited competition from other ports
– Nearest ports, Mersin and Iskenderun, located c.353km and c.492km away
– High trucking costs from Antalya hinterland to these ports prevent direct competition
Surrounding mineral wealth and mining operations position it as a strategic gateway for
exporters, particularly marble and cement
– Cement: Turkey is among the top 10 exporters in the world; research estimates
indicate cement and clinker export from Turkey to reach 32m tons by 2033 growing
at 4% CAGR
– Marble: Turkey contains 40% of the world’s marble reserves and exports to over 200
countries
End of concession: 2028
Port Akdeniz-Antalya A
Port of Adria-Bar B
Source: Company Information, Drewry 2012.
1. Point to point distance on land. 2. Over 200 marble mines are operating in the hinterland. 3. Dry bulk and general cargo.
4. Port Akdeniz-Antalya revenue and EBITDA include commercial and cruise operations.
Located within a Free Zone regime with significant benefits
– The Free Zone covers the entire area of the Port of Adria-Bar and provides
exemption from customs duties, taxes and other duties
Closest port to industrialised and landlocked Serbia
Represents an important link in the regional chain of intermodal transport
– High integration with the Belgrade-Bar railway and road traffic network
– Railway accessibility is of particular importance for the growing trend of
containerization
– Historically it was the main port for Yugoslavia and still serves as an important node
for trade from ex-Yugoslavia neighbours, particularly as the main port for Belgrade
Only 1 hour drive from Podgorica Airport
End of Concession: 2043
Port-Akdeniz Port-Akdeniz Competitor Ports Cement Key Marble Mines2 Road Transport Infrastructure
\\Ldnvnascti0045\ibd_Mumbai EMEA Savedowns\1454888
D330
D595
Aliaga
TURKEY
D400
D635
CYPRUS
SYRIA
Port-
Akdeniz
D400
D400 D400
D400
D695
Mersin
Iskederum D350
D350 D350 D585
D650 D695
D685
D320 D320
D585 D330
D625
D650 D330 D330
D300
D330
D175 D696
D696
D685
Port-
Adria
Port-Adria Bar Competitor Ports Bar – Belgrade Railway Road Transport Infrastructure
Handling Capacity (TEU) 500,000
Cargo Capacity (Tons)3 5,000,000
Revenue4 $52.0m
EBITDA4 $39.2m
Handling Capacity (TEU) >500,000
Cargo Capacity (Tons)3 805,209
Revenue $8.5m
EBITDA $2.2m
SERBIA
Prishtina
Skopje
Belgrade
BOSNIA AND
HERZEGOVINA
CROATIA
Split
Dubrovnik
ITALY
Sarajevo
Montenegro
Boljare
Sozina Tunnel Podgorica
32
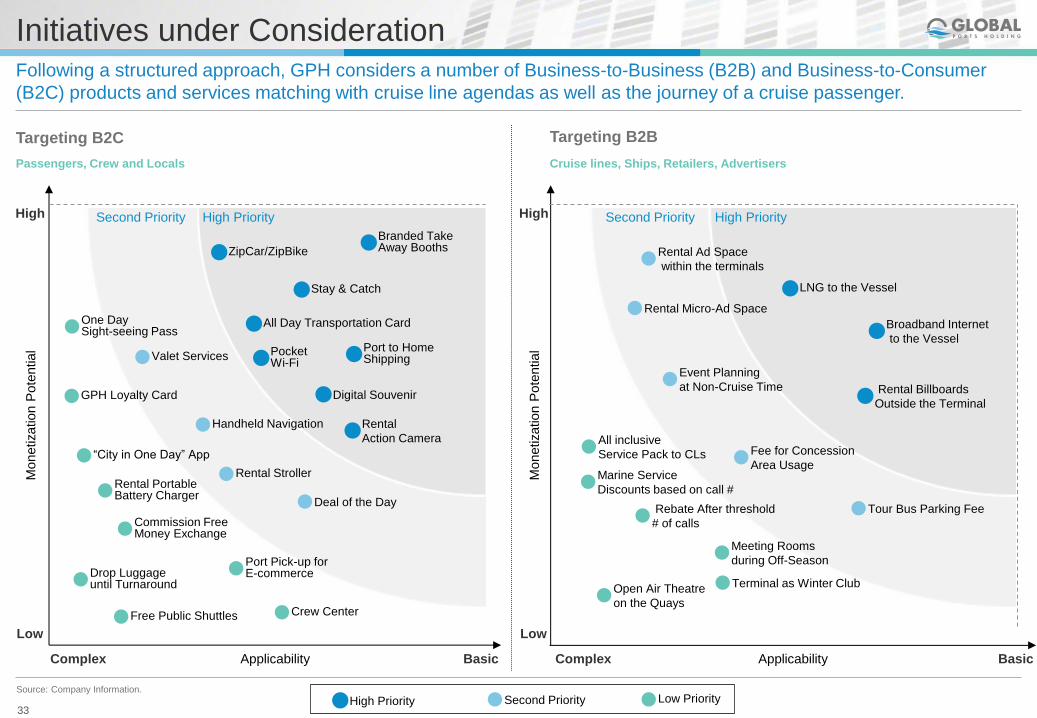
Initiatives under Consideration M
onetization P
ote
ntial
Low
High
Applicability Complex Basic
High Priority Second Priority
ZipCar/ZipBike
“City in One Day” App
Handheld Navigation
Valet Services
Deal of the Day
Commission Free Money Exchange
Branded Take Away Booths
Port to Home Shipping
Stay & Catch
Pocket Wi-Fi
Digital Souvenir
Rental Portable Battery Charger
Port Pick-up for E-commerce
One Day Sight-seeing Pass
Drop Luggage until Turnaround
Rental
Action Camera
All Day Transportation Card
Rental Stroller
GPH Loyalty Card
Crew Center Free Public Shuttles
Targeting B2C
Following a structured approach, GPH considers a number of Business-to-Business (B2B) and Business-to-Consumer
(B2C) products and services matching with cruise line agendas as well as the journey of a cruise passenger.
Passengers, Crew and Locals
Source: Company Information.
Monetization P
ote
ntial
Low
High
Basic
Targeting B2B
Complex
High Priority Second Priority
Rental Billboards
Outside the Terminal
Broadband Internet
to the Vessel
Rental Micro-Ad Space
Rental Ad Space
within the terminals
Meeting Rooms
during Off-Season
LNG to the Vessel
Fee for Concession
Area Usage
Event Planning
at Non-Cruise Time
Rebate After threshold
# of calls
Marine Service
Discounts based on call #
All inclusive
Service Pack to CLs
Open Air Theatre
on the Quays
Tour Bus Parking Fee
Terminal as Winter Club
Applicability
Cruise lines, Ships, Retailers, Advertisers
High Priority Low Priority Second Priority 33

Ongoing Initiatives: Operating Model and PortALL
Clear set of functions in place defining
operations at every port
Organisations are defined according to common
functions
Set of functions is linked to the GPH network
through a well-defined governance structure
backed up with technology
Clear set of functions to leverage the power of
network structure
Strong account management structure to
balance relationships with cruise lines
Effective induction management to speed up
network expansion
Strong marketing structure to promote the GPH
brand and influence the industry
GPH has redefined the consolidated operating model to comply with fast growth and are now developing a state-of-art
system to sustain efficient operations.
Model for
GPH Cruise Ports
Model for
GPH Network
All functions working around the
PortALL structure, from data
input/output to blue collar functions
and C-Level real reportings
A very first step in the whole
industry – to be positioned as a
service to out-of-network ports
Cloud Based
Operation Platform
Terminal Services Management
Com
merc
ial S
takehold
ers
Outs
. S
erv
ice P
rovid
ers
S
hore
x
Pro
vis
ion
Mari
tim
e
Cru
iseline
Legal S
takehold
ers
Oth
er
Govern
menta
l Agencie
s
Local M
unic
ipality
P
ort A
uth
ority
Port Marketing/Sales
Pricing/Offering
Management Marketing
Account
Management
Sales and
Reservations
Primary Port Operations
Marine
Operations Planning and
Permission
Pilotage/
Towage
Line Handling
(Mooring)
Shoreside
Operations Homeland Health
and Security
Embarkation/
Disembarkation Inspection
and Customs
Cruise Services Management
Provisioning Energy (Refueling
and Electricity)
Waste Management Water Supply
Housekeeping Security
Check-In
Services
Luggage
Handling
Safety and Security Travel Retail
Infrastructure
and Maintenance Cleaning
Facility/Area Management
Retail Management Area Rental
Management
Ground Logistics/
Transfers (Passenger)
Ground Logistics
(Goods and Services)
Enterprise Functions
Human
Resources
Finance and
Reporting
G&A and
Procurement
Information
Technology Legal
Info
rmation T
echnolo
gy
Ent.
Syste
m M
gm
t.
IT C
oE
D
ata
Mgm
t.
Opera
tions M
anagem
ent
Product/Service Management Portfolio Sales and Marketing
Account Management Service
Management
New Product
Development
Centre of Excellence
Enterprise Support
Sales Operations
Marketing Management Project Management
Analytics/Pricing/Offering Management Strategic Procurement
Investments Management
Investment
Operations
Transaction
Management
Induction
Management Investor Relations
Finance Management
Pla
nnin
g a
nd
Resourc
e D
ev.
Stra
tegy E
xecutio
n
Perfo
rmance M
gm
t.
Budgeting and
Reporting Accounting
Treasury
(Financing)
Audit
and Controlling
Legal General
Administration Human Resources
Compliance
Management
Source: Company Information.
34
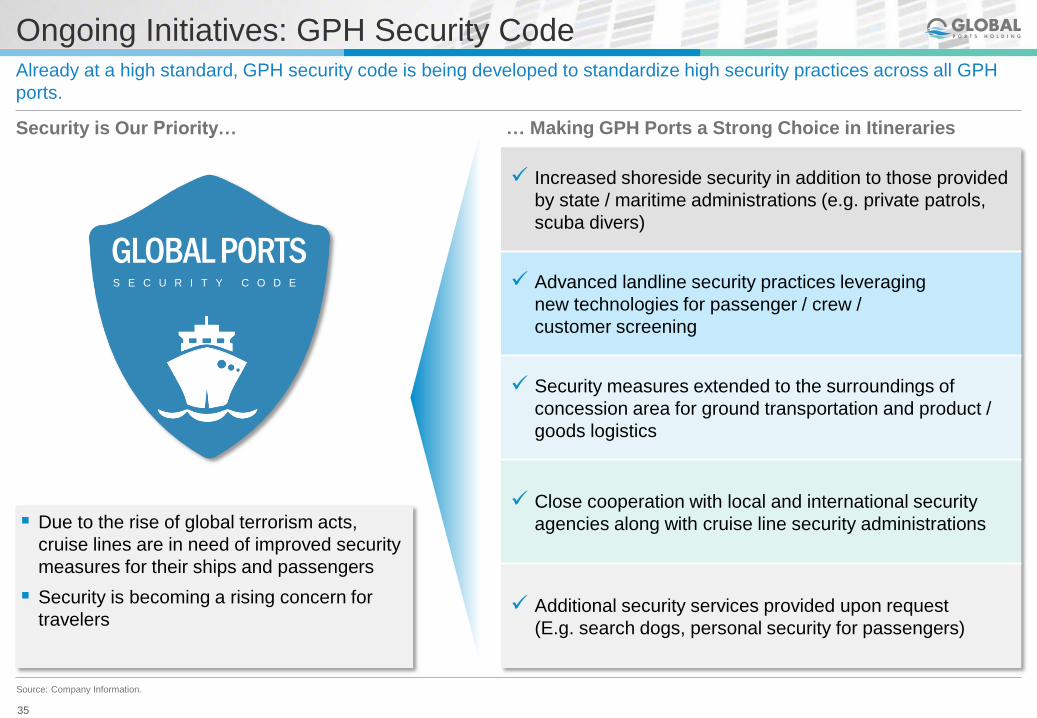
Ongoing Initiatives: GPH Security Code
Increased shoreside security in addition to those provided
by state / maritime administrations (e.g. private patrols,
scuba divers)
Advanced landline security practices leveraging
new technologies for passenger / crew /
customer screening
Security measures extended to the surroundings of
concession area for ground transportation and product /
goods logistics
Close cooperation with local and international security
agencies along with cruise line security administrations
Additional security services provided upon request
(E.g. search dogs, personal security for passengers)
Security is Our Priority…
Due to the rise of global terrorism acts,
cruise lines are in need of improved security
measures for their ships and passengers
Security is becoming a rising concern for
travelers
… Making GPH Ports a Strong Choice in Itineraries
Already at a high standard, GPH security code is being developed to standardize high security practices across all GPH
ports.
GLOBAL PORTS S E C U R I T Y C O D E
Source: Company Information.
35

Ongoing Initiatives: New Products and Services
A baseline service defined as booth /
desk / retail area in which passengers
can carry out many needs defined
throughout their journey
Likely to see a number of items
developed in time
All services (B2B and B2C) aiming to
provide internet access to the
passengers / customers
Considered in three distinct products:
Offer companies to advertise their services
and products on the sites positioned on
both inbound and outbound routes of the
ports
Terminal Internet
Pocket Wi-Fi
Internet to
Vessels
There are three distinct group of services to be implemented within 2016 aiming to generate revenue at each port of our
network.
"Go" Products and Services at a Glance
GPH Passenger Center Internet Services Advertisement Areas
Source: Company Information.
36

P&L and other KPIs
Source: Company Information.
1. Proforma for full year 2014 effect of Creuers acquisition. 2. Revenue allocated to cruise segment include sum of revenues of cruise ports excluding Singapore and Lisbon, as well as cruise portion of revenue from Port Akdeniz, which while
mainly a commercial port also has minor cruise operations. 3. Segmental EBITDA figures indicate only operational companies; excludes GPH solo expenses. 4. Passenger numbers include Lisbon and Singapore Pax fully. 5. Proforma for
2015 effect of Valletta Cruise Port (Malta) acquisition.
2014 PF1 2015PF5
2014 PF-2015 PF
YoY Change Q1 2015 PF5 Q1 2016
QoQ Change
(Based on PF)
Passengers (mn PAX)4 3.8 4.8 27.8% 0.472 0.504 6.9%
General & Bulk Cargo (‘000 tons) 1,874.0 1,461.0 -22.0% 522.8 446.4 -14.6%
Throughput (‘000 TEU) 228.5 217.5 -4.8% 50.2 52.2 4.1%
Revenue (US$m) 110.7 105.5 -4.7% 18.2 18.5 1.6%
Cruise Revenue (US$m)2 47.0 47.0 0.1% 4.1 4.5 10.5%
Commercial Revenue (US$m) 63.7 58.5 -8.2% 14.2 14.1 -0.9%
Segmental EBITDA (US$m)3 73.2 73.8 0.8% 10.1 10.9 7.4%
Segmental EBITDA Margin 66.1% 69.9% +380 bps 55.6% 58.8% +320 bps
Cruise EBITDA (US$m) 31.6 34.0 7.6% 1.3 1.7 28.0%
Cruise Margin 67.3% 72.4% +510 bps 32.7% 37.9% +520 bps
Commercial EBITDA (US$m) 41.5 39.7 -4.4% 8.8 9.2 4.3%
Commercial Margin 65.2% 67.9% +270 bps 62.1% 65.4% +330 bps
Consolidated EBITDA (US$m) 70.1 71.2 1.6% 8.9 9.9 11.1%
Consolidated EBITDA Margin 63.3% 67.5% +420 bps 48.6% 53.2% +460 bps
37