Embed Size (px)
Citation preview

Global Policy Model
Development Policy and Analysis Division Department of Economic and Social Affairs
United NationsNew York, 2009
Prepared by:
Alphametrics Co. Ltd., for UN-DESA
GLOBAL POLICY MODEL
VERSION 3.0
APPENDICES A - F
Extracted from
USER GUIDE - GPM ver 3.0
Prepared by
Francis Cripps and Naret Khurasee
DRAFT
October 2010
Alphametrics Co., Ltd. for the United Nations Saraburi, Thailand Development Policy Analysis Division
Department of Economic and Social Affairs

DESA/DPAD GPM 3.0 User Guide Appendices A-F
Alphametrics Co., Ltd. October 2010
Contents
APPENDIX A NOTATION AND MEASUREMENT CONVENTIONS 1
Domestic income and expenditure 1 International trade and other external transactions 1 Prices and rates 2 Assets and liabilities 3 Actual and simulated values 3 Residuals and instruments 4
APPENDIX B REAL VALUES, VOLUMES AND PRICE DEFLATORS 5
APPENDIX C VARIABLES AND IDENTITIES 7 Model variables 7 Additional variables for policy evaluation 13
APPENDIX D BEHAVIOURAL EQUATIONS 15
APPENDIX E SCENARIO RULES 59 Introduction 59 Types of rule 59
Exogenous adjustments to behavioural variables 59 Endogenous adjustment of behavioural variables 60 Conditional regime-switching 62
Linking multiple instruments 64 Qualifying the application of a rule 65 Testing new rules 65
Options when running a scenario program 65 Results of shock simulation 66
APPENDIX F MULTIPLIER TABLES 68 Introduction 68 Methodological note 68 Impact tables 69
Government expenditure on goods and services 69 Government revenue (net of grants, subsidies and interest) 74 Real exchange rate 79 Cost inflation 84 Policy rate 89 Energy use 94

DESA/DPAD GPM 3.0 User Guide Appendix A - F page A-F 1
Alphametrics Co., Ltd. October 2010
Appendix A Notation and measurement conventions Domestic income and expenditure
Variables measured in real terms are denoted by an upper-case symbol followed by a 2 or 3 character country or bloc code or W for the world total:
e.g. V_JA Japan's GDP
VW = sum(V_?) world GDP where ? denotes each bloc
GDP is measured at base-year dollar prices divided by a different base-year purchasing power parity adjustment pp0 for each bloc. Real incomes and expenditures in each bloc are measured by dividing current dollar values by the domestic expenditure deflator for the bloc to convert the figures to base-year values and further dividing by the base-year purchasing power adjustment to make them more comparable across blocs.
It follows that current dollar values, denoted with a leading underscore, are equal to real values multiplied by the dollar price of domestic expenditure ph for each bloc:
e.g. _Y_EU = ph_EU * Y_EU income of Europe in current dollars
International trade and other external transactions International transactions denoted by a $ suffix are measured in terms of world purchasing power. The deflator used is the deflator for world expenditure aggregated over all blocs in purchasing power parity terms. The value of this deflator is set to 1 in the base year (2005) to facilitate comparison of $ variables with current price series.
e.g. X$_CN = _X_CN/phw China's exports (international value)
The real exchange rate rx for each bloc is defined as the ratio betwen the local price deflator ph and the world price deflator phw. Thus international values may be converted to domestic purchasing power by dividing by the real exchange rate:
e.g. rx_CN = ph_CN/phw China's real exchange rate
X_CN = X$_CN/rx_CN China's exports (domestic value)
The latter figure X_CN represents the buying power of China's exports in terms of goods and services within China. This is considerably larger than the buying power of the same exports in terms of globally-consumed goods and services X$_CN which, taking an average for the world as a whole, are more expensive than in China.
Conversely the income of each bloc, normally measured in domestic purchasing power, is converted to world purchasing power by multiplying by the real exchange rate.
e.g. Y_IN India's income (domestic purchasing power)
Y$_IN = Y_IN * rx_IN India's income (world purchasing power)
The definitions above imply that the weighted average real exchange rate for the world as a whole is a constant (equal to the base-year value of the world expenditure deflator before the latter is set to 1). Thus with n blocs there are only n-1 degrees of freedom for real exchange rates just as there are only n-1 degrees of freedom for nominal exchange rates.

DESA/DPAD GPM 3.0 User Guide Appendix A - F page A-F 2
Alphametrics Co., Ltd. October 2010
The 'volume' of exports and imports measured at base-year prices and market exchange rates is denoted by suffix 0:
e.g. XE0_WA West Asia's energy exports at base-year international prices.
The contribution of West Asia's energy exports to West Asia's GDP measured in constant ppp units is given by XE0_WA/pp0_WA
where pp0_WA is the base-year purchasing-power adjustment for West Asia.
World exports are equal to world imports in value and volume terms for each commodity group and for goods and services as a whole:
e.g. XW$ = MW$ = sum(X$_?) = sum(M$_?) XW0 = MW0 = sum(X0_?) = sum(M0_?) XAW$ = MAW$ = sum(XA$_?) = sum(MA$_?)
etc.
Similar identities hold for other components of balance of payments current and capital accounts and for cross-border holdings of assets and liabilities when the latter are valued in terms of the same global purchasing-power standard. But when international transactions and assets are valued in terms of their purchasing power within each country or country group, it is no longer true that totals balance out.
e.g. CAW = sum(CA$_?/rx_?) where CA represents the current account surplus (+) or deficit (-), is not equal to zero, although the same total valued in world purchasing power CAW$ = sum(CA$_?) is equal to zero for the world as a whole.
One implication is that when excess savings are transferred from one bloc to another, the value of the savings in terms of purchasing power in each bloc is not the same. Thus if savings are transferred from a low-income bloc where goods and services are cheap to a high-income bloc where goods and services are more expensive, the volume of expenditure foregone in the low-income bloc is greater than the volume of additional expenditure in the high-income bloc. Evidently the reverse is the case when savings are transferred from high-income to low-income blocs.
Prices and rates Prices, rates of inflation, interest rates and exchange rates are denoted with lower-case symbols:
e.g. pvi_EU Europe's average local currency cost inflation rate (% p.a.)
is_EU Europe's average local ccy. short-term interest rate (% p.a.)
irsw world average 'real' short-term interest rate (% p.a.)
Values for each bloc are weighted averages of values for countries in the bloc.1
1 Expenditure weights are used to average domestic price inflation and nominal interest rates across countries within each bloc. GDP weights are used to average cost inflation. Implicitly, bloc-level real interest rates are expenditure-weighted averages of rates in each country.

DESA/DPAD GPM 3.0 User Guide Appendix A - F page A-F 3
Alphametrics Co., Ltd. October 2010
Assets and liabilities Assets and liabilities at end year are converted from current dollars to real values by dividing by the period expenditure deflator (the same deflator that is used for income and expenditure in the period). The real value of assets and liabilities may rise or fall from year to year on account of changes in their price or nominal value in the currency in which they are quoted or denominated, as well as changes in the dollar exchange rate for that currency and changes in the purchasing power of the dollar as measured by the domestic or world expenditure deflator.
Holding gains measured in real terms are denoted with the prefix H and cash flows (net acquisition or sale) of assets are denoted with the prefix I. For example
AGF_US US government investment in banks
HAGF_US Holding gains or losses on US government investment in banks
IAGF_US Net cash proceeds of US government transactions in bank liabilities
The relationship between stocks and flows may be written as AGF_US = AGF_US(-1) + HAGF_US + IAGF_US
The valuation of assets and liabilities brought forward from the previous year is represented by a variable whose name begins with rp.
e.g. LG_IN India government debt at end-year rpfa_IN valuation for prior-year assets
LG_IN(-1)*rpfa_IN value of debt brought forward ILG_IN proceeds of debt issues less redemptions
End-year debt is equal to debt brought forward plus issues less redemptions:2 LG_IN = LG_IN(-1)*rpfa_IN + ILG_IN
External assets and liabilities are treated in a similar fashion using variable names suffixed with $ to indicate an international value:
e.g. R$_JA Japan's exchange reserves at end year
rpr$_JA valuation ratio for exchange reserves brought forward
IR$_JA net purchases less sales of exchange reserves
Actual and simulated values Historical series (extended to include current-year estimates) are designated by the variable name and bloc code with no additional suffix. Baseline series projected into the future by the model have suffix _0. Series simulated in alternative scenarios have the relevant scenario suffix, e.g. _1 or _3a.
2 Holding gains or losses may occur on purchases and sales in the current year. Therefore the interpration of rpfa given here is not strictly precise. A more accurate definition would be that (rpfa-1) represents the ratio of holding gains and losses on current-year transactions and prior-year assets to the real value of prior-year assets at the end of the preceding year. In general the valuation rp is defined such that holding gains or losses H = (rp-1)*A(-1) where A represents the end-year value of an asset.

DESA/DPAD GPM 3.0 User Guide Appendix A - F page A-F 4
Alphametrics Co., Ltd. October 2010
Residuals and instruments Values of behavioural variables simulated by the model may be influenced by residual terms or ‘instruments’ that modify the typical pattern of behaviour. In GPM simulations instruments are specified as bloc-specific intercept shifts in behavioural equations, denoted by the variable name and bloc code with suffix _ins. Values of _ins series may be defined exogenously or set by policy rules that depending on the rule may also create series suffixed with _tar (target values) or _sav (saved values of instruments).
Example: primary energy production in Europe (million tons of oil equivalent)
ED_EU historical values and current year estimates
ED_EU_0 values in the baseline projection
ED_EU_1 values in scenario 1
ED_EU_ins instrument (may take different values in each scenario)

DESA/DPAD GPM 3.0 User Guide Appendix A - F page A-F 5
Alphametrics Co., Ltd. October 2010
Appendix B Real values, volumes and price deflators
Series Description Source or formula 1. Expenditure and expenditure deflators APT GDP in current dollars databank
APT1 GDP at current purchasing power parity databank
AXD domestic expenditure in current dollars databank
AXD0 domestic expenditure at Y2005 prices databank
PXA index of world prices for primary commodities databank
PXE index of world price of oil databank
Model variables - bloc level pp0 base-year purchasing power parity adjustment APT(base)/APT1(base)
H domestic expenditure, Y2005 purchasing power AXD0/pp0
ph domestic expenditure deflator AXD/H = AXD.pp0/AXD0
_H domestic expenditure in current dollars H.ph
Model variables - global HW world expenditure, Y2005 purchasing power sum(H)
pp0w base-year PPP adjustment sum(AXD(base))/sum(H(base))
phw world expenditure deflator sum(AXD)/(pp0w.sum(H))
paw world price of primary commodities, Y2005 world value PXA/phw
pew world price of oil, Y2005 world value PXE/phw
2. Real exchange rate, current account, national income and GDP APT0 GDP at Y2005 prices databank
AXX exports in current dollars databank
AXX0 exports at Y2005 prices databank
AXM imports in current dollars databank
AXM0 imports at Y2005 prices databank
BCA current account in dollars databank
Model variables - bloc level rx real exchange rate ph/phw
CA$ current account, Y2005 world value BCA/phw
_CA current account in current dollars CA$.phw
TB$ trade balance, Y2005 world value (AXX-AXM)/phw
TB0 net exports at Y2005 prices TB0 = AXX0-AXM0
BIT$ balance on income and transfers, Y2005 world value CA$ - TB$
Y national income, Y2005 purchasing power (AXD+BCA)/ph
V GDP volume, Y2005 purchasing parity APT0/pp0
VV expenditure on GDP H + TB$/rx
tt terms of trade effect (ratio of GDP value to volume)
(H + TB$/rx)/V

DESA/DPAD GPM 3.0 User Guide Appendix A - F page A-F 6
Alphametrics Co., Ltd. October 2010
Bloc level theorems T1 Income, domestic expenditure and the current a/c H = C + IP + IV + G
Y = H + CA$/rx
= H + TB$/rx + BIT$/rx
T2 GDP, expenditure and net export volume V = H + TB0/pp0
VV = H + TB$/rx
T3 Income, GDP and the terms of trade Y = V.tt + BIT$/rx
Theorem - world level T4 Weighted average real exchange rate sum(H.rx)/sum(H) = pp0w
Proof H.rx = H.ph/phw
= AXD.pp0w.sum(H)/sum(AXD)
sum(H.rx) = pp0w.sum(H)
definition of rx
defns of ph and phw
sum over blocs
3. Inflation and nominal exchange rate appreciation APT3 GDP in domestic currency units (databank - internal)
AXD3 domestic expenditure in domestic currency units (databank - internal)
PPT cost of constant dollar GDP in domestic currency units APT3/APT0
PXD price of constant dollar domestic expenditure in domestic currency units
AXD3/AXD0
RXN exchange rate - dollars per domestic currency unit APT/APT3 = AXD/AXD3
Model variables - bloc level pvi domestic cost inflation (% p.a.) 100(PPT/PPT(-1) - 1)
pi domestic price inflation (% p.a.) 100(PXD/PXD(-1) - 1)
rxna nominal exchange rate appreciation (% p.a.) 100(RXN/RXN(-1) - 1)
Bloc level theorems T5 Price inflation, cost inflation and the terms of trade (1+pi/100) = (1+pvi/100)
.tt(-1)/tt
Proof PXD/PPT = (AXD/APT).(APT0/AXD0)
= ph.V /(AXD+AXX-AXM)
= V/(H + TB$/rx) = 1/tt
defns of PPT, PXD and RXN
defns of ph,V and APT
defns of H, rx and tt
T6 Nominal exchange rate appreciation (1+rxna/100) = (ph/ph(-1)
/(1+pi/100)
Proof RXN.PXD = AXD/AXD0
= ph/pp0
defns of RXN, PXD
definition of ph
Theorem - world level T7 Movement of global dollar prices relative to US prices and real exchange rate movements
phw = phw(-1)*(1+pi_us/100)
.rx_us(-1)/rx_us

DESA/DPAD GPM 3.0 User Guide Appendix A - F page A-F 7
Alphametrics Co., Ltd. October 2010
Appendix C Variables and identities
Note: variables with no suffix represent domestic purchasing power values, variables suffixed with $ are measured in terms of world purchasing power, and variables suffixed with 0 denote volumes or quantities measured at base-year prices and exchange rates. Variables suffixed with W represent world indexes or totals.3
Model variables Symbol Name Units Exogenous, behavioural or determined by identity AGF Bank deposits and capital held by
government at end year $m AGF = NGI + max(NGF,0)
AX$ External assets at end year $m AX$ = R$ + AXO$ AXO$ Other external assets at end year
(adjusted) $m AXO$ = AXOU$.AXOW$ / AXOUW$
AXOU$ Other external assets at end year (unadjusted)
$m AXOU$ = NXI$ + max(NXFU$,0)
BA$ Net exports of primary commodities $m BA$ = XA$ - MA$ BA0 Net exports of primary commodities
at base-year prices (adjusted) $m BA0 = XA0 - MA0
BAU0 Net exports of primary commodities at base-year prices (unadjusted)
$m behavioural [structural policy]
BE$ Net exports of fuels $m BE$ = XE$- ME$ BE0 Net exports of fuels at base-year
prices $m BE0 = XE0 - ME0
BIT$ Net income and transfers from abroad
$m BIT$ = XIT$ - MIT$
BITU$ Net income and transfers from abroad (unadjusted)
$m behavioural [structural policy]
BM$ Net exports of manufactures $m BM$ = XM$ - MM$ BM0 Net exports of manufactures at base-
year prices $m BM0 = XM0 - MM0
BS$ Net exports of services (adjusted) $m BS$ = XS$ - MS$ BS0 Net exports of services at base-year
prices $m BS0 = XS0 - MS0
BSU$ Net exports of services (unadjusted) $m behavioural [structural policy] C Consumers expenditure $m C = YP – SP CA$ Current account balance of payments $m CA$ = TB$ + BIT$ DNN Natural increase in population millions exogenous DP Bank deposits at end-year $m DP = NFI + max(NFF,0) EB Energy balance mtoe EB = EX - EM ED Energy demand mtoe behavioural [structural policy] EDW World energy demand mtoe EDW = sum(ED) EM Primary energy imports mtoe behavioural [trade policy]
3 Most variables are also available in current US dollars (variable name prefixed by _).

DESA/DPAD GPM 3.0 User Guide Appendix A - F page A-F 8
Alphametrics Co., Ltd. October 2010
Symbol Name Units Exogenous, behavioural or determined by identity EP Primary energy production mtoe behavioural [structural policy] EPW World energy production mtoe EPW = sum(EP) EX Primary energy exports mtoe EX = EP + EM - ED G Government expenditure $m behavioural [fiscal policy] H Domestic expenditure $m H = C + IP + IV + G HAGF Holding gain or loss on government
investment in banks $m HAGF = R(-1).rpr$/rx + (LN(-1)+
LGF(-1)–DP(-1)).rpfa – AGF(-1)- lnbail.LN(-1).wln.rpfa
HAXO Holding gain on other external assets $m HAXO = AXO$/rx - AXO$(-1)/rx(-1) - IAXO$/rx
HDP Holding gain or loss on other sectors' investment and deposits with banks
$m HDP = DP - DP(-1) - IDP
HKP Holding gain or loss on capital stock at end year
$m HKP = KP - KP(-1) - IP - IV
HLGO Holding gain or loss on other government debt
$m HLGO = LGO - LGO(-1) - ILGO
HLN Holding gain or loss on bank lending $m HLN = LN - LN(-1) - ILN HLX Holding gain or loss on external
liabilities $m HLX = LX$/rx - LX$(-1)/rx(-1) -
ILX$/rx HWP Holding gain or loss on private
wealth $m HWP = HKP + HDP - HLN + HLGO + HAXO
- HLX IAG Government asset transactions $m IAG = IAGF + IAGO IAGF Government injections to banks $m IAGF = AGF - AGF(-1) - HAGF IAGO Other government asset transactions $m behavioural [financial policy] IAXO$ Other external capital outflow $m IAXO$ = ILX$ - IR$ + CA$ IDP Acquisition of bank deposits $m IDP = IR$/rx - IN + ILGF - IAGF ILG Net issues of government debt $m ILG = IAG – NLG ILGF Acquisition of government debt by
banks $m ILGF = ILG – ILGO
ILGO Non-bank acquisition of government debt
$m ILGO = LGO - LGO(-1).rpfa
ILN Net borrowing from banks $m ILN = LN - LN(-1).rpfa.(1-wln) ILX$ Other external borrowing $m ILX$ = LX$ - LX$(-1).rplx$ im Bond rate % p.a. behavioural [confidence] IP Private investment $m behavioural [confidence] IR$ Net acquisition of exchange reserves $m IR$ = R$ - R$(-1).rpr$ irm Real bond rate % p.a. irm= 100((1+im/100)/(1+pi/100)-1) irs Short term interest rate % p.a. irs= 100((1+is/100)/(1+pi/100)-1) is Short-term interest rate % p.a. behavioural [monetary policy] IV Change in inventories $m behavioural [confidence] KI Produced capital stock at end year $m KI = KI(-1) - KID + IP + IV KID Capital consumption $m rdp KI(-1) KP Value of capital at end year $m KP = pkp.KI LG Government debt at end year $m LG = AGF – NGF LGF Government debt held by banks at
end year $m LGF = LG - LGO
LGO Non-bank holdings of government $m behavioural [monetary policy]

DESA/DPAD GPM 3.0 User Guide Appendix A - F page A-F 9
Alphametrics Co., Ltd. October 2010
Symbol Name Units Exogenous, behavioural or determined by identity debt at end year
LN Bank loans outstanding at end year
$m LN = DP - NFF
lnbail Government bail-out losses as proportion of abnormal loan write-offs by banks
ratio constant [assumption]
lpa Domestic impact of world price of primary commodities
log lpa = 0.3log(paw/rx) + 0.7lpa(-1)
lped Demand impact of world price of oil log lped = 0.3 log(pew/(rx(pewmax-pew))) + 0.7 lped(-1)
lpep Production impact of world price of oil
log lpep = 0.15 log(pew/(rx(pewmax-pew))) + 0.85 lped(-1)
LX$ External liabilities at end year $m LX$ = AXOU$ - NXFU$ M$ Imports of goods and services $m M$ = MA$ + ME$ + MM$ + MS$ M0 Import of goods and services at
base-year prices $m M0 = MA0 + ME0 + MM0 + MS0
MA$ Imports of primary commodities $m behavioural [price behaviour] MA0 Imports of primary commodities at
base-year prices (adjusted) $m MA0 = MAU0.XAW0/MAUW0
MAU0 Imports of primary commodities at base-year prices (unadjusted)
$m MAU0 = XA0 - BAU0
ME$ Imports of energy products $m behavioural [price behaviour] ME0 Imports of energy products at base-
year $m behavioural [product mix]
mh Import content of domestic expenditure
ratio mh = M0/(pp0.H + vx.X0)
MIT$ Income paid abroad $m MIT$ = XITU$ - BITU$ MM$ Imports of manufactures $m behavioural [trade policy] MM0 Imports of manufactures at base-year
prices (adjusted) $m MM0 = MMU0.XMW0/MMUW0
MMU0
Imports of manufactures at base-year prices (unadjusted)
$m behavioural [price behaviour]
MS$ Imports of services $m behavioural [trade policy] MS0 Imports of services at base-year
prices (adjusted) $m MS0 = MSU0.XSW0/MSUW0
MSU0 Imports of services at base-year prices (unadjusted)
$m behavioural [price behaviour]
N Total population millions N = N(-1) + DNN + NIM NCP Child population millions exogenous NE Employment (full-time equivalent) millions behavioural [labour market] NFF Bank deposits less loans at end year $m NFF = R$/rx + LGF + - AGF NFI Covered bank lending $m behavioural [confidence] NGF Government investment and deposits
with banks less outstanding debt at end year
$m NGF = NLG + AGF(-1) + HAGF – IAGO –LG(-1).rpfa
NGI Covered government debt $m behavioural [monetary policy]
DESA/DPAD GPM 3.0 User Guide Appendix A - F page A-F 10
Alphametrics Co., Ltd. October 2010
Symbol Name Units Exogenous, behavioural or determined by identity
NIM Net migration (adjusted) millions NIM = NIMU + NIMUW*(NIMU - abs(NIMU))/(sum(abs(NIMU)) - NIMUW)
NIMU Net migration (unadjusted) millions behavioural [labour market] NIT$ Net income and transfers (adjusted) $m NIT$ = min(XIT$, MIT$) NITU$ Net income and transfers
(unadjusted) $m behavioural [external policy]
NLG Government net lending $m NLG = YG – G NLP Private net lending $m NLP = SP - IP - IV NOP Elderly population millions exogenous NUR Urban population millions behavioural [trend] NWP Working age population millions NWP = N - NCP - NOP NX$ External position $m NX$ = R$ + NXF$ NXF$ External position at end year
excluding exchange reserves (adjusted)
$m NXF$ = AXO$ - LX$
NXFU$ External position at end year excluding exchange reserves (unadjusted)
$m NXFU$ = CA$ - IR$ + AXO$(-1) .rpaxou$ - LX$(-1).rplx$
NXI$ Covered external position excluding exchange reserve transactions
$m behavioural [confidence]
NXN$ Covered external position including exchange reserve transactions
$m NXN$ = min(R$ + AXO$, LX$)
paw World price of primary commodities index behavioural [global markets] paw$ World dollar price of primary
commodities index paw$ = paw.phw
pewmax Oil price ceiling index constant (assumed level at which demand and supply elasticities become infinite)
pew World price of oil index market-clearing price (equalizes EDW and EPW)
pew$ World dollar price of oil index pew$ = pew.phw ph Dollar price of domestic expenditure ratio ph = rx.phw phd Domestic price index index phd = phd(-1)(1+pi/100) phw World dollar price of expenditure ratio phw = phw(-1).(1+pi_us/100).
rx_us(-1)/rx_us pi Domestic currency price inflation % p.a. pi = 100((1+pvi/100).tt(-1)/tt-1) piw World average domestic currency
price inflation % p.a. piw = sum(pi.H)/HW
piw$ World dollar price inflation % p.a. piw$ = 100 (phw/phw(-1) - 1) pkp Price of capital (ratio of value of
capital including land to produced capital stock)
deflator behavioural [confidence]
pmm$ Price of imports of manufactures deflator ppm$ = MM$ / MM0 pmm0 Average supplier price for imports of
manufactures deflator ppm0 = sum(sxm*(XM$/XM0)*(XM0(-
1)/XM$(-1)) pp0 Base-year ppp adjustment ratio constant pp0w World base-year ppp adjustment ratio constant

DESA/DPAD GPM 3.0 User Guide Appendix A - F page A-F 11
Alphametrics Co., Ltd. October 2010
Symbol Name Units Exogenous, behavioural or determined by identity pvd Domestic cost index index pvd = pvd(-1)(1+pvi/100)
pvi Domestic cost inflation % p.a. behavioural [supply, incomes
policy] pxm$ Price of exports of manufactures index pxm$ = XM$ / XM0 R$ Exchange reserves at end year $m behavioural (monetary policy) rmlx$ Ratio of exchange reserves to
imports and external liabilities % rmlx$ = 100 R$/(M$ + LX$)
rpax$ Valuation ratio for external assets brought forward
$m rpax$ = rpr$ * r$(-1) + rpaxo$ * axo$(-1))/(r$(-1)+ axo$(-1))
rpaxo$ Valuation ratio for other external assets brought forward (adjusted)
$m (AXO$-IAXO$)/AXO$(-1)
rpaxou$ Valuation ratio for other external assets brought forward (unadjusted)
$m behavioural [price movements]
rpfa Valuation ratio for domestic financial assets brought forward
ratio rpfa = 1/(1+spvi) [assumption]
rpkp Valuation ratio for capital stock brought forward
ratio rpkp = pkp/pkp(-1)
rplgo Valuation ratio for non-bank holdings of government debt brought forward
ratio rplgo = slgx.ph(-1)/ph + (1-slgx).rpfa
rplx$ Valuation ratio for external liabilities brought forward
ratio behavioural [price movements]
rpr$ Valuation ratio for exchange reserves brought forward
ratio behavioural [price movements]
rrf Bank reserves as percent of lending % rrf = 100 LGF/LN rx Real exchange rate (adjusted) ratio rx = rxu pp0w.HW/sum(H.rxu) rxd Nominal exchange rate index rxd = rxd(-1)(1+rxna/100) rxna Nominal exchange rate appreciation % p.a. rxna = 100((ph/ph(-1))
/(1+pi/100)-1) rxu Real exchange rate (unadjusted) ratio behavioural [monetary policy,
confidence] slgx Proportion of government debt
financed in foreign currency ratio slgx = 1 - log(1+YR)/2 [assumption]
SP Private saving $m behavioural [confidence] spvi Inflation indicator log spvi = log(-0.718 +
3.436(1+pvi/100) /(2+pvi/100))
sxm Market share of exports of manufactures in imports of each destination bloc (adjusted)
ratio sxm = sxmu / sum(sxmu)
sxmm Percent share of world exports of manufactures
% sxmm = 100 XM$ / MMW$
sxmu Market share of exports of manufactures in imports of each destination bloc (unadjusted)
ratio behavioural [trade policy]
TB$ Trade balance $m TB$ = X$ - M$ TB0 Trade balance at base year prices $m TB0 = X0 - M0

DESA/DPAD GPM 3.0 User Guide Appendix A - F page A-F 12
Alphametrics Co., Ltd. October 2010
Symbol Name Units Exogenous, behavioural or determined by identity tt Terms of trade effect ratio tt = (H+TB$/rx) /(H+TB0/pp0) ucx Unit cost of exports ratio ucx = 2 mh M$/M0 +
(rx H + X$-M$)(1–2 mh)/(pp0 V) V0 GDP at base-year exchange rates $m V0 = V.pp0 V GDP volume $m V = H + TB0/pp0 VN GDP per capita $ VN = V / N VNE GDP per employed person $ VNE = V / NE VT Productive capacity $m VT = 1.05 movav(V,6).
(V/V(-6))^0.3 VV Domestic purchasing power of GDP $m VV = H + TB$/rx VV$ External purchasing power of GDP $m VV$ = H*rx + TB$ vx Import content of exports relative to
import content of domestic expenditure
ratio vx = 2 + (X0-M0)/(pp0.V) [assumption]
wln Write-off rate for bank loans % p.a. exogenous [confidence] WLNA Lagged loan write-offs $m WLNA = 0.8 LN(-1).wln.rpfa +
0.2 WLNA(-1) WP Private wealth at end-year ratio WP = KP + LGO–AGO + DP–LN +
(AXO$-LX$)/rx X$ Exports of goods and services $m X$ = XA$ + XE$ + XM$ + XS$ X0 Exports of goods and services at
base-year prices $m X0 = XA0 + XE0 + XM0 + XS0
XA$ Exports of primary commodities (adjusted)
$m XA$ = XAU$.MAW$/XAUW$
XA0 Exports of primary commodities at base-year prices
$m behavioural [trade policy]
XAU$ Exports of primary commodities (unadjusted)
$m behavioural [price behaviour]
XE$ Exports of energy products $m XE$ = XEU$.MEW$/XEUW$ XE0 Exports of energy products at base-
year prices (adjusted) $m XE0 = XEU0.MEW0/XEUW0
XEU$ Exports of energy products (unadjusted)
$m behavioural [price behaviour]
XEU0 Exports of energy products at base- year prices (unadjusted)
$m behavioural [product mix]
XIT$ Income and transfers from abroad (adjusted)
$m XIT$ = XITU$.MITW$/XITUW$
XITU$
Income and transfers from abroad (unadjusted)
$m XITU$ = NITU$ + max(BITU$, 0)
XM$ Exports of manufactures
$m XM$ = sum(sxm MM$)
XM0 Exports of manufactures at base-year prices
$m behavioural [price behaviour]
XS$ Exports of services (adjusted) $m XS$ = XSU$.MSW$/XSUW$ XS0 Exports of services at base-year
prices $m behavioural [price behaviour]
XSU$ Exports of services (unadjusted) $m XSU$ = BSU$ + MS$

DESA/DPAD GPM 3.0 User Guide Appendix A - F page A-F 13
Alphametrics Co., Ltd. October 2010
Symbol Name Units Exogenous, behavioural or determined by identity Y National income (domestic
purchasing power) $m Y = H + CA$/rx
Y$ National income (international purchasing power)
$m Y$ = Y / rx
YG Government net income $m behavioural [fiscal policy] YN Income per capita $m YN = Y / N YP Private disposable income $m YP = Y - YG YR Relative income per capita $m YR = YN / YNW
Additional variables for policy evaluation Variables listed below are calculated after solution of the core model. In addition to these variables, many growth rates and ratios are computed for display in graphs. Growth rates have the prefix D before the variable name and ratios have the name of the denominator after the name of the numerator.
Symbol Name Units Exogenous, behavioural or determined by identity GY Population-weighted Gini
coefficient for distribution of income between blocs
index computed on blocs in ascending sequence by income per capita
psbdyn bloc performance measure for per capita income growth
index psbdyn = movav(10/(1+0.3 max(movav(DYN(-1), pslag)-DYN,0)), psmav)
psbnar bloc performance measure for activity rate
index psbnar = movav(10/(1+0.5 max( movav(nar(-1),pslag)-nar,0)), psmav)
psbpi bloc performance measure for inflation
index psbpi = movav(10/(1+0.1 max(pi-movav(pi(-1), pslag), 0)), psmav)
psbrx bloc performance measure for exchange rate stability
index psbrx = movav(10/(1+10*abs( log(rx) - movav(log(rx(-1)),pslag)), psmav)
psbt overall bloc performance measure index psbt = 1/(sqrt(pbpi/psbpi2 + pbdyn/psbdyn2 + pbrx/psbrx2 + pbnar/psbnar2))
pslag bloc performance comparison basis (no of years)
years constant [assumption]
psmav smoothing (no of year) years constant [assumption] pbdyn, pbnar, pbpi, pbrx
weights for overall bloc performance measure
fractions constant [assumption]
psedw global performance measure for energy use
index psedw = movav(10 /(1 + max(EDW - movav(EDW(-1),pslag),0)), psmav)
psdxw global performance measure for stability of export markets
index psdxw = movav(10/(1+100 abs( dlog(XW$)-movav(dlog(XW(-1), pslag)), psmav)

DESA/DPAD GPM 3.0 User Guide Appendix A - F page A-F 14
Alphametrics Co., Ltd. October 2010
Symbol Name Units Exogenous, behavioural or determined by identity pspaew global performance measure for
stability of commodity and oil prices index pspaew = movav(10/(1+abs(
log(paw)-movav(log(paw(-1)), pslag)), psmav)
psynlw global performance measure for catch-up of low income blocs
index psynlw = movav(10*exp(10*(rylow/ movav(rylow(-1), pslag)-1))/ (1+exp(10*rylow/movav(rylow(-1), pslag)-1))), psmav)
pswt overall global performance measure index pswt = 1/(sqrt(psed/psedw2 + psdx/psdxw2 + pspae/pspaew2 + psynl/psynlw2)
psed, psdx, pspae, psynl
weights for overall global performance measure
fractions constant [assumption]
rylow average income of bottom quartile as a fraction of global average income
ratio rylow = sum(Q1,Y)NW/(sum(Q1,N)YW) where Q1 is the first quartile by population of between-bloc income distribution
TH_ED Theil inequality coefficient for energy absorption
index TH_ED = 100(1-exp(-sum(ED/EDW log(N/NW))))
TH_EP Theil inequality coefficient for energy production
index TH_EP = 100(1-exp(-sum(EP/EPW log(N/NW))))
TH_G Theil inequality coefficient for government expenditure
index TH_G = 100(1-exp(-sum(G/GW log(N/NW))))
TH_XM$ Theil inequality coefficient for exports of manufactures
index TH_XM$ = 100(1-exp(-sum(XM$/XMW$ log(N/NW))))
TH_XS$ Theil inequality coefficient for exports of services
index TH_XS$ = 100(1-exp(-sum(XS$/XSW$ log(N/NW))))
TH_Y Theil inequality coefficient for income
index TH_Y = 100(1-exp(-sum(Y/YW log(N/NW))))

DESA/DPAD GPM 3.0 User Guide Appendix A - F page A-F 15
Alphametrics Co., Ltd. October 2010
Appendix D Behavioural equations Notes: (1) except where noted coefficients, intercepts and autocorrelations are estimated on data for 1980-2008 (2) graphs of actual and predicted values for 1978-2008: predicted values are generated by dynamic simulation using simulated results for lagged endogenous values and actual values for other variables. For the purposes of historical simulation values of constants and fixed effects are those estimated for 1980-2008.
SP Private savings d(SP/YP(-1))
value probability unit root test Fisher ADF 170.1 0.000 coefficients coeff t-stat description SP(-1)/YP(-2) -0.200 error correction d(YP)/YP(-1) 0.665 (17.2) growth of private income d(WP(-1))/WP(-2) -0.008 wealth spvi 0.066 (4.1) inflation irs(-1)/100 0.070 short-term interest rate intercepts and ar(1) estimated on data for 1996-2008 statistics value t-stat value t-stat constant 0.025 (30.4) residual ar(1) 0.066 (1.2) se 0.020 fixed effects CN 0.03212 JA 0.02740 EAM 0.02451 EAH 0.01648 EU 0.01421 WA 0.00516 CI 0.00262 OD -0.00194 IN -0.00422 AFM -0.00441 AMM -0.00888 EAL -0.00949 US -0.01148 ACX -0.01298 SA -0.03027 AFL -0.03884
1,000,0001,200,0001,400,0001,600,0001,800,0002,000,0002,200,0002,400,000
1980 1990 2000
USA
1,800,0002,000,0002,200,0002,400,0002,600,0002,800,0003,000,0003,200,0003,400,000
1980 1990 2000
Europe
600,000
700,000800,000
900,0001,000,000
1,100,0001,200,000
1980 1990 2000
Japan
200,000
250,000
300,000
350,000
400,000
450,000
1980 1990 2000
Other Developed
200,000
400,000
600,000
800,000
1,000,000
1980 1990 2000
CIS and Other
200,000
400,000
600,000
800,000
1,000,000
1980 1990 2000
Wes t Asia
100,000
200,000
300,000
400,000
500,000
600,000
1980 1990 2000
E Asia High Income
0500,000
1,000,0001,500,0002,000,0002,500,0003,000,0003,500,0004,000,000
1980 1990 2000
China
40,00080,000
120,000160,000200,000
240,000280,000
1980 1990 2000
E Asia Middle Incom e
0200,000
400,000600,000800,000
1,000,0001,200,000
1980 1990 2000
India
20,00040,00060,00080,000
100,000120,000140,000160,000
1980 1990 2000
South Asia
40,00080,000
120,000160,000200,000
240,000280,000
1980 1990 2000
E Asia Low Incom e
160,000200,000240,000280,000
320,000360,000
400,000
1980 1990 2000
Central America
0
200,000
400,000
600,000
800,000
1,000,000
1980 1990 2000
South America
100,000150,000200,000250,000
300,000350,000
400,000
1980 1990 2000
Africa Middle Income
040,00080,000
120,000
160,000200,000
240,000
1980 1990 2000
Africa Low Inc ome
Private savings
Actual (blue), Predicted (red)

DESA/DPAD GPM 3.0 User Guide Appendix A - F page A-F 16
Alphametrics Co., Ltd. October 2010
IP Private investment dlog(IP/V(-1)-0.05) value probability unit root test Fisher ADF 193.9 0.000 coefficients coeff t-stat description log(IP(-1)/V(-2)-0.05) -0.057 (3.7) error correction dlog(V) 0.500 GDP growth rate ILN(-1)/V(-1) 0.063 (1.5) bank lending irm/100 -0.200 bond rate statistics value t-stat value t-stat constant -0.124 (4.0) residual ar(1) -0.057 (3.7) se 0.117
1,000,0001,200,0001,400,0001,600,0001,800,0002,000,0002,200,0002,400,0002,600,000
1980 1990 2000
USA
1,400,0001,600,0001,800,0002,000,0002,200,0002,400,0002,600,0002,800,0003,000,000
1980 1990 2000
Europe
500,000
600,000700,000
800,000900,000
1,000,0001,100,000
1980 1990 2000
Japan
150,000200,000250,000300,000350,000400,000450,000500,000
1980 1990 2000
Other Developed
200,000250,000300,000350,000400,000450,000500,000550,000600,000
1980 1990 2000
CIS and Other
100,000
200,000
300,000
400,000
500,000
600,000
1980 1990 2000
Wes t Asia
0100,000
200,000300,000400,000
500,000600,000
1980 1990 2000
E Asia High Income
0500,000
1,000,0001,500,0002,000,000
2,500,0003,000,000
1980 1990 2000
China
040,000
80,000120,000160,000
200,000240,000
1980 1990 2000
E Asia Middle Incom e
0
200,000
400,000
600,000
800,000
1,000,000
1980 1990 2000
India
20,00040,00060,00080,000
100,000120,000140,000160,000
1980 1990 2000
South Asia
050,000
100,000150,000200,000
250,000300,000
1980 1990 2000
E Asia Low Incom e
120,000160,000200,000240,000
280,000320,000
360,000
1980 1990 2000
Central America
200,000
300,000
400,000
500,000
600,000
700,000
1980 1990 2000
South America
80,000120,000160,000200,000
240,000280,000
320,000
1980 1990 2000
Africa Middle Income
20,00040,00060,00080,000
100,000120,000140,000160,000180,000
1980 1990 2000
Africa Low Inc ome
Private investment
Actual (blue), Predicted (red)

DESA/DPAD GPM 3.0 User Guide Appendix A - F page A-F 17
Alphametrics Co., Ltd. October 2010
IV Inventory changes d(IV/V(-1)) value probability unit root test Fisher ADF 145.9 0.000 coefficients coeff t-stat description IV(-1)/V(-2) -0.765 (11.4) error correction d(V)/V(-1) 0.178 (5.6) GDP growth rate ILN(-1)/V(-1) 0.050 bank lending d(ILN/V(-1)) 0.050 change in bank lending irs/100 -0.013 short-term interest rate intercepts and ar(1) estimated on data for 1996-2008 statistics value t-stat value t-stat constant -0.001 (2.6) residual ar(1) 0.219 (2.1) se 0.010 fixed effects ACX 0.02720 CI 0.00440 SA 0.00286 WA 0.00272 AFM 0.00190 IN 0.00164 JA 0.00094 AMM 0.00052 CN -0.00312 EU -0.00348 EAL -0.00409 AFL -0.00466 US -0.00477 OD -0.00486 EAH -0.00528 EAM -0.01191
-80,000
-40,000
0
40,000
80,000
120,000
1980 1990 2000
USA
-50,000-25,000
025,00050,00075,000
100,000125,000150,000
1980 1990 2000
Europe
-80,000
-40,000
0
40,000
80,000
120,000
1980 1990 2000
Japan
-20,000
-10,000
0
10,000
20,000
30,000
1980 1990 2000
Other Developed
-50,0000
50,000100,000
150,000200,000
250,000
1980 1990 2000
CIS and Other
-40,000-20,000
020,00040,00060,00080,000
100,000
1980 1990 2000
West Asia
-60,000
-40,000
-20,000
0
20,000
40,000
1980 1990 2000
E As ia High Income
050,000
100,000150,000200,000250,000300,000350,000400,000
1980 1990 2000
China
-24,000-20,000-16,000-12,000-8,000-4,000
04,0008,000
1980 1990 2000
E As ia Middle Income
-20,000
20,000
60,000
100,000
140,000
1980 1990 2000
India
0
4,000
8,000
12,000
16,000
20,000
1980 1990 2000
South As ia
-60,000
-40,000-20,000
020,00040,00060,000
1980 1990 2000
E Asia Low Income
20,000
40,000
60,000
80,000
100,000
1980 1990 2000
Central Americ a
-120,000
-80,000
-40,000
0
40,000
80,000
1980 1990 2000
South America
05,000
10,00015,00020,00025,00030,00035,00040,000
1980 1990 2000
Africa Middle Income
-8,000
-4,0000
4,0008,000
12,00016,000
1980 1990 2000
Africa Low Incom e
Inventory changes
Actual (blue), Predicted (red)

DESA/DPAD GPM 3.0 User Guide Appendix A - F page A-F 18
Alphametrics Co., Ltd. October 2010
NFI Covered bank lending dlog(1/(2.5/(NFI/Y(-1))-1))+4*WLNA/LN(-1)
value probability unit root test Fisher ADF 279.3 0.000 coefficients coeff t-stat description log(1/(2.5/(NFI(-1)/Y(-2))-1)) -0.171 (3.4) error correction log(Y(-1)) 0.096 (4.1) national income dlog(Y) 0.300 growth of national income NFF/NFI(-1) -0.012 (1.3) liquidity d(NFF)/NFI(-1) 0.034 (1.3) increase in liquidity d(LGF)/Y(-1) 1.371 (2.8) government debt held by banks (R$(-1)+NXI$(-1))/Y$(-1) 0.074 (2.9) reserves & covered ext position statistics value t-stat value t-stat constant -1.619 (4.3) residual ar(1) -0.171 (3.4) se 0.166 fixed effects EAM 0.30599 JA 0.30539 OD 0.13854 CN 0.12419 AFM 0.05905 EAH 0.03401 EAL 0.02850 SA -0.03562 WA -0.05881 IN -0.07257 US -0.09666 AFL -0.10679 AMM -0.12579 EU -0.13130 ACX -0.13169 CI -0.23644
2,000,0004,000,0006,000,0008,000,000
10,000,00012,000,00014,000,00016,000,000
1980 1990 2000
USA
2,000,0004,000,0006,000,0008,000,000
10,000,00012,000,00014,000,00016,000,00018,000,000
1980 1990 2000
Europe
2,000,0003,000,0004,000,0005,000,0006,000,0007,000,0008,000,0009,000,000
1980 1990 2000
Japan
0500,000
1,000,0001,500,0002,000,0002,500,0003,000,0003,500,000
1980 1990 2000
Other Developed
0200,000400,000600,000800,000
1,000,0001,200,0001,400,0001,600,000
1980 1990 2000
CIS and Other
0200,000400,000600,000800,000
1,000,0001,200,0001,400,0001,600,000
1980 1990 2000
West Asia
0
400,000
800,000
1,200,000
1,600,000
2,000,000
1980 1990 2000
E Asia High Income
02,000,000
4,000,0006,000,000
8,000,00010,000,00012,000,000
1980 1990 2000
China
0200,000400,000600,000800,000
1,000,0001,200,0001,400,000
1980 1990 2000
E Asia Middle Incom e
0200,000400,000600,000800,000
1,000,0001,200,0001,400,0001,600,000
1980 1990 2000
India
040,00080,000
120,000160,000200,000240,000280,000
1980 1990 2000
South Asia
0
200,000
400,000
600,000
800,000
1980 1990 2000
E Asia Low Income
100,000
200,000
300,000
400,000
500,000
600,000
1980 1990 2000
Central America
400,000600,000800,000
1,000,0001,200,0001,400,0001,600,0001,800,000
1980 1990 2000
South America
0200,000400,000600,000800,000
1,000,0001,200,000
1980 1990 2000
Africa Middle Income
50,00075,000
100,000125,000150,000175,000200,000225,000250,000
1980 1990 2000
Africa Low Income
Covered bank lending
Actual (blue), Predicted (red)

DESA/DPAD GPM 3.0 User Guide Appendix A - F page A-F 19
Alphametrics Co., Ltd. October 2010
pkp Real asset price dlog(pkp)
value probability unit root test Fisher ADF 195.6 0.000 coefficients coeff t-stat description log(pkp(-1)) -0.029 (2.5) error correction dlog(pkp(-1)) 0.292 (5.8) momentum log(V/VT) 0.500 capacity utilisation statistics value t-stat value t-stat constant 0.021 (4.6) residual ar(1) -0.029 (2.5) se 0.041 fixed effects AFL 0.01995 AFM 0.01122 AMM 0.01110 WA 0.00919 US 0.00918 EAL 0.00447 ACX 0.00278 OD 0.00174 EU 0.00159 CI 0.00137 EAM -0.00634 IN -0.00702 EAH -0.00705 SA -0.00807 CN -0.01880 JA -0.02530
1.351.40
1.50
1.60
1.70
1980 1990 2000
USA
1.201.22
1.26
1.30
1.34
1980 1990 2000
Europe
0.50.60.70.80.91.01.11.2
1980 1990 2000
Japan
1.28
1.32
1.36
1.40
1.44
1980 1990 2000
Other Developed
0.6
0.8
1.01.2
1.4
1.6
1980 1990 2000
CIS and Other
1.4
1.5
1.61.7
1.8
1.9
1980 1990 2000
West Asia
1.21.41.61.82.02.22.4
1980 1990 2000
E Asia High Income
1.11.21.31.41.51.61.7
1980 1990 2000
China
1.31.41.51.61.71.81.92.0
1980 1990 2000
E Asia Middle Income
1.301.35
1.45
1.55
1.65
1980 1990 2000
India
1.2
1.4
1.6
1.8
2.0
1980 1990 2000
South Asia
1.61.82.02.22.42.62.8
1980 1990 2000
E Asia Low Income
1.3
1.41.5
1.61.7
1.8
1980 1990 2000
Central America
1.52
1.60
1.68
1.76
1.84
1980 1990 2000
South America
1.21.31.41.51.61.71.81.9
1980 1990 2000
Africa Middle Income
1.41.61.82.02.22.42.62.8
1980 1990 2000
Africa Low Income
Real asset price
Actual (blue), Predicted ( red)

DESA/DPAD GPM 3.0 User Guide Appendix A - F page A-F 20
Alphametrics Co., Ltd. October 2010
YG Government income d(YG)/Y(-1)
value probability unit root test Fisher ADF 258.8 0.000 coefficients coeff t-stat description YG(-1)/Y(-1) -0.170 (4.1) error correction LG(-1)/Y(-1) 0.018 (3.3) outstanding debt d(Y)/Y(-1) 0.195 (8.3) income growth d(Y(-1))/Y(-1) 0.056 (3.4) lagged income growth irm(-1)*LG(-1)/(100*Y(-1)) -0.200 debt interest statistics value t-stat value t-stat constant 0.020 (3.0) residual ar(1) -0.170 (4.1) se 0.015 fixed effects AFM 0.01230 CI 0.01133 OD 0.00901 AMM 0.00632 WA 0.00513 EU 0.00420 EAH 0.00392 EAM -0.00033 JA -0.00047 EAL -0.00255 US -0.00257 ACX -0.00436 AFL -0.00449 CN -0.00570 IN -0.01341 SA -0.01832
800,0001,000,0001,200,0001,400,0001,600,0001,800,0002,000,0002,200,000
1980 1990 2000
USA
1,000,0001,250,0001,500,0001,750,0002,000,0002,250,0002,500,0002,750,0003,000,000
1980 1990 2000
Europe
0
200,000400,000
600,000800,000
1,000,0001,200,000
1980 1990 2000
Japan
100,000
200,000
300,000
400,000
500,000
600,000
1980 1990 2000
Other Developed
200,000300,000400,000500,000600,000700,000800,000900,000
1980 1990 2000
CIS and Other
100,000
200,000300,000
400,000500,000
600,000700,000
1980 1990 2000
Wes t Asia
0100,000
200,000300,000400,000
500,000600,000
1980 1990 2000
E Asia High Income
0200,000400,000600,000800,000
1,000,0001,200,0001,400,000
1980 1990 2000
China
20,00040,00060,00080,000
100,000120,000140,000160,000
1980 1990 2000
E Asia Middle Incom e
50,000100,000150,000200,000250,000300,000350,000400,000
1980 1990 2000
India
10,00020,00030,00040,00050,00060,00070,00080,00090,000
1980 1990 2000
South Asia
40,000
80,000
120,000
160,000
200,000
240,000
1980 1990 2000
E Asia Low Incom e
50,000
100,000
150,000
200,000
250,000
300,000
1980 1990 2000
Central America
200,000300,000400,000500,000
600,000700,000
800,000
1980 1990 2000
South America
50,000100,000150,000200,000250,000300,000350,000400,000
1980 1990 2000
Africa Middle Income
20,00040,00060,00080,000
100,000120,000140,000160,000
1980 1990 2000
Africa Low Inc ome
Government income
Actual (blue), Predicted (red)

DESA/DPAD GPM 3.0 User Guide Appendix A - F page A-F 21
Alphametrics Co., Ltd. October 2010
G Government spending dlog(G) value probability unit root test Fisher ADF 169.4 0.000 coefficients coeff t-stat description log(G(-1)) -0.030 (2.1) error correction dlog(YG) 0.064 (2.9) increase in government income YG(-1)/Y(-1) 0.342 (4.4) government income log(N(-1)) 0.107 (3.1) population log(LG(-1)/Y(-1)) -0.032 (5.4) outstanding debt CA$(-1)/Y$(-1) 0.222 (2.6) current account statistics value t-stat value t-stat constant -0.256 (2.0) residual ar(1) -0.030 (2.1) se 0.042 fixed effects OD 0.15949 EAH 0.11908 JA 0.09231 EAM 0.08008 US 0.04917 ACX 0.03237 WA 0.00489 AFM -0.00064 CI -0.01386 AMM -0.01807 EU -0.02449 SA -0.02917 EAL -0.07881 AFL -0.10113 IN -0.10455 CN -0.16669
800,000
1,200,000
1,600,000
2,000,000
2,400,000
2,800,000
1980 1990 2000
USA
1,600,000
2,000,000
2,400,000
2,800,000
3,200,000
3,600,000
1980 1990 2000
Europe
300,000
400,000500,000
600,000700,000
800,000900,000
1980 1990 2000
Japan
200,000250,000300,000350,000400,000450,000500,000550,000
1980 1990 2000
Other Developed
200,000
300,000
400,000
500,000
600,000
700,000
1980 1990 2000
CIS and Other
200,000
300,000
400,000
500,000
600,000
700,000
1980 1990 2000
Wes t Asia
0
100,000
200,000
300,000
400,000
500,000
1980 1990 2000
E Asia High Income
0200,000400,000600,000800,000
1,000,0001,200,0001,400,000
1980 1990 2000
China
20,00040,00060,00080,000
100,000120,000140,000160,000180,000
1980 1990 2000
E Asia Middle Incom e
0
100,000
200,000
300,000
400,000
500,000
1980 1990 2000
India
20,000
40,000
60,000
80,000
100,000
1980 1990 2000
South Asia
40,000
80,000
120,000
160,000
200,000
240,000
1980 1990 2000
E Asia Low Incom e
120,000
160,000
200,000
240,000
280,000
320,000
1980 1990 2000
Central America
200,000300,000400,000500,000
600,000700,000
800,000
1980 1990 2000
South America
120,000160,000200,000240,000280,000320,000360,000400,000
1980 1990 2000
Africa Middle Income
60,00080,000
100,000120,000140,000160,000180,000200,000
1980 1990 2000
Africa Low Inc ome
Government spending
Actual (blue), Predicted (red)

DESA/DPAD GPM 3.0 User Guide Appendix A - F page A-F 22
Alphametrics Co., Ltd. October 2010
NGI Covered debt dlog(NGI)
value probability unit root test Fisher ADF 234.6 0.000 coefficients coeff t-stat description log(NGI(-1)) -0.124 (3.5) error correction log(R$(-1)/rx(-1)) 0.100 (4.7) exchange reserve dlog(Y) 0.972 (3.2) income growth statistics value t-stat value t-stat constant 0.190 (1.0) residual ar(1) -0.124 (3.5) se 0.406 fixed effects WA 0.13390 AFL 0.09813 AFM 0.08908 CI 0.08326 EAH 0.06504 EU 0.06287 AMM 0.05409 JA 0.04486 ACX 0.03881 EAL 0.01725 US 0.01021 OD -0.01685 CN -0.02514 EAM -0.03517 SA -0.23162 IN -0.38873
20,00030,00040,00050,00060,00070,00080,00090,000
100,000
1980 1990 2000
USA
280,000320,000360,000400,000440,000480,000520,000560,000
1980 1990 2000
Europe
040,00080,000
120,000160,000200,000240,000280,000320,000
1980 1990 2000
Japan
10,00020,00030,00040,00050,00060,00070,00080,000
1980 1990 2000
Other Developed
050,000
100,000150,000200,000250,000300,000350,000400,000
1980 1990 2000
CIS and Other
0
200,000
400,000
600,000
800,000
1980 1990 2000
West Asia
040,00080,000
120,000160,000200,000240,000280,000320,000
1980 1990 2000
E As ia High Income
0
100,000
200,000
300,000
400,000
500,000
1980 1990 2000
China
0
20,000
40,000
60,000
80,000
1980 1990 2000
E As ia Middle Income
020,00040,00060,00080,000
100,000120,000140,000160,000
1980 1990 2000
India
05,000
10,00015,00020,00025,00030,00035,00040,000
1980 1990 2000
South As ia
20,00030,00040,00050,00060,00070,00080,00090,000
100,000
1980 1990 2000
E Asia Low Income
0
20,00040,000
60,00080,000
100,000120,000
1980 1990 2000
Central Americ a
80,000
120,000160,000
200,000240,000
280,000320,000
1980 1990 2000
South America
050,000
100,000150,000200,000250,000300,000350,000
1980 1990 2000
Africa Middle Income
0
20,00040,000
60,00080,000
100,000120,000
1980 1990 2000
Africa Low Incom e
Covered debt
Actual (blue), Predicted (red)

DESA/DPAD GPM 3.0 User Guide Appendix A - F page A-F 23
Alphametrics Co., Ltd. October 2010
IAGO Other govt asset transactions IAGO/Y(-1)
value probability unit root test Fisher ADF 136.8 0.000 coefficients coeff t-stat description LG(-1)/Y(-1) -0.044 (1.5) outstanding debt NLG/Y(-1) 0.200 government balance statistics value t-stat value t-stat constant 0.049 (3.3) residual ar(1) -0.044 (1.5) se 0.056 fixed effects SA 0.11104 AMM 0.03367 JA 0.03300 OD 0.01419 EAH 0.00649 IN -0.00152 CI -0.00160 AFM -0.00227 EAL -0.00459 AFL -0.00602 ACX -0.01015 EU -0.02020 US -0.02410 EAM -0.02656 WA -0.03086 CN -0.07052
-1,000,000-800,000
-600,000-400,000
-200,0000
200,000
1980 1990 2000
USA
-600,000-400,000-200,000
0200,000400,000600,000800,000
1980 1990 2000
Europe
-800,000
-400,000
0
400,000
800,000
1,200,000
1980 1990 2000
Japan
-40,0000
40,00080,000
120,000160,000200,000240,000
1980 1990 2000
Other Developed
-500,000
-300,000
-100,000
100,000
300,000
1980 1990 2000
CIS and Other
-150,000-100,000
-50,0000
50,000100,000150,000
1980 1990 2000
West Asia
-40,0000
40,00080,000
120,000160,000200,000240,000280,000
1980 1990 2000
E Asia High Income
-350,000-300,000-250,000-200,000-150,000-100,000-50,000
050,000
1980 1990 2000
China
-30,000
-10,000
10,000
30,000
50,000
1980 1990 2000
E Asia Middle Income
-100,000-50,000
050,000
100,000150,000200,000250,000
1980 1990 2000
India
0
40,000
80,000
120,000
160,000
200,000
1980 1990 2000
South Asia
-300,000-200,000-100,000
0100,000200,000300,000400,000
1980 1990 2000
E Asia Low Income
-40,000
0
40,000
80,000
120,000
160,000
1980 1990 2000
Central America
-200,000-100,000
0100,000
200,000300,000400,000
1980 1990 2000
South America
-40,000
0
40,000
80,000
120,000
160,000
1980 1990 2000
Africa Middle Income
-40,000-30,000-20,000-10,000
010,00020,00030,00040,000
1980 1990 2000
Africa Low Income
Other govt asset transactions
Actual (blue), Predicted (red)
DESA/DPAD GPM 3.0 User Guide Appendix A - F page A-F 24
Alphametrics Co., Ltd. October 2010
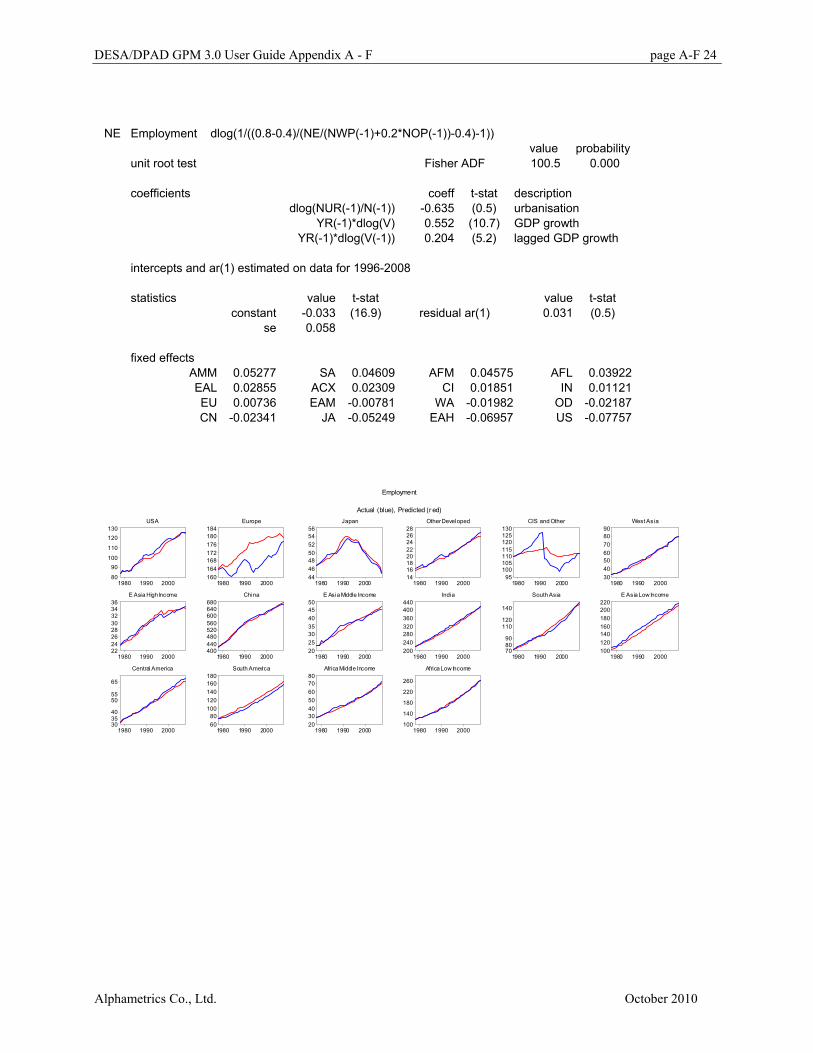
NE Employment dlog(1/((0.8-0.4)/(NE/(NWP(-1)+0.2*NOP(-1))-0.4)-1))
value probability unit root test Fisher ADF 100.5 0.000 coefficients coeff t-stat description dlog(NUR(-1)/N(-1)) -0.635 (0.5) urbanisation YR(-1)*dlog(V) 0.552 (10.7) GDP growth YR(-1)*dlog(V(-1)) 0.204 (5.2) lagged GDP growth intercepts and ar(1) estimated on data for 1996-2008 statistics value t-stat value t-stat constant -0.033 (16.9) residual ar(1) 0.031 (0.5) se 0.058 fixed effects AMM 0.05277 SA 0.04609 AFM 0.04575 AFL 0.03922 EAL 0.02855 ACX 0.02309 CI 0.01851 IN 0.01121 EU 0.00736 EAM -0.00781 WA -0.01982 OD -0.02187 CN -0.02341 JA -0.05249 EAH -0.06957 US -0.07757
80
90100
110
120130
1980 1990 2000
USA
160164168172176180184
1980 1990 2000
Europe
44464850525456
1980 1990 2000
Japan
1416182022242628
1980 1990 2000
Other Developed
95100105110115120125130
1980 1990 2000
CIS and Other
30405060708090
1980 1990 2000
West Asia
2224262830323436
1980 1990 2000
E Asia High Income
400440480520560600640680
1980 1990 2000
China
20253035404550
1980 1990 2000
E Asia Middle Income
200240280320360400440
1980 1990 2000
India
708090
110120
140
1980 1990 2000
South Asia
100120140160180200220
1980 1990 2000
E Asia Low Income
303540
5055
65
1980 1990 2000
Central America
6080
100120140160180
1980 1990 2000
South America
20304050607080
1980 1990 2000
Africa Middle Income
100
140
180
220
260
1980 1990 2000
Africa Low Income
Employment
Actual (blue), Predicted (r ed)

DESA/DPAD GPM 3.0 User Guide Appendix A - F page A-F 25
Alphametrics Co., Ltd. October 2010
NIMU Net migration log((1 + NIMU/NE(-1))/(1 + NIM(-1)/NE(-2)))
value probability unit root test Fisher ADF 183.5 0.000 coefficients coeff t-stat description dlog(NWP(-1)) 0.020 working age population dlog(NE) 0.040 employment growth statistics value t-stat value t-stat constant -0.001 (25.3) residual ar(1) 0.493 (8.3) se 0.001 fixed effects JA 0.00116 EU 0.00114 CI 0.00090 OD 0.00047 US 0.00030 EAH 0.00017 CN 0.00008 ACX -0.00008 EAM -0.00026 IN -0.00027 SA -0.00036 EAL -0.00037 AMM -0.00052 AFM -0.00053 AFL -0.00065 WA -0.00118
0.40.60.8
1.21.4
1.8
1980 1990 2000
USA
-0.50.00.51.01.52.02.53.0
1980 1990 2000
Europe
-.3-.2-.1
.1
.2
.4
1980 1990 2000
Japan
.1
.2
.3
.4
.5
.6
.7
1980 1990 2000
Other Developed
-.6-.4-.2.0.2.4.6.8
1980 1990 2000
CIS and Other
-.6-.4-.2.0.2.4.6.8
1980 1990 2000
West Asia
-.05.00.05.10.15.20.25
1980 1990 2000
E Asia High Income
-1
01
2
34
1980 1990 2000
China
-.1.0.1.2.3.4.5.6
1980 1990 2000
E Asia Middle Income
-.4
-.2.0
.2
.4
.6
1980 1990 2000
India
-.7-.6-.5-.4-.3-.2-.1.0
1980 1990 2000
South Asia
-1.0-0.8
-0.4
0.0
0.4
1980 1990 2000
E Asia Low Income
-1.2-1.0-0.8-0.6-0.4-0.20.00.2
1980 1990 2000
Central America
-.6-.5-.4-.3-.2-.1.0
1980 1990 2000
South America
-.3
-.2-.1
.0
.1
.2
1980 1990 2000
Africa Middle Income
-.8
-.6
-.4
-.2
.0
1980 1990 2000
Africa Low Income
Net migration
Actual (blue), Predicted (red)

DESA/DPAD GPM 3.0 User Guide Appendix A - F page A-F 26
Alphametrics Co., Ltd. October 2010
NUR Urban population dlog(1/(1/(NUR/N)-1))
value probability unit root test Fisher ADF 190.0 0.000 coefficients coeff t-stat description log(V(-1)/N(-1)) -0.000 (0.3) GDP per capita statistics value t-stat value t-stat constant 0.021 (2.6) residual ar(1) -0.000 (0.3) se 0.026 fixed effects CN 0.02192 EAL 0.01606 EAH 0.01312 AMM 0.01023 WA 0.00608 AFL 0.00286 EAM 0.00255 US 0.00064 SA -0.00001 ACX -0.00050 AFM -0.00258 IN -0.00689 OD -0.00698 JA -0.00786 EU -0.01528 CI -0.03335
160180200220240260280
1980 1990 2000
USA
330340350360370380390
1980 1990 2000
Europe
65.067.570.0
75.077.5
82.5
1980 1990 2000
Japan
32364044485256
1980 1990 2000
Other Developed
180
188
196
204
212
1980 1990 2000
CIS and Other
6080
100120140160180200
1980 1990 2000
West Asia
3540455055606570
1980 1990 2000
E Asia High Income
100
200300
400
500600
1980 1990 2000
China
15202530354045
1980 1990 2000
E Asia Middle Income
120160200240280320360
1980 1990 2000
India
20406080
100120140
1980 1990 2000
South Asia
5075
100
150175
225
1980 1990 2000
E Asia Low Income
60708090
100110120130
1980 1990 2000
Central America
120
160200
240
280320
1980 1990 2000
South America
50
70
90
110
130
1980 1990 2000
Africa Middle Income
4080
120160200240280
1980 1990 2000
Africa Low Income
Urban population
Actual (blue), Predicted (r ed)
DESA/DPAD GPM 3.0 User Guide Appendix A - F page A-F 27
Alphametrics Co., Ltd. October 2010
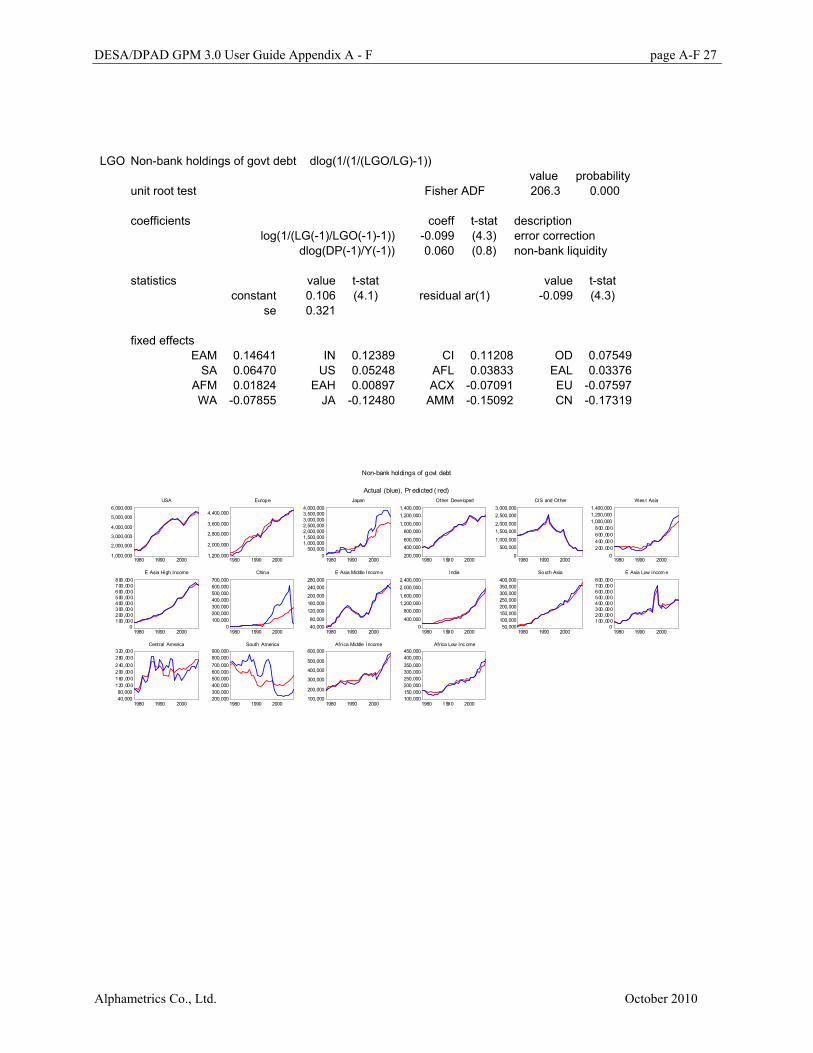
LGO Non-bank holdings of govt debt dlog(1/(1/(LGO/LG)-1))
value probability unit root test Fisher ADF 206.3 0.000 coefficients coeff t-stat description log(1/(LG(-1)/LGO(-1)-1)) -0.099 (4.3) error correction dlog(DP(-1)/Y(-1)) 0.060 (0.8) non-bank liquidity statistics value t-stat value t-stat constant 0.106 (4.1) residual ar(1) -0.099 (4.3) se 0.321 fixed effects EAM 0.14641 IN 0.12389 CI 0.11208 OD 0.07549 SA 0.06470 US 0.05248 AFL 0.03833 EAL 0.03376 AFM 0.01824 EAH 0.00897 ACX -0.07091 EU -0.07597 WA -0.07855 JA -0.12480 AMM -0.15092 CN -0.17319
1,000,000
2,000,000
3,000,000
4,000,000
5,000,000
6,000,000
1980 1990 2000
USA
1,200,000
2,000,000
2,800,000
3,600,000
4,400,000
1980 1990 2000
Europe
0500,000
1,000,0001,500,0002,000,0002,500,0003,000,0003,500,0004,000,000
1980 1990 2000
Japan
200,000
400,000600,000
800,0001,000,000
1,200,0001,400,000
1980 1990 2000
Other Developed
0
500,0001,000,000
1,500,0002,000,000
2,500,0003,000,000
1980 1990 2000
CIS and Other
0200,000400,000600,000800,000
1,000,0001,200,0001,400,000
1980 1990 2000
Wes t Asia
0100,000200,000300,000400,000500,000600,000700,000800,000
1980 1990 2000
E Asia High Income
0100,000200,000300,000400,000500,000600,000700,000
1980 1990 2000
China
40,00080,000
120,000160,000200,000
240,000280,000
1980 1990 2000
E Asia Middle Incom e
0400,000
800,0001,200,0001,600,000
2,000,0002,400,000
1980 1990 2000
India
50,000100,000150,000200,000250,000300,000350,000400,000
1980 1990 2000
South Asia
0100,000200,000300,000400,000500,000600,000700,000800,000
1980 1990 2000
E Asia Low Incom e
40,00080,000
120,000160,000200,000240,000280,000320,000
1980 1990 2000
Central America
200,000300,000400,000500,000600,000700,000800,000900,000
1980 1990 2000
South America
100,000
200,000
300,000
400,000
500,000
600,000
1980 1990 2000
Africa Middle Income
100,000150,000200,000250,000300,000350,000400,000450,000
1980 1990 2000
Africa Low Inc ome
Non-bank holdings of govt debt
Actual (blue), Pr edicted ( red)

DESA/DPAD GPM 3.0 User Guide Appendix A - F page A-F 28
Alphametrics Co., Ltd. October 2010
is Short-term interest rate dlog(0.4+is/100) value probability unit root test Fisher ADF 129.3 0.000 coefficients coeff t-stat description log(0.4+is(-1)/100) -0.267 (4.3) error correction log(0.4+pi(-1)/100) 0.178 (3.4) inflation dlog(0.4+pi/100) 0.297 (5.4) rate of change in inflation log(V/VT) 0.439 (2.3) capacity utilisation intercepts and ar(1) estimated on data for 1996-2008 statistics value t-stat value t-stat constant -0.065 (26.4) residual ar(1) 0.038 (4.1) se 0.061 fixed effects AMM 0.03542 IN 0.02113 OD 0.01212 EU 0.00900 EAH 0.00838 WA 0.00638 US 0.00580 EAL 0.00343 JA 0.00275 EAM 0.00184 SA -0.00019 ACX -0.00037 AFL -0.00627 CN -0.01170 AFM -0.01187 CI -0.07585
0
4
8
12
16
1980 1990 2000
USA
048
12162024
1980 1990 2000
Europe
02468
1012
1980 1990 2000
Japan
05
101520253035
1980 1990 2000
Other Developed
01,0002,0003,0004,0005,0006,000
1980 1990 2000
CIS and Other
010
20
30
4050
1980 1990 2000
West Asia
0
4
8
1216
20
1980 1990 2000
E Asia High Income
0
4
8
1216
20
1980 1990 2000
China
02468
101214
1980 1990 2000
E Asia Middle Income
468
1012141618
1980 1990 2000
India
048
12162024
1980 1990 2000
South Asia
4
12
20
28
36
1980 1990 2000
E Asia Low Income
010203040506070
1980 1990 2000
Central America
0
2,0004,000
6,000
8,000
10,000
1980 1990 2000
South America
05
101520253035
1980 1990 2000
Africa Middle Income
0
20
40
60
80
1980 1990 2000
Africa Low Income
Short- term interest rate
Actual (blue), Predicted (red)

DESA/DPAD GPM 3.0 User Guide Appendix A - F page A-F 29
Alphametrics Co., Ltd. October 2010
im Bond rate log(0.4+im/100) value probability unit root test Fisher ADF 50.3 0.021 coefficients coeff t-stat description log(0.4+is(-1)/100) 0.055 (2.4) short-term rate dlog(0.4+is/100) 0.034 (2.1) rate of change in short-term rate log(0.4+pi(-1)/100) 0.930 (38.7) inflation dlog(0.4+pi/100) 0.939 (51.5) rate of change in inflation statistics value t-stat value t-stat constant 0.080 (6.5) residual ar(1) 0.055 (2.4) se 0.058 fixed effects CN 0.03266 CI 0.02432 EAL 0.02090 WA 0.01832 AFL 0.01606 EAH 0.01166 AFM 0.01084 ACX 0.00932 IN 0.00871 US -0.00596 AMM -0.00605 OD -0.01108 EAM -0.01625 EU -0.01691 JA -0.03213 SA -0.06441
2468
101214
1980 1990 2000
USA
0
1020
30
4050
1980 1990 2000
Europe
0
24
6
810
1980 1990 2000
Japan
05
101520253035
1980 1990 2000
Other Developed
01,0002,0003,0004,0005,0006,0007,000
1980 1990 2000
CIS and Other
010203040506070
1980 1990 2000
West Asia
05
1015202530
1980 1990 2000
E Asia High Income
048
12162024
1980 1990 2000
China
2468
10121416
1980 1990 2000
E Asia Middle Income
4
812
16
2024
1980 1990 2000
India
0102030405060
1980 1990 2000
South Asia
010203040506070
1980 1990 2000
E Asia Low Income
020406080
100120
1980 1990 2000
Central America
0400800
1,2001,6002,0002,400
1980 1990 2000
South America
020406080
100120
1980 1990 2000
Africa Middle Income
0100200
400500
700
1980 1990 2000
Africa Low Income
Bond rate
Actual (blue), Predicted (r ed)

DESA/DPAD GPM 3.0 User Guide Appendix A - F page A-F 30
Alphametrics Co., Ltd. October 2010
R$ Exchange reserves dlog(1/(1.5/(R$/(rx*Y(-1)))-1))
value probability unit root test Fisher ADF 226.3 0.000 coefficients coeff t-stat description log(rpr$) 0.647 (8.4) valuation ratio CA$/Y$(-1) 2.247 (4.6) current account CA$(-1)/Y$(-1) -1.454 (3.2) lagged c/a statistics value t-stat value t-stat constant 0.003 (0.3) residual ar(1) 0.647 (8.4) se 0.193 fixed effects CN 0.12030 SA 0.08627 JA 0.06533 IN 0.05876 EAM 0.03674 US 0.01610 EAH 0.01269 EAL 0.00567 OD -0.00436 AFM -0.00949 CI -0.01291 ACX -0.01503 WA -0.01654 EU -0.02244 AMM -0.08127 AFL -0.23984
30,000
50,000
70,000
90,000
110,000
1980 1990 2000
USA
300,000400,000
500,000600,000
700,000800,000
900,000
1980 1990 2000
Europe
0200,000400,000600,000800,000
1,000,0001,200,0001,400,0001,600,000
1980 1990 2000
Japan
20,00040,00060,00080,000
100,000120,000140,000160,000
1980 1990 2000
Other Developed
0100,000
200,000300,000
400,000500,000
600,000
1980 1990 2000
CIS and Other
0100,000200,000300,000400,000500,000600,000700,000
1980 1990 2000
West Asia
0
100,000200,000
300,000400,000500,000600,000
1980 1990 2000
E As ia High Income
0
500,000
1,000,000
1,500,000
2,000,000
2,500,000
1980 1990 2000
China
0
40,000
80,000
120,000
160,000
200,000
1980 1990 2000
E As ia Middle Income
0
50,000100,000
150,000200,000250,000300,000
1980 1990 2000
India
040,00080,000
120,000160,000200,000240,000280,000320,000
1980 1990 2000
South As ia
0
20,00040,000
60,00080,000
100,000120,000
1980 1990 2000
E Asia Low Income
0
40,000
80,000
120,000
160,000
1980 1990 2000
Central Americ a
050,000
100,000150,000200,000250,000300,000350,000
1980 1990 2000
South America
050,000
100,000150,000200,000250,000300,000350,000
1980 1990 2000
Africa Middle Income
0
20,00040,000
60,00080,000
100,000120,000
1980 1990 2000
Africa Low Incom e
Exchange reserves
Actual (blue), Predicted (red)

DESA/DPAD GPM 3.0 User Guide Appendix A - F page A-F 31
Alphametrics Co., Ltd. October 2010
rpr$ Reserve valuation log(rpr$)
value probability unit root test Fisher ADF 136.4 0.000 coefficients coeff t-stat description dlog(phw) -0.725 (6.9) global dollar inflation statistics value t-stat value t-stat constant 0.018 (1.5) residual ar(1) -0.725 (6.9) se 0.152
0.850.900.951.001.051.101.15
1980 1990 2000
USA
0.850.900.951.001.051.101.15
1980 1990 2000
Europe
0.880.920.961.001.041.081.12
1980 1990 2000
Japan
0.80.91.01.11.21.31.41.5
1980 1990 2000
Other Developed
0.81.21.62.02.42.83.2
1980 1990 2000
CIS and Other
0.7
0.8
0.91.0
1.1
1.2
1980 1990 2000
West Asia
0.81.01.21.41.61.82.02.2
1980 1990 2000
E Asia High Income
0.60.81.01.21.41.61.82.0
1980 1990 2000
China
0.800.850.900.951.001.051.10
1980 1990 2000
E Asia Middle Income
0.60.81.01.21.41.61.8
1980 1990 2000
India
0.81.01.21.41.61.82.02.2
1980 1990 2000
South Asia
0.80.91.01.11.21.31.41.5
1980 1990 2000
E Asia Low Income
0.60.8
1.2
1.6
2.0
1980 1990 2000
Central America
0.60.81.01.21.41.61.82.0
1980 1990 2000
South America
0.8
1.01.2
1.41.6
1.8
1980 1990 2000
Africa Middle Income
0.8
1.21.6
2.02.4
2.8
1980 1990 2000
Africa Low Income
Reserve valuation
Actual (blue), Predicted ( red)

DESA/DPAD GPM 3.0 User Guide Appendix A - F page A-F 32
Alphametrics Co., Ltd. October 2010
NXI$ Covered external position dlog(1/(3.5/(NXI$/(rx*Y(-1)))-1))
value probability unit root test Fisher ADF 214.9 0.000 coefficients coeff t-stat description dlog(Y(-1)) -0.338 (0.8) income growth log(Y(-1)) -0.019 (0.5) income level dlog(R$(-1)) -0.006 (0.2) increase in exchange reserves dlog(1+YR(-1)) -0.602 (0.7) relative income statistics value t-stat value t-stat constant 0.311 (0.5) residual ar(1) -0.338 (0.8) se 0.170 fixed effects US 0.09475 EU 0.09467 JA 0.04407 CI 0.03761 OD 0.01788 EAH 0.01722 EAM 0.00343 IN -0.00020 AMM -0.00421 AFM -0.00595 CN -0.01195 WA -0.03270 ACX -0.03672 EAL -0.06234 AFL -0.06711 SA -0.08844
0
4,000,000
8,000,000
12,000,000
16,000,000
20,000,000
1980 1990 2000
USA
0
10,000,000
20,000,000
30,000,000
40,000,000
50,000,000
1980 1990 2000
Europe
0
500,0001,000,0001,500,0002,000,0002,500,0003,000,000
1980 1990 2000
Japan
0
400,000800,000
1,200,0001,600,0002,000,0002,400,000
1980 1990 2000
Other Developed
0100,000200,000300,000400,000500,000600,000700,000800,000
1980 1990 2000
CIS and Other
50,000
100,000
150,000
200,000
250,000
300,000
1980 1990 2000
West Asia
0200,000400,000600,000800,000
1,000,0001,200,0001,400,000
1980 1990 2000
E Asia High Income
100,000200,000300,000400,000500,000600,000700,000800,000
1980 1990 2000
China
0
40,000
80,000
120,000
160,000
200,000
1980 1990 2000
E Asia Middle Incom e
020,000
40,00060,000
80,000100,000120,000
1980 1990 2000
India
6,0008,000
10,00012,000
14,00016,00018,000
1980 1990 2000
South Asia
30,00040,000
50,00060,000
70,00080,00090,000
1980 1990 2000
E Asia Low Income
40,000
80,000
120,000
160,000
200,000
1980 1990 2000
Central America
100,000200,000300,000400,000500,000600,000700,000800,000
1980 1990 2000
South America
050,000
100,000150,000200,000
250,000300,000
1980 1990 2000
Africa Middle Income
10,000
30,000
50,000
70,000
90,000
1980 1990 2000
Africa Low Income
Covered external position
Actual (blue), Predicted (red)

DESA/DPAD GPM 3.0 User Guide Appendix A - F page A-F 33
Alphametrics Co., Ltd. October 2010
rpaxou$ External asset valuation log(0.5+rpaxou$)
value probability unit root test Fisher ADF 200.8 0.000 coefficients coeff t-stat description dlog(phw) -0.308 (2.8) world dollar inflation statistics value t-stat value t-stat constant 0.401 (53.5) residual ar(1) -0.308 (2.8) se 0.150
0.850.90
1.00
1.10
1.20
1980 1990 2000
USA
0.800.84
0.92
1.00
1.08
1980 1990 2000
Europe
0.7
0.8
0.91.0
1.1
1.2
1980 1990 2000
Japan
0.750.800.850.900.951.001.051.10
1980 1990 2000
Other Developed
0
1
23
4
5
1980 1990 2000
CIS and Other
0.20.40.60.81.01.21.41.6
1980 1990 2000
West Asia
0.60.7
0.9
1.1
1.3
1980 1990 2000
E Asia High Income
0.70.80.91.01.11.21.31.4
1980 1990 2000
China
0.60.8
1.0
1.21.4
1.6
1980 1990 2000
E Asia Middle Income
0.40.60.81.01.21.41.6
1980 1990 2000
India
0.60.7
0.9
1.1
1.3
1980 1990 2000
South Asia
0.5
0.7
0.9
1.1
1.3
1980 1990 2000
E Asia Low Income
0.60.7
0.9
1.1
1.3
1980 1990 2000
Central America
0.60.70.80.91.01.11.2
1980 1990 2000
South America
0.50.6
0.8
1.0
1.2
1980 1990 2000
Africa Middle Income
0.00.20.40.60.81.01.21.4
1980 1990 2000
Africa Low Income
External asset valuation
Actual (blue), Predicted ( red)

DESA/DPAD GPM 3.0 User Guide Appendix A - F page A-F 34
Alphametrics Co., Ltd. October 2010
rplx$ External liability valuation log(rplx$)
value probability unit root test Fisher ADF 186.3 0.000 coefficients coeff t-stat description dlog(pkp) 0.288 (1.9) domestic asset inflation dlog(phw) -0.581 (4.7) world dollar inflation statistics value t-stat value t-stat constant 0.003 (0.3) residual ar(1) 0.288 (1.9) se 0.118
0.84
0.92
1.00
1.08
1.16
1980 1990 2000
USA
0.800.850.900.951.001.051.101.15
1980 1990 2000
Europe
0.6
0.8
1.0
1.2
1.4
1980 1990 2000
Japan
0.72
0.80
0.880.96
1.04
1.12
1980 1990 2000
Other Developed
0.4
0.8
1.21.6
2.0
2.4
1980 1990 2000
CIS and Other
0.80.91.01.11.21.31.41.5
1980 1990 2000
West Asia
0.850.90
1.00
1.10
1.20
1980 1990 2000
E Asia High Income
0.70.8
0.9
1.01.1
1.2
1980 1990 2000
China
0.80.9
1.0
1.11.2
1.3
1980 1990 2000
E Asia Middle Income
0.720.80
0.88
0.961.04
1.12
1980 1990 2000
India
0.60.70.80.91.01.11.2
1980 1990 2000
South Asia
0.5
0.7
0.9
1.1
1.3
1980 1990 2000
E Asia Low Income
0.7
0.80.9
1.01.1
1.2
1980 1990 2000
Central America
0.7
0.80.9
1.01.1
1.2
1980 1990 2000
South America
0.800.85
0.95
1.05
1.15
1980 1990 2000
Africa Middle Income
0.50.60.70.80.91.01.1
1980 1990 2000
Africa Low Income
External liability valuation
Actual (blue), Predicted ( red)

DESA/DPAD GPM 3.0 User Guide Appendix A - F page A-F 35
Alphametrics Co., Ltd. October 2010
rxu Real exchange rate log(rxu/rx(-1))
value probability unit root test Fisher ADF 174.0 0.000 coefficients coeff t-stat description log(rx(-1)) -0.564 (9.2) error correction CA$(-1)/(NXI$(-1)+M$(-1)) 0.300 current account NX$(-1)/(rx(-1)*Y(-1)) 0.100 external position d(spvi(-1)) 0.066 (3.9) inflation dlog(PHW) -0.477 (8.2) global dollar inflation statistics value t-stat value t-stat constant -0.287 (7.9) residual ar(1) -0.564 (9.2) se 0.072 fixed effects JA 0.37866 OD 0.32816 US 0.28732 EU 0.26364 EAH 0.11054 AMM 0.00531 ACX -0.01045 AFL -0.07717 WA -0.07853 EAM -0.09343 AFM -0.09660 EAL -0.14477 CI -0.15585 CN -0.19426 IN -0.23707 SA -0.28550
0.800.850.900.951.001.051.101.15
1980 1990 2000
USA
0.7
0.8
0.91.0
1.1
1.2
1980 1990 2000
Europe
0.80.9
1.1
1.3
1.5
1980 1990 2000
Japan
0.85
0.90
0.951.00
1.05
1.10
1980 1990 2000
Other Developed
.2
.3
.4
.5
.6
.7
.8
.9
1980 1990 2000
CIS and Other
.45
.50
.60
.70
.80
1980 1990 2000
West Asia
.550
.575
.625
.675
.725
1980 1990 2000
E Asia High Income
0.3
0.5
0.7
0.9
1.1
1980 1990 2000
China
.40
.44
.48
.52
.56
.60
.64
1980 1990 2000
E Asia Middle Income
.30
.35
.40
.45
.50
.55
.60
1980 1990 2000
India
.32
.36
.40
.44
.48
.52
.56
1980 1990 2000
South Asia
.25
.30
.40
.50
.60
1980 1990 2000
E Asia Low Income
.32
.40
.48
.56
.64
1980 1990 2000
Central America
.40
.45
.50
.55
.60
.65
.70
.75
1980 1990 2000
South America
.40
.44
.48
.52
.56
.60
1980 1990 2000
Africa Middle Income
0.30.40.50.60.70.80.91.0
1980 1990 2000
Africa Low Income
Real exchange rate
Actual (blue), Predicted ( red)

DESA/DPAD GPM 3.0 User Guide Appendix A - F page A-F 36
Alphametrics Co., Ltd. October 2010
pvi Cost inflation dlog(0.20+pvi/100)
value probability unit root test Fisher ADF 164.2 0.000 coefficients coeff t-stat description log(0.20+pvi(-1)/100) -0.153 (3.1) error correction (1/(1.60-V/VT)+1/(1.60-V(-1)/VT(-1... 0.167 (2.8) capacity utilisation dlog(rx) -0.196 (2.5) real exchange rate dlog(pew/rx) 0.050 world oil price intercepts and ar(1) estimated on data for 1996-2008 statistics value t-stat value t-stat constant -0.761 (192.9) residual ar(1) 0.045 (0.7) se 0.198 fixed effects EAL 0.05600 WA 0.04923 SA 0.03113 EAM 0.00794 AFM 0.00696 OD 0.00363 EU 0.00107 AFL 0.00105 ACX -0.00229 AMM -0.00592 US -0.00649 IN -0.00958 EAH -0.02704 JA -0.03307 CN -0.03471 CI -0.03792
1
3
5
7
9
1980 1990 2000
USA
05
10
2025
35
1980 1990 2000
Europe
-3
-1
1
3
5
1980 1990 2000
Japan
048
1216202428
1980 1990 2000
Other Developed
-1,0000
1,000
3,0004,000
6,000
1980 1990 2000
CIS and Other
101520
3035
45
1980 1990 2000
West Asia
-4048
121620
1980 1990 2000
E Asia High Income
-4
04
8
1216
1980 1990 2000
China
-4-20
46
10
1980 1990 2000
E Asia Middle Income
2468
10121416
1980 1990 2000
India
05
10
2025
35
1980 1990 2000
South Asia
0
1020
30
4050
1980 1990 2000
E Asia Low Income
020406080
100120
1980 1990 2000
Central America
0
400800
1,200
1,6002,000
1980 1990 2000
South America
020406080
100120
1980 1990 2000
Africa Middle Income
0200400600800
1,0001,200
1980 1990 2000
Africa Low Income
Cost inflation
Actual (blue), Predicted (r ed)

DESA/DPAD GPM 3.0 User Guide Appendix A - F page A-F 37
Alphametrics Co., Ltd. October 2010
BITU$ Net income and transfers (BITU$-BIT$(-1))/Y$(-1)
value probability unit root test Fisher ADF 249.8 0.000 coefficients coeff t-stat description BIT$(-1)/Y$(-1) -0.057 (1.5) error correction im_us*NX$(-1)/(100*Y$(-1)) -0.006 (0.2) external position d(NX$)/Y$(-1) 0.004 (0.8) change in external position statistics value t-stat value t-stat constant -0.001 (2.5) residual ar(1) -0.057 (1.5) se 0.007 fixed effects JA 0.00248 SA 0.00171 IN 0.00114 EAH 0.00097 CN 0.00092 WA 0.00089 US 0.00085 EU 0.00056 ACX -0.00002 AFM -0.00014 AFL -0.00103 OD -0.00129 EAL -0.00132 AMM -0.00178 EAM -0.00184 CI -0.00209
-40,000-20,000
020,00040,00060,00080,000
100,000120,000
1980 1990 2000
USA
-80,000-60,000-40,000-20,000
020,00040,00060,000
1980 1990 2000
Europe
-20,0000
20,00040,00060,00080,000
100,000120,000140,000
1980 1990 2000
Japan
-60,000
-50,000
-40,000
-30,000
-20,000
-10,000
1980 1990 2000
Other Developed
-60,000-50,000-40,000-30,000-20,000-10,000
010,000
1980 1990 2000
CIS and Other
-20,000
-10,000
0
10,000
20,000
30,000
1980 1990 2000
West Asia
-8,000
-4,000
0
4,000
8,000
12,000
1980 1990 2000
E As ia High Income
-20,000
-10,0000
10,00020,00030,00040,000
1980 1990 2000
China
-14,000-12,000-10,000-8,000-6,000-4,000-2,000
0
1980 1990 2000
E As ia Middle Income
-4,000
0
4,000
8,000
12,000
16,000
1980 1990 2000
India
-2,0000
2,0004,0006,0008,000
10,00012,000
1980 1990 2000
South As ia
-16,000
-12,000-8,000
-4,0000
4,0008,000
1980 1990 2000
E Asia Low Income
-16,000
-12,000
-8,000
-4,000
0
4,000
1980 1990 2000
Central Americ a
-70,000-60,000-50,000-40,000-30,000-20,000-10,000
0
1980 1990 2000
South America
-25,000-20,000-15,000-10,000-5,000
05,000
10,000
1980 1990 2000
Africa Middle Income
-16,000
-12,000-8,000
-4,0000
4,0008,000
1980 1990 2000
Africa Low Incom e
Net income and tr ansfers
Actual (blue), Predicted (red)

DESA/DPAD GPM 3.0 User Guide Appendix A - F page A-F 38
Alphametrics Co., Ltd. October 2010
NITU$ Covered income and transfers log((1+NITU$)/(1+NIT$(-1)))
value probability unit root test Fisher ADF 212.1 0.000 coefficients coeff t-stat description log(1+NIT$(-1)) -0.154 (4.8) error correction log(NXN$(-1)) 0.085 (2.7) covered position dlog(XW$) 0.857 (3.5) growth of world exports statistics value t-stat value t-stat constant 0.476 (1.4) residual ar(1) -0.154 (4.8) se 0.428 fixed effects EU 0.25460 US 0.15630 WA 0.07649 EAH 0.07136 OD 0.04861 ACX 0.03310 CN 0.03261 JA 0.00177 AFL -0.00533 EAL -0.02026 AFM -0.02935 AMM -0.04011 EAM -0.04037 IN -0.04420 SA -0.14261 CI -0.35262
0100,000200,000300,000400,000500,000600,000700,000800,000
1980 1990 2000
USA
0
500,000
1,000,000
1,500,000
2,000,000
2,500,000
1980 1990 2000
Europe
0
40,000
80,000
120,000
160,000
1980 1990 2000
Japan
20,00040,000
60,00080,000
100,000120,000
140,000
1980 1990 2000
Other Developed
0
20,000
40,000
60,000
80,000
100,000
1980 1990 2000
CIS and Other
20,000
30,000
40,000
50,000
60,000
70,000
1980 1990 2000
West Asia
0
40,000
80,000
120,000
160,000
200,000
1980 1990 2000
E As ia High Income
010,00020,00030,00040,00050,00060,00070,000
1980 1990 2000
China
0
4,0008,000
12,00016,00020,00024,000
1980 1990 2000
E As ia Middle Income
0
5,00010,000
15,00020,00025,00030,000
1980 1990 2000
India
0
2,0004,000
6,0008,000
10,00012,000
1980 1990 2000
South As ia
0
4,0008,000
12,00016,00020,00024,000
1980 1990 2000
E Asia Low Income
4,000
12,000
20,000
28,000
36,000
1980 1990 2000
Central Americ a
0
10,00020,000
30,00040,000
50,00060,000
1980 1990 2000
South America
8,000
12,000
16,000
20,000
24,000
28,000
1980 1990 2000
Africa Middle Income
6,0008,000
10,00012,00014,00016,00018,00020,00022,000
1980 1990 2000
Africa Low Incom e
Covered income and transfers
Actual (blue), Predicted (red)

DESA/DPAD GPM 3.0 User Guide Appendix A - F page A-F 39
Alphametrics Co., Ltd. October 2010
BAU0 Net exports of primary commodities at base-year prices (BAU0-BA0(-1))/V(-1)
value probability unit root test Fisher ADF 281.0 0.000 coefficients coeff t-stat description d(lpa(-1)) 0.003 (1.3) world prices d(V)/V(-1) -0.050 GDP growth statistics value t-stat value t-stat constant 0.002 (25.3) residual ar(1) 0.003 (1.3) se 0.003 fixed effects CN 0.00202 EAM 0.00139 IN 0.00097 OD 0.00064 AMM 0.00033 EAL 0.00030 EAH 0.00020 SA -0.00003 CI -0.00009 US -0.00052 AFL -0.00065 ACX -0.00075 EU -0.00082 WA -0.00089 AFM -0.00094 JA -0.00115
-20,000-10,000
010,00020,00030,00040,00050,000
1980 1990 2000
USA
-55,000-50,000-45,000-40,000-35,000-30,000-25,000-20,000-15,000
1980 1990 2000
Europe
-70,000
-60,000-50,000
-40,000
-30,000-20,000
-10,000
1980 1990 2000
Japan
20,00030,00040,00050,00060,00070,00080,00090,000
1980 1990 2000
Other Dev eloped
-40,000
-30,000-20,000
-10,000
010,000
20,000
1980 1990 2000
CIS and Other
-40,000
-30,000
-20,000
-10,000
0
10,000
1980 1990 2000
West Asia
-40,000-35,000-30,000-25,000-20,000-15,000-10,000-5,000
0
1980 1990 2000
E Asia High Income
-120,000-100,000-80,000-60,000-40,000-20,000
020,000
1980 1990 2000
China
4,0008,000
12,00016,000
20,000
24,00028,000
1980 1990 2000
E Asia Midd le Income
-4,000-2,000
02,0004,0006,0008,000
10,00012,000
1980 1990 2000
Ind ia
-7,000-6,000-5,000-4,000-3,000-2,000-1,000
01,000
1980 1990 2000
South Asia
05,000
10,00015,000
20,000
25,00030,000
1980 1990 2000
E Asia Low Income
-4,000-2,000
02,0004,0006,0008,000
10,00012,000
1980 1990 2000
Central America
10,000
30,000
50,000
70,000
90,000
1980 1990 2000
South America
-20,000
-15,000-10,000
-5,0000
5,00010,000
1980 1990 2000
Africa Middle Income
-4,000-2,000
02,0004,0006,0008,000
10,000
1980 1990 2000
Afric a Low Income
Net expor ts of primar y commodities at base-year prices
Actual (blue) , Predicted (red)

DESA/DPAD GPM 3.0 User Guide Appendix A - F page A-F 40
Alphametrics Co., Ltd. October 2010
XA0 Exports of primary commodities at base-year prices d(XA0)/V(-1)
value probability unit root test Fisher ADF 281.8 0.000 coefficients coeff t-stat description d(if(BAU0>0,BAU0,0))/V(-1) 0.860 (25.4) net export surplus (if any) statistics value t-stat value t-stat constant 0.000 (4.2) residual ar(1) 0.860 (25.4) se 0.001
40,000
60,000
80,000
100,000
120,000
140,000
1980 1990 2000
USA
80,000
160,000
240,000
320,000
400,000
1980 1990 2000
Europe
0
4,000
8,000
12,000
16,000
20,000
1980 1990 2000
Japan
20,00040,000
60,00080,000
100,000120,000
140,000
1980 1990 2000
Other Developed
0
10,000
20,000
30,000
40,000
50,000
1980 1990 2000
CIS and Other
05,000
10,00015,000
20,00025,000
30,000
1980 1990 2000
West Asia
4,000
8,00012,000
16,00020,00024,00028,000
1980 1990 2000
E As ia High Income
05,000
10,00015,00020,00025,00030,00035,000
1980 1990 2000
China
5,00010,00015,00020,00025,00030,00035,00040,00045,000
1980 1990 2000
E As ia Middle Income
0
4,0008,000
12,00016,00020,00024,000
1980 1990 2000
India
1,000
2,0003,000
4,0005,0006,0007,000
1980 1990 2000
South As ia
0
10,000
20,000
30,000
40,000
50,000
1980 1990 2000
E Asia Low Income
10,00015,00020,00025,00030,00035,00040,00045,000
1980 1990 2000
Central Americ a
020,00040,00060,00080,000
100,000120,000140,000
1980 1990 2000
South America
4,000
8,00012,000
16,00020,000
24,00028,000
1980 1990 2000
Africa Middle Income
4,0006,0008,000
10,00012,00014,00016,00018,00020,000
1980 1990 2000
Africa Low Incom e
Exports of primar y commodities at base-year prices
Actual ( blue), Predic ted (red)

DESA/DPAD GPM 3.0 User Guide Appendix A - F page A-F 41
Alphametrics Co., Ltd. October 2010
MA$ Imports of primary commodities dlog(MA$/MA0)
value probability unit root test Fisher ADF 228.1 0.000 coefficients coeff t-stat description dlog(paw) 0.833 (23.7) world prices dlog(rx/pp0) 0.370 (9.6) exchange rate statistics value t-stat value t-stat constant -0.008 (2.6) residual ar(1) 0.833 (23.7) se 0.078
40,00060,000
80,000100,000
120,000140,000
160,000
1980 1990 2000
USA
200,000
300,000
400,000
500,000
600,000
700,000
1980 1990 2000
Europe
40,00050,000
60,00070,000
80,00090,000
100,000
1980 1990 2000
Japan
10,000
20,000
30,000
40,000
50,000
60,000
1980 1990 2000
Other Developed
020,000
40,00060,000
80,000100,000
120,000
1980 1990 2000
CIS and Other
10,00020,000
30,00040,000
50,00060,000
70,000
1980 1990 2000
West Asia
20,00030,00040,00050,00060,00070,00080,00090,000
100,000
1980 1990 2000
E As ia High Income
0
40,000
80,000
120,000
160,000
200,000
1980 1990 2000
China
4,000
8,00012,000
16,00020,00024,00028,000
1980 1990 2000
E As ia Middle Income
05,000
10,00015,00020,00025,00030,00035,000
1980 1990 2000
India
2,000
4,0006,000
8,00010,00012,00014,000
1980 1990 2000
South As ia
05,000
10,00015,00020,00025,00030,00035,000
1980 1990 2000
E Asia Low Income
0
10,00020,000
30,00040,000
50,00060,000
1980 1990 2000
Central Americ a
0
10,000
20,000
30,000
40,000
50,000
1980 1990 2000
South America
12,00016,00020,00024,00028,00032,00036,00040,000
1980 1990 2000
Africa Middle Income
04,0008,000
12,00016,00020,00024,00028,000
1980 1990 2000
Africa Low Incom e
Imports of primary commodities
Actual (blue), Predicted (red)

DESA/DPAD GPM 3.0 User Guide Appendix A - F page A-F 42
Alphametrics Co., Ltd. October 2010
XAU$ Exports of primary commodities log(XAU$*XA0(-1)/(XA0*XA$(-1)))
value probability unit root test Fisher ADF 246.6 0.000 coefficients coeff t-stat description dlog(paw) 0.923 (37.3) world prices dlog(rx/pp0) 0.518 (13.0) exchange rate statistics value t-stat value t-stat constant -0.014 (5.9) residual ar(1) 0.923 (37.3) se 0.096
60,00080,000
100,000120,000
140,000160,000
180,000
1980 1990 2000
USA
150,000200,000250,000300,000350,000400,000450,000500,000550,000
1980 1990 2000
Europe
4,0005,0006,0007,0008,0009,000
10,00011,00012,000
1980 1990 2000
Japan
40,00060,000
80,000100,000
120,000140,000
160,000
1980 1990 2000
Other Developed
10,00020,00030,00040,00050,00060,00070,00080,00090,000
1980 1990 2000
CIS and Other
5,00010,00015,00020,00025,00030,00035,00040,000
1980 1990 2000
West Asia
12,000
16,00020,000
24,00028,00032,00036,000
1980 1990 2000
E As ia High Income
0
10,000
20,000
30,000
40,000
1980 1990 2000
China
10,000
20,000
30,000
40,000
50,000
60,000
1980 1990 2000
E As ia Middle Income
04,0008,000
12,00016,00020,00024,00028,000
1980 1990 2000
India
2,0003,0004,0005,0006,0007,0008,0009,000
1980 1990 2000
South As ia
0
10,00020,000
30,00040,00050,00060,000
1980 1990 2000
E Asia Low Income
20,00025,00030,00035,00040,00045,00050,00055,000
1980 1990 2000
Central Americ a
20,00040,00060,00080,000
100,000120,000140,000160,000180,000
1980 1990 2000
South America
5,000
10,00015,000
20,00025,000
30,00035,000
1980 1990 2000
Africa Middle Income
10,00015,00020,00025,00030,00035,00040,00045,000
1980 1990 2000
Africa Low Incom e
Exports of primary commodities
Actual (blue), Predicted (red)

DESA/DPAD GPM 3.0 User Guide Appendix A - F page A-F 43
Alphametrics Co., Ltd. October 2010
ME0 Imports of energy products at base-year prices dlog(ME0/EM)
value probability unit root test Fisher ADF 345.8 0.000 coefficients coeff t-stat description log(ME0(-1)/EM(-1)) -0.222 (3.8) error correction statistics value t-stat value t-stat constant 1.290 (3.9) residual ar(1) -0.222 (3.8) se 0.168 fixed effects ACX 0.06282 EAL 0.03588 OD 0.02757 SA 0.02537 US 0.02513 CN 0.01335 EAM 0.01014 EU 0.00519 AMM 0.00397 EAH 0.00124 IN -0.00746 AFM -0.02087 CI -0.03053 AFL -0.04106 WA -0.04902 JA -0.06170
50,000100,000
150,000200,000
250,000300,000
350,000
1980 1990 2000
USA
240,000280,000320,000360,000400,000440,000480,000520,000560,000
1980 1990 2000
Europe
60,00070,00080,00090,000
100,000110,000120,000130,000
1980 1990 2000
Japan
10,00020,000
30,00040,000
50,00060,000
70,000
1980 1990 2000
Other Developed
010,00020,00030,00040,00050,00060,00070,00080,000
1980 1990 2000
CIS and Other
0
10,000
20,000
30,000
40,000
50,000
1980 1990 2000
West Asia
0
40,000
80,000
120,000
160,000
200,000
1980 1990 2000
E As ia High Income
0
20,000
40,000
60,000
80,000
100,000
1980 1990 2000
China
4,0008,000
12,00016,00020,00024,00028,00032,00036,000
1980 1990 2000
E As ia Middle Income
010,00020,00030,00040,00050,00060,00070,000
1980 1990 2000
India
2,000
4,0006,000
8,00010,00012,00014,000
1980 1990 2000
South As ia
5,000
10,00015,000
20,00025,00030,00035,000
1980 1990 2000
E Asia Low Income
10,000
15,00020,000
25,00030,000
35,00040,000
1980 1990 2000
Central Americ a
10,000
15,00020,000
25,00030,000
35,00040,000
1980 1990 2000
South America
04,0008,000
12,00016,00020,00024,00028,000
1980 1990 2000
Africa Middle Income
4,000
6,000
8,000
10,000
12,000
1980 1990 2000
Africa Low Incom e
Imports of energy products at base-year prices
Actual (blue), Predicted (red)
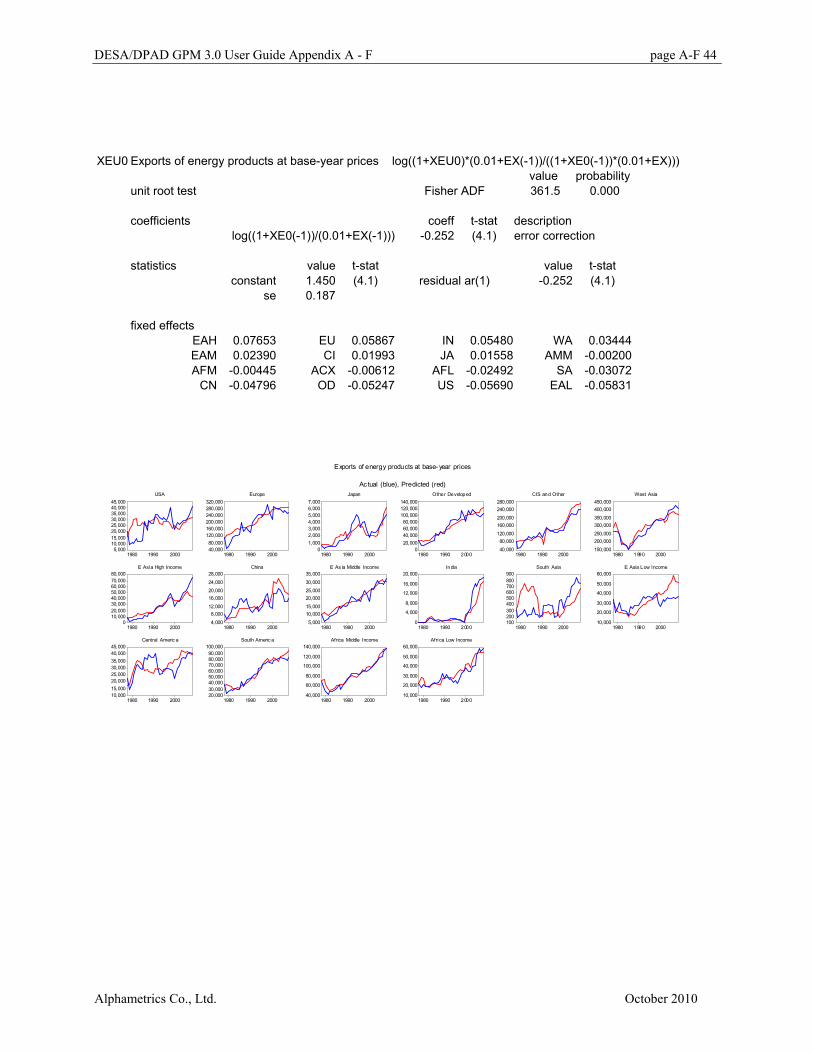
DESA/DPAD GPM 3.0 User Guide Appendix A - F page A-F 44
Alphametrics Co., Ltd. October 2010
XEU0 Exports of energy products at base-year prices log((1+XEU0)*(0.01+EX(-1))/((1+XE0(-1))*(0.01+EX)))
value probability unit root test Fisher ADF 361.5 0.000 coefficients coeff t-stat description log((1+XE0(-1))/(0.01+EX(-1))) -0.252 (4.1) error correction statistics value t-stat value t-stat constant 1.450 (4.1) residual ar(1) -0.252 (4.1) se 0.187 fixed effects EAH 0.07653 EU 0.05867 IN 0.05480 WA 0.03444 EAM 0.02390 CI 0.01993 JA 0.01558 AMM -0.00200 AFM -0.00445 ACX -0.00612 AFL -0.02492 SA -0.03072 CN -0.04796 OD -0.05247 US -0.05690 EAL -0.05831
5,00010,00015,00020,00025,00030,00035,00040,00045,000
1980 1990 2000
USA
40,00080,000
120,000160,000200,000240,000280,000320,000
1980 1990 2000
Europe
01,0002,0003,0004,0005,0006,0007,000
1980 1990 2000
Japan
020,00040,00060,00080,000
100,000120,000140,000
1980 1990 2000
Other Developed
40,00080,000
120,000
160,000200,000
240,000280,000
1980 1990 2000
CIS and Other
150,000200,000250,000
300,000350,000
400,000450,000
1980 1990 2000
West Asia
010,00020,00030,00040,00050,00060,00070,00080,000
1980 1990 2000
E Asia High Income
4,000
8,00012,000
16,00020,00024,000
28,000
1980 1990 2000
China
5,000
10,00015,000
20,00025,00030,000
35,000
1980 1990 2000
E As ia Middle Income
0
4,000
8,000
12,000
16,000
20,000
1980 1990 2000
India
100200300400500600700800900
1980 1990 2000
South Asia
10,000
20,000
30,000
40,000
50,000
60,000
1980 1990 2000
E Asia Low Income
10,00015,00020,00025,00030,00035,00040,00045,000
1980 1990 2000
Central Americ a
20,00030,00040,00050,00060,00070,00080,00090,000
100,000
1980 1990 2000
South Americ a
40,000
60,000
80,000
100,000
120,000
140,000
1980 1990 2000
Africa Middle Income
10,000
20,000
30,000
40,000
50,000
60,000
1980 1990 2000
Africa Low Income
Exports of energy products at base- year prices
Actual (blue), Predicted (red)

DESA/DPAD GPM 3.0 User Guide Appendix A - F page A-F 45
Alphametrics Co., Ltd. October 2010
ME$ Imports of energy products dlog(ME$/ME0)
value probability unit root test Fisher ADF 239.7 0.000 coefficients coeff t-stat description dlog(pew) 0.960 (66.3) world prices statistics value t-stat value t-stat constant -0.006 (1.3) residual ar(1) 0.960 (66.3) se 0.079
0100,000
200,000300,000
400,000500,000
600,000
1980 1990 2000
USA
100,000200,000300,000400,000500,000600,000700,000800,000
1980 1990 2000
Europe
0
40,000
80,000
120,000
160,000
200,000
1980 1990 2000
Japan
020,000
40,00060,000
80,000100,000
120,000
1980 1990 2000
Other Developed
0
20,000
40,000
60,000
80,000
1980 1990 2000
CIS and Other
010,000
20,00030,000
40,00050,000
60,000
1980 1990 2000
West Asia
040,00080,000
120,000160,000200,000240,000280,000320,000
1980 1990 2000
E As ia High Income
020,00040,00060,00080,000
100,000120,000140,000
1980 1990 2000
China
0
10,000
20,000
30,000
40,000
50,000
1980 1990 2000
E As ia Middle Income
0
40,000
80,000
120,000
160,000
200,000
1980 1990 2000
India
2,0004,0006,0008,000
10,00012,00014,00016,00018,000
1980 1990 2000
South As ia
0
10,00020,000
30,00040,00050,00060,000
1980 1990 2000
E Asia Low Income
0
10,00020,000
30,00040,000
50,00060,000
1980 1990 2000
Central Americ a
010,00020,00030,00040,00050,00060,00070,000
1980 1990 2000
South America
05,000
10,00015,00020,00025,00030,00035,00040,000
1980 1990 2000
Africa Middle Income
2,0004,0006,0008,000
10,00012,00014,00016,00018,000
1980 1990 2000
Africa Low Incom e
Imports of energy products
Actual (blue), Predicted (red)

DESA/DPAD GPM 3.0 User Guide Appendix A - F page A-F 46
Alphametrics Co., Ltd. October 2010
XEU$ Exports of energy products log(((0.01+XEU$)/(0.01+XE0))/((0.01+XE$(-1))/(0.01+XE0(-1))))
value probability unit root test Fisher ADF 265.0 0.000 coefficients coeff t-stat description dlog(pew) 1.059 (32.7) world prices statistics value t-stat value t-stat constant -0.016 (2.3) residual ar(1) 1.059 (32.7) se 0.089
010,000
20,00030,000
40,00050,000
60,000
1980 1990 2000
USA
50,000100,000150,000200,000250,000300,000350,000400,000
1980 1990 2000
Europe
01,0002,0003,0004,0005,0006,0007,000
1980 1990 2000
Japan
020,00040,00060,00080,000
100,000120,000140,000160,000
1980 1990 2000
Other Developed
40,000
120,000
200,000
280,000
360,000
440,000
1980 1990 2000
CIS and Other
0100,000200,000300,000400,000500,000600,000700,000
1980 1990 2000
West Asia
0
20,00040,000
60,00080,000
100,000120,000
1980 1990 2000
E As ia High Income
0
4,0008,000
12,00016,00020,00024,000
1980 1990 2000
China
0
10,000
20,000
30,000
40,000
50,000
1980 1990 2000
E As ia Middle Income
0
5,00010,000
15,00020,00025,00030,000
1980 1990 2000
India
0
200400
600800
1,0001,200
1980 1990 2000
South As ia
0
10,00020,000
30,00040,00050,00060,000
1980 1990 2000
E Asia Low Income
0
10,00020,000
30,00040,000
50,00060,000
1980 1990 2000
Central Americ a
020,00040,00060,00080,000
100,000120,000140,000
1980 1990 2000
South America
0
40,000
80,000
120,000
160,000
200,000
1980 1990 2000
Africa Middle Income
020,00040,00060,00080,000
100,000120,000140,000
1980 1990 2000
Africa Low Incom e
Exports of energy products
Actual (blue), Predicted (red)
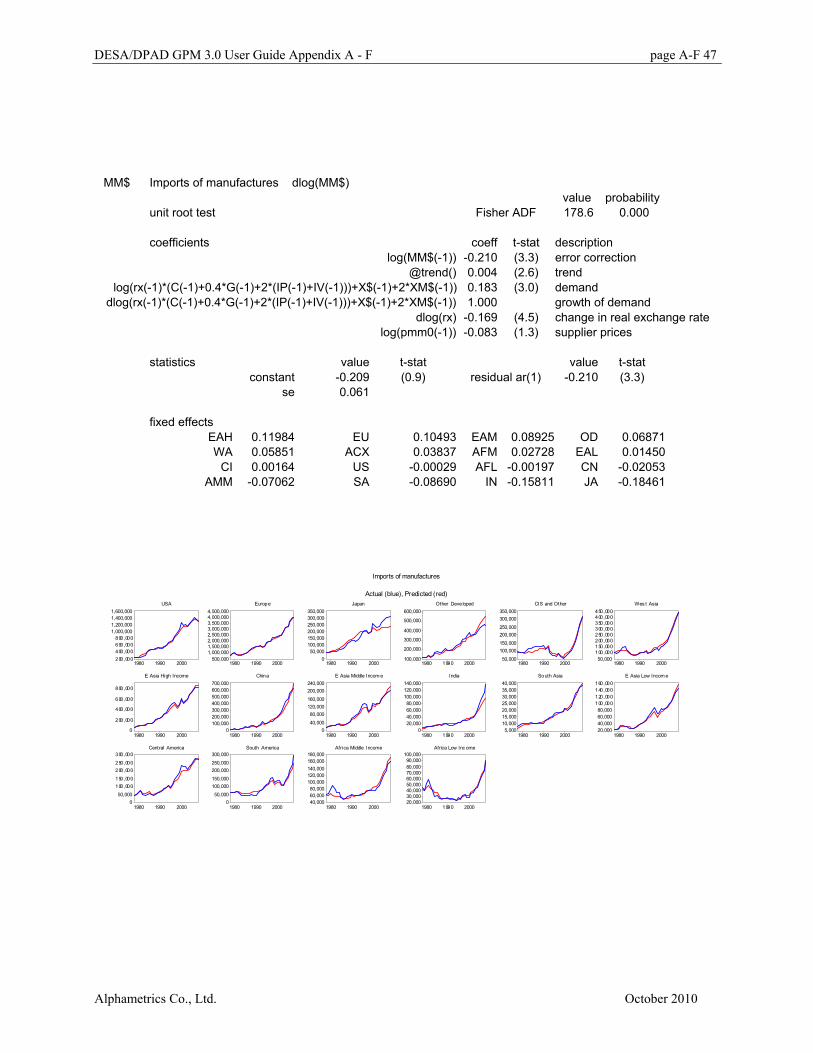
DESA/DPAD GPM 3.0 User Guide Appendix A - F page A-F 47
Alphametrics Co., Ltd. October 2010
MM$ Imports of manufactures dlog(MM$)
value probability unit root test Fisher ADF 178.6 0.000 coefficients coeff t-stat description log(MM$(-1)) -0.210 (3.3) error correction @trend() 0.004 (2.6) trend
log(rx(-1)*(C(-1)+0.4*G(-1)+2*(IP(-1)+IV(-1)))+X$(-1)+2*XM$(-1)) 0.183 (3.0) demand dlog(rx(-1)*(C(-1)+0.4*G(-1)+2*(IP(-1)+IV(-1)))+X$(-1)+2*XM$(-1)) 1.000 growth of demand
dlog(rx) -0.169 (4.5) change in real exchange rate log(pmm0(-1)) -0.083 (1.3) supplier prices statistics value t-stat value t-stat constant -0.209 (0.9) residual ar(1) -0.210 (3.3) se 0.061 fixed effects EAH 0.11984 EU 0.10493 EAM 0.08925 OD 0.06871 WA 0.05851 ACX 0.03837 AFM 0.02728 EAL 0.01450 CI 0.00164 US -0.00029 AFL -0.00197 CN -0.02053 AMM -0.07062 SA -0.08690 IN -0.15811 JA -0.18461
200,000400,000600,000800,000
1,000,0001,200,0001,400,0001,600,000
1980 1990 2000
USA
500,0001,000,0001,500,0002,000,0002,500,0003,000,0003,500,0004,000,0004,500,000
1980 1990 2000
Europe
050,000
100,000150,000200,000250,000300,000350,000
1980 1990 2000
Japan
100,000
200,000
300,000
400,000
500,000
600,000
1980 1990 2000
Other Developed
50,000
100,000150,000
200,000250,000
300,000350,000
1980 1990 2000
CIS and Other
50,000100,000150,000200,000250,000300,000350,000400,000450,000
1980 1990 2000
Wes t Asia
0
200,000
400,000
600,000
800,000
1980 1990 2000
E Asia High Income
0100,000200,000300,000400,000500,000600,000700,000
1980 1990 2000
China
040,000
80,000120,000160,000
200,000240,000
1980 1990 2000
E Asia Middle Incom e
020,00040,00060,00080,000
100,000120,000140,000
1980 1990 2000
India
5,00010,00015,00020,00025,00030,00035,00040,000
1980 1990 2000
South Asia
20,00040,00060,00080,000
100,000120,000140,000160,000
1980 1990 2000
E Asia Low Incom e
050,000
100,000150,000
200,000250,000
300,000
1980 1990 2000
Central America
050,000
100,000150,000
200,000250,000
300,000
1980 1990 2000
South America
40,00060,00080,000
100,000120,000140,000160,000180,000
1980 1990 2000
Africa Middle Income
20,00030,00040,00050,00060,00070,00080,00090,000
100,000
1980 1990 2000
Africa Low Inc ome
Imports of manufactures
Actual (blue), Predicted (red)

DESA/DPAD GPM 3.0 User Guide Appendix A - F page A-F 48
Alphametrics Co., Ltd. October 2010
MMU0 Imports of manufactures at base-year prices log((MMU0*pmm0/MM$)/(MM0(-1)*pmm0(-1)/MM$(-1)))
value probability unit root test Fisher ADF 263.2 0.000 coefficients coeff t-stat description log(MM0(-1)*pmm0(-1)/MM$(-1)) -0.160 (5.3) error correction dlog(pmm0) 0.105 (2.4) supplier price change dlog(rx) -0.253 (10.4) exchange rate appreciation statistics value t-stat value t-stat constant 0.001 (1.2) residual ar(1) -0.160 (5.3) se 0.070 fixed effects SA 0.01348 AFM 0.01254 EAL 0.01127 EAM 0.00567 CN 0.00487 WA 0.00456 OD 0.00297 EU 0.00287 ACX 0.00285 AMM -0.00161 EAH -0.00365 JA -0.00540 US -0.00603 AFL -0.00689 IN -0.01362 CI -0.02389
0200,000400,000600,000800,000
1,000,0001,200,0001,400,0001,600,000
1980 1990 2000
USA
500,0001,000,0001,500,0002,000,0002,500,0003,000,0003,500,0004,000,000
1980 1990 2000
Europe
050,000
100,000150,000200,000250,000300,000350,000
1980 1990 2000
Japan
0
100,000
200,000
300,000
400,000
500,000
1980 1990 2000
Other Developed
0
50,000100,000
150,000200,000
250,000300,000
1980 1990 2000
CIS and Other
50,000100,000150,000200,000250,000300,000350,000400,000450,000
1980 1990 2000
Wes t Asia
0
200,000
400,000
600,000
800,000
1980 1990 2000
E Asia High Income
0100,000200,000300,000400,000500,000600,000700,000
1980 1990 2000
China
040,000
80,000120,000160,000
200,000240,000
1980 1990 2000
E Asia Middle Incom e
0
40,000
80,000
120,000
160,000
200,000
1980 1990 2000
India
0
10,000
20,000
30,000
40,000
50,000
1980 1990 2000
South Asia
20,00040,00060,00080,000
100,000120,000140,000160,000
1980 1990 2000
E Asia Low Incom e
050,000
100,000150,000200,000250,000300,000350,000
1980 1990 2000
Central America
050,000
100,000150,000
200,000250,000
300,000
1980 1990 2000
South America
40,00060,00080,000
100,000120,000140,000160,000180,000
1980 1990 2000
Africa Middle Income
20,00030,00040,00050,00060,00070,00080,00090,000
1980 1990 2000
Africa Low Inc ome
Imports of manufactur es at base-year prices
Actual (bl ue), Pr edicted ( red)

DESA/DPAD GPM 3.0 User Guide Appendix A - F page A-F 49
Alphametrics Co., Ltd. October 2010
sxm Manufactured export market shares dlog(sxm)
value probability unit root test Fisher ADF 1125.5 0.000 coefficients coeff t-stat description log(sxm(-1)) -0.076 (4.4) error correction log(ucx$(-1)) -0.211 (6.5) unit cost dlog(ucx$(-1)) -0.035 (0.9) increase in unit cost statistics value t-stat value t-stat constant -0.145 (3.9) residual ar(1) -0.076 (4.4) se 0.153 fixed effects EAH_CN 0.14153 US_ACX 0.10682 EU_EU 0.10472 US_OD 0.09713 EU_CI 0.09549 EU_AFM 0.08197 EAH_EAL 0.08173 EAH_EAM 0.07254 CN_EAH 0.07223 EAH_JA 0.06903 EU_WA 0.06168 EU_AFL 0.04682 CN_JA 0.04489 US_AMM 0.04305 EU_IN 0.04261 EAH_IN 0.03941
CN_SA 0.03738 AMM_AM
M 0.03704 EAH_EAH 0.02746 EAH_SA 0.02488 JA_EAM 0.02379 EU_AMM 0.01849 CN_CI 0.01666 JA_EAH 0.01471 EU_US 0.01314 CN_AFL 0.01040 CN_EAL 0.01031 WA_WA 0.00725 OD_US 0.00618 EU_SA 0.00573 US_JA 0.00489 EAH_US 0.00017 JA_EAL -0.00009 JA_CN -0.00136 IN_SA -0.00258 EU_OD -0.00591 EAM_EAL -0.01071 AFM_AFL -0.01202 EU_JA -0.01232 JA_US -0.01280 US_EAH -0.01550 ACX_US -0.01594 WA_SA -0.01941 CN_EAM -0.02271 WA_AFL -0.02334 EU_EAH -0.02599 EU_EAM -0.02668 EU_ACX -0.02708 US_EAM -0.02798 EAM_EAH -0.02854 EU_CN -0.02936 US_IN -0.02952 EAH_AMM -0.02961 WA_CI -0.03020 CN_WA -0.03548 EAH_WA -0.03583 CN_AFM -0.03629 WA_AFM -0.03684 EAM_SA -0.03712 EAH_OD -0.03857 US_CN -0.04068 EAH_ACX -0.04396 AFL_AFL -0.04458 WA_IN -0.04473 EU_EAL -0.04736 US_WA -0.04736 US_AFM -0.04948 EAM_JA -0.05004 EAH_AFM -0.05132 JA_SA -0.05265 CN_OD -0.05453 JA_OD -0.05611 EAM_EAM -0.05834 US_EAL -0.05851 US_EU -0.06316 US_AFL -0.06755
Notes: 1) coefficients are estimated using a subset of bilateral market shares in order to eliminate the impact of large proportionate changes of very small shares. The subset is indicated by source_destination pairs for which fixed effects are listed. The selection criterion is that the base-year (2005) market share should have been 5% or more and the share should not have been less than 0.1% in any previous year. 2) Values of statistics and fixed effects shown above are those estimated for the full estimation period. For the purposes of scenario simulations intercepts are estimated for all bilateral market shares using the more recent data sample. 3) See graphs of actual and predicted values on the next page.

DESA/DPAD GPM 3.0 User Guide Appendix A - F page A-F 50
Alphametrics Co., Ltd. October 2010
.20
.22
.24
.26
.28
.30
.32
.34
1980 1990 2000
EU_US
.08
.12
.16
.20
.24
.28
.32
1980 1990 2000
JA_US
.14
.16
.18
.20
.22
.24
.26
1980 1990 2000
OD_ US
.09
.10
.12
.14
.16
.18
1980 1 99 0 2 00 0
EAH_US
.00
.02
.04
.06
.08
.10
.12
.14
1980 1990 2000
ACX_US
.05
.06
.07
.08
.09
.10
1980 1990 2000
US_EU
.70
.72
.74
.76
.78
.80
.82
1980 1990 2000
EU_ EU
.12
.16
.20
.24
.28
.32
1980 1990 2000
US_JA
.14
.15
.17
.19
.21
.23
1980 1990 2000
EU_JA
.28
.30
.32
.34
.36
.38
.40
1980 1990 2000
EAH_JA
.00
.05
.10
.15
.20
.25
.30
1980 1 99 0 2 00 0
CN_ JA
.01
.02
.03
.04
.05
.06
.07
1980 1990 2000
EAM_JA
.48
.50
.52
.54
.56
.58
.60
.62
.64
1980 1990 2000
US_OD
.16
.17
.18
.19
.20
.21
.22
.23
1980 1990 2000
EU_OD
.05
.06
.07
.08
.09
.10
.11
.12
.13
1980 1990 2000
JA_OD
.03
.04
.05
.06
.07
.08
1980 1990 2000
EAH_OD
.00
.02
.04
.06
.08
.10
1980 1990 2000
CN_OD
.60
.64
.68
.72
.76
.80
.84
.88
1980 1 99 0 2 00 0
EU_CI
.00
.01
.02
.03
.04
.05
.06
.07
.08
1980 1990 2000
WA_CI
.00
.04
.08
.12
.16
.20
1980 1990 2000
CN_CI
.04
.06
.08
.10
.12
.14
.16
.18
1980 1990 2000
US_WA
.38
.40
.42
.44
.46
.48
.50
.52
.54
1980 1990 2000
EU_WA
.02
.04
.06
.08
.10
.12
.14
.16
.18
1980 1990 2000
WA_ WA
.03
.04
.05
.06
.07
.08
.09
.10
.11
1980 1990 2000
EAH_WA
.00
.02
.04
.06
.08
.10
.12
1980 1 99 0 2 00 0
CN_WA
.08
.10
.12
.14
.16
.18
.20
.22
1980 1990 2000
US_EAH
.12
.13
.14
.15
.16
.17
.18
.19
1980 1990 2000
EU_EAH
.10
.15
.20
.25
.30
.35
.40
.45
1980 1990 2000
JA_ EAH
.06
.08
.10
.12
.14
.16
.18
1980 1990 2000
EAH_EAH
.04
.08
.12
.16
.20
.24
.28
.32
1980 1990 2000
CN_EAH
.01
.02
.03
.04
.05
.06
.07
.08
1980 1990 2000
EAM_EAH
.02
.04
.06
.08
.10
.12
1980 1 99 0 2 00 0
US_CN
.10
.15
.20
.25
.30
.35
.40
1980 1990 2000
EU_CN
.12
.16
.24
.32
.40
.48
1980 1990 2000
JA_CN
.0
.1
.2
.3
.4
.5
.6
.7
1980 1990 2000
EAH_CN
.06
.08
.10
.12
.14
.16
.18
.20
.22
1980 1990 2000
US_EAM
.12
.14
.16
.18
.20
.22
.24
.26
1980 1990 2000
EU_EAM
.150
.175
.200
.225
.250
.275
.300
.325
.350
1980 1990 2000
JA_EAM
.16
.20
.24
.28
.32
.36
.40
1980 1 99 0 2 00 0
EAH_EAM
.00
.02
.04
.06
.08
.10
.12
.14
.16
1980 1990 2000
CN_EAM
.00
.01
.02
.03
.04
.05
.06
.07
1980 1990 2000
EAM_EAM
.08
.10
.12
.14
.16
.18
.20
1980 1990 2000
US_IN
.25
.30
.35
.40
.45
.50
.55
1980 1990 2000
EU_IN
.01
.02
.03
.04
.05
.06
.07
.08
.09
1980 1990 2000
WA_IN
.00
.04
.08
.12
.16
.20
1980 1990 2000
EAH_IN
.16
.20
.24
.28
.32
.36
.40
1980 1 99 0 2 00 0
EU_SA
.04
.08
.12
.16
.20
.24
1980 1990 2000
JA_SA
.00
.02
.04
.06
.08
.10
.12
.14
1980 1990 2000
WA_SA
.050
.075
.100
.125
.150
.175
.200
.225
.250
1980 1990 2000
EAH_ SA
.00
.04
.08
.12
.16
.20
.24
.28
1980 1990 2000
CN_SA
.00
.01
.02
.03
.04
.05
.06
.07
1980 1990 2000
EAM_ SA
.00
.02
.04
.06
.08
.10
.12
1980 1990 2000
IN_SA
.04
.06
.08
.10
.12
.14
.16
1980 1 99 0 2 00 0
US_EAL
.08
.10
.12
.14
.16
.18
.20
.22
.24
1980 1990 2000
EU_EAL
.08
.12
.16
.20
.24
.28
.32
1980 1990 2000
JA_EAL
.24
.28
.32
.36
.40
.44
1980 1990 2000
EAH_EAL
.00
.04
.08
.12
.16
.20
.24
1980 1990 2000
CN_EAL
.00
.02
.04
.06
.08
.10
.12
1980 1990 2000
EAM_EAL
.40
.45
.50
.55
.60
.65
.70
1980 1990 2000
US_ ACX
.100
.125
.150
.175
.200
.225
.250
.275
.300
1980 1 99 0 2 00 0
EU_ACX
.01
.02
.03
.04
.05
.06
.07
1980 1990 2000
EAH_ACX
.20
.24
.28
.32
.36
.40
1980 1990 2000
US_AMM
.20
.22
.24
.26
.28
.30
.32
.34
.36
1980 1990 2000
EU_ AMM
.01
.02
.03
.04
.05
.06
.07
.08
1980 1990 2000
EAH_AMM
.08
.10
.12
.14
.16
.18
.20
.22
.24
1980 1990 2000
AMM_AMM
.06
.07
.08
.09
.10
.11
.12
.13
1980 1990 2000
US_ AFM
.48
.52
.56
.60
.64
.68
.72
.76
1980 1 99 0 2 00 0
EU_AFM
.00
.01
.02
.03
.04
.05
.06
.07
1980 1990 2000
WA_AFM
.02
.03
.04
.05
.06
.07
.08
.09
1980 1990 2000
EAH_AFM
.00
.02
.04
.06
.08
.10
.12
.14
1980 1990 2000
CN_AFM
.050
.055
.060
.065
.070
.075
.080
.085
1980 1990 2000
US_AFL
.28
.36
.44
.52
.60
.68
1980 1990 2000
EU_AFL
.00
.02
.04
.06
.08
.10
.12
.14
1980 1990 2000
WA_AFL
.00
.04
.08
.12
.16
.20
1980 1 99 0 2 00 0
CN_AFL
.06
.08
.10
.12
.14
.16
.18
1980 1990 2000
AFM_AFL
.02
.03
.04
.05
.06
.07
.08
1980 1990 2000
AFL_AFL
Manufactured export market shares
Actual (blue), Predicted (red)
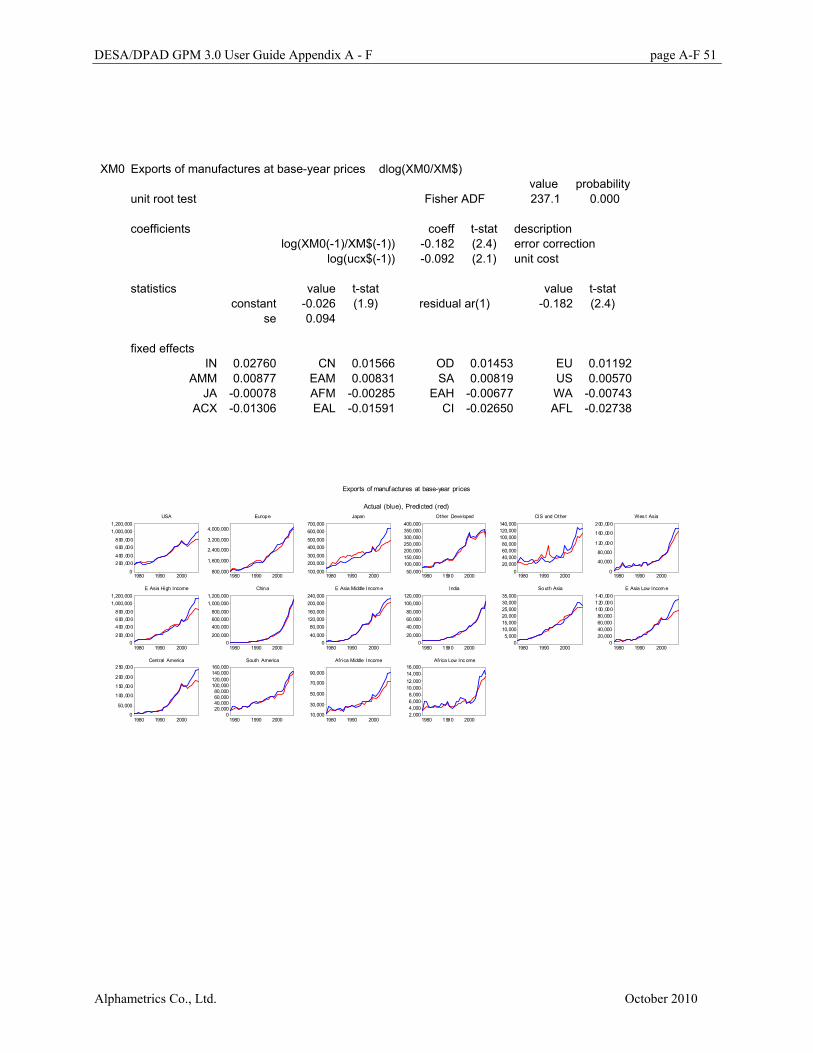
DESA/DPAD GPM 3.0 User Guide Appendix A - F page A-F 51
Alphametrics Co., Ltd. October 2010
XM0 Exports of manufactures at base-year prices dlog(XM0/XM$)
value probability unit root test Fisher ADF 237.1 0.000 coefficients coeff t-stat description log(XM0(-1)/XM$(-1)) -0.182 (2.4) error correction log(ucx$(-1)) -0.092 (2.1) unit cost statistics value t-stat value t-stat constant -0.026 (1.9) residual ar(1) -0.182 (2.4) se 0.094 fixed effects IN 0.02760 CN 0.01566 OD 0.01453 EU 0.01192 AMM 0.00877 EAM 0.00831 SA 0.00819 US 0.00570 JA -0.00078 AFM -0.00285 EAH -0.00677 WA -0.00743 ACX -0.01306 EAL -0.01591 CI -0.02650 AFL -0.02738
0
200,000400,000
600,000800,000
1,000,0001,200,000
1980 1990 2000
USA
800,000
1,600,000
2,400,000
3,200,000
4,000,000
1980 1990 2000
Europe
100,000
200,000300,000
400,000500,000
600,000700,000
1980 1990 2000
Japan
50,000100,000150,000200,000250,000300,000350,000400,000
1980 1990 2000
Other Developed
020,00040,00060,00080,000
100,000120,000140,000
1980 1990 2000
CIS and Other
0
40,000
80,000
120,000
160,000
200,000
1980 1990 2000
Wes t Asia
0200,000
400,000600,000800,000
1,000,0001,200,000
1980 1990 2000
E Asia High Income
0200,000
400,000600,000800,000
1,000,0001,200,000
1980 1990 2000
China
040,000
80,000120,000160,000
200,000240,000
1980 1990 2000
E Asia Middle Incom e
020,000
40,00060,00080,000
100,000120,000
1980 1990 2000
India
05,000
10,00015,00020,00025,00030,00035,000
1980 1990 2000
South Asia
020,00040,00060,00080,000
100,000120,000140,000
1980 1990 2000
E Asia Low Incom e
0
50,000
100,000
150,000
200,000
250,000
1980 1990 2000
Central America
020,00040,00060,00080,000
100,000120,000140,000160,000
1980 1990 2000
South America
10,000
30,000
50,000
70,000
90,000
1980 1990 2000
Africa Middle Income
2,0004,0006,0008,000
10,00012,00014,00016,000
1980 1990 2000
Africa Low Inc ome
Exports of manufactures at base-year prices
Actual (blue), Predicted (red)

DESA/DPAD GPM 3.0 User Guide Appendix A - F page A-F 52
Alphametrics Co., Ltd. October 2010
BSU$ Net exports of services (BSU$-BS$(-1))/V(-1)
value probability unit root test Fisher ADF 210.6 0.000 coefficients coeff t-stat description dlog(rx) -0.002 (1.4) real exchange rate appreciation
d(BA$)/V(-1) 0.047 (1.7) increase in net exports of raw materials
d(BE$)/V(-1) -0.054 (3.3) increase in net exports of energy
d(BM$)/V(-1) 0.089 (6.1) increase in net exports of manufactures
statistics value t-stat value t-stat constant -0.000 (0.3) residual ar(1) -0.002 (1.4) se 0.003
-40,000-20,000
020,00040,00060,00080,000
100,000120,000
1980 1990 2000
USA
20,00040,00060,00080,000
100,000120,000140,000160,000
1980 1990 2000
Europe
-70,000-60,000-50,000-40,000-30,000-20,000-10,000
010,000
1980 1990 2000
Japan
-30,000-25,000
-20,000-15,000
-10,000-5,000
0
1980 1990 2000
Other Developed
-40,000-30,000
-20,000-10,000
010,000
20,000
1980 1990 2000
CIS and Other
-80,000-70,000-60,000-50,000-40,000-30,000-20,000-10,000
1980 1990 2000
West Asia
4,0008,000
12,00016,00020,00024,00028,00032,000
1980 1990 2000
E As ia High Income
-20,000-10,000
010,00020,00030,00040,00050,000
1980 1990 2000
China
-16,000
-12,000
-8,000
-4,000
0
4,000
1980 1990 2000
E As ia Middle Income
-5,0000
5,00010,00015,00020,00025,00030,00035,000
1980 1990 2000
India
-8,000
-6,000
-4,000
-2,000
0
1980 1990 2000
South As ia
-20,000
-16,000
-12,000
-8,000
-4,000
0
1980 1990 2000
E Asia Low Income
-8,000-6,000-4,000-2,000
02,0004,0006,000
1980 1990 2000
Central Americ a
-40,000-35,000-30,000-25,000-20,000-15,000-10,000-5,000
1980 1990 2000
South America
-20,000
-16,000-12,000
-8,000-4,000
04,000
1980 1990 2000
Africa Middle Income
-30,000
-25,000
-20,000
-15,000
-10,000
-5,000
1980 1990 2000
Africa Low Incom e
Net exports of services
Actual (blue), Predicted (red)

DESA/DPAD GPM 3.0 User Guide Appendix A - F page A-F 53
Alphametrics Co., Ltd. October 2010
MS$ Imports of services d(MS$)/V(-1)
value probability unit root test Fisher ADF 189.8 0.000 coefficients coeff t-stat description d(if(BSU$>0,0,-BSU$))/V(-1) 0.683 (22.7) net imports (if positive) dlog(rx) 0.002 (2.0) real exchange rate appreciation d(MA$)/V(-1) 0.094 (1.7) increase in imports of raw materials d(XE$)/V(-1) 0.042 (3.3) increase in exports of energy d(MM$)/V(-1) 0.127 (13.3) increase in imports of manufactures statistics value t-stat value t-stat constant 0.000 (5.0) residual ar(1) 0.683 (22.7) se 0.002
50,000100,000150,000200,000250,000300,000350,000400,000
1980 1990 2000
USA
200,000400,000600,000800,000
1,000,0001,200,0001,400,0001,600,000
1980 1990 2000
Europe
40,00060,000
80,000100,000
120,000140,000
160,000
1980 1990 2000
Japan
20,00040,00060,00080,000
100,000120,000140,000160,000
1980 1990 2000
Other Developed
20,000
40,000
60,000
80,000
100,000
120,000
1980 1990 2000
CIS and Other
40,00060,00080,000
100,000120,000140,000160,000180,000
1980 1990 2000
West Asia
0
40,00080,000
120,000160,000200,000240,000
1980 1990 2000
E As ia High Income
020,00040,00060,00080,000
100,000120,000140,000160,000
1980 1990 2000
China
010,00020,00030,00040,00050,00060,00070,00080,000
1980 1990 2000
E As ia Middle Income
0
10,000
20,000
30,000
40,000
50,000
1980 1990 2000
India
2,0004,0006,0008,000
10,00012,00014,00016,00018,000
1980 1990 2000
South As ia
5,00010,00015,00020,00025,00030,00035,00040,00045,000
1980 1990 2000
E Asia Low Income
10,000
20,00030,000
40,00050,000
60,00070,000
1980 1990 2000
Central Americ a
20,000
40,000
60,000
80,000
100,000
1980 1990 2000
South America
10,000
20,00030,000
40,00050,000
60,00070,000
1980 1990 2000
Africa Middle Income
10,00015,00020,00025,00030,00035,00040,00045,00050,000
1980 1990 2000
Africa Low Incom e
Imports of services
Actual (blue), Predicted (red)

DESA/DPAD GPM 3.0 User Guide Appendix A - F page A-F 54
Alphametrics Co., Ltd. October 2010
MSU0 Imports of services at base-year prices log(MSU0*MS$(-1)/(MS$*MS0(-1)))
value probability unit root test Fisher ADF 245.1 0.000 coefficients coeff t-stat description log(MS0(-1)/MS$(-1)) -0.033 (1.0) error correction dlog(rx) -0.382 (8.2) exchange rate appreciation statistics value t-stat value t-stat constant -0.000 (0.1) residual ar(1) -0.033 (1.0) se 0.080 fixed effects IN 0.01236 AMM 0.00615 OD 0.00585 EU 0.00555 ACX 0.00420 EAH 0.00367 US 0.00365 AFM 0.00075 EAM -0.00050 SA -0.00058 JA -0.00187 WA -0.00475 CN -0.00736 CI -0.00827 EAL -0.00879 AFL -0.01007
40,000
120,000
200,000
280,000
360,000
1980 1990 2000
USA
200,000400,000
600,000800,000
1,000,0001,200,000
1,400,000
1980 1990 2000
Europe
20,00040,00060,00080,000
100,000120,000140,000160,000
1980 1990 2000
Japan
20,00040,00060,00080,000
100,000120,000140,000160,000
1980 1990 2000
Other Developed
020,000
40,00060,000
80,000100,000
120,000
1980 1990 2000
CIS and Other
40,00060,000
80,000100,000
120,000140,000
160,000
1980 1990 2000
West Asia
0
40,00080,000
120,000160,000200,000240,000
1980 1990 2000
E As ia High Income
020,00040,00060,00080,000
100,000120,000140,000160,000
1980 1990 2000
China
010,00020,00030,00040,00050,00060,00070,00080,000
1980 1990 2000
E As ia Middle Income
0
10,00020,000
30,00040,00050,00060,000
1980 1990 2000
India
0
4,000
8,000
12,000
16,000
20,000
1980 1990 2000
South As ia
5,00010,00015,00020,00025,00030,00035,00040,00045,000
1980 1990 2000
E Asia Low Income
12,000
20,000
28,000
36,000
44,000
1980 1990 2000
Central Americ a
10,000
30,000
50,000
70,000
90,000
1980 1990 2000
South America
10,000
20,00030,000
40,00050,000
60,00070,000
1980 1990 2000
Africa Middle Income
10,00015,00020,00025,00030,00035,00040,00045,000
1980 1990 2000
Africa Low Incom e
Imports of services at base-year prices
Actual (blue), Predicted (red)

DESA/DPAD GPM 3.0 User Guide Appendix A - F page A-F 55
Alphametrics Co., Ltd. October 2010
XS0 Exports of services at base-year prices dlog(XS0/XS$)
value probability unit root test Fisher ADF 247.2 0.000 coefficients coeff t-stat description log(XS0(-1)/XS$(-1)) -0.028 (1.3) error correction dlog(rx) -0.564 (12.0) exchange rate appreciation statistics value t-stat value t-stat constant -0.005 (1.0) residual ar(1) -0.028 (1.3) se 0.100 fixed effects JA 0.01656 EAH 0.01356 US 0.01346 EU 0.01272 ACX 0.00748 OD 0.00641 IN 0.00290 SA 0.00270 AMM 0.00054 EAM -0.00311 AFM -0.00441 CI -0.00724 AFL -0.00817 EAL -0.01255 WA -0.01996 CN -0.02088
0100,000
200,000300,000
400,000500,000
600,000
1980 1990 2000
USA
200,000400,000600,000800,000
1,000,0001,200,0001,400,0001,600,000
1980 1990 2000
Europe
020,00040,00060,00080,000
100,000120,000140,000
1980 1990 2000
Japan
20,00040,000
60,00080,000
100,000120,000
140,000
1980 1990 2000
Other Developed
10,00020,000
30,00040,000
50,00060,000
70,000
1980 1990 2000
CIS and Other
10,00020,00030,00040,00050,00060,00070,00080,00090,000
1980 1990 2000
West Asia
0
50,000100,000
150,000200,000250,000300,000
1980 1990 2000
E As ia High Income
020,00040,00060,00080,000
100,000120,000140,000
1980 1990 2000
China
0
10,00020,000
30,00040,00050,00060,000
1980 1990 2000
E As ia Middle Income
0
20,000
40,000
60,000
80,000
1980 1990 2000
India
1,0002,0003,0004,0005,0006,0007,0008,000
1980 1990 2000
South As ia
05,000
10,00015,00020,00025,00030,00035,000
1980 1990 2000
E Asia Low Income
12,000
20,000
28,000
36,000
44,000
1980 1990 2000
Central Americ a
0
10,00020,000
30,00040,000
50,00060,000
1980 1990 2000
South America
0
10,00020,000
30,00040,000
50,00060,000
1980 1990 2000
Africa Middle Income
2,0004,0006,0008,000
10,00012,00014,00016,000
1980 1990 2000
Africa Low Incom e
Exports of servi ces at base-year pr ices
Actual (blue), Predicted (red)

DESA/DPAD GPM 3.0 User Guide Appendix A - F page A-F 56
Alphametrics Co., Ltd. October 2010
ED Primary energy demand dlog(ED/N)
value probability unit root test Fisher ADF 244.4 0.000 coefficients coeff t-stat description log(ED(-1)/N(-1)) -0.033 (4.2) error correction dlog(V/N) 0.430 (7.3) per capita GDP growth d(lped) -0.038 (4.2) change in world oil price dlog(tt) 0.102 (0.9) terms of trade change dlog(X0) 0.057 (1.8) export growth IV/V(-1) -0.123 (0.8) inventory change log(1+YR(-1)) 0.092 (4.1) per capita income statistics value t-stat value t-stat constant -0.047 (2.6) residual ar(1) -0.033 (4.2) se 0.042 fixed effects CI 0.04411 EAM 0.03853 WA 0.02822 CN 0.02793 AFM 0.02472 IN 0.01421 AFL 0.01132 SA 0.00846 EAL 0.00360 AMM -0.00340 ACX -0.00598 EAH -0.01463 OD -0.02358 EU -0.04465 US -0.05316 JA -0.05568
2,0002,200
2,4002,600
2,800
3,0003,200
1980 1990 2000
USA
1,800
1,900
2,000
2,100
2,200
2,300
1980 1990 2000
Europe
320360
400440
480
520560
1980 1990 2000
Japan
360400440480520560600640680
1980 1990 2000
O ther Developed
1,3001,400
1,600
1,800
2,000
2,200
1980 1990 2000
CIS and Other
200300
500
700
900
1,100
1980 1990 2000
West Asia
80120
200
280
360
440
1980 1990 2000
E Asia High Income
500750
1,0001,2501,5001,7502,0002,2502,500
1980 1990 2000
China
4080
120160200240280320
1980 1990 2000
E As ia Middle Income
100200300400500600700800
1980 1990 2000
India
20406080
100120140160180
1980 1990 2000
South Asia
100
150200250
300350
400
1980 1990 2000
E Asia Low Income
120
160200
240
280320
360
1980 1990 2000
Central America
280
360
440
520
600
680
1980 1990 2000
South Am erica
100
200
300
400
500
600
1980 1990 2000
Africa Middle Income
100
150200
250
300350
400
1980 1990 2000
Africa Low Income
Primary energy demand
Actual (blue), Predicted (red)

DESA/DPAD GPM 3.0 User Guide Appendix A - F page A-F 57
Alphametrics Co., Ltd. October 2010
EP Primary energy production dlog(EP)
value probability unit root test Fisher ADF 221.7 0.000 coefficients coeff t-stat description dlog(ED)*if(ED(-1)>EP(-1),1,ED(-1)... 1.001 (30.2) domestic demand d(lpep) 0.016 (2.0) change in world oil price statistics value t-stat value t-stat constant 0.000 (0.1) residual ar(1) 1.001 (30.2) se 0.035 fixed effects OD 0.01552 EAL 0.00776 AFM 0.00746 AMM 0.00738 CI 0.00597 ACX 0.00541 JA 0.00443 AFL 0.00172 EU 0.00048 SA -0.00079 EAM -0.00294 US -0.00395 IN -0.00406 CN -0.00435 WA -0.00784 EAH -0.03220
1,7001,8001,9002,0002,1002,2002,3002,400
1980 1990 2000
USA
1,1601,200
1,280
1,360
1,440
1,520
1980 1990 2000
Europe
3040
5060
708090
1980 1990 2000
Japan
300400500600700800900
1,0001,100
1980 1990 2000
O ther Developed
1,600
1,800
2,000
2,200
2,400
2,600
1980 1990 2000
CIS and Other
600800
1,0001,2001,4001,6001,8002,000
1980 1990 2000
West Asia
2024283236404448
1980 1990 2000
E Asia High Income
400
800
1,200
1,600
2,000
2,400
1980 1990 2000
China
4080
120160200240280320
1980 1990 2000
E As ia Middle Income
100
200
300
400
500
600
1980 1990 2000
India
20406080
100120140160
1980 1990 2000
South Asia
160
240
320
400
480
560
1980 1990 2000
E Asia Low Income
100
150200
250
300350
400
1980 1990 2000
Central America
300
400500
600
700800
900
1980 1990 2000
South Am erica
300400500600700800900
1,000
1980 1990 2000
Africa Middle Income
200250300350400450500550
1980 1990 2000
Africa Low Income
Primary energy production
Actual (blue), Predicted (red)

DESA/DPAD GPM 3.0 User Guide Appendix A - F page A-F 58
Alphametrics Co., Ltd. October 2010
EM Primary energy imports dlog(0.01+EM-if(ED>EP,ED-EP,0))
value probability unit root test Fisher ADF 229.0 0.000 coefficients coeff t-stat description log(0.01+EM(-1)-if(ED(-1)>EP(-1),E... -0.027 (1.8) error correction dlog(EPW) 0.469 (1.3) growth of world production statistics value t-stat value t-stat constant 0.137 (2.6) residual ar(1) -0.027 (1.8) se 0.325 fixed effects IN 0.09739 CN 0.05524 EU 0.04529 CI 0.03207 WA 0.01711 EAH 0.01232 EAM 0.00416 OD -0.00081 US -0.00101 AFM -0.01534 AMM -0.01642 JA -0.01954 ACX -0.01963 EAL -0.02094 AFL -0.03398 SA -0.13591
200300400500600700800900
1980 1990 2000
USA
9001,0001,100
1,3001,400
1,600
1980 1990 2000
Europe
280
320360
400
440480
1980 1990 2000
Japan
406080
100120140160
1980 1990 2000
Other Developed
04080
120160200240
1980 1990 2000
CIS and Other
204060
100120
160
1980 1990 2000
West Asia
0
100200
300
400500
1980 1990 2000
E Asia High Income
050
100150200250300
1980 1990 2000
China
10
30
50
70
90
1980 1990 2000
E Asia Middle Income
04080
120160200240280
1980 1990 2000
India
5101520253035
1980 1990 2000
South Asia
20304050607080
1980 1990 2000
E Asia Low Income
30405060708090
1980 1990 2000
Central America
405060
8090
110
1980 1990 2000
South America
20
3040
50
6070
1980 1990 2000
Africa Middle Income
1620242832364044
1980 1990 2000
Africa Low Income
Primar y energ y imports
Actual (blue), Predicted (r ed)

DESA/DPAD GPM 3.0 User Guide Appendix A - F page A-F 59
Alphametrics Co., Ltd. October 2010
Appendix E Scenario rules Introduction
Each GPM scenario is defined by a number of rules superimposed on the baseline projection. The rules may specify shocks representing, for example, shifts in confidence of consumers or investors, as well as policy changes in individual blocs or coordinated changes in groups of blocs.
A scenario is defined and calculated by an EViews program named solxx.prg where xx is the scenario identifier.4 Scenario rules are defined by calls to GPM library routines: e.g.
call Target("G_EU","@pc(V_EU)","3.5",150,100)
This appendix explains the different types of rule available, the ways in which rules may be qualified and multiple instruments linked together, and methods for testing new rules and determining the effectiveness of instruments relative to targets. Practical examples of shocks and policy rules are provided in each section.
Types of rule
Exogenous adjustments to behavioural variables
The simplest modification to the baseline is to fix (exogenize) a behavioural variable or shock its predicted values.
Rule type Purpose Arguments
Fix(%Var,"level",%Val) Impose values of a behavioural variable
%Var behavioural variable %Val value or list of values
Fix(%Var,"growth",%Val) Impose the growth path of a behavioural variable
%Var behavioural variable %Val p.a. % growth rate or list of growth rates
Fix(%Var, "exog", %Val) Impose values of an exogenous variable
%Var exogenous variable %Val value or list of values
Shock(%Var,"add",%Val) Additive adjustment of predicted values of a behavioural variable
%Var behavioural variable %Val amount or amounts to be added to the predicted value of the variable
Shock(%Var,"mult",%Val) Multiplicative adjustment of predicted values of a behavioural variable
%Var behavioural variable %Val ratio or list of ratios (0 leaves the predicted value unchanged)
Arguments %Var is the name of a behavioural variable (with bloc suffix) enclosed in quotes.
4 In EViews the scenario identifier or 'alias' is suffixed to the names of series storing results of the simulation. For example, Europe's trade balance in scenario 1 is named TB$_EU_1.
DESA/DPAD GPM 3.0 User Guide Appendix A - F page A-F 60
Alphametrics Co., Ltd. October 2010
Example: "G_EU" government expenditure in Europe
%Val is a single value or list of values, also enclosed in quotes. If a list of values is provided, an asterisk may be inserted at any position in the list to indicate that remaining values are to be repeated up to the horizon (end of the simulation period).
Examples: "3.5" fixed value "3.5 4 5 5.5 5 4 3" sequence of values "3.5 *4" repeating value
Example rules call Fix("G_EU", "level", "3000000 3200000 *3500000")
fixes government expenditure in Europe at $3 tr. in the first year, 3.2 tr. in the second year and 3.5 tr. thereafter. call Fix("G_JA", "growth","3 *3.5 4 2.5 2")
fixes annual growth of government expenditure in Japan at 3% in the first year with a four-year cyclical pattern thereafter. call Fix("wln_US", "exog", "0.05 0.10 0.07 0.03")
sets the assumed rate of loan write-offs in the US to 5% in the first year, 10% in year 2 and declining values thereafter. call Shock("is_US", "add", "-1 0 1 *2)
reduces the predicted value of the US policy rate in the first year, leaves it unchanged in the second year, increases it by 1% in the third year and by 2% from year 4 onwards. call Shock("IP_US", "mult", "-0.02 -0.01 0 *0.01)
reduces US fixed investment by 2% in the first year and 1% in the second year, leaves the predicted value unchanged in the third year and increases it by 1% from year 4 onwards.
Note that in the case of shocks, adjustments are applied to values predicted by the behavioural equation for the variable. Feedbacks such as multiplier effects may cause differences with respect to baseline values to be greater or less than those implied by the shock itself .
Endogenous adjustment of behavioural variables
Rules described in the table below override standard behaviour represented by equations in the baseline model. The rules adjust the value of a behavioural variable (the instrument) in order to modify the outcome for a target variable or expression (the object). The adjustment is made by setting values of an instrument variable that acts as an intercept shift in the behavioural equation.5 In effect standard behaviour is overridden and the extent of the departure from standard behaviour is determined by the value of the instrument variable. If the instrument value is small the rule has implied only a minor departure from standard behaviour. If it is large, the rule has implied a major difference in behaviour.
5 The instrumental variable is denoted by suffix _ins (e.g. is_EAH_ins). Historical values and baseline values of instrumental variables are zero.

DESA/DPAD GPM 3.0 User Guide Appendix A - F page A-F 61
Alphametrics Co., Ltd. October 2010
If a rule implies large departures from standard behaviour or is not feasible within the terms of the model, the EViews solution may fail to converge or crash with a numerical error. Before setting up new rules it is advisable to consider carefully whether
- the chosen instrument will have sufficient influence on the object
- target values for the object make sense and are feasible.
A ‘Target’ rule requires the target-instrument association to be effective and will always fail if the association is not effective (see below for further discussion of this issue). A ‘Try’ rule does not require the target-instrument association to be effective but may still present difficulties if the implied modification to standard behaviour is too large.
Rule type Purpose Arguments
Try(%Var,%Obj, %Val,sens,pct)
Attempt to meet a target by adjusting an instrument (the attempt may not succeed). The instrument is adjusted in proportion to the difference between the target value and prior-year value of the object.
Target(%Var,%Obj, %Val,sens,pct)
Adjust an instrument to ensure that a target variable or expression meets a target. The target must be satisfied.6
%Var behavioural variable that can be modified by policy %Obj target variable or expression %Val target value or list of values sens sensitivity of the target to a change in the instrument pct percentage movement towards the target
Arguments
%Var is the name of a behavioural variable, with bloc suffix, enclosed in quotes. Values of this variable are adjusted by changing the value of an instrument with the same name and suffix _ins.
%Obj is the name of a target variable or a target expression such as a growth rate or ratio. The expression may include EViews functions such as
@pc( ) percentage growth rate
d( ) difference (change from previous year)
log( ) logarithm
dlog( ) log difference
exp( ) exponential
Examples: @pc(V_AMM) growth of GDP in South America
100*IP_US/V_US US investment as % of GDP
dlog(YN_CN) log growth rate of income per capita in China
6 If the target is not feasible, the EViews solution program will not converge or will crash with a numerical error as one or more variables go out of bounds.

DESA/DPAD GPM 3.0 User Guide Appendix A - F page A-F 62
Alphametrics Co., Ltd. October 2010
%Val is a single value or list of values, also enclosed in quotes (same as in preceding section).
sens is a number giving the approximate sensitivity of the object variable or expression to a change in the _ins instrument variable that is used to perturb the value of the behavioural variable specified by %Var. If this argument is set to 0, the GPM program computes a shock simulation to estimate the value. See below for further discussion of how to set the value of this argument.
pct indicates how closely the object is required to approach the target value in each period, starting from its actual value in the prior period. If the value is set to 100 the object is required to reach the target value in each period. If the value were set to 0 the object would be frozen at its prior-year value. By setting an intermediate value, e.g. 30 or 50, the object can converge progressively on the target value or trajectory.
Example rules call Try("is_EU","pvi_EU","2",-0.3,20)
The rule specifies that Europe's policy rate will be adjusted with the intention of maintaining the underlying inflation rate at 2% p.a. It is assumed that a 1% increase in the policy rate will achieve a 0.3% reduction in the inflation rate. The adjustment attempts to bridge 20% of the gap between the inflation target and the actual rate of inflation in the previous year.
Note that if the estimated sensitivity is too low, adjustments of the policy rate will be too large and may cause the simulation to fail. Moreover if this rule were changed to a same-year target-instrument basis call Target("is_EU","pvi_EU","2",-0.3,20)
the simulation would certainly fail as the EViews solution algorithm attempted to find a value of the policy rate that generated an inflation rate of exactly 2% p.a.
Same-year target-instrument rules are effective for variables that are strongly related provided the target trajectory is not too unrealistic given other assumptions of the scenario. For example, the following rule specifies that government net revenue (taxes less grants, subsidies and debt interest) will be adjusted to increase or reduce private disposable income, stimulating or retarding private spending as required to achieve the specified growth rates of GDP: call Target("YG_CI","@pc(V_CI)","3.0 3.5 4.5 *5",0,100)
The rule says that government revenue in the CIS bloc will be adjusted to ensure GDP growth rising progressively from 3% in the first year to 5% from year 4 onwards. The zero sensitivity argument (second-last parameter) means that sensitivity of GDP growth to shocks to government revenue will be estimated by the GPM program.
Conditional regime-switching
Rules described in the table below introduce policy changes that are conditional on an objective function reaching a ceiling or floor. The rules adjust the value of a behavioural variable (the instrument) in order to modify the outcome for the target variable or expression (the object) if and only if the defined ceiling or floor is reached. The adjustment
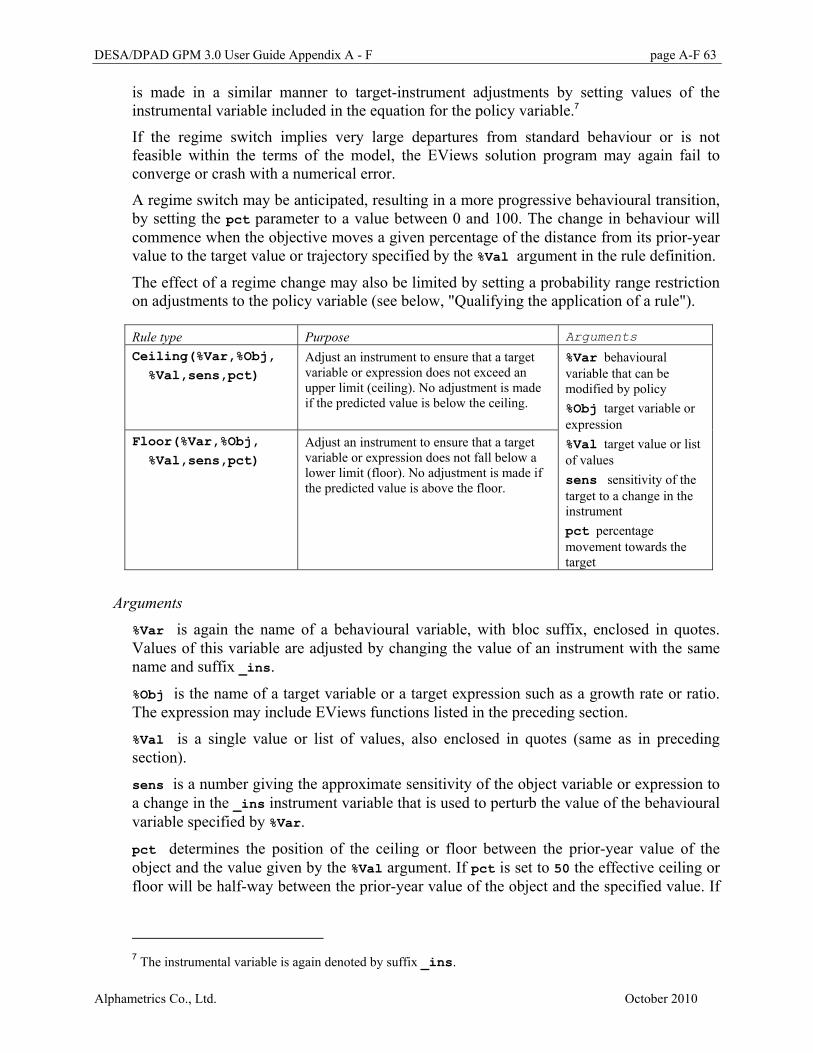
DESA/DPAD GPM 3.0 User Guide Appendix A - F page A-F 63
Alphametrics Co., Ltd. October 2010
is made in a similar manner to target-instrument adjustments by setting values of the instrumental variable included in the equation for the policy variable.7
If the regime switch implies very large departures from standard behaviour or is not feasible within the terms of the model, the EViews solution program may again fail to converge or crash with a numerical error.
A regime switch may be anticipated, resulting in a more progressive behavioural transition, by setting the pct parameter to a value between 0 and 100. The change in behaviour will commence when the objective moves a given percentage of the distance from its prior-year value to the target value or trajectory specified by the %Val argument in the rule definition.
The effect of a regime change may also be limited by setting a probability range restriction on adjustments to the policy variable (see below, "Qualifying the application of a rule").
Rule type Purpose Arguments
Ceiling(%Var,%Obj, %Val,sens,pct)
Adjust an instrument to ensure that a target variable or expression does not exceed an upper limit (ceiling). No adjustment is made if the predicted value is below the ceiling.
Floor(%Var,%Obj, %Val,sens,pct)
Adjust an instrument to ensure that a target variable or expression does not fall below a lower limit (floor). No adjustment is made if the predicted value is above the floor.
%Var behavioural variable that can be modified by policy %Obj target variable or expression %Val target value or list of values sens sensitivity of the target to a change in the instrument pct percentage movement towards the target
Arguments
%Var is again the name of a behavioural variable, with bloc suffix, enclosed in quotes. Values of this variable are adjusted by changing the value of an instrument with the same name and suffix _ins.
%Obj is the name of a target variable or a target expression such as a growth rate or ratio. The expression may include EViews functions listed in the preceding section.
%Val is a single value or list of values, also enclosed in quotes (same as in preceding section).
sens is a number giving the approximate sensitivity of the object variable or expression to a change in the _ins instrument variable that is used to perturb the value of the behavioural variable specified by %Var.
pct determines the position of the ceiling or floor between the prior-year value of the object and the value given by the %Val argument. If pct is set to 50 the effective ceiling or floor will be half-way between the prior-year value of the object and the specified value. If
7 The instrumental variable is again denoted by suffix _ins.

DESA/DPAD GPM 3.0 User Guide Appendix A - F page A-F 64
Alphametrics Co., Ltd. October 2010
the object moves towards the ceiling or floor, the effective ceiling or floor will itself move progressively nearer to the value given by the %Val argument.
Example rules call Ceiling("G_EAH","@pc(V_EAH)","5",150,50)
Government expenditure in the East Asia high income bloc is adjusted to restrict GDP growth to a ceiling of 5% p.a. with gradual enforcement starting from the initial position. The sensitivity of GDP growth to the government expenditure instrument is known to be approximately 150. The scenario can be computed more quickly because the GPM program does not have to perform a shock simulation to obtain the value. call Floor("rx_EU","@pc(rx_EU)","0",0,100)
The real exchange rate for Europe may rise but will not be allowed to fall. Since the sensitivity of the outcome to the instrument is not know, the GPM program must perform a shock simulation to obtain the value.
Linking multiple instruments It is often useful to link adjustments of behavioural variables together, whether within one bloc or across blocs. One example is the description of changes in confidence that may impact on several behavioural variables and are often synchronised more or less closely in different world regions.
Variables linked in a common group may be adjusted in the same direction or opposite direction to the variable to which they are linked and the strength of linkage may be weak or strong (if the value of sens is greater than 1 or less than -1 the linked variable may be adjusted more strongly than the variable to which it is linked).
Rule type Purpose Arguments
Link(%Var, %Ins, sens) Adjust a behavioural variable in proportion to adjustments in a previously-defined variable
%Var behavioural variable which is to be linked %Ins behavioural variable specified in a prior scenario rule sens strength of the linkage (positive or negative ratio)
When comparing the size of adjustments, GPM library routines take account of the historical volatility of residuals in the relevant behavioural equation. Thus if the strength of linkage is 1 (or -1) the size of adjustments to the linked variable relative to those of the variable to which it is linked will be proportionate to the ratio of the historical volatility of residuals for each variable.
Example: call Shock("ip_US", "mult", "-0.02 -0.02, -0.01") call Link("sp_US","ip_US", -1) call Link("ip_EU", "ip_US", 0.7)
A negative shock to investment in the US is mirrored by increased saving (reduced consumer spending) and by a similar loss of confidence in Europe.
Example: call Ceiling("YG_JA","100*LG_JA/Y_JA","200",0,100) call Link("G_JA","YG_JA",2)

DESA/DPAD GPM 3.0 User Guide Appendix A - F page A-F 65
Alphametrics Co., Ltd. October 2010
Government revenue and expenditure in Japan are adjusted together to prevent the ratio of government to income exceeding 200%. The GPM program will perform a shock simulation to determine sensitivity of the objective to the linked instruments.
Qualifying the application of a rule Rules applied in the manner described above are implemented by formula which may sometimes result in unrealistic instrument values and scenario outcomes. The GPM provides an option to constrain instrument adjustments within a range that appears plausible in relation to historical volatility of residuals for the given bloc and behavioural variable. The severity of the constraint is defined by specifying a probability level - for example, 95% or 99%. GPM library routines will then limit the size of variation of instruments to a corresponding multiple of the historical volatility of residuals.8
Rule type Purpose Arguments
Limit(pr, %Var) Constrain the size of adjustments to one instrument
Limit(pr, %Varlist)
Constrain the size of adjustments to a list of instruments
Limit(pr,"ALL") Constrain the size of adjustments to all instruments defined so far
pr probability level (between 50 and 100) %Var behavioural variable already specified in a scenario rule %Varlist list of behavioural variables already specified in scenario rules
When limits are imposed on instrument adjustments, the scenario is "safer" in the sense that departures from past behaviour are more limited and the EViews solution has a better chance of converging. On the other hand, the objectives specified for the scenario may not be fully achieved.
Testing new rules
Options when running a scenario program
The GPM program for defining and simulating a scenario has two options that will help the person specifying the scenario to test new rules.
Set %shocks = "Yes" and %scenario = "No" to request a shock simulation for each group of linked instruments specified for the scenario without the scenario itself being simulated. The results of each shock simulation (discussed below) will help you to determine whether the proposed rules are appropriate.
Set %shocks = "No" and %scenario = "Yes" to request calculation of a scenario using sensitivity values that you have specified for each rule. This is the fastest way to compute a scenario. The GPM program will still have to perform shock simulations to determine sensitivity for any rules for which you have left the sensitivity argument equal to 0.
8 Assuming a normal distribution of deviations from the standard behavioural pattern.
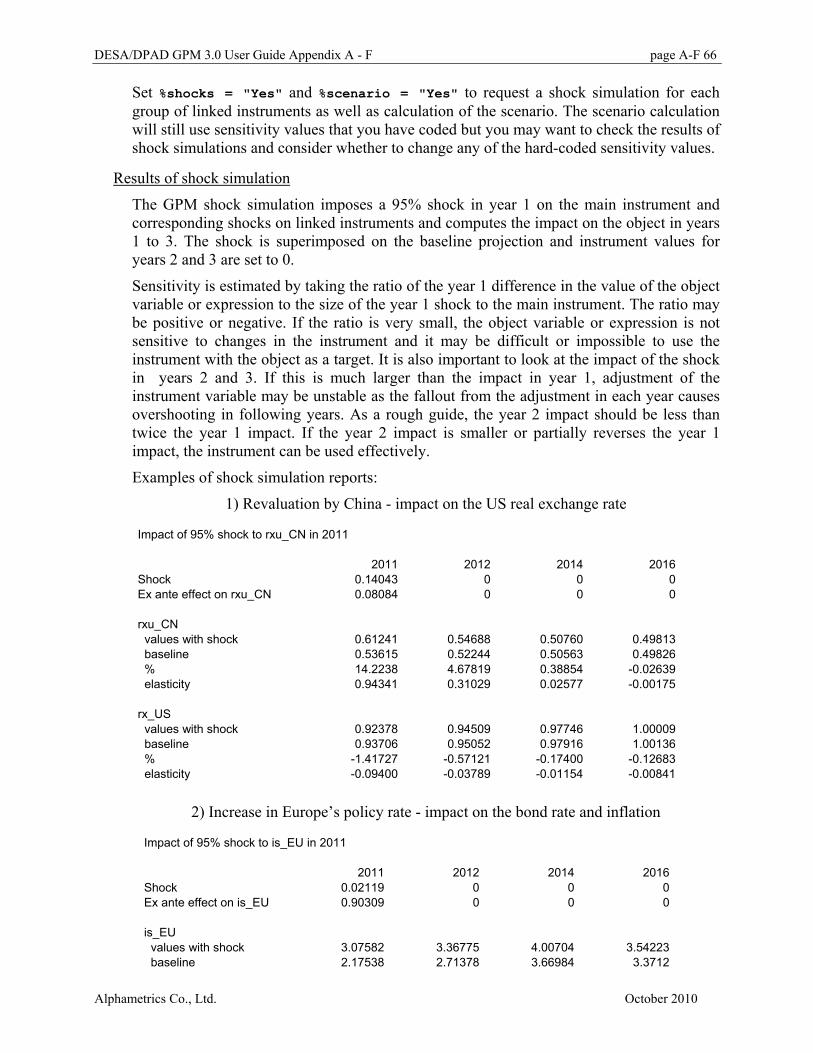
DESA/DPAD GPM 3.0 User Guide Appendix A - F page A-F 66
Alphametrics Co., Ltd. October 2010
Set %shocks = "Yes" and %scenario = "Yes" to request a shock simulation for each group of linked instruments as well as calculation of the scenario. The scenario calculation will still use sensitivity values that you have coded but you may want to check the results of shock simulations and consider whether to change any of the hard-coded sensitivity values.
Results of shock simulation
The GPM shock simulation imposes a 95% shock in year 1 on the main instrument and corresponding shocks on linked instruments and computes the impact on the object in years 1 to 3. The shock is superimposed on the baseline projection and instrument values for years 2 and 3 are set to 0.
Sensitivity is estimated by taking the ratio of the year 1 difference in the value of the object variable or expression to the size of the year 1 shock to the main instrument. The ratio may be positive or negative. If the ratio is very small, the object variable or expression is not sensitive to changes in the instrument and it may be difficult or impossible to use the instrument with the object as a target. It is also important to look at the impact of the shock in years 2 and 3. If this is much larger than the impact in year 1, adjustment of the instrument variable may be unstable as the fallout from the adjustment in each year causes overshooting in following years. As a rough guide, the year 2 impact should be less than twice the year 1 impact. If the year 2 impact is smaller or partially reverses the year 1 impact, the instrument can be used effectively.
Examples of shock simulation reports:
1) Revaluation by China - impact on the US real exchange rate
Impact of 95% shock to rxu_CN in 2011 2011 2012 2014 2016
Shock 0.14043 0 0 0Ex ante effect on rxu_CN 0.08084 0 0 0
rxu_CN values with shock 0.61241 0.54688 0.50760 0.49813 baseline 0.53615 0.52244 0.50563 0.49826 % 14.2238 4.67819 0.38854 -0.02639 elasticity 0.94341 0.31029 0.02577 -0.00175
rx_US values with shock 0.92378 0.94509 0.97746 1.00009 baseline 0.93706 0.95052 0.97916 1.00136 % -1.41727 -0.57121 -0.17400 -0.12683 elasticity -0.09400 -0.03789 -0.01154 -0.00841
2) Increase in Europe’s policy rate - impact on the bond rate and inflation
Impact of 95% shock to is_EU in 2011
2011 2012 2014 2016
Shock 0.02119 0 0 0Ex ante effect on is_EU 0.90309 0 0 0
is_EU values with shock 3.07582 3.36775 4.00704 3.54223 baseline 2.17538 2.71378 3.66984 3.3712

DESA/DPAD GPM 3.0 User Guide Appendix A - F page A-F 67
Alphametrics Co., Ltd. October 2010
% p.a. 0.90044 0.65397 0.33721 0.17103 elasticity 0.99706 0.72415 0.37339 0.18938
im_EU values with shock 3.74344 3.81789 4.61491 4.87521 baseline 3.71487 3.78666 4.61255 4.88437 % p.a. 0.02857 0.03123 0.00236 -0.00916 elasticity 0.03164 0.03459 0.00261 -0.01015
pi_EU values with shock 1.20383 1.02348 1.51709 1.64565 baseline 1.20622 1.03457 1.53666 1.666 % p.a. -0.00239 -0.01108 -0.01957 -0.02035 elasticity -0.00264 -0.01227 -0.02168 -0.02253

DESA/DPAD GPM 3.0 User Guide Appendix A - F 68
Alphametrics Co., Ltd. October 2010
Appendix F Multiplier Tables Introduction
These tables provide information about short and medium-term responses of key variables (outputs) to one-year shocks applied to different behavioural variables (inputs).
The impact on each output is measured with respect to the ex ante change of the shocked variable (input) in the first year9. When the input and output are both money stocks or flows the response is measured as a multiplier ($ million change in the output variable for a 1$ billion ex ante change in the input variable in the first year). In all other cases the response is tabulated as an elasticity (ratio of the percentage change in the output relative to the ex ante change in the input, also measured as a percentage). Depending on the variable, the percentage is measured as the proportionate change in the variable itself or per annum or relative to GDP or some other aggregate.
Multipliers and elasticities are shown for the bloc where the shock is applied (local impact), for the world as a whole (global impact) and for selected other blocs (spillovers).
The tables below document responses to shocks in the US, China, CIS, South America and Middle Income Africa. The GPM program solm.prg can be used to generate similar tables for other blocs. The GPM programs shock.prg and impact.prg may be used to check details of the calculations, generate shocks to other inputs and trace responses of other outputs not shown in these summary tables.
Methodological note Responses shown in the tables represent average values of multipliers and elasticities for substantial upward shocks to the different input variables10 calculated relative to first six years of the baseline projection. Given that the model is non-linear, values of multipliers and elasticities may change significantly if shocks are generated in a downward direction or if a different baseline is used. The dependence of results on the baseline is particularly significant for interest rates and inflation since the current GPM baseline starts with unusually low inflation rates and capacity utilisation. Interest rates in many blocs are near to levels at which the "liquidity trap" may become effective and capacity utilisation is low enough to make inflation relatively insensitive to changes in aggregate demand.
The responses are generated in a closed system (the global economy) through a variety of relationships, some of which are local to the economy in which the shock occurs (e.g. changes in incomes, government revenue and capacity utilisation) while others are external (e.g. growth of world income and export markets, changes in prices of oil and primary commodities). The main external feedbacks can be identified by examining world responses and spillovers in other blocs. Values of local multipliers could be significantly different if external variables were held constant.
9 The ex ante change is the change that would have occurred if all other variables were held constant. 10 Shocks are calibrated to match the 95% point of the historical distribution of equation residuals for the shocked variable.
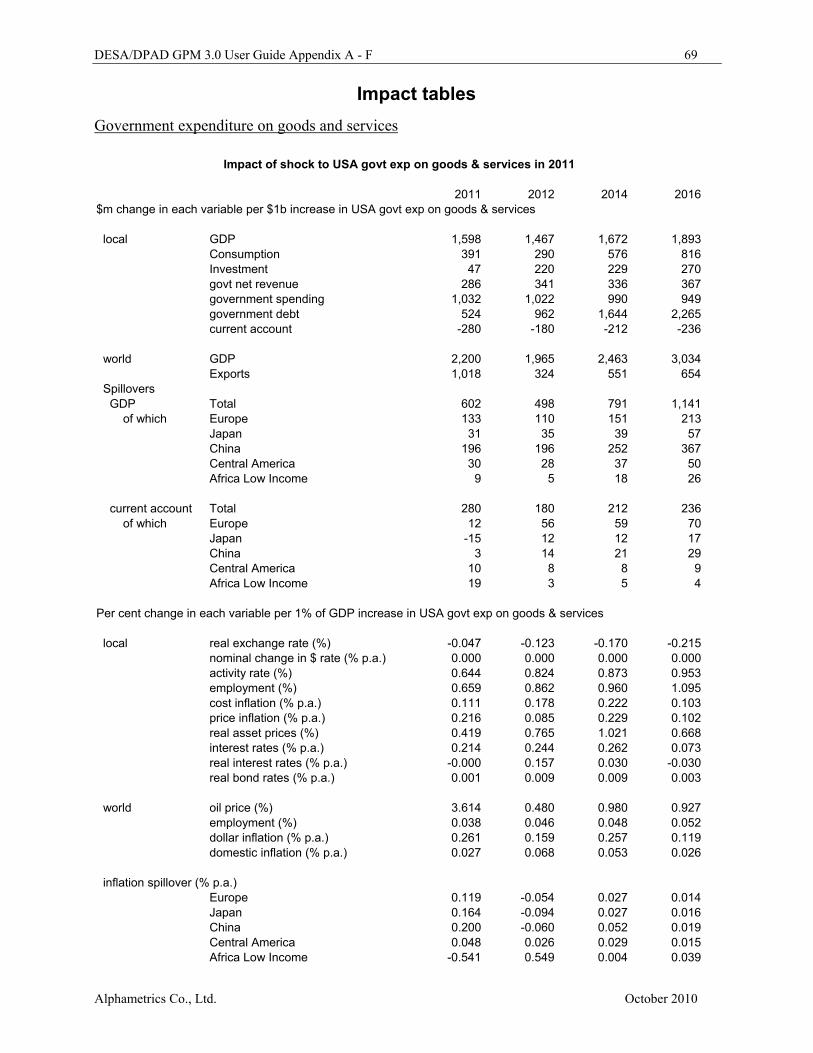
DESA/DPAD GPM 3.0 User Guide Appendix A - F 69
Alphametrics Co., Ltd. October 2010
Impact tables Government expenditure on goods and services
Impact of shock to USA govt exp on goods & services in 2011
2011 2012 2014 2016
$m change in each variable per $1b increase in USA govt exp on goods & services
local GDP 1,598 1,467 1,672 1,893 Consumption 391 290 576 816 Investment 47 220 229 270 govt net revenue 286 341 336 367 government spending 1,032 1,022 990 949 government debt 524 962 1,644 2,265 current account -280 -180 -212 -236
world GDP 2,200 1,965 2,463 3,034 Exports 1,018 324 551 654
Spillovers GDP Total 602 498 791 1,141 of which Europe 133 110 151 213
Japan 31 35 39 57 China 196 196 252 367 Central America 30 28 37 50 Africa Low Income 9 5 18 26
current account Total 280 180 212 236 of which Europe 12 56 59 70
Japan -15 12 12 17 China 3 14 21 29 Central America 10 8 8 9 Africa Low Income 19 3 5 4
Per cent change in each variable per 1% of GDP increase in USA govt exp on goods & services
local real exchange rate (%) -0.047 -0.123 -0.170 -0.215 nominal change in $ rate (% p.a.) 0.000 0.000 0.000 0.000 activity rate (%) 0.644 0.824 0.873 0.953 employment (%) 0.659 0.862 0.960 1.095 cost inflation (% p.a.) 0.111 0.178 0.222 0.103 price inflation (% p.a.) 0.216 0.085 0.229 0.102 real asset prices (%) 0.419 0.765 1.021 0.668 interest rates (% p.a.) 0.214 0.244 0.262 0.073 real interest rates (% p.a.) -0.000 0.157 0.030 -0.030 real bond rates (% p.a.) 0.001 0.009 0.009 0.003
world oil price (%) 3.614 0.480 0.980 0.927 employment (%) 0.038 0.046 0.048 0.052 dollar inflation (% p.a.) 0.261 0.159 0.257 0.119 domestic inflation (% p.a.) 0.027 0.068 0.053 0.026
inflation spillover (% p.a.) Europe 0.119 -0.054 0.027 0.014 Japan 0.164 -0.094 0.027 0.016 China 0.200 -0.060 0.052 0.019 Central America 0.048 0.026 0.029 0.015 Africa Low Income -0.541 0.549 0.004 0.039

DESA/DPAD GPM 3.0 User Guide Appendix A - F 70
Alphametrics Co., Ltd. October 2010
Impact of shock to China govt exp on goods & services in 2011 2011 2012 2014 2016
$m change in each variable per $1b increase in China govt exp on goods & services
local GDP 1,816 1,726 2,491 3,410 consumption 481 -284 152 513 investment 321 1,118 1,403 1,854 govt net revenue 351 414 490 610 government spending 1,027 1,067 1,168 1,271 government debt 116 100 149 209 current account -202 -171 -188 -211
world GDP 2,221 2,085 3,045 4,171 exports 986 490 764 968
spillovers GDP total 406 359 554 761 of which USA 27 44 48 71
Europe 119 106 143 193 Japan 44 51 59 80 Central America 7 8 11 15 Africa Low Income 7 3 11 16
current account total 202 171 188 211 of which USA -37 17 11 14
Europe 23 58 63 73 Japan 0 23 27 35 Central America 2 2 2 2 Africa Low Income 14 1 2 1
per cent change in each variable per 1% of GDP increase in China govt exp on goods & services
local real exchange rate (%) 0.101 -0.274 -0.414 -0.473 nominal change in $ rate (% p.a.) -0.073 -0.573 -0.357 -0.170 activity rate (%) 0.077 0.107 0.141 0.184 employment (%) 0.078 0.109 0.145 0.190 cost inflation (% p.a.) 0.127 0.284 0.321 0.132 price inflation (% p.a.) 0.149 0.212 0.329 0.139 real asset prices (%) 0.437 0.758 0.976 0.600 interest rates (% p.a.) 0.216 0.290 0.308 0.091 real interest rates (% p.a.) 0.064 0.074 -0.019 -0.045 real bond rates (% p.a.) 0.006 0.012 0.015 0.006
world oil price (%) 1.823 0.126 0.370 0.356 employment (%) 0.024 0.031 0.039 0.049 dollar inflation (% p.a.) -0.040 -0.055 -0.023 -0.024 domestic inflation (% p.a.) 0.014 0.059 0.058 0.025
inflation spillover (% p.a.) USA 0.062 -0.054 -0.001 -0.004 Europe 0.053 -0.032 0.007 0.002 Japan 0.084 -0.052 0.012 0.005 Central America 0.008 0.002 0.001 -0.002 Africa Low Income -0.286 0.285 -0.002 0.005

DESA/DPAD GPM 3.0 User Guide Appendix A - F 71
Alphametrics Co., Ltd. October 2010
Impact of shock to CIS and Other govt exp on goods & services in 2011 2011 2012 2014 2016
$m change in each variable per $1b increase in CIS and Other govt exp on goods & services
local GDP 1,331 1,008 1,217 1,315 consumption 381 -35 279 453 investment 46 206 211 235 govt net revenue 277 281 310 335 government spending 1,026 1,005 934 831 government debt 775 1,249 2,034 2,564 current account -168 -124 -131 -131
world GDP 1,798 1,286 1,647 1,871 exports 577 118 247 252
spillovers GDP total 466 279 430 556 of which USA 23 23 35 53
Europe 152 78 128 166 Japan 23 18 22 29 China 149 92 126 158 Central America 6 5 7 10 Africa Low Income 5 1 4 4
current account total 168 124 131 131 of which USA -3 26 21 23
Europe 72 66 66 66 Japan 4 14 15 17 China 15 14 17 20 Central America 2 1 1 1 Africa Low Income 6 -3 -1 -2
per cent change in each variable per 1% of GDP increase in CIS and Other govt exp on goods & services
local real exchange rate (%) 0.019 -0.164 -0.256 -0.309 nominal change in $ rate (% p.a.) -0.041 -0.376 -0.233 -0.079 activity rate (%) 0.127 0.150 0.165 0.176 employment (%) 0.129 0.154 0.172 0.184 cost inflation (% p.a.) 0.090 0.216 0.233 0.061 price inflation (% p.a.) 0.054 0.274 0.242 0.066 real asset prices (%) 0.341 0.565 0.700 0.355 interest rates (% p.a.) 0.160 0.249 0.235 0.028 real interest rates (% p.a.) 0.096 -0.014 -0.007 -0.036 real bond rates (% p.a.) 0.004 0.006 0.008 0.002
world oil price (%) 0.196 -0.134 -0.076 -0.093 employment (%) 0.007 0.007 0.007 0.007 dollar inflation (% p.a.) -0.014 -0.007 -0.003 -0.001 domestic inflation (% p.a.) 0.008 0.016 0.014 0.004
inflation spillover (% p.a.) USA 0.005 -0.011 -0.001 -0.001 Europe 0.004 -0.006 0.001 0.000 Japan 0.010 -0.012 -0.000 -0.001 China 0.016 -0.010 0.001 -0.002 Central America -0.001 0.000 0.000 -0.000 Africa Low Income -0.033 0.054 0.005 0.001
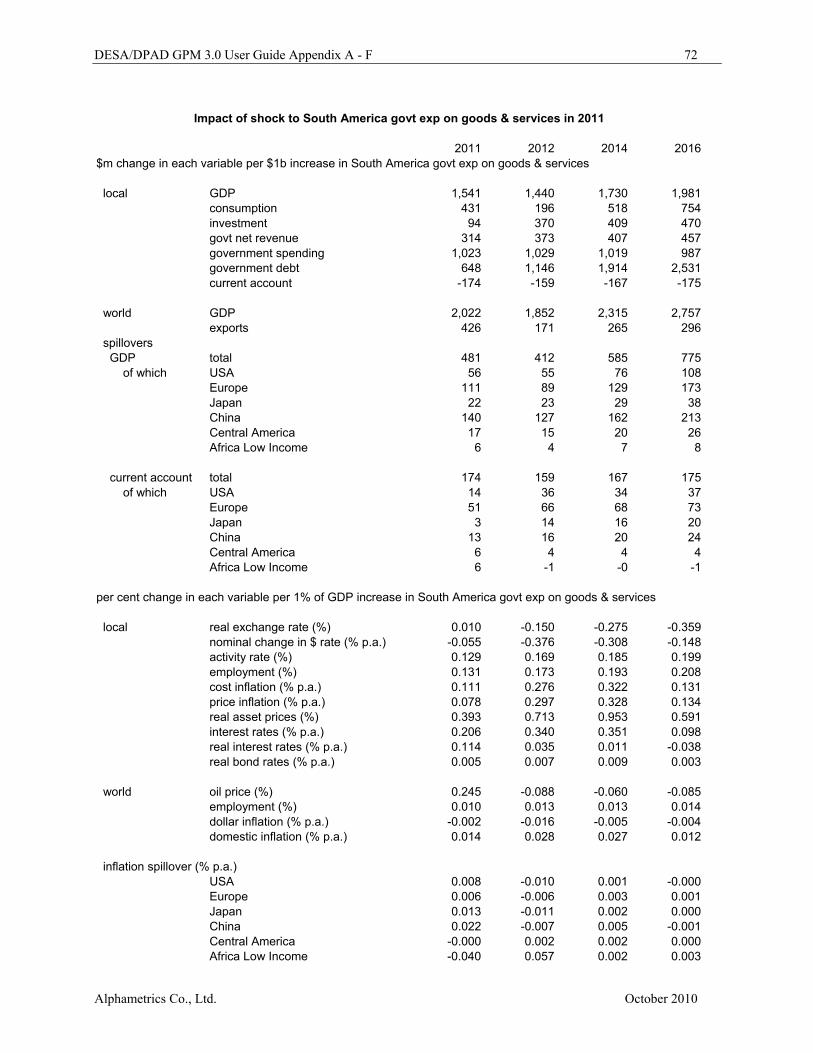
DESA/DPAD GPM 3.0 User Guide Appendix A - F 72
Alphametrics Co., Ltd. October 2010
Impact of shock to South America govt exp on goods & services in 2011 2011 2012 2014 2016
$m change in each variable per $1b increase in South America govt exp on goods & services
local GDP 1,541 1,440 1,730 1,981 consumption 431 196 518 754 investment 94 370 409 470 govt net revenue 314 373 407 457 government spending 1,023 1,029 1,019 987 government debt 648 1,146 1,914 2,531 current account -174 -159 -167 -175
world GDP 2,022 1,852 2,315 2,757 exports 426 171 265 296
spillovers GDP total 481 412 585 775 of which USA 56 55 76 108
Europe 111 89 129 173 Japan 22 23 29 38 China 140 127 162 213 Central America 17 15 20 26 Africa Low Income 6 4 7 8
current account total 174 159 167 175 of which USA 14 36 34 37
Europe 51 66 68 73 Japan 3 14 16 20 China 13 16 20 24 Central America 6 4 4 4 Africa Low Income 6 -1 -0 -1
per cent change in each variable per 1% of GDP increase in South America govt exp on goods & services
local real exchange rate (%) 0.010 -0.150 -0.275 -0.359 nominal change in $ rate (% p.a.) -0.055 -0.376 -0.308 -0.148 activity rate (%) 0.129 0.169 0.185 0.199 employment (%) 0.131 0.173 0.193 0.208 cost inflation (% p.a.) 0.111 0.276 0.322 0.131 price inflation (% p.a.) 0.078 0.297 0.328 0.134 real asset prices (%) 0.393 0.713 0.953 0.591 interest rates (% p.a.) 0.206 0.340 0.351 0.098 real interest rates (% p.a.) 0.114 0.035 0.011 -0.038 real bond rates (% p.a.) 0.005 0.007 0.009 0.003
world oil price (%) 0.245 -0.088 -0.060 -0.085 employment (%) 0.010 0.013 0.013 0.014 dollar inflation (% p.a.) -0.002 -0.016 -0.005 -0.004 domestic inflation (% p.a.) 0.014 0.028 0.027 0.012
inflation spillover (% p.a.) USA 0.008 -0.010 0.001 -0.000 Europe 0.006 -0.006 0.003 0.001 Japan 0.013 -0.011 0.002 0.000 China 0.022 -0.007 0.005 -0.001 Central America -0.000 0.002 0.002 0.000 Africa Low Income -0.040 0.057 0.002 0.003

DESA/DPAD GPM 3.0 User Guide Appendix A - F 73
Alphametrics Co., Ltd. October 2010
Impact of shock to Africa Middle Income govt exp on goods & services in 2011 2011 2012 2014 2016
$m change in each variable per $1b increase in Africa Middle Income govt exp on goods & services
local GDP 1,369 1,253 1,469 1,632 consumption 377 130 410 601 investment 88 331 352 392 govt net revenue 274 334 377 423 government spending 1,020 1,011 983 934 government debt 896 1,334 2,012 2,498 current account -187 -168 -172 -177
world GDP 1,905 1,704 2,100 2,460 exports 640 308 404 435
spillovers GDP total 535 451 631 828 of which USA 33 37 52 77
Europe 162 125 174 226 Japan 25 26 30 39 China 152 138 172 225 Central America 8 8 11 16 Africa Low Income 7 4 7 8
current account total 187 168 172 177 of which USA -3 25 23 26
Europe 71 83 82 85 Japan 3 15 17 20 China 13 17 21 25 Central America 3 2 2 2 Africa Low Income 7 -1 -1 -1
per cent change in each variable per 1% of GDP increase in Africa Middle Income govt exp on goods & services
local real exchange rate (%) 0.013 -0.169 -0.314 -0.398 nominal change in $ rate (% p.a.) -0.084 -0.372 -0.302 -0.138 activity rate (%) 0.062 0.083 0.095 0.107 employment (%) 0.063 0.084 0.098 0.110 cost inflation (% p.a.) 0.105 0.288 0.345 0.132 price inflation (% p.a.) 0.111 0.309 0.351 0.140 real asset prices (%) 0.352 0.639 0.858 0.525 interest rates (% p.a.) 0.184 0.293 0.302 0.084 real interest rates (% p.a.) 0.067 0.004 -0.024 -0.042 real bond rates (% p.a.) 0.003 0.006 0.008 0.003
World oil price (%) 0.123 -0.038 -0.024 -0.035 employment (%) 0.003 0.003 0.004 0.004 dollar inflation (% p.a.) -0.010 -0.004 -0.001 -0.001 domestic inflation (% p.a.) 0.008 0.013 0.014 0.007
inflation spillover (% p.a.) USA 0.003 -0.005 -0.000 -0.000 Europe 0.004 -0.003 0.002 0.001 Japan 0.006 -0.006 0.001 -0.000 China 0.010 -0.004 0.002 -0.001 Central America -0.000 0.000 0.000 0.000 Africa Low Income -0.020 0.027 0.000 0.001

DESA/DPAD GPM 3.0 User Guide Appendix A - F 74
Alphametrics Co., Ltd. October 2010
Government revenue (net of grants, subsidies and interest)
Impact of shock to USA govt revenue (net of grants & subs) in 2011 2011 2012 2014 2016
$m change in each variable per $1b increase in USA govt revenue (net of grants & subs)
Local GDP -344 -90 -155 -81 consumption -418 -247 -408 -410 investment -10 -41 -22 -17 govt net revenue 939 790 511 330 government spending 100 158 250 317 government debt -655 -1,120 -1,510 -1,453 current account 78 9 35 21
World GDP -523 -142 -289 -229 exports -276 53 -97 -64
spillovers GDP total -178 -53 -134 -149 of which Europe -38 -11 -27 -28
Japan -10 -6 -8 -8 China -58 -24 -47 -47 Central America -10 -4 -8 -8 Africa Low Income -2 0 -2 -3
current account total -78 -9 -35 -21 of which Europe -6 -14 -10 -9
Japan 2 -6 -3 -3 China -3 -4 -4 -4 Central America -3 -1 -2 -1 Africa Low Income -5 2 -1 0
per cent change in each variable per 1% of GDP increase in USA govt revenue (net of grants & subs)
Local real exchange rate (%) 0.010 0.026 0.030 0.032 nominal change in $ rate (% p.a.) 0.000 0.000 0.000 0.000 activity rate (%) -0.139 -0.091 -0.085 -0.055 employment (%) -0.143 -0.097 -0.096 -0.070 cost inflation (% p.a.) -0.025 -0.023 -0.019 0.007 price inflation (% p.a.) -0.052 0.015 -0.018 0.008 real asset prices (%) -0.091 -0.108 -0.098 0.000 interest rates (% p.a.) -0.048 -0.022 -0.020 0.019 real interest rates (% p.a.) 0.004 -0.037 -0.002 0.011 real bond rates (% p.a.) -0.000 -0.002 -0.001 0.001
World oil price (%) -0.878 0.394 -0.118 -0.001 employment (%) -0.009 -0.006 -0.006 -0.004 dollar inflation (% p.a.) -0.062 -0.000 -0.025 0.008 domestic inflation (% p.a.) -0.007 -0.014 -0.007 0.001
inflation spillover (% p.a.) Europe -0.029 0.029 -0.002 0.001 Japan -0.041 0.045 -0.001 0.001 China -0.050 0.042 -0.004 0.003 Central America -0.012 -0.002 -0.005 0.000 Africa Low Income 0.132 -0.209 -0.015 -0.007

DESA/DPAD GPM 3.0 User Guide Appendix A - F 75
Alphametrics Co., Ltd. October 2010
Impact of shock to China govt revenue (net of grants & subs) in 2011 2011 2012 2014 2016
$m change in each variable per $1b increase in China govt revenue (net of grants & subs)
local GDP -454 551 159 96 consumption -456 499 -131 -233 investment -81 -102 132 63 govt net revenue 912 915 609 404 government spending 61 127 200 264 government debt -29 41 10 5 current account 60 -72 -7 4
world GDP -576 694 209 104 exports -287 438 13 -2
spillovers GDP total -122 143 50 8 of which USA -9 5 -1 0
Europe -34 40 6 3 Japan -14 13 1 -0 Central America -2 2 1 0 Africa Low Income -2 3 2 0
current account total -60 72 7 -4 of which USA 10 -25 5 -0
Europe -7 -1 9 0 Japan -1 -4 3 -0 Central America -1 1 0 -0 Africa Low Income -4 7 -1 -0
per cent change in each variable per 1% of GDP increase in China govt revenue (net of grants & subs)
local real exchange rate (%) -0.026 0.140 -0.057 -0.023 nominal change in $ rate (% p.a.) 0.014 0.124 -0.055 -0.004 activity rate (%) -0.020 0.014 0.010 0.006 employment (%) -0.020 0.014 0.010 0.006 cost inflation (% p.a.) -0.032 -0.005 0.051 0.022 price inflation (% p.a.) -0.035 0.027 0.061 0.026 real asset prices (%) -0.112 0.022 0.116 0.076 interest rates (% p.a.) -0.054 0.038 0.048 0.019 real interest rates (% p.a.) -0.019 0.010 -0.012 -0.007 real bond rates (% p.a.) -0.002 0.000 0.002 0.001
world oil price (%) -0.517 0.938 -0.079 -0.011 employment (%) -0.006 0.005 0.003 0.001 dollar inflation (% p.a.) 0.008 -0.005 -0.002 0.003 domestic inflation (% p.a.) -0.003 -0.009 0.007 0.005
inflation spillover (% p.a.) USA -0.018 0.049 0.003 0.001 Europe -0.015 0.038 0.003 0.001 Japan -0.024 0.060 0.005 0.001 Central America -0.003 0.003 -0.002 -0.000 Africa Low Income 0.081 -0.232 -0.024 -0.002
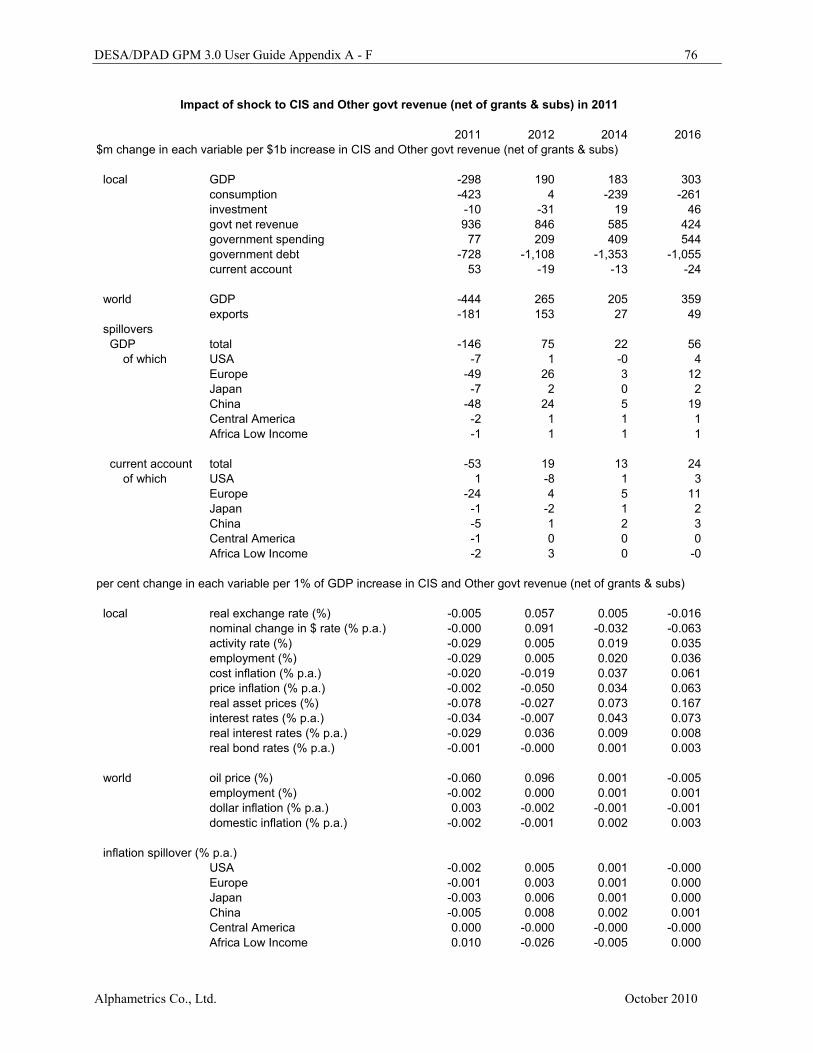
DESA/DPAD GPM 3.0 User Guide Appendix A - F 76
Alphametrics Co., Ltd. October 2010
Impact of shock to CIS and Other govt revenue (net of grants & subs) in 2011
2011 2012 2014 2016
$m change in each variable per $1b increase in CIS and Other govt revenue (net of grants & subs)
local GDP -298 190 183 303 consumption -423 4 -239 -261 investment -10 -31 19 46 govt net revenue 936 846 585 424 government spending 77 209 409 544 government debt -728 -1,108 -1,353 -1,055 current account 53 -19 -13 -24
world GDP -444 265 205 359 exports -181 153 27 49
spillovers GDP total -146 75 22 56 of which USA -7 1 -0 4
Europe -49 26 3 12 Japan -7 2 0 2 China -48 24 5 19 Central America -2 1 1 1 Africa Low Income -1 1 1 1
current account total -53 19 13 24 of which USA 1 -8 1 3
Europe -24 4 5 11 Japan -1 -2 1 2 China -5 1 2 3 Central America -1 0 0 0 Africa Low Income -2 3 0 -0
per cent change in each variable per 1% of GDP increase in CIS and Other govt revenue (net of grants & subs)
local real exchange rate (%) -0.005 0.057 0.005 -0.016 nominal change in $ rate (% p.a.) -0.000 0.091 -0.032 -0.063 activity rate (%) -0.029 0.005 0.019 0.035 employment (%) -0.029 0.005 0.020 0.036 cost inflation (% p.a.) -0.020 -0.019 0.037 0.061 price inflation (% p.a.) -0.002 -0.050 0.034 0.063 real asset prices (%) -0.078 -0.027 0.073 0.167 interest rates (% p.a.) -0.034 -0.007 0.043 0.073 real interest rates (% p.a.) -0.029 0.036 0.009 0.008 real bond rates (% p.a.) -0.001 -0.000 0.001 0.003
world oil price (%) -0.060 0.096 0.001 -0.005 employment (%) -0.002 0.000 0.001 0.001 dollar inflation (% p.a.) 0.003 -0.002 -0.001 -0.001 domestic inflation (% p.a.) -0.002 -0.001 0.002 0.003
inflation spillover (% p.a.) USA -0.002 0.005 0.001 -0.000 Europe -0.001 0.003 0.001 0.000 Japan -0.003 0.006 0.001 0.000 China -0.005 0.008 0.002 0.001 Central America 0.000 -0.000 -0.000 -0.000 Africa Low Income 0.010 -0.026 -0.005 0.000

DESA/DPAD GPM 3.0 User Guide Appendix A - F 77
Alphametrics Co., Ltd. October 2010
Impact of shock to South America govt revenue (net of grants & subs) in 2011 2011 2012 2014 2016
$m change in each variable per $1b increase in South America govt revenue (net of grants & subs)
local GDP -397 -62 -70 48 consumption -448 -173 -360 -369 investment -24 -77 -27 -2 govt net revenue 918 789 528 363 government spending 61 146 288 399 government debt -706 -1,139 -1,400 -1,170 current account 57 14 14 0
world GDP -556 -90 -134 2 exports -154 27 -33 -10
spillovers GDP total -159 -28 -64 -46 of which USA -21 -7 -11 -10
Europe -36 -5 -15 -11 Japan -7 -3 -3 -3 China -47 -10 -19 -10 Central America -6 -1 -2 -2 Africa Low Income -2 0 -0 -0
current account total -57 -14 -14 -0 of which USA -5 -9 -3 -1
Europe -16 -10 -5 -1 Japan -1 -3 -2 -1 China -5 -3 -2 -1 Central America -2 -0 -0 0 Africa Low Income -2 1 0 0
per cent change in each variable per 1% of GDP increase in South America govt revenue (net of grants & subs)
local real exchange rate (%) -0.003 0.053 0.046 0.041 nominal change in $ rate (% p.a.) 0.007 0.101 0.014 -0.032 activity rate (%) -0.034 -0.020 -0.011 -0.001 employment (%) -0.034 -0.020 -0.012 -0.001 cost inflation (% p.a.) -0.028 -0.049 -0.014 0.034 price inflation (% p.a.) -0.012 -0.064 -0.015 0.033 real asset prices (%) -0.103 -0.110 -0.058 0.076 interest rates (% p.a.) -0.052 -0.047 -0.008 0.053 real interest rates (% p.a.) -0.035 0.015 0.006 0.017 real bond rates (% p.a.) -0.001 -0.001 -0.000 0.001
world oil price (%) -0.084 0.073 0.005 0.009 employment (%) -0.003 -0.001 -0.001 -0.000 dollar inflation (% p.a.) -0.000 0.004 -0.000 -0.001 domestic inflation (% p.a.) -0.003 -0.005 -0.001 0.003
inflation spillover (% p.a.) USA -0.003 0.005 -0.000 0.000 Europe -0.002 0.003 -0.000 0.000 Japan -0.004 0.006 0.000 0.000 China -0.007 0.006 0.000 0.001 Central America -0.000 -0.001 -0.000 0.000 Africa Low Income 0.014 -0.026 -0.001 0.000

DESA/DPAD GPM 3.0 User Guide Appendix A - F 78
Alphametrics Co., Ltd. October 2010
Impact of shock to Africa Middle Income govt revenue (net of grants & subs) in 2011
2011 2012 2014 2016
$m change in each variable per $1b increase in Africa Middle Income govt revenue (net of grants & subs)
local GDP -326 37 46 188 consumption -426 -99 -298 -304 investment -21 -57 1 32 govt net revenue 934 811 551 392 government spending 63 160 324 465 government debt -769 -1,136 -1,411 -1,125 current account 61 1 4 -15
world GDP -501 46 14 199 exports -210 77 -13 36
spillovers GDP total -175 8 -32 12 of which USA -11 -3 -4 -1
Europe -54 4 -12 0 Japan -8 -1 -2 0 China -50 1 -9 7 Central America -2 -0 -0 0 Africa Low Income -2 1 0 0
current account total -61 -1 -4 15 of which USA 1 -8 -0 1
Europe -24 -6 -2 6 Japan -1 -3 -1 1 China -5 -1 -0 1 Central America -1 0 0 0 Africa Low Income -2 2 0 0
per cent change in each variable per 1% of GDP increase in Africa Middle Income govt revenue (net of grants & subs)
local real exchange rate (%) -0.003 0.059 0.033 0.020
nominal change in $ rate (% p.a.) 0.015 0.085 -0.009 -0.052 activity rate (%) -0.015 -0.005 0.001 0.009 employment (%) -0.015 -0.005 0.001 0.009 cost inflation (% p.a.) -0.025 -0.042 0.008 0.056 price inflation (% p.a.) -0.020 -0.047 0.009 0.059 real asset prices (%) -0.085 -0.070 0.004 0.126 interest rates (% p.a.) -0.043 -0.025 0.015 0.063 real interest rates (% p.a.) -0.020 0.016 0.005 0.006 real bond rates (% p.a.) -0.001 -0.001 0.000 0.002
world oil price (%) -0.040 0.042 0.001 0.003 employment (%) -0.001 -0.000 0.000 0.000 dollar inflation (% p.a.) 0.002 -0.001 -0.001 -0.001 domestic inflation (% p.a.) -0.002 -0.001 0.000 0.002
inflation spillover (% p.a.) USA -0.001 0.003 0.000 -0.000 Europe -0.001 0.002 -0.000 0.000 Japan -0.002 0.003 0.000 0.000 China -0.003 0.004 0.000 0.001 Central America -0.000 -0.000 -0.000 0.000 Africa Low Income 0.006 -0.014 -0.001 0.000

DESA/DPAD GPM 3.0 User Guide Appendix A - F 79
Alphametrics Co., Ltd. October 2010
Real exchange rate
Impact of shock to USA real exchange rate in 2011 2011 2012 2014 2016
per cent change in each variable per 1% increase in USA real exchange rate
local GDP (%) -0.061 -0.054 -0.049 -0.047 consumption (% of GDP) -0.011 -0.008 -0.015 -0.019 investment (% of GDP) -0.002 -0.008 -0.007 -0.007 govt net revenue (% of GDP) -0.009 -0.009 -0.005 -0.004 government spending (% of GDP) -0.001 -0.003 -0.005 -0.007 government debt (% of GDP) 0.035 0.047 0.045 0.028 current account (% of GDP) -0.045 -0.026 -0.011 -0.005 real exchange rate (%) 0.756 0.314 0.048 -0.004 nominal change in $ rate (% p.a.) 0.000 0.000 0.000 0.000 activity rate (%) -0.024 -0.032 -0.029 -0.029 employment (%) -0.025 -0.033 -0.033 -0.034 cost inflation (% p.a.) -0.041 -0.017 -0.002 0.004 price inflation (% p.a.) -0.061 -0.016 -0.000 0.006 real asset prices (%) -0.016 -0.029 -0.035 -0.017 interest rates (% p.a.) -0.024 -0.019 -0.010 0.002 real interest rates (% p.a.) 0.037 -0.002 -0.009 -0.004 real bond rates (% p.a.) 0.001 -0.000 -0.001 -0.000
world GDP (%) 0.014 0.004 0.007 0.006 exports (%) -0.015 -0.016 0.004 0.006 oil price (%) -0.019 -0.055 -0.007 -0.010 employment (%) 0.001 0.001 0.001 0.001 dollar inflation (% p.a.) -0.799 0.420 0.082 0.023 domestic inflation (% p.a.) -0.002 0.009 0.001 -0.001
GDP spillover (%) Europe 0.021 0.012 0.018 0.019 Japan 0.027 0.021 0.020 0.019 China 0.048 0.021 0.026 0.022 Central America 0.091 0.052 0.036 0.027 Africa Low Income 0.025 0.007 -0.001 -0.002
current account spillover (% of GDP) Europe 0.010 0.009 0.006 0.004 Japan 0.015 0.010 0.004 0.003 China 0.010 0.005 0.000 0.000 Central America 0.031 0.013 -0.000 -0.004 Africa Low Income 0.009 0.003 0.002 -0.000
inflation spillover (% p.a.) Europe 0.008 0.009 0.001 -0.001 Japan 0.007 0.008 0.000 -0.002 China 0.007 0.019 0.000 -0.003 Central America 0.021 0.021 0.004 -0.008 Africa Low Income 0.025 0.015 -0.000 -0.006

DESA/DPAD GPM 3.0 User Guide Appendix A - F 80
Alphametrics Co., Ltd. October 2010
Impact of shock to China real exchange rate in 2011 2011 2012 2014 2016
per cent change in each variable per 1% increase in China real exchange rate
local GDP (%) -0.112 -0.127 -0.153 -0.140 consumption (% of GDP) -0.043 0.029 -0.009 -0.024 investment (% of GDP) -0.020 -0.065 -0.092 -0.081 govt net revenue (% of GDP) -0.032 -0.028 -0.024 -0.020 government spending (% of GDP) -0.002 -0.017 -0.018 -0.016 government debt (% of GDP) 0.157 -0.008 -0.011 -0.012 current account (% of GDP) -0.036 -0.018 -0.002 -0.000 real exchange rate (%) 0.892 0.286 0.018 -0.008 nominal change in $ rate (% p.a.) 0.934 -0.466 -0.047 -0.008 activity rate (%) -0.005 -0.009 -0.013 -0.013 employment (%) -0.005 -0.009 -0.013 -0.014 cost inflation (% p.a.) -0.059 -0.028 -0.019 -0.002 price inflation (% p.a.) -0.006 -0.090 -0.019 0.002 real asset prices (%) -0.028 -0.055 -0.087 -0.049 interest rates (% p.a.) -0.013 -0.043 -0.031 -0.003 real interest rates (% p.a.) -0.006 0.043 -0.012 -0.005 real bond rates (% p.a.) -0.000 -0.001 -0.002 -0.000
world GDP (%) -0.009 -0.012 -0.019 -0.020 exports (%) 0.009 -0.007 -0.015 -0.014 oil price (%) 0.045 -0.013 -0.002 -0.000 employment (%) -0.001 -0.001 -0.002 -0.002 dollar inflation (% p.a.) 0.105 -0.056 -0.006 -0.001 domestic inflation (% p.a.) 0.001 -0.006 -0.002 0.000
GDP spillover (%) USA 0.006 0.007 0.006 0.006 Europe 0.001 0.008 0.010 0.010 Japan 0.021 0.013 0.006 0.005 Central America -0.000 0.008 0.009 0.009 Africa Low Income 0.006 0.005 0.006 0.005
current account spillover (% of GDP) USA 0.004 0.003 0.001 0.001 Europe 0.003 0.004 0.002 0.002 Japan 0.011 0.005 -0.001 -0.003 Central America 0.004 0.003 0.002 0.001 Africa Low Income 0.008 0.001 -0.000 0.000
inflation spillover (% p.a.) USA 0.009 0.000 0.001 -0.000 Europe -0.000 0.006 0.002 0.001 Japan 0.004 0.004 0.001 -0.001 Central America 0.004 0.004 0.001 0.000 Africa Low Income -0.004 0.019 -0.003 -0.000

DESA/DPAD GPM 3.0 User Guide Appendix A - F 81
Alphametrics Co., Ltd. October 2010
Impact of shock to CIS and Other real exchange rate in 2011 2011 2012 2014 2016
per cent change in each variable per 1% increase in CIS and Other real exchange rate
local GDP (%) -0.093 -0.051 -0.059 -0.055 consumption (% of GDP) -0.034 0.009 -0.018 -0.023 investment (% of GDP) -0.003 -0.013 -0.011 -0.010 govt net revenue (% of GDP) -0.026 -0.017 -0.010 -0.008 government spending (% of GDP) -0.002 -0.010 -0.016 -0.016 government debt (% of GDP) 0.083 0.058 0.037 0.015 current account (% of GDP) -0.035 -0.021 -0.004 0.000 real exchange rate (%) 0.962 0.339 0.036 -0.005 nominal change in $ rate (% p.a.) 0.939 -0.411 -0.066 -0.018 activity rate (%) -0.009 -0.009 -0.010 -0.010 employment (%) -0.009 -0.010 -0.010 -0.010 cost inflation (% p.a.) -0.076 -0.029 -0.002 0.008 price inflation (% p.a.) -0.005 -0.087 -0.008 0.009 real asset prices (%) -0.025 -0.036 -0.042 -0.017 interest rates (% p.a.) -0.012 -0.035 -0.018 0.002 real interest rates (% p.a.) -0.006 0.044 -0.009 -0.007 real bond rates (% p.a.) -0.000 0.000 -0.001 -0.000
world GDP (%) -0.002 -0.001 -0.001 -0.001 exports (%) 0.007 0.003 0.001 0.001 oil price (%) 0.036 0.019 0.011 0.009 employment (%) -0.000 -0.000 -0.000 -0.000 dollar inflation (% p.a.) 0.036 -0.019 -0.003 -0.001 domestic inflation (% p.a.) 0.001 -0.002 -0.000 0.000
GDP spillover (%) USA 0.001 0.001 0.001 0.001 Europe 0.005 0.003 0.002 0.002 Japan 0.001 0.002 0.002 0.002 China 0.006 0.003 0.003 0.002 Central America -0.001 0.000 0.001 0.001 Africa Low Income 0.002 0.001 0.002 0.003
current account spillover (% of GDP) USA 0.000 0.000 0.000 0.000 Europe 0.003 0.002 0.000 -0.000 Japan 0.000 0.000 0.000 -0.000 China 0.001 0.001 -0.000 -0.000 Central America 0.001 0.000 0.000 0.000 Africa Low Income 0.004 0.002 0.000 0.000
inflation spillover (% p.a.) USA 0.004 -0.000 -0.000 -0.000 Europe 0.001 0.002 0.000 -0.000 Japan 0.002 0.001 0.000 -0.000 China 0.001 0.003 0.000 -0.000 Central America 0.002 0.001 -0.000 -0.000 Africa Low Income -0.004 0.005 0.000 -0.000

DESA/DPAD GPM 3.0 User Guide Appendix A - F 82
Alphametrics Co., Ltd. October 2010
Impact of shock to South America real exchange rate in 2011 2011 2012 2014 2016
per cent change in each variable per 1% increase in South America real exchange rate
local GDP (%) -0.061 -0.058 -0.049 -0.046 consumption (% of GDP) -0.008 -0.007 -0.013 -0.017 investment (% of GDP) -0.004 -0.014 -0.012 -0.011 govt net revenue (% of GDP) -0.008 -0.010 -0.008 -0.007 government spending (% of GDP) -0.001 -0.002 -0.005 -0.007 government debt (% of GDP) 0.043 0.040 0.034 0.019 current account (% of GDP) -0.026 -0.017 -0.008 -0.004 real exchange rate (%) 0.939 0.381 0.052 -0.011 nominal change in $ rate (% p.a.) 0.978 -0.425 -0.091 -0.028 activity rate (%) -0.005 -0.007 -0.006 -0.006 employment (%) -0.005 -0.007 -0.006 -0.006 cost inflation (% p.a.) -0.074 -0.030 -0.001 0.009 price inflation (% p.a.) -0.078 -0.037 -0.000 0.011 real asset prices (%) -0.016 -0.030 -0.035 -0.014 interest rates (% p.a.) -0.031 -0.030 -0.015 0.003 real interest rates (% p.a.) 0.043 0.007 -0.013 -0.007 real bond rates (% p.a.) 0.001 -0.000 -0.001 -0.000
world GDP (%) 0.000 -0.001 -0.000 -0.000 exports (%) -0.002 -0.002 0.002 0.003 oil price (%) 0.008 0.002 0.008 0.007 employment (%) -0.000 -0.000 -0.000 -0.000 dollar inflation (% p.a.) 0.060 -0.032 -0.006 -0.002 domestic inflation (% p.a.) -0.002 -0.000 -0.000 0.000
GDP spillover (%) USA 0.006 0.004 0.002 0.002 Europe 0.001 0.002 0.003 0.003 Japan 0.001 0.002 0.003 0.004 China 0.006 0.003 0.005 0.004 Central America 0.010 0.006 0.004 0.003 Africa Low Income 0.004 0.002 0.001 0.002
current account spillover (% of GDP) USA 0.003 0.002 0.000 0.000 Europe 0.001 0.001 0.001 0.001 Japan 0.001 0.001 0.001 0.001 China 0.001 0.001 0.000 -0.000 Central America 0.004 0.002 0.000 -0.000 Africa Low Income 0.002 0.001 0.001 0.000
inflation spillover (% p.a.) USA 0.006 0.000 -0.000 -0.001 Europe 0.002 0.002 0.000 -0.000 Japan 0.001 0.002 0.000 -0.000 China 0.001 0.004 0.000 -0.000 Central America 0.006 0.001 -0.000 -0.001 Africa Low Income 0.005 0.002 0.000 -0.001

DESA/DPAD GPM 3.0 User Guide Appendix A - F 83
Alphametrics Co., Ltd. October 2010
Impact of shock to Africa Middle Income real exchange rate in 2011 2011 2012 2014 2016
per cent change in each variable per 1% increase in Africa Middle Income real exchange rate
local GDP (%) -0.109 -0.080 -0.076 -0.066 consumption (% of GDP) -0.033 -0.003 -0.025 -0.028 investment (% of GDP) -0.007 -0.024 -0.019 -0.017 govt net revenue (% of GDP) -0.026 -0.022 -0.013 -0.010 government spending (% of GDP) -0.002 -0.007 -0.012 -0.012 government debt (% of GDP) 0.064 0.034 0.014 0.003 current account (% of GDP) -0.048 -0.024 -0.003 0.001 real exchange rate (%) 0.981 0.366 0.039 -0.011 nominal change in $ rate (% p.a.) 0.936 -0.423 -0.071 -0.022 activity rate (%) -0.005 -0.006 -0.006 -0.006 employment (%) -0.005 -0.006 -0.006 -0.006 cost inflation (% p.a.) -0.093 -0.041 -0.006 0.012 price inflation (% p.a.) -0.046 -0.086 -0.011 0.014 real asset prices (%) -0.028 -0.047 -0.055 -0.021 interest rates (% p.a.) -0.025 -0.041 -0.022 0.004 real interest rates (% p.a.) 0.017 0.033 -0.010 -0.008 real bond rates (% p.a.) 0.000 0.001 -0.001 -0.000
world GDP (%) -0.001 -0.001 -0.001 -0.000 exports (%) 0.006 0.001 0.000 0.000 oil price (%) 0.020 0.004 0.005 0.004 employment (%) -0.000 -0.000 -0.000 -0.000 dollar inflation (% p.a.) 0.019 -0.010 -0.002 -0.001 domestic inflation (% p.a.) -0.001 -0.001 -0.000 0.000
GDP spillover (%) USA 0.001 0.001 0.001 0.000 Europe 0.003 0.002 0.002 0.001 Japan 0.001 0.001 0.001 0.001 China 0.003 0.001 0.002 0.002 Central America -0.000 0.000 0.001 0.001 Africa Low Income 0.002 0.002 0.003 0.002
current account spillover (% of GDP) USA 0.001 0.000 0.000 0.000 Europe 0.002 0.001 0.000 -0.000 Japan 0.000 0.000 0.000 0.000 China 0.001 0.000 -0.000 -0.000 Central America 0.001 0.000 0.000 0.000 Africa Low Income 0.002 0.001 0.000 0.000
inflation spillover (% p.a.) USA 0.002 -0.000 -0.000 -0.000 Europe 0.000 0.001 0.000 -0.000 Japan 0.001 0.000 0.000 -0.000 China 0.001 0.001 0.000 -0.000 Central America 0.001 0.001 0.000 -0.000 Africa Low Income -0.002 0.005 0.001 -0.000
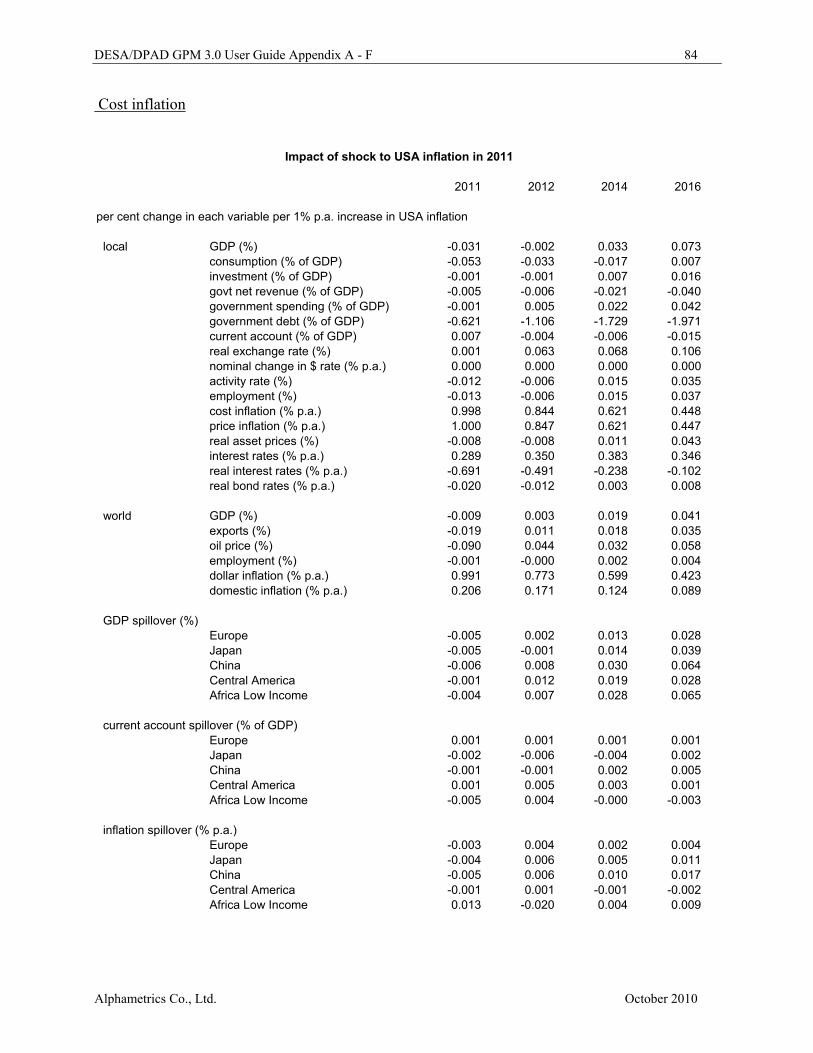
DESA/DPAD GPM 3.0 User Guide Appendix A - F 84
Alphametrics Co., Ltd. October 2010
Cost inflation
Impact of shock to USA inflation in 2011 2011 2012 2014 2016
per cent change in each variable per 1% p.a. increase in USA inflation
local GDP (%) -0.031 -0.002 0.033 0.073 consumption (% of GDP) -0.053 -0.033 -0.017 0.007 investment (% of GDP) -0.001 -0.001 0.007 0.016 govt net revenue (% of GDP) -0.005 -0.006 -0.021 -0.040 government spending (% of GDP) -0.001 0.005 0.022 0.042 government debt (% of GDP) -0.621 -1.106 -1.729 -1.971 current account (% of GDP) 0.007 -0.004 -0.006 -0.015 real exchange rate (%) 0.001 0.063 0.068 0.106 nominal change in $ rate (% p.a.) 0.000 0.000 0.000 0.000 activity rate (%) -0.012 -0.006 0.015 0.035 employment (%) -0.013 -0.006 0.015 0.037 cost inflation (% p.a.) 0.998 0.844 0.621 0.448 price inflation (% p.a.) 1.000 0.847 0.621 0.447 real asset prices (%) -0.008 -0.008 0.011 0.043 interest rates (% p.a.) 0.289 0.350 0.383 0.346 real interest rates (% p.a.) -0.691 -0.491 -0.238 -0.102 real bond rates (% p.a.) -0.020 -0.012 0.003 0.008
world GDP (%) -0.009 0.003 0.019 0.041 exports (%) -0.019 0.011 0.018 0.035 oil price (%) -0.090 0.044 0.032 0.058 employment (%) -0.001 -0.000 0.002 0.004 dollar inflation (% p.a.) 0.991 0.773 0.599 0.423 domestic inflation (% p.a.) 0.206 0.171 0.124 0.089
GDP spillover (%) Europe -0.005 0.002 0.013 0.028 Japan -0.005 -0.001 0.014 0.039 China -0.006 0.008 0.030 0.064 Central America -0.001 0.012 0.019 0.028 Africa Low Income -0.004 0.007 0.028 0.065
current account spillover (% of GDP) Europe 0.001 0.001 0.001 0.001 Japan -0.002 -0.006 -0.004 0.002 China -0.001 -0.001 0.002 0.005 Central America 0.001 0.005 0.003 0.001 Africa Low Income -0.005 0.004 -0.000 -0.003
inflation spillover (% p.a.) Europe -0.003 0.004 0.002 0.004 Japan -0.004 0.006 0.005 0.011 China -0.005 0.006 0.010 0.017 Central America -0.001 0.001 -0.001 -0.002 Africa Low Income 0.013 -0.020 0.004 0.009

DESA/DPAD GPM 3.0 User Guide Appendix A - F 85
Alphametrics Co., Ltd. October 2010
Impact of shock to China inflation in 2011 2011 2012 2014 2016
per cent change in each variable per 1% p.a. increase in China inflation
local GDP (%) 0.001 0.035 0.066 0.085 consumption (% of GDP) -0.037 -0.020 -0.024 -0.022 investment (% of GDP) 0.000 0.022 0.072 0.096 govt net revenue (% of GDP) 0.000 0.006 0.015 0.017 government spending (% of GDP) 0.000 0.000 -0.000 -0.001 government debt (% of GDP) 0.000 0.002 0.004 0.005 current account (% of GDP) -0.002 -0.009 -0.010 -0.009 real exchange rate (%) 0.000 0.044 -0.023 -0.036 nominal change in $ rate (% p.a.) -0.826 -0.674 -0.549 -0.381 activity rate (%) 0.000 0.002 0.005 0.007 employment (%) 0.000 0.002 0.005 0.007 cost inflation (% p.a.) 1.000 0.869 0.628 0.428 price inflation (% p.a.) 0.998 0.871 0.627 0.429 real asset prices (%) 0.000 0.009 0.031 0.040 interest rates (% p.a.) 0.280 0.347 0.376 0.325 real interest rates (% p.a.) -0.639 -0.464 -0.225 -0.096 real bond rates (% p.a.) -0.002 0.002 0.013 0.015
world GDP (%) 0.001 0.008 0.015 0.021 exports (%) 0.003 0.018 0.021 0.024 oil price (%) 0.004 0.044 0.016 0.014 employment (%) 0.000 0.001 0.002 0.002 dollar inflation (% p.a.) -0.000 0.004 -0.004 -0.002 domestic inflation (% p.a.) 0.137 0.127 0.102 0.077
GDP spillover (%) USA 0.000 0.001 0.002 0.003 Europe 0.001 0.003 0.006 0.007 Japan 0.002 0.007 0.010 0.012 Central America 0.000 0.001 0.003 0.004 Africa Low Income 0.000 0.002 0.004 0.005
current account spillover (% of GDP) USA 0.000 -0.000 0.001 0.001 Europe 0.000 0.001 0.003 0.003 Japan 0.001 0.002 0.005 0.006 Central America 0.000 0.001 0.001 0.001 Africa Low Income 0.000 0.003 0.001 0.000
inflation spillover (% p.a.) USA 0.000 0.002 -0.000 -0.000 Europe 0.000 0.001 0.000 0.000 Japan 0.000 0.002 0.001 0.001 Central America 0.000 0.000 0.000 0.000 Africa Low Income -0.001 -0.006 0.001 0.000

DESA/DPAD GPM 3.0 User Guide Appendix A - F 86
Alphametrics Co., Ltd. October 2010
Impact of shock to CIS and Other inflation in 2011 2011 2012 2014 2016
per cent change in each variable per 1% p.a. increase in CIS and Other inflation
local GDP (%) -0.020 -0.005 0.004 0.009 consumption (% of GDP) -0.034 -0.017 -0.016 -0.018 investment (% of GDP) -0.000 -0.001 0.002 0.004 govt net revenue (% of GDP) -0.004 -0.002 -0.001 -0.004 government spending (% of GDP) -0.000 0.003 0.010 0.019 government debt (% of GDP) -0.087 -0.154 -0.253 -0.293 current account (% of GDP) 0.002 -0.002 -0.001 -0.001 real exchange rate (%) -0.000 0.040 -0.003 -0.008 nominal change in $ rate (% p.a.) -0.700 -0.526 -0.401 -0.272 activity rate (%) -0.002 -0.001 0.000 0.001 employment (%) -0.002 -0.001 0.000 0.001 cost inflation (% p.a.) 0.998 0.825 0.552 0.344 price inflation (% p.a.) 0.981 0.825 0.548 0.343 real asset prices (%) -0.005 -0.006 -0.001 0.008 interest rates (% p.a.) 0.242 0.294 0.325 0.277 real interest rates (% p.a.) -0.545 -0.388 -0.182 -0.064 real bond rates (% p.a.) -0.018 -0.011 0.004 0.009
world GDP (%) -0.001 0.000 0.000 0.001 exports (%) -0.001 0.001 0.001 0.001 oil price (%) -0.002 0.006 0.001 0.001 employment (%) -0.000 -0.000 0.000 0.000 dollar inflation (% p.a.) 0.000 0.001 -0.000 -0.000 domestic inflation (% p.a.) 0.041 0.035 0.024 0.015
GDP spillover (%) USA -0.000 0.000 0.000 0.000 Europe -0.000 0.000 0.000 0.000 Japan -0.000 0.000 0.000 0.000 China -0.001 0.001 0.000 0.000 Central America -0.000 -0.000 0.000 0.000 Africa Low Income -0.000 0.000 0.000 0.000
current account spillover (% of GDP) USA 0.000 -0.000 0.000 0.000 Europe -0.000 0.000 0.000 0.000 Japan -0.000 -0.000 0.000 0.000 China -0.000 0.000 0.000 0.000 Central America -0.000 0.000 0.000 0.000 Africa Low Income -0.000 0.000 0.000 0.000
inflation spillover (% p.a.) USA -0.000 0.000 -0.000 -0.000 Europe -0.000 0.000 0.000 0.000 Japan -0.000 0.000 0.000 0.000 China -0.000 0.000 0.000 0.000 Central America 0.000 0.000 -0.000 -0.000 Africa Low Income 0.000 -0.001 0.000 0.000

DESA/DPAD GPM 3.0 User Guide Appendix A - F 87
Alphametrics Co., Ltd. October 2010
Impact of shock to South America inflation in 2011 2011 2012 2014 2016
per cent change in each variable per 1% p.a. increase in South America inflation
local GDP (%) -0.027 -0.005 0.012 0.025 consumption (% of GDP) -0.040 -0.020 -0.016 -0.015 investment (% of GDP) -0.001 -0.003 0.006 0.011 govt net revenue (% of GDP) -0.006 -0.003 -0.003 -0.007 government spending (% of GDP) -0.000 0.003 0.013 0.024 government debt (% of GDP) -0.204 -0.340 -0.474 -0.491 current account (% of GDP) 0.003 -0.002 -0.003 -0.003 real exchange rate (%) -0.000 0.044 -0.002 -0.011 nominal change in $ rate (% p.a.) -0.754 -0.573 -0.454 -0.317 activity rate (%) -0.002 -0.001 0.001 0.002 employment (%) -0.002 -0.001 0.001 0.002 cost inflation (% p.a.) 0.998 0.846 0.588 0.391 price inflation (% p.a.) 0.994 0.845 0.588 0.391 real asset prices (%) -0.007 -0.008 0.003 0.018 interest rates (% p.a.) 0.285 0.347 0.378 0.330 real interest rates (% p.a.) -0.605 -0.427 -0.197 -0.071 real bond rates (% p.a.) -0.016 -0.012 0.001 0.006
world GDP (%) -0.002 -0.000 0.001 0.002 exports (%) -0.002 0.001 0.001 0.002 oil price (%) -0.004 0.006 0.002 0.001 employment (%) -0.000 -0.000 0.000 0.000 dollar inflation (% p.a.) 0.000 0.003 -0.001 -0.000 domestic inflation (% p.a.) 0.059 0.050 0.035 0.023
GDP spillover (%) USA -0.000 0.000 0.000 0.000 Europe -0.000 0.000 0.000 0.001 Japan -0.000 0.000 0.000 0.001 China -0.001 0.001 0.001 0.001 Central America -0.001 0.001 0.001 0.001 Africa Low Income -0.000 0.000 0.000 0.000
current account spillover (% of GDP) USA -0.000 0.000 0.000 0.000 Europe -0.000 -0.000 0.000 0.000 Japan -0.000 -0.000 0.000 0.000 China -0.000 0.000 0.000 0.000 Central America -0.000 0.000 0.000 0.000 Africa Low Income -0.000 0.000 0.000 0.000
inflation spillover (% p.a.) USA -0.000 0.001 -0.000 -0.000 Europe -0.000 0.000 0.000 0.000 Japan -0.000 0.000 0.000 0.000 China -0.000 0.001 0.000 0.000 Central America 0.000 0.000 0.000 0.000 Africa Low Income 0.001 -0.001 0.000 0.000

DESA/DPAD GPM 3.0 User Guide Appendix A - F 88
Alphametrics Co., Ltd. October 2010
Impact of shock to Africa Middle Income inflation in 2011 2011 2012 2014 2016
per cent change in each variable per 1% p.a. increase in Africa Middle Income inflation
local GDP (%) -0.013 -0.001 0.014 0.026 consumption (% of GDP) -0.027 -0.014 -0.009 -0.007 investment (% of GDP) -0.000 0.000 0.008 0.012 govt net revenue (% of GDP) -0.003 -0.000 0.002 0.001 government spending (% of GDP) -0.000 0.002 0.009 0.018 government debt (% of GDP) -0.113 -0.185 -0.261 -0.262 current account (% of GDP) 0.001 -0.004 -0.004 -0.004 real exchange rate (%) -0.000 0.033 -0.005 -0.013 nominal change in $ rate (% p.a.) -0.563 -0.438 -0.338 -0.235 activity rate (%) -0.001 -0.000 0.001 0.002 employment (%) -0.001 -0.000 0.001 0.002 cost inflation (% p.a.) 0.998 0.850 0.560 0.350 price inflation (% p.a.) 0.974 0.845 0.555 0.349 real asset prices (%) -0.003 -0.003 0.005 0.016 interest rates (% p.a.) 0.213 0.262 0.280 0.238 real interest rates (% p.a.) -0.465 -0.341 -0.171 -0.073 real bond rates (% p.a.) -0.022 -0.017 -0.002 0.004
world GDP (%) -0.000 0.000 0.001 0.001 exports (%) -0.000 0.001 0.001 0.001 oil price (%) -0.001 0.003 0.001 0.000 employment (%) -0.000 0.000 0.000 0.000 dollar inflation (% p.a.) 0.000 0.001 -0.000 -0.000 domestic inflation (% p.a.) 0.024 0.021 0.014 0.009
GDP spillover (%) USA -0.000 0.000 0.000 0.000 Europe -0.000 0.000 0.000 0.001 Japan -0.000 0.000 0.000 0.000 China -0.000 0.000 0.001 0.001 Central America -0.000 0.000 0.000 0.000 Africa Low Income -0.000 0.000 0.000 0.000
current account spillover (% of GDP) USA -0.000 -0.000 0.000 0.000 Europe -0.000 0.000 0.000 0.000 Japan -0.000 -0.000 0.000 0.000 China -0.000 0.000 0.000 0.000 Central America -0.000 0.000 0.000 0.000 Africa Low Income -0.000 0.000 0.000 0.000
inflation spillover (% p.a.) USA -0.000 0.000 -0.000 -0.000 Europe -0.000 0.000 0.000 0.000 Japan -0.000 0.000 0.000 0.000 China -0.000 0.000 0.000 0.000 Central America 0.000 0.000 0.000 0.000 Africa Low Income 0.000 -0.001 0.000 0.000

DESA/DPAD GPM 3.0 User Guide Appendix A - F 89
Alphametrics Co., Ltd. October 2010
Policy rate
Impact of shock to USA short-term interest rate in 2011 2011 2012 2014 2016
per cent change in each variable per 1% p.a. increase in USA short-term interest rate
local GDP (%) -0.017 -0.102 -0.166 -0.188 consumption (% of GDP) -0.004 -0.080 -0.141 -0.161 investment (% of GDP) -0.001 -0.006 -0.023 -0.029 govt net revenue (% of GDP) -0.003 -0.024 -0.048 -0.047 government spending (% of GDP) -0.000 -0.003 -0.007 -0.012 government debt (% of GDP) 0.003 0.025 0.101 0.167 current account (% of GDP) 0.005 0.022 0.028 0.029 real exchange rate (%) 0.001 0.005 0.017 0.026 nominal change in $ rate (% p.a.) 0.000 0.000 0.000 0.000 activity rate (%) -0.007 -0.043 -0.088 -0.103 employment (%) -0.007 -0.045 -0.093 -0.114 cost inflation (% p.a.) -0.001 -0.008 -0.023 -0.023 price inflation (% p.a.) -0.003 -0.013 -0.022 -0.023 real asset prices (%) -0.004 -0.031 -0.093 -0.110 interest rates (% p.a.) 0.998 0.722 0.372 0.189 real interest rates (% p.a.) 0.986 0.727 0.388 0.209 real bond rates (% p.a.) 0.035 0.048 0.025 0.013
world GDP (%) -0.006 -0.030 -0.049 -0.057 exports (%) -0.012 -0.055 -0.052 -0.052 oil price (%) -0.041 -0.205 -0.117 -0.102 employment (%) -0.000 -0.003 -0.005 -0.006 dollar inflation (% p.a.) -0.003 -0.017 -0.027 -0.027 domestic inflation (% p.a.) -0.000 -0.002 -0.006 -0.006
GDP spillover (%) Europe -0.002 -0.010 -0.017 -0.022 Japan -0.002 -0.011 -0.018 -0.022 China -0.005 -0.023 -0.034 -0.040 Central America -0.005 -0.020 -0.033 -0.040 Africa Low Income -0.002 -0.007 -0.017 -0.026
current account spillover (% of GDP) Europe -0.001 -0.002 -0.007 -0.009 Japan -0.000 0.000 -0.006 -0.008 China -0.000 -0.001 -0.003 -0.004 Central America -0.001 -0.007 -0.009 -0.008 Africa Low Income -0.003 -0.014 -0.007 -0.005
inflation spillover (% p.a.) Europe -0.001 -0.006 -0.002 -0.003 Japan -0.002 -0.008 -0.003 -0.003 China -0.003 -0.011 -0.006 -0.005 Central America -0.001 -0.003 -0.005 -0.004 Africa Low Income 0.006 0.023 -0.006 -0.005

DESA/DPAD GPM 3.0 User Guide Appendix A - F 90
Alphametrics Co., Ltd. October 2010
Impact of shock to China short-term interest rate in 2011 2011 2012 2014 2016
per cent change in each variable per 1% p.a. increase in China short-term interest rate
local GDP (%) -0.020 -0.112 -0.189 -0.224 consumption (% of GDP) -0.005 -0.073 -0.097 -0.111 investment (% of GDP) -0.006 -0.034 -0.107 -0.132 govt net revenue (% of GDP) -0.004 -0.023 -0.042 -0.045 government spending (% of GDP) -0.000 -0.001 -0.001 -0.000 government debt (% of GDP) -0.001 -0.007 -0.012 -0.015 current account (% of GDP) 0.003 0.014 0.020 0.018 real exchange rate (%) -0.001 -0.001 0.037 0.059 nominal change in $ rate (% p.a.) 0.000 0.012 0.049 0.040 activity rate (%) -0.001 -0.006 -0.014 -0.020 employment (%) -0.001 -0.006 -0.014 -0.020 cost inflation (% p.a.) -0.001 -0.010 -0.033 -0.031 price inflation (% p.a.) -0.001 -0.010 -0.032 -0.032 real asset prices (%) -0.005 -0.032 -0.092 -0.106 interest rates (% p.a.) 0.997 0.728 0.367 0.180 real interest rates (% p.a.) 0.943 0.691 0.371 0.200 real bond rates (% p.a.) 0.034 0.048 0.025 0.012
world GDP (%) -0.004 -0.021 -0.040 -0.052 exports (%) -0.008 -0.038 -0.048 -0.053 oil price (%) -0.024 -0.106 -0.061 -0.045 employment (%) -0.000 -0.002 -0.004 -0.005 dollar inflation (% p.a.) 0.000 0.003 0.005 0.004 domestic inflation (% p.a.) -0.000 -0.001 -0.006 -0.006
GDP spillover (%) USA -0.000 -0.002 -0.004 -0.005 Europe -0.001 -0.006 -0.011 -0.014 Japan -0.002 -0.010 -0.018 -0.022 Central America -0.001 -0.003 -0.006 -0.008 Africa Low Income -0.001 -0.004 -0.009 -0.013
current account spillover (% of GDP) USA 0.000 0.001 -0.001 -0.001 Europe -0.000 -0.002 -0.005 -0.006 Japan -0.000 -0.002 -0.008 -0.010 Central America -0.000 -0.001 -0.001 -0.001 Africa Low Income -0.002 -0.007 -0.003 -0.001
inflation spillover (% p.a.) USA -0.001 -0.003 0.000 0.001 Europe -0.001 -0.003 -0.001 -0.001 Japan -0.001 -0.004 -0.002 -0.001 Central America -0.000 -0.000 -0.000 -0.000 Africa Low Income 0.004 0.013 -0.002 -0.001

DESA/DPAD GPM 3.0 User Guide Appendix A - F 91
Alphametrics Co., Ltd. October 2010
Impact of shock to CIS and Other short-term interest rate in 2011 2011 2012 2014 2016
per cent change in each variable per 1% p.a. increase in CIS and Other short-term interest rate
local GDP (%) -0.011 -0.065 -0.102 -0.116 consumption (% of GDP) -0.003 -0.063 -0.102 -0.113 investment (% of GDP) -0.001 -0.005 -0.017 -0.022 govt net revenue (% of GDP) -0.002 -0.016 -0.031 -0.033 government spending (% of GDP) -0.000 -0.001 -0.002 -0.004 government debt (% of GDP) 0.000 0.005 0.040 0.075 current account (% of GDP) 0.003 0.012 0.016 0.016 real exchange rate (%) -0.000 0.002 0.021 0.036 nominal change in $ rate (% p.a.) -0.000 0.006 0.026 0.024 activity rate (%) -0.001 -0.007 -0.015 -0.019 employment (%) -0.001 -0.007 -0.015 -0.019 cost inflation (% p.a.) -0.001 -0.006 -0.022 -0.021 price inflation (% p.a.) 0.000 -0.004 -0.023 -0.021 real asset prices (%) -0.003 -0.020 -0.056 -0.065 interest rates (% p.a.) 0.999 0.726 0.378 0.187 real interest rates (% p.a.) 0.895 0.642 0.356 0.191 real bond rates (% p.a.) 0.031 0.044 0.023 0.011
world GDP (%) -0.001 -0.004 -0.007 -0.008 exports (%) -0.002 -0.006 -0.006 -0.006 oil price (%) -0.003 -0.009 0.002 0.006 employment (%) -0.000 -0.000 -0.001 -0.001 dollar inflation (% p.a.) 0.000 0.001 0.001 0.000 domestic inflation (% p.a.) -0.000 -0.001 -0.001 -0.001
GDP spillover (%) USA -0.000 -0.000 -0.001 -0.001 Europe -0.001 -0.002 -0.003 -0.004 Japan -0.000 -0.001 -0.002 -0.002 China -0.001 -0.003 -0.004 -0.004 Central America -0.000 -0.001 -0.001 -0.001 Africa Low Income -0.000 -0.001 -0.001 -0.001
current account spillover (% of GDP) USA 0.000 -0.000 -0.000 -0.001 Europe -0.000 -0.001 -0.002 -0.002 Japan -0.000 -0.000 -0.001 -0.001 China -0.000 -0.000 -0.001 -0.001 Central America -0.000 -0.000 -0.000 -0.000 Africa Low Income -0.000 -0.001 0.000 0.000
inflation spillover (% p.a.) USA -0.000 -0.000 0.000 0.000 Europe -0.000 -0.000 -0.000 -0.000 Japan -0.000 -0.000 -0.000 -0.000 China -0.000 -0.001 -0.000 -0.000 Central America 0.000 0.000 0.000 -0.000 Africa Low Income 0.001 0.001 -0.000 -0.000

DESA/DPAD GPM 3.0 User Guide Appendix A - F 92
Alphametrics Co., Ltd. October 2010
Impact of shock to South America short-term interest rate in 2011 2011 2012 2014 2016
per cent change in each variable per 1% p.a. increase in South America short-term interest rate
local GDP (%) -0.015 -0.082 -0.138 -0.158 consumption (% of GDP) -0.004 -0.068 -0.116 -0.132 investment (% of GDP) -0.002 -0.009 -0.032 -0.040 govt net revenue (% of GDP) -0.003 -0.020 -0.039 -0.041 government spending (% of GDP) -0.000 -0.001 -0.004 -0.007 government debt (% of GDP) 0.001 0.013 0.051 0.082 current account (% of GDP) 0.003 0.012 0.017 0.017 real exchange rate (%) -0.000 0.002 0.021 0.036 nominal change in $ rate (% p.a.) -0.000 0.007 0.031 0.029 activity rate (%) -0.001 -0.007 -0.016 -0.019 employment (%) -0.001 -0.008 -0.016 -0.019 cost inflation (% p.a.) -0.001 -0.008 -0.027 -0.027 price inflation (% p.a.) -0.000 -0.006 -0.028 -0.027 real asset prices (%) -0.004 -0.025 -0.075 -0.088 interest rates (% p.a.) 0.998 0.733 0.372 0.183 real interest rates (% p.a.) 0.891 0.653 0.357 0.193 real bond rates (% p.a.) 0.030 0.042 0.022 0.011
world GDP (%) -0.001 -0.007 -0.011 -0.013 exports (%) -0.002 -0.007 -0.007 -0.007 oil price (%) -0.004 -0.013 0.001 0.005 employment (%) -0.000 -0.001 -0.001 -0.001 dollar inflation (% p.a.) -0.000 0.000 0.001 0.001 domestic inflation (% p.a.) -0.000 -0.001 -0.002 -0.002
GDP spillover (%) USA -0.000 -0.001 -0.002 -0.003 Europe -0.000 -0.002 -0.003 -0.004 Japan -0.000 -0.002 -0.003 -0.003 China -0.001 -0.004 -0.006 -0.006 Central America -0.001 -0.002 -0.004 -0.005 Africa Low Income -0.000 -0.001 -0.002 -0.003
current account spillover (% of GDP) USA -0.000 -0.000 -0.001 -0.001 Europe -0.000 -0.001 -0.002 -0.002 Japan -0.000 -0.000 -0.001 -0.002 China -0.000 -0.000 -0.001 -0.001 Central America -0.000 -0.001 -0.001 -0.001 Africa Low Income -0.000 -0.001 -0.000 0.000
inflation spillover (% p.a.) USA -0.000 -0.000 0.000 -0.000 Europe -0.000 -0.000 -0.000 -0.000 Japan -0.000 -0.001 -0.000 -0.000 China -0.000 -0.001 -0.001 -0.000 Central America -0.000 -0.000 -0.000 -0.000 Africa Low Income 0.001 0.001 -0.001 -0.001

DESA/DPAD GPM 3.0 User Guide Appendix A - F 93
Alphametrics Co., Ltd. October 2010
Impact of shock to Africa Middle Income short-term interest rate in 2011 2011 2012 2014 2016
per cent change in each variable per 1% p.a. increase in Africa Middle Income short-term interest rate
local GDP (%) -0.012 -0.066 -0.108 -0.122 consumption (% of GDP) -0.003 -0.062 -0.103 -0.114 investment (% of GDP) -0.002 -0.008 -0.027 -0.032 govt net revenue (% of GDP) -0.002 -0.017 -0.035 -0.037 government spending (% of GDP) -0.000 -0.001 -0.002 -0.003 government debt (% of GDP) -0.001 0.000 0.038 0.078 current account (% of GDP) 0.003 0.013 0.018 0.018 real exchange rate (%) -0.000 0.002 0.023 0.039 nominal change in $ rate (% p.a.) 0.000 0.008 0.028 0.026 activity rate (%) -0.001 -0.003 -0.007 -0.009 employment (%) -0.001 -0.003 -0.007 -0.009 cost inflation (% p.a.) -0.001 -0.007 -0.026 -0.026 price inflation (% p.a.) -0.000 -0.007 -0.027 -0.026 real asset prices (%) -0.003 -0.020 -0.060 -0.070 interest rates (% p.a.) 0.998 0.731 0.370 0.183 real interest rates (% p.a.) 0.871 0.618 0.332 0.180 real bond rates (% p.a.) 0.032 0.046 0.025 0.013
world GDP (%) -0.000 -0.002 -0.004 -0.005 exports (%) -0.001 -0.004 -0.004 -0.004 oil price (%) -0.002 -0.006 -0.000 0.002 employment (%) -0.000 -0.000 -0.000 -0.000 dollar inflation (% p.a.) 0.000 0.000 0.000 0.000 domestic inflation (% p.a.) -0.000 -0.001 -0.001 -0.001
GDP spillover (%) USA -0.000 -0.000 -0.001 -0.001 Europe -0.000 -0.001 -0.002 -0.002 Japan -0.000 -0.001 -0.001 -0.001 China -0.000 -0.002 -0.002 -0.003 Central America -0.000 -0.000 -0.001 -0.001 Africa Low Income -0.000 -0.001 -0.001 -0.001
current account spillover (% of GDP) USA 0.000 -0.000 -0.000 -0.000 Europe -0.000 -0.001 -0.001 -0.001 Japan -0.000 -0.000 -0.001 -0.001 China -0.000 -0.000 -0.000 -0.000 Central America -0.000 -0.000 -0.000 -0.000 Africa Low Income -0.000 -0.001 -0.000 0.000
inflation spillover (% p.a.) USA -0.000 -0.000 0.000 0.000 Europe -0.000 -0.000 -0.000 -0.000 Japan -0.000 -0.000 -0.000 -0.000 China -0.000 -0.000 -0.000 -0.000 Central America -0.000 -0.000 -0.000 -0.000 Africa Low Income 0.000 0.001 -0.000 -0.000

DESA/DPAD GPM 3.0 User Guide Appendix A - F 94
Alphametrics Co., Ltd. October 2010
Energy use
Impact of shock to USA energy use in 2011 2011 2012 2014 2016
per cent change in each variable per 1% increase in USA energy use
local GDP (%) -0.057 -0.028 -0.066 -0.077 consumption (% of GDP) -0.053 -0.003 -0.042 -0.052 investment (% of GDP) -0.002 -0.007 -0.009 -0.011 govt net revenue (% of GDP) -0.037 -0.019 -0.016 -0.016 government spending (% of GDP) -0.004 -0.010 -0.015 -0.018 government debt (% of GDP) -0.012 0.002 0.009 0.012 current account (% of GDP) -0.115 -0.040 -0.024 -0.018 real exchange rate (%) 0.009 -0.047 -0.036 -0.037 nominal change in $ rate (% p.a.) 0.000 0.000 0.000 0.000 activity rate (%) -0.023 -0.023 -0.041 -0.049 employment (%) -0.024 -0.025 -0.044 -0.055 cost inflation (% p.a.) 0.038 0.001 -0.007 -0.007 price inflation (% p.a.) 0.177 -0.096 -0.004 -0.009 real asset prices (%) -0.015 -0.021 -0.038 -0.036 interest rates (% p.a.) 0.047 -0.016 -0.007 -0.006 real interest rates (% p.a.) -0.127 0.080 -0.004 0.002 real bond rates (% p.a.) -0.004 0.001 -0.000 -0.000
world GDP (%) -0.003 0.000 0.004 0.008 exports (%) 0.725 0.178 0.128 0.103 oil price (%) 4.122 0.982 0.641 0.499 employment (%) -0.001 -0.000 -0.000 0.000 dollar inflation (% p.a.) 0.167 -0.039 -0.008 -0.008 domestic inflation (% p.a.) 0.017 0.039 0.005 0.007
GDP spillover (%) Europe 0.008 0.016 -0.000 0.003 Japan -0.006 0.014 -0.017 -0.015 China 0.051 0.083 0.034 0.034 Central America -0.034 -0.006 -0.014 -0.017 Africa Low Income 0.050 -0.010 0.121 0.143
current account spillover (% of GDP) Europe -0.059 -0.011 0.002 0.004 Japan -0.121 -0.023 -0.009 -0.004 China -0.031 -0.009 0.001 0.001 Central America -0.007 -0.001 -0.002 -0.002 Africa Low Income 0.253 0.048 0.010 -0.000
inflation spillover (% p.a.) Europe 0.126 -0.061 0.003 -0.004 Japan 0.166 -0.099 0.001 -0.006 China 0.162 -0.072 0.010 -0.007 Central America 0.040 0.006 -0.002 -0.002 Africa Low Income -0.621 0.536 -0.002 0.030

DESA/DPAD GPM 3.0 User Guide Appendix A - F 95
Alphametrics Co., Ltd. October 2010
Impact of shock to China energy use in 2011 2011 2012 2014 2016
per cent change in each variable per 1% increase in China energy use
local GDP (%) -0.020 0.000 -0.018 -0.019 consumption (% of GDP) -0.016 0.020 -0.002 -0.006 investment (% of GDP) -0.004 -0.008 -0.012 -0.011 govt net revenue (% of GDP) -0.011 -0.004 -0.006 -0.005 government spending (% of GDP) -0.001 -0.002 -0.003 -0.003 government debt (% of GDP) -0.004 -0.001 -0.003 -0.004 current account (% of GDP) -0.019 -0.011 -0.007 -0.005 real exchange rate (%) 0.001 -0.033 -0.027 -0.025 nominal change in $ rate (% p.a.) -0.001 -0.020 0.004 0.000 activity rate (%) -0.001 -0.001 -0.002 -0.002 employment (%) -0.001 -0.001 -0.002 -0.003 cost inflation (% p.a.) 0.015 0.003 -0.001 -0.001 price inflation (% p.a.) 0.055 -0.026 0.001 -0.001 real asset prices (%) -0.005 -0.004 -0.009 -0.007 interest rates (% p.a.) 0.014 -0.003 -0.000 0.000 real interest rates (% p.a.) -0.038 0.022 -0.002 0.001 real bond rates (% p.a.) -0.000 -0.000 -0.000 -0.000
world GDP (%) -0.004 -0.002 -0.001 -0.000 exports (%) 0.228 0.067 0.054 0.049 oil price (%) 1.289 0.366 0.277 0.248 employment (%) -0.000 -0.000 -0.000 -0.000 dollar inflation (% p.a.) 0.050 -0.012 -0.001 -0.001 domestic inflation (% p.a.) 0.005 0.012 0.002 0.003
GDP spillover (%) USA -0.007 0.002 -0.007 -0.009 Europe 0.002 0.005 -0.000 0.001 Japan -0.003 0.003 -0.007 -0.007 Central America -0.011 -0.003 -0.005 -0.006 Africa Low Income 0.015 -0.002 0.040 0.050
current account spillover (% of GDP) USA -0.028 -0.007 -0.003 -0.002 Europe -0.019 -0.005 -0.001 0.000 Japan -0.039 -0.010 -0.006 -0.005 Central America -0.003 -0.001 -0.001 -0.000 Africa Low Income 0.079 0.018 0.007 0.004
inflation spillover (% p.a.) USA 0.052 -0.026 0.001 -0.001 Europe 0.040 -0.017 0.002 -0.000 Japan 0.052 -0.029 0.001 -0.001 Central America 0.013 0.002 -0.000 -0.000 Africa Low Income -0.196 0.159 -0.002 0.009

DESA/DPAD GPM 3.0 User Guide Appendix A - F 96
Alphametrics Co., Ltd. October 2010
Impact of shock to CIS and Other energy use in 2011 2011 2012 2014 2016
per cent change in each variable per 1% increase in CIS and Other energy use
local GDP (%) -0.002 0.001 0.008 0.011 consumption (% of GDP) 0.002 -0.005 -0.001 -0.002 investment (% of GDP) -0.000 -0.000 0.001 0.002 govt net revenue (% of GDP) 0.001 -0.002 -0.002 -0.001 government spending (% of GDP) 0.000 0.000 -0.001 -0.002 government debt (% of GDP) -0.000 -0.000 0.002 0.000 current account (% of GDP) 0.003 -0.005 -0.004 -0.002 real exchange rate (%) 0.000 0.002 -0.005 -0.006 nominal change in $ rate (% p.a.) 0.008 -0.018 -0.004 -0.003 activity rate (%) -0.000 0.000 0.001 0.001 employment (%) -0.000 0.000 0.001 0.001 cost inflation (% p.a.) 0.001 -0.002 0.001 0.002 price inflation (% p.a.) -0.008 0.022 0.001 0.002 real asset prices (%) -0.000 -0.000 0.004 0.007 interest rates (% p.a.) -0.002 0.005 0.003 0.003 real interest rates (% p.a.) 0.005 -0.014 0.002 0.001 real bond rates (% p.a.) 0.000 -0.000 0.000 0.000
world GDP (%) -0.000 0.000 -0.000 -0.000 exports (%) 0.011 -0.008 -0.010 -0.012 oil price (%) 0.042 -0.068 -0.085 -0.093 employment (%) -0.000 0.000 0.000 -0.000 dollar inflation (% p.a.) 0.002 -0.003 -0.001 -0.001 domestic inflation (% p.a.) 0.000 0.000 -0.001 -0.001
GDP spillover (%) USA -0.000 0.000 0.000 0.001 Europe 0.000 0.000 -0.000 -0.000 Japan 0.000 0.000 -0.000 0.000 China 0.001 0.000 -0.002 -0.003 Central America -0.001 -0.000 -0.001 -0.001 Africa Low Income 0.000 -0.001 -0.002 -0.006
current account spillover (% of GDP) USA -0.001 0.002 0.002 0.002 Europe -0.001 0.001 0.001 0.001 Japan -0.001 0.002 0.002 0.002 China -0.000 0.001 0.001 0.000 Central America -0.001 -0.000 -0.000 -0.000 Africa Low Income 0.003 -0.004 -0.004 -0.004
inflation spillover (% p.a.) USA 0.002 -0.004 -0.001 -0.001 Europe 0.001 -0.003 -0.001 -0.001 Japan 0.002 -0.004 -0.001 -0.001 China 0.002 -0.004 -0.001 -0.001 Central America 0.001 -0.001 -0.001 -0.001 Africa Low Income -0.007 0.017 -0.000 -0.000
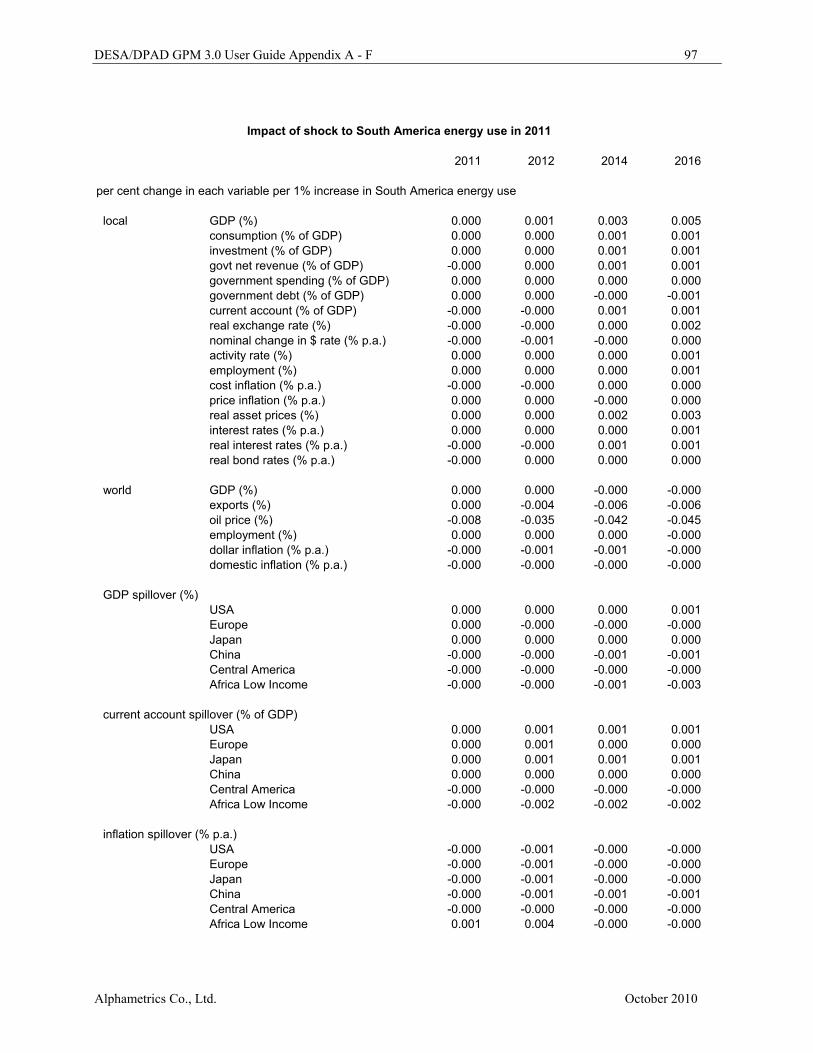
DESA/DPAD GPM 3.0 User Guide Appendix A - F 97
Alphametrics Co., Ltd. October 2010
Impact of shock to South America energy use in 2011 2011 2012 2014 2016
per cent change in each variable per 1% increase in South America energy use
local GDP (%) 0.000 0.001 0.003 0.005 consumption (% of GDP) 0.000 0.000 0.001 0.001 investment (% of GDP) 0.000 0.000 0.001 0.001 govt net revenue (% of GDP) -0.000 0.000 0.001 0.001 government spending (% of GDP) 0.000 0.000 0.000 0.000 government debt (% of GDP) 0.000 0.000 -0.000 -0.001 current account (% of GDP) -0.000 -0.000 0.001 0.001 real exchange rate (%) -0.000 -0.000 0.000 0.002 nominal change in $ rate (% p.a.) -0.000 -0.001 -0.000 0.000 activity rate (%) 0.000 0.000 0.000 0.001 employment (%) 0.000 0.000 0.000 0.001 cost inflation (% p.a.) -0.000 -0.000 0.000 0.000 price inflation (% p.a.) 0.000 0.000 -0.000 0.000 real asset prices (%) 0.000 0.000 0.002 0.003 interest rates (% p.a.) 0.000 0.000 0.000 0.001 real interest rates (% p.a.) -0.000 -0.000 0.001 0.001 real bond rates (% p.a.) -0.000 0.000 0.000 0.000
world GDP (%) 0.000 0.000 -0.000 -0.000 exports (%) 0.000 -0.004 -0.006 -0.006 oil price (%) -0.008 -0.035 -0.042 -0.045 employment (%) 0.000 0.000 0.000 -0.000 dollar inflation (% p.a.) -0.000 -0.001 -0.001 -0.000 domestic inflation (% p.a.) -0.000 -0.000 -0.000 -0.000
GDP spillover (%) USA 0.000 0.000 0.000 0.001 Europe 0.000 -0.000 -0.000 -0.000 Japan 0.000 0.000 0.000 0.000 China -0.000 -0.000 -0.001 -0.001 Central America -0.000 -0.000 -0.000 -0.000 Africa Low Income -0.000 -0.000 -0.001 -0.003
current account spillover (% of GDP) USA 0.000 0.001 0.001 0.001 Europe 0.000 0.001 0.000 0.000 Japan 0.000 0.001 0.001 0.001 China 0.000 0.000 0.000 0.000 Central America -0.000 -0.000 -0.000 -0.000 Africa Low Income -0.000 -0.002 -0.002 -0.002
inflation spillover (% p.a.) USA -0.000 -0.001 -0.000 -0.000 Europe -0.000 -0.001 -0.000 -0.000 Japan -0.000 -0.001 -0.000 -0.000 China -0.000 -0.001 -0.001 -0.001 Central America -0.000 -0.000 -0.000 -0.000 Africa Low Income 0.001 0.004 -0.000 -0.000

DESA/DPAD GPM 3.0 User Guide Appendix A - F 98
Alphametrics Co., Ltd. October 2010
Impact of shock to Africa Middle Income energy use in 2011 2011 2012 2014 2016
per cent change in each variable per 1% increase in Africa Middle Income energy use
local GDP (%) -0.004 -0.002 0.003 0.005 consumption (% of GDP) 0.001 -0.002 -0.000 0.000 investment (% of GDP) -0.000 -0.001 0.000 0.001 govt net revenue (% of GDP) 0.001 -0.001 -0.000 0.000 government spending (% of GDP) 0.000 0.000 -0.000 -0.000 government debt (% of GDP) 0.000 -0.001 0.001 0.000 current account (% of GDP) 0.002 -0.001 -0.001 0.000 real exchange rate (%) 0.000 0.002 -0.001 -0.001 nominal change in $ rate (% p.a.) 0.007 -0.007 -0.001 -0.001 activity rate (%) -0.000 -0.000 0.000 0.000 employment (%) -0.000 -0.000 0.000 0.000 cost inflation (% p.a.) 0.001 -0.001 0.000 0.001 price inflation (% p.a.) -0.007 0.010 -0.000 0.001 real asset prices (%) -0.001 -0.001 0.001 0.003 interest rates (% p.a.) -0.002 0.002 0.001 0.002 real interest rates (% p.a.) 0.004 -0.007 0.001 0.000 real bond rates (% p.a.) 0.000 -0.000 0.000 0.000
world GDP (%) -0.000 0.000 -0.000 -0.000 exports (%) 0.009 -0.002 -0.003 -0.003 oil price (%) 0.045 -0.016 -0.023 -0.026 employment (%) -0.000 0.000 -0.000 -0.000 dollar inflation (% p.a.) 0.002 -0.002 -0.000 -0.000 domestic inflation (% p.a.) 0.000 0.000 -0.000 -0.000
GDP spillover (%) USA -0.000 0.000 -0.000 0.000 Europe 0.000 0.000 -0.000 -0.000 Japan -0.000 0.000 -0.000 0.000 China 0.001 0.001 -0.000 -0.001 Central America -0.001 -0.000 -0.000 -0.000 Africa Low Income 0.000 -0.000 0.000 -0.001
current account spillover (% of GDP) USA -0.001 0.000 0.001 0.001 Europe -0.001 0.000 0.000 0.000 Japan -0.001 0.001 0.001 0.001 China -0.000 0.000 0.000 0.000 Central America -0.000 -0.000 -0.000 -0.000 Africa Low Income 0.003 -0.001 -0.001 -0.001
inflation spillover (% p.a.) USA 0.002 -0.002 -0.000 -0.000 Europe 0.001 -0.002 -0.000 -0.000 Japan 0.002 -0.002 -0.000 -0.000 China 0.002 -0.002 -0.000 -0.000 Central America 0.001 -0.000 -0.000 -0.000 Africa Low Income -0.007 0.010 -0.000 0.000