Embed Size (px)
Citation preview
Global Perspectives in Early Childhood Development:
Promoting Equity Begins at HomeMaureen Black, Ph.D.RTI International
andDepartment of Pediatrics
University of Maryland School of [email protected]

Dr. Paul A Harper
• Pediatrician• Population Dynamics• Bangladesh – family planning• Visionary: child development and preventive health • Preventive Pediatrics, Child Health and Development• Maternal and Child Health

3
This image cannot currently be displayed.
This image ca
Advancing Early Childhood Development: from Science to Scale
History
Child survival movement. Multiple interventions throughout the world.
2003
2013The Lancet
Decline from 10.8 million deaths in 2000 to 7.6 million in 2010
The Lancet
Where and why are 10 million childrendying every year?

Millennium Development Goals (MDGs)
Successful global anti‐poverty agenda. 1990‐2015:• Extreme poverty cut in half• Primary education enrollment 90%• Gender equality primary education• 17,000 fewer children die/day • Maternal mortality reduced 45%• 9.7 million receive tx for HIV; 3.3
million malaria deaths prevented• 2.3 billion gained clean water• Debt service declines, trade increases
http://www.un.org/millenniumgoals/mdgmomentum.shtml
No mention of Early Child Development

Over 200 million children under 5 years of age in LMICs are not fulfilling their developmental potential based on proxy measures (stunting & poverty)
2007
2011
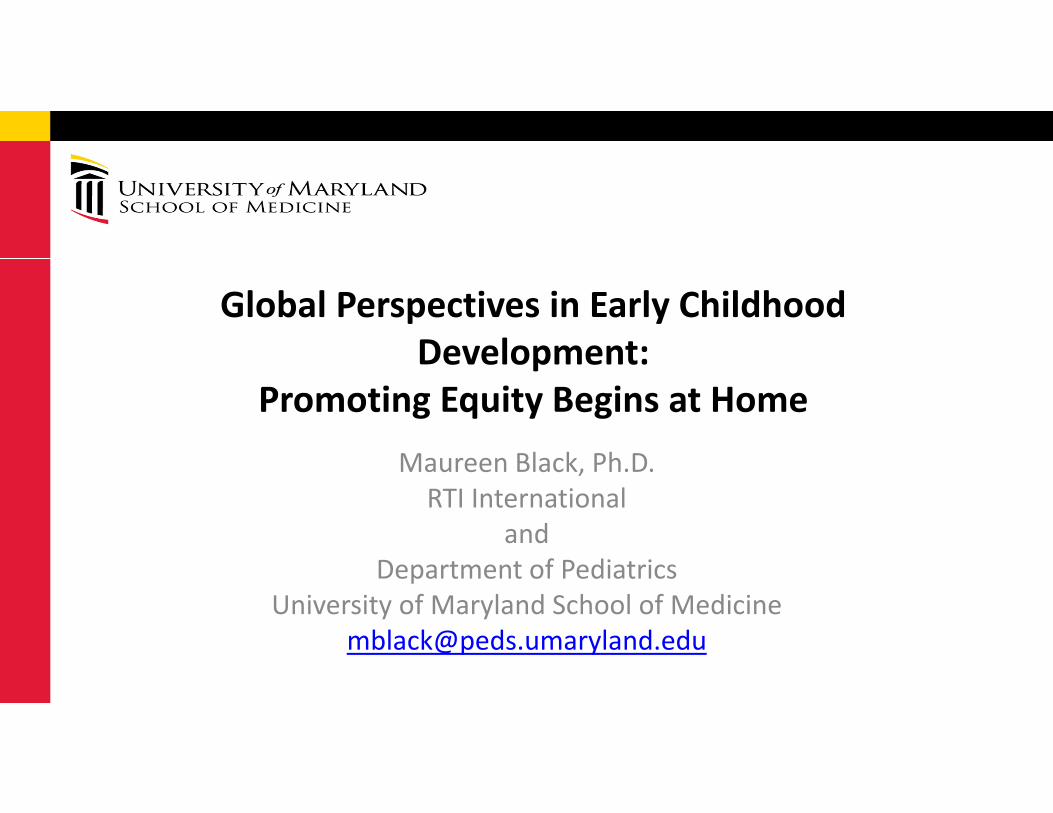
Momentum is growing
• Since The Lancet published the landmark series, Child Development in Developing Countries in 2007 and 2011
Scientific publications increased up to 7-fold Funding increased
Early Child Development actors increasede.g. economists
One-third of countries adopted policies
Global support for Early Child
Development
2000 2015

www.thelancet.com/series/ECD2016
Early Childhood Development: From Science To Scale
3 papers, plus 8 commentaries & notes (2016)
Margaret Chan, WHOAnthony Lake, UNICEF
Jim Yong Kim, The World Bank GroupBan Ki-Moon, United Nations

What’s new? 2016 Early Child Development Series Science
- Focus on young children – conception to age 3y- Life‐course approach- Nurturing care
Policies- Updated estimates of the burden: 249 million children (43%)- Cost of inaction- Widespread endorsement as strategy to achieve Sustainable Development Goals (SDGs)

Brain Architecture• Dynamic interaction: genetic influences &
environmental conditions (plasticity)• Experience Expectant
• Environmental information that is species‐specific and “expected” for brain development
• Nutrition• Neural tube closure (22 days) Folic acid, B‐12
• Experience Dependent • Environmental information that is unique to the
individual• Specific language

Brain Development and Timing
Neuron Proliferation
Prenatal through 4‐5 months post partum
Axon & Dendrite growth
~15weeks gestation – 24 months post partum
Synapse Formation, Pruning & Function
~23 weeks gestation throughout lifespan
Myelination
~12‐14 weeks gestation through adulthood
Apoptosis programmed cell death
Gestation through adolescence
Prado & Dewey, 2014


Environment In infancy / childhood
PregnancyEnvironment
Parents’ Health/Wellbeing Pre-pregnancy Health
Learning
Behavior
Quality of early environments shape a child’s future potential
Genetic Blueprint for Development
Environments Across the Life-course

Foetal development
Infant & child growth &
development
Adolescent education and
health
Adult health and human
capital
Inter-generational
effects
Interactions Across The Life-course
Foundations for healthy & productive life
set in early childhood

2014 Science: Effects of Early Child Development on Adult Health & Earnings
Building blocks of adult health, earnings, & well-being based in early child development
Campbell Science 2014 Gertler Science 2014
North Carolina35 years
Beneficial effects on blood pressure,
metabolic syndrome
Jamaica 25 years
Beneficial effects on wages

Development
Variations in Genetic
Sequence
Environment
Epigenetic Modification
Adult Health and WellbeingCardiovascular disease
Obesity/diabetesMental health
Cognitive functionBehaviour/social function
Gene environment interactions underlie developmental programming

Life Course Perspective to Child Development
Birth
Early Childhood
Childhood
Adolescence
Conception
Healthy nutrition and learning opportunities throughout life
Adulthood
Black et al., Lancet, 2017

Life Course Perspective to Child Development
Birth
Early Childhood
Childhood
Adolescence
Conception
Healthy nutrition and learning opportunities throughout life
Adulthood
Chronic health problemsLimited economic potential

Life-span development of equity

Nurturing Care Promotes Equity Nurturing care promotes early child development
Nutrition Health care Responsive caregiving Protection from danger Opportunities to explore, learn and discover
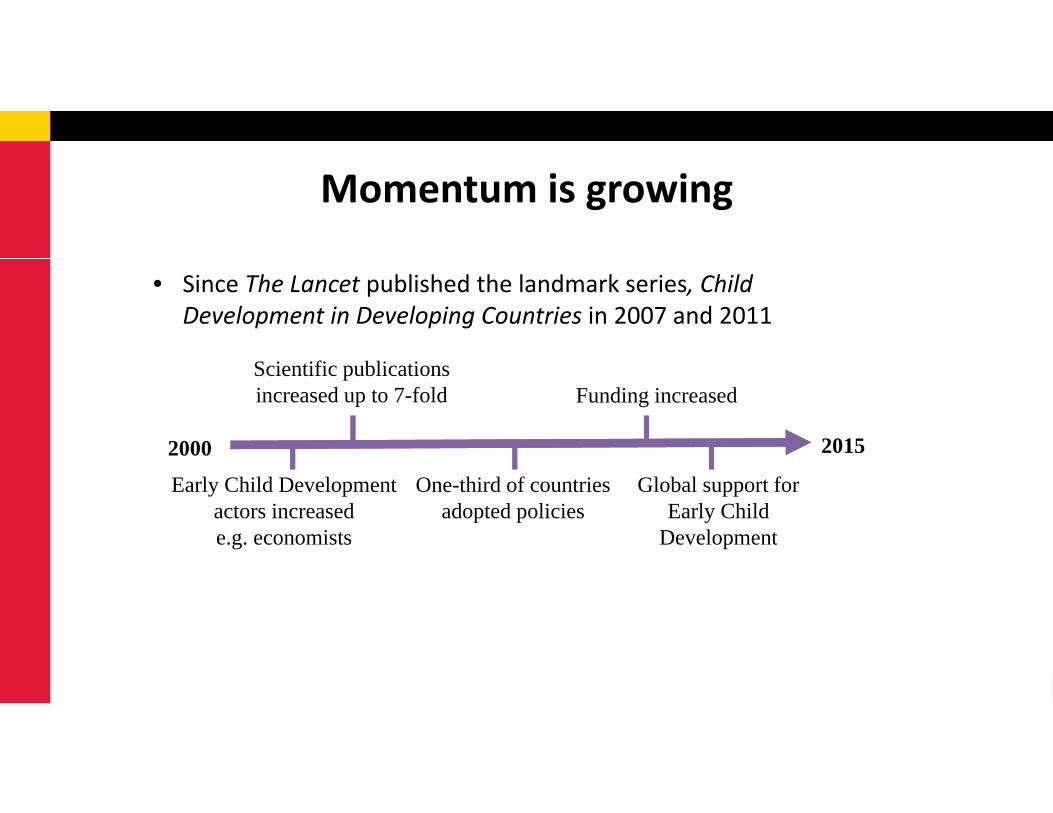
Nurturing care is fostered by a supportive environment
Nurturing care: parents & caregivers

Nurturing care is fostered by a supportive environment – the ecological model
Capacity for nurturing care
Nurturing care: parents & caregivers

Nurturing care is fostered by a supportive environment – the ecological model
Early Child DevelopmentPrograms
Capacity for nurturing care
Nurturing care: parents & caregivers
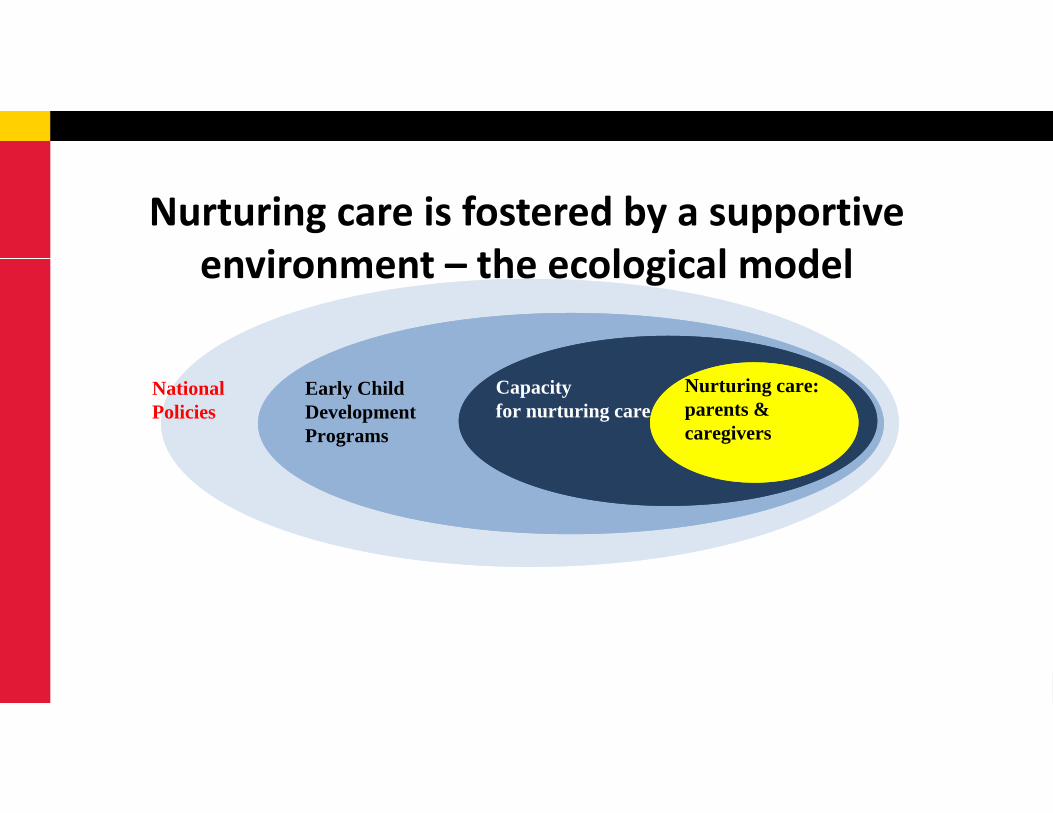
Nurturing care is fostered by a supportive environment – the ecological model
National Policies
Early Child DevelopmentPrograms
Capacity for nurturing care
Nurturing care: parents & caregivers

The personal cost of inaction in grades and earnings lost
Grade Deficit Income Loss Children
Stunted only 4.67 42.3% 106.5m (18.5%)
Poor only 0.71 5.8% 75.6m (13.1%)
Stunted and poor 6.56 32.4% 67.2m (11.7%)
249.3m (43.3%)

Cost of inaction in grades and earnings lost
43% of children in LMICs (249 million)lose 26.6% of average adult income
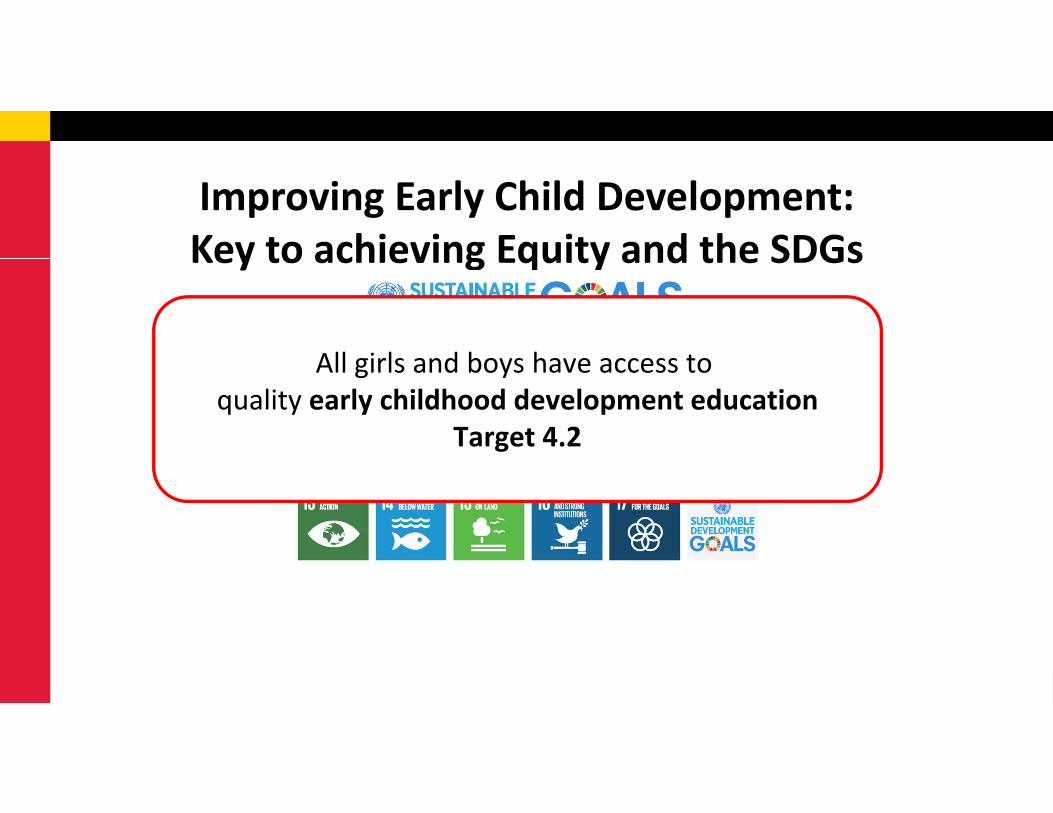
Improving Early Child Development:Key to achieving Equity and the SDGs
All girls and boys have access to quality early childhood development education
Target 4.2

Preparation for Sustainable Development Goals
1. Direct Measurement of Early Child Development
• Caregiver Report• Direct observation/testing
On and off track2. Scaling Up

Early Childhood Development Standards for 0‐3 years
• WHO growth standards (height & weight) adopted by > 140 countries
• Global standards for early child development (age 0‐3)
• Partnership:• 0‐3 WHO Developmental Indicators group• Harvard CREDI group• Global Child Development Group

Early Child Development StandardsHealthy children from 8 low‐, middle‐, & high‐income
countries, representing multiple regions
1. Two psychometrically‐strong instruments:• Brief instrument to monitor child development at population level
• Longer instrument to monitor program effectiveness• Standard Operating Procedures (SOP)• Quality Assurance Procedures

Early Child Development StandardsHealthy children from 8 low‐, middle‐, & high‐income
countries, representing multiple regions
2. Global population‐level standards:• On track/off‐track
3. Implementation, Dissemination & Capacity Building• Public access to the instruments and standards• Global Monitoring Report on Early Child Development• Training courses (SOPs, quality assurance, data processing, interpretation, and application)

Scaling Up Effective Interventions to Support Nurturing Care
• Policies to support families • Integrate with existing services (e.g., health care)
• Expand from medical model to include:• breast and complementary feeding• responsive caregiving• child protection• opportunities to explore and learn

32
This image cannot currently be displayed.
This image ca
Christopher AndersenJere BehrmanZulfiqar BhuttaMaureen BlackPia BrittoAdrian Cerezo Margaret ChanBernadette DaelmansGary DarmstadtPamela DasAmanda DevercelliAnn DiGirolamoTarun DuaLia Fernald Günther FinkNathaniel FootePaul GertlerSally Grantham-McGregor
Keith HansenMark HansonJody HeymannRichard HortonPatrick Ip Anthony LakeJames LeckmanSelina LoJoan LombardiFlorencia Lopez BooChunling LuJane Lucas Stephen LyeGraca MachelHarriet MacMilanStephen Matthews Dana Charles McCoyRafael Perez-Escamilla
Kerrie Proulx James RadnerNirmala RaoLinda Richter Yusra ShawarJeremy ShiffmanJack ShonkoffKarin StenbergElizabeth TablanteMark Tomlinson Tyler VaivadaEmily Vargas-BaronTed WachsSusan WalkerQuentin WodonHaogen YaoHiro Yoshikawa Aisha Yousafzai
Authors
Disciplines: Biology, Epidemiology, Economics, Education, Developmental Psychology, Genetics, Pediatrics, Psychiatry, Public Health, Political Science, Nursing, Neuroscience, Statistics, Sociology, Nutrition, Global Health
Donors: Bill & Melinda Gates Foundation, Hilton Foundation
www.thelancet.com/series/ECD2016

Children’s HealthWatch• Personal Responsibility and Work Opportunity Reconciliation Act of 1996
(welfare reform). What happens to young kids??• How policies and economic conditions relate to health of low‐income children
and families (Medicaid).• Ongoing cross‐sectional survey administered to caregivers of children < age 4 in
emergency departments and primary care clinics at 5 urban medical centers (Baltimore, Boston, Little Rock, Minneapolis, Philadelphia).
• All centers have Grow Clinics to care for underweight children
www.childrenshealthwatch.org
1998 Today

Material Hardships & Child Health> 60,000 children (age 0‐3)
• Food insecurity (USDA 18‐item Household Food Security Scale)• Increased risk of poor/fair health, developmental risk, prior hospitalization
• No relation to underweight or overweight • Increased risk of maternal depressive symptoms, poor/fair health
• Housing insecurity• Increased risk of poor/fair health, developmental risk, low weight‐for‐age
Food & housing insecurity are health risksFood insecurity is invisible!
Hidden HungerMust ask to identify
www.childrenshealthwatch.org

Food Insecurity Mechanisms
• Episodic ‐ anxiety
• Cut quality
• Cut quantity
Stress
Nutrition

Children’s HealthWatch (2009‐2015)
0
10
20
30
<13 mo 13‐24 mo 25‐36 mo 37‐48 mo
Percent
Obesity Underweight
23,820 children; 6601 (28%) from Food Insecure households.

Children’s HealthWatch (2009‐2015)23,820 children; 6601 (28%) from Food Insecure households.

Food Insecurity Prevalence 2006-2015

Food Insecurity in Baltimore
Food Insecurity in Baltimore Policy Brief
Develop Food Insecurity Screen

2‐item Screening Questions (Hunger Vital Sign)1. We worried whether our food would run out before we got money to buy more
2. The food we bought just didn’t last and we didn’t have money to get more
_____Often True_____Sometimes True_____Never True
Anxiety
Access
Families “at risk for food insecurity” if they answer “sometimes true” or “often true” to either or both statementsChildren age 0‐3: sensitivity 97% and specificity 83%Hager ER, Quigg A, Black MM. Pediatrics, 2010; 126(1):e26‐32.

Convergent Validity of ScreenScreen HFSS p
Child health (fair/poor) 1.56 1.73 <.001
Child hospitalizations 1.17 1.19 <.001
Developmental risk 1.60 1.72 <.001
Caregiver health (fair/poor)
1.99 2.29 <.001
Caregiver depressive symptoms
2.76 3.13 <.001
Adjusted for site, race/ethnicity, US born mother vs. immigrant, marital status, education, child gender, caregiver employment, breastfeeding, LBW
Odds Ratios

Gitterman, Pediatrics, 2015

Additional validations of 2‐item Screen for Food Insecurity
• Adolescents (sensitivity 88% and specificity 84%).• Baer TE, Scherer EA, Fleegler EW, Hassan A. Journal of Adolescent Health. 2015;57(6):601‐7.
• Adults (sensitivity 97% and specificity 74%).• Gundersen C, Engelhard EE, Crumbaugh AS, Seligman HK. Public Health Nutr. 2017 Feb 20:1‐5.
[Epub ahead of print]

2015 Civil Unrest in Baltimore
• April 12: Freddie Gray was arrested by Baltimore police officers • While in a police vehicle, he sustained neck and spinal injuries
• April 19: Freddie Gray died• Protests citing racism and social injustice
• Violence erupted: fires and property destruction

Proximal and Distal Neighborhoods
Map from the Maryland Department of Planning
Univ of MD Medical System
Civil Unrest SiteProximalNeighborhoods

Q1 Q2 Q3 Q42015
Jan 2014‐Dec 2015N=1,095
Prior(Jan 2014‐Mar 2015)
Acute(Apr‐Aug)
Following(Sep‐Dec)
Civil unrest
Add survey(Jun‐Oct)N=137
Q1 Q2 Q3 Q42014
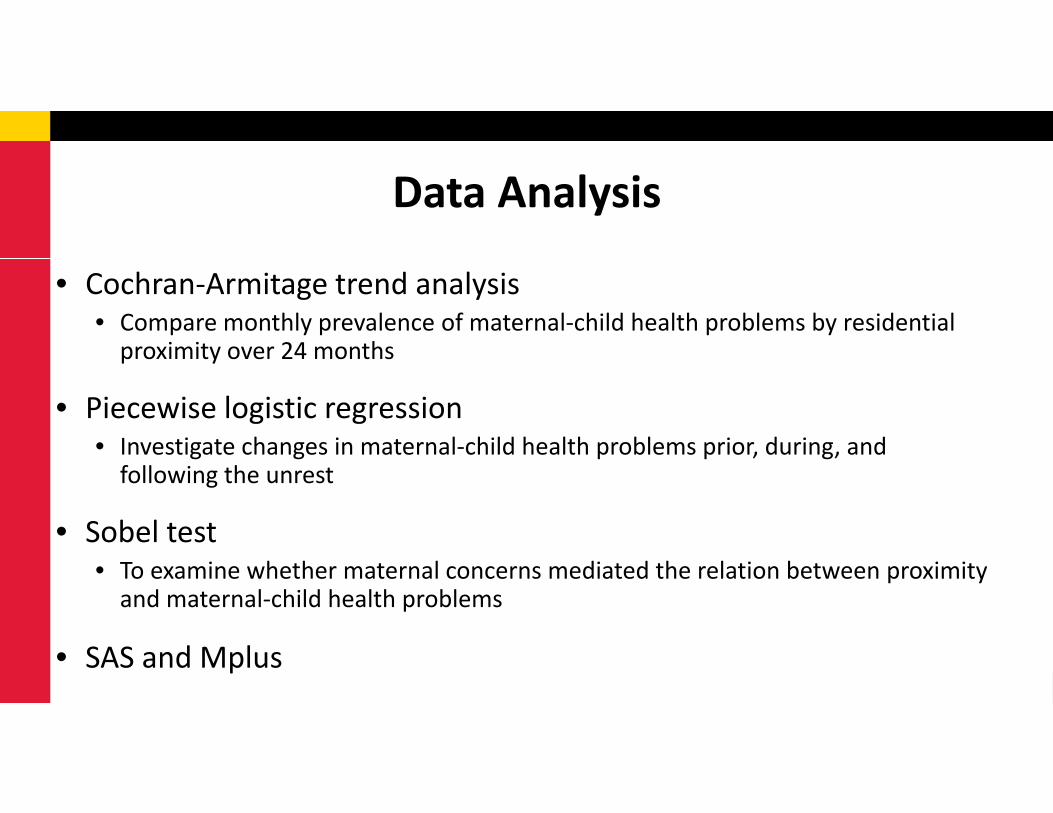
Data Analysis
• Cochran‐Armitage trend analysis• Compare monthly prevalence of maternal‐child health problems by residential proximity over 24 months
• Piecewise logistic regression• Investigate changes in maternal‐child health problems prior, during, and following the unrest
• Sobel test• To examine whether maternal concerns mediated the relation between proximity and maternal‐child health problems
• SAS and Mplus

Sample Characteristics by Residential Proximity (N=1,095)
* p<0.05, **p<0.01
49
9
26
9183
44
20 23
44
6
26
94
76
41
23 24
0102030405060708090
100
<12 months Fair/poorhealth
Mean age Black/AA* HSgraduates**
Employed Depressed Fair/poorhealth
Child Mother
Percent
Distal Proximal

Monthly Prevalence of Maternal Depressive Symptoms by Residential Proximity
0
10
20
30
40
50
60
Jan‐14
Feb‐14
Mar‐14
Apr‐14
May‐14
Jun‐14
Jul‐1
4
Aug‐14
Sep‐14
Oct‐14
Nov
‐14
Dec‐14
Jan‐15
Feb‐15
Mar‐15
Apr‐15
May‐15
Jun‐15
Jul‐1
5
Aug‐15
Sep‐15
Oct‐15
Nov
‐15
Dec‐15
Prior Acute Period Following
Prevalen
ce
Distal Proximal

Path Model of Residential Proximity on Maternal Depressive Symptoms via Maternal Concerns
Concerns regarding daily/community routines
Residential proximity
Maternal depressive symptoms
Note. Indirect effect via maternal concerns is a*b=0.18, SE=0.11, p<0.10; based on Sobel test and adjusted for child sex. *p<0.05, **p<0.01
a= 0.63 (0.23)** b= 0.28 (0.14)*
c= 0.29 (0.22)
c’=0.11 (0.24)

Summary
• Prior to civil unrest, rates of depressive symptoms ~ 20%.
• Residential proximity to civil unrest: increased likelihood of depressive symptoms during acute period, reaching up to 50%.
• 5 months after civil unrest, maternal depressive symptoms returned to prior rates.
• Maternal concerns regarding daily/community routines partial (not full) explanation for relation between residential proximity and maternal depressive symptoms.

Implications• Civil unrest often reflects social injustice/lack of equity.
• Reduce social injustice by providing basic resources for low‐income communities and families (housing, food, etc.)
• Maternal depressive symptoms can undermine maternal well‐being and negatively impact parenting among young children.
• Policies and programs to protect mothers and children from community violence.
• Surveillance of maternal mental health, services as needed.In press American Journal of Public Health

Ecological Perspective to Equity
Family
Child
Bronfenbrenner, 1979

Ecological Perspective to Equity
Policy
Community
Family
Child
Bronfenbrenner, 1979

Ecological Perspective to Equity
Policy
Community
Family
Child
REA
CH
Bronfenbrenner, 1979
SUST
AIN
AB
ILIT
Y

NICHDNIDDKNIDANIMHMCHUSDACDCGerber FoundationKellogg FoundationMathile InstituteMicronutrient InitiativeWilson Foundation

Thank You!