Embed Size (px)
DESCRIPTION
Global Peace Index
Citation preview

www.economicsandpeace.org
www.economicsandpeace.org
Steve Killelea
Chairman, Institute for Economics and Peace
Thursday 28th October 2010
Rapperswil, Switzerland
www.economicsandpeace.org
What Does IEP Do?
PolicyPromote and inform public debate with a view to impact public policy by providing an accessible and high quality forum for discussion through debates, seminars, lectures, dialogues and conferences.
EducationPresent educators with solid empirical data to further study the impacts of peace on economies. Stimulate the study of the issues by others, and help draw the work of those in related fields.
AnalysisLead research and rigorous theoretical and empirical analysis around the economies of peace and the Peace Industry. Collaborate with experts internationally.
ConsultingDevelop strategic expertise in the area of peace economics, and conduct client sponsored research for commercial businesses, foundations and other organizations.
E-publishingPublish research results and policy recommendations widely and freely, including annual release of the Global Peace Index.

www.economicsandpeace.org
Motivation for focus on Peace
Major challenge facing humanity is
sustainability
Challenges are global, urgent and require
unparalleled co-operation
Peace is the prerequisite for solving these
problems
www.economicsandpeace.org
Why an Index?
Never been done before
Peace is poorly understood
Peace should and can be measured
Through measuring peace its texture can be
analysed
www.economicsandpeace.org
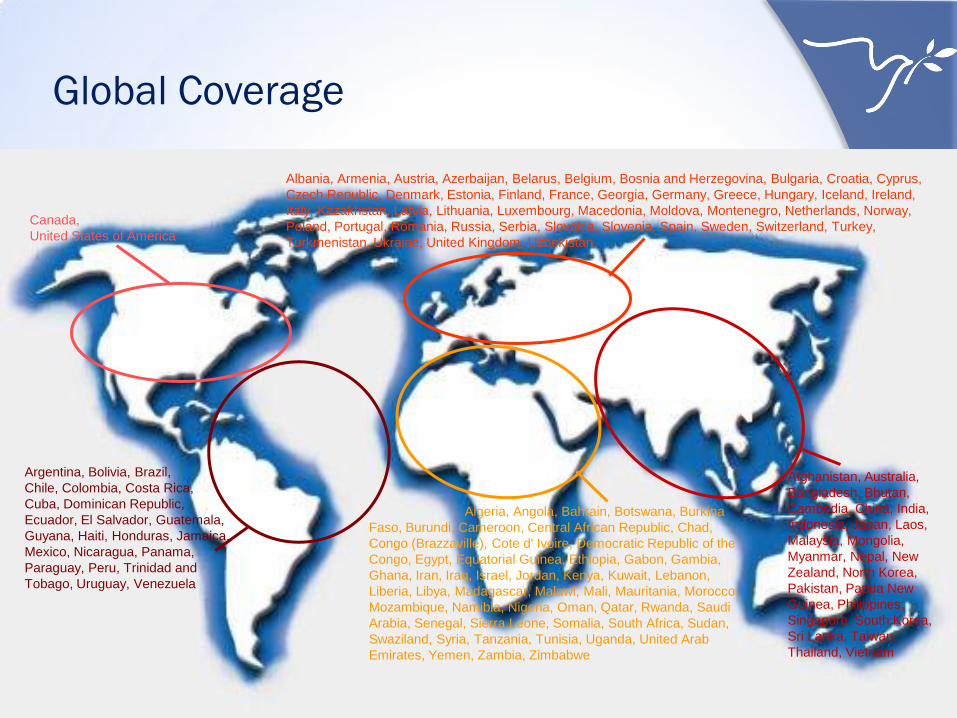
Global Coverage
Argentina, Bolivia, Brazil,
Chile, Colombia, Costa Rica,
Cuba, Dominican Republic,
Ecuador, El Salvador, Guatemala,
Guyana, Haiti, Honduras, Jamaica,
Mexico, Nicaragua, Panama,
Paraguay, Peru, Trinidad and
Tobago, Uruguay, Venezuela
Albania, Armenia, Austria, Azerbaijan, Belarus, Belgium, Bosnia and Herzegovina, Bulgaria, Croatia, Cyprus,
Czech Republic, Denmark, Estonia, Finland, France, Georgia, Germany, Greece, Hungary, Iceland, Ireland,
Italy, Kazakhstan, Latvia, Lithuania, Luxembourg, Macedonia, Moldova, Montenegro, Netherlands, Norway,
Poland, Portugal, Romania, Russia, Serbia, Slovakia, Slovenia, Spain, Sweden, Switzerland, Turkey,
Turkmenistan, Ukraine, United Kingdom, Uzbekistan
Canada,
United States of America
Afghanistan, Australia,
Bangladesh, Bhutan,
Cambodia, China, India,
Indonesia, Japan, Laos,
Malaysia, Mongolia,
Myanmar, Nepal, New
Zealand, North Korea,
Pakistan, Papua New
Guinea, Philippines,
Singapore, South Korea,
Sri Lanka, Taiwan,
Thailand, Vietnam
Algeria, Angola, Bahrain, Botswana, Burkina
Faso, Burundi, Cameroon, Central African Republic, Chad,
Congo (Brazzaville), Cote d' Ivoire, Democratic Republic of the
Congo, Egypt, Equatorial Guinea, Ethiopia, Gabon, Gambia,
Ghana, Iran, Iraq, Israel, Jordan, Kenya, Kuwait, Lebanon,
Liberia, Libya, Madagascar, Malawi, Mali, Mauritania, Morocco,
Mozambique, Namibia, Nigeria, Oman, Qatar, Rwanda, Saudi
Arabia, Senegal, Sierra Leone, Somalia, South Africa, Sudan,
Swaziland, Syria, Tanzania, Tunisia, Uganda, United Arab
Emirates, Yemen, Zambia, Zimbabwe
www.economicsandpeace.org
Defining Peace
Peace is more than the absence of war. The
perfect state would have no police, jails or
crime
Defined peace as the “Absence of Violence”
This definition allows for measurements of
both internal and external peacefulness
“Positive Peace” is uncovered via the
correlation of other data sets and indexes
www.economicsandpeace.org
The Global Peace Index
Now in its fourth year
Ranks 149 nations (up from 121 in 2007)
Data widely used including by World Bank,
UNDP, national governments
Widely covered by international media
including BBC World News, Bloomberg,
Guardian
Visits to www.visionofhumanity.org doubled
since last year
www.economicsandpeace.org
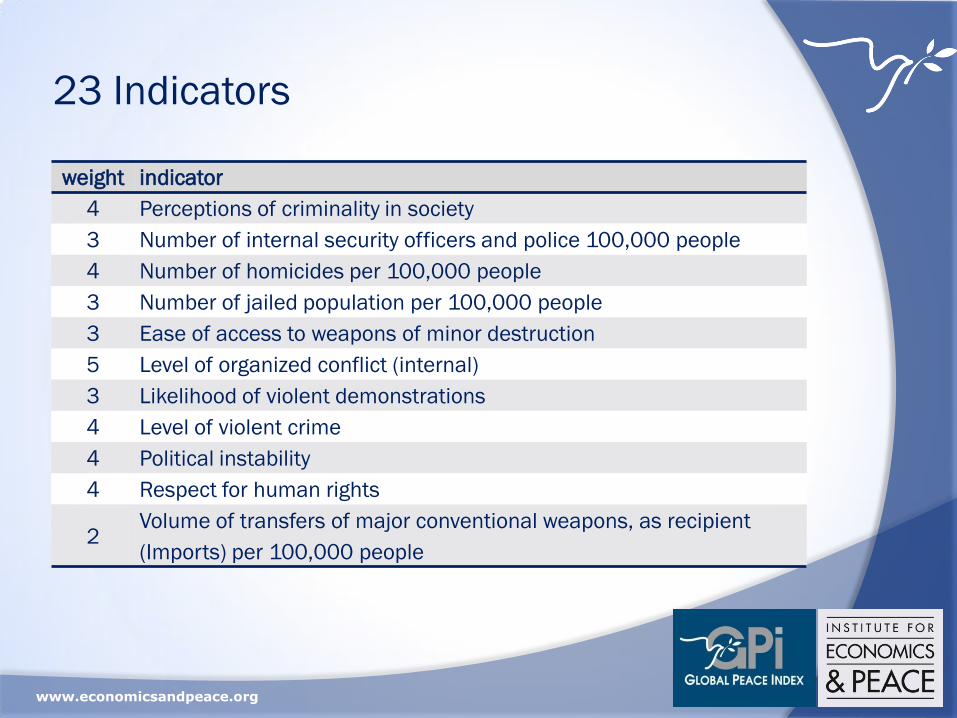
23 Indicators
Uses both quantitative and qualitative
indicators
Sourced from highly respected organisations
Estimated by EIU analysts where data is
missing
Weighted on a 1-5 scale
Overall score weighted 60% for internal peace
and 40% for external peace
www.economicsandpeace.org
23 Indicators
weight indicator
4 Perceptions of criminality in society
3 Number of internal security officers and police 100,000 people
4 Number of homicides per 100,000 people
3 Number of jailed population per 100,000 people
3 Ease of access to weapons of minor destruction
5 Level of organized conflict (internal)
3 Likelihood of violent demonstrations
4 Level of violent crime
4 Political instability
4 Respect for human rights
2Volume of transfers of major conventional weapons, as recipient
(Imports) per 100,000 people
www.economicsandpeace.org
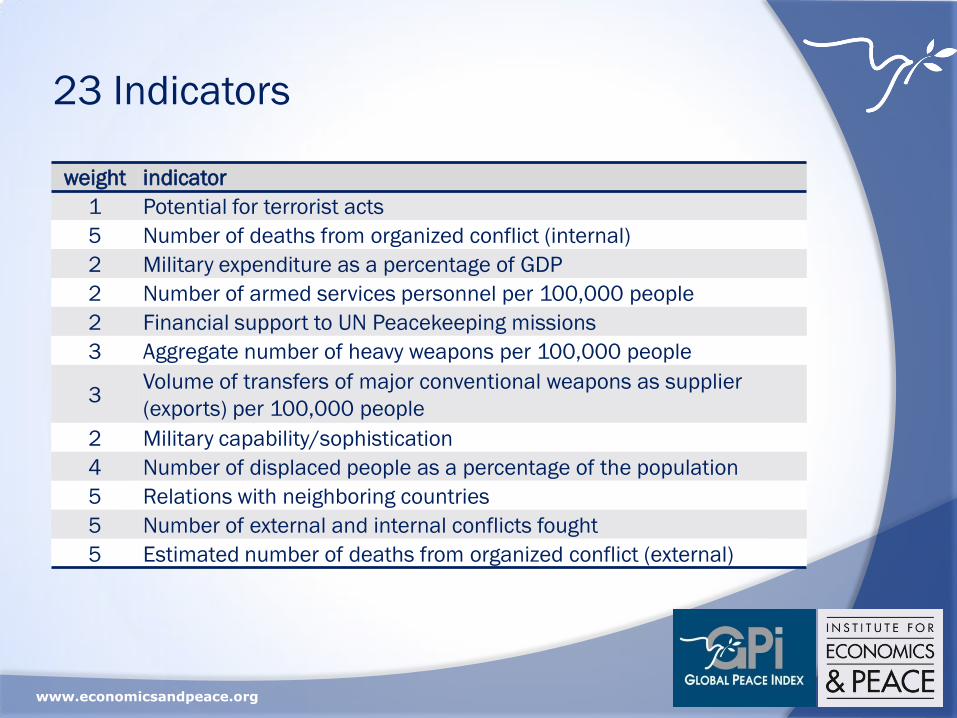
23 Indicators
weight indicator
1 Potential for terrorist acts
5 Number of deaths from organized conflict (internal)
2 Military expenditure as a percentage of GDP
2 Number of armed services personnel per 100,000 people
2 Financial support to UN Peacekeeping missions
3 Aggregate number of heavy weapons per 100,000 people
3Volume of transfers of major conventional weapons as supplier
(exports) per 100,000 people
2 Military capability/sophistication
4 Number of displaced people as a percentage of the population
5 Relations with neighboring countries
5 Number of external and internal conflicts fought
5 Estimated number of deaths from organized conflict (external)
www.economicsandpeace.org
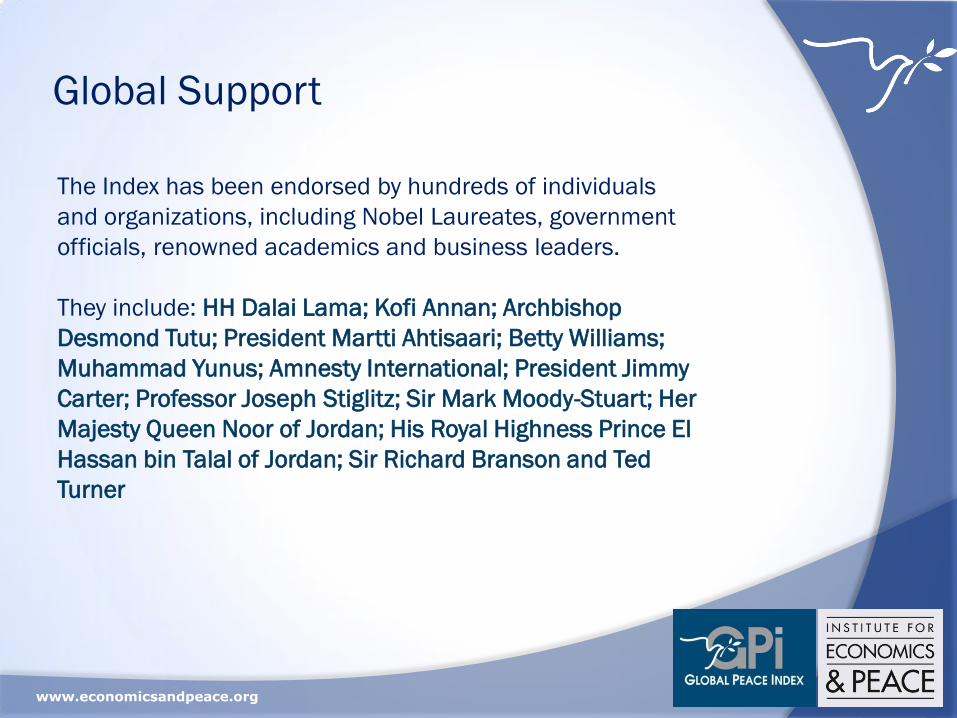
The Index has been endorsed by hundreds of individuals
and organizations, including Nobel Laureates, government
officials, renowned academics and business leaders.
They include: HH Dalai Lama; Kofi Annan; Archbishop
Desmond Tutu; President Martti Ahtisaari; Betty Williams;
Muhammad Yunus; Amnesty International; President Jimmy
Carter; Professor Joseph Stiglitz; Sir Mark Moody-Stuart; Her
Majesty Queen Noor of Jordan; His Royal Highness Prince El
Hassan bin Talal of Jordan; Sir Richard Branson and Ted
Turner
Global Support

www.economicsandpeace.org
Correlations With Other
Indices

www.economicsandpeace.org
Other Indexes
Well Being Indexes
UNDP Human Development Index r = - 0.58
Legatum Institute Prosperity Index r = 0.72
Yale Environmental Sustainability Index r = 0.63
Yale Environmental Performance Index r = - 0.52
Economic Indexes
World Bank Ease of Doing Business Index r = 0.54
World Economic Forum Global Competitive Index r = 0.58
TI Corruption Perception Index r = 0.71
World Bank Knowledge Economy Index r = 0.60
Frazer Institute Economic Freedom Index r = 0.62
www.economicsandpeace.org
Characteristics of Peace
www.economicsandpeace.org
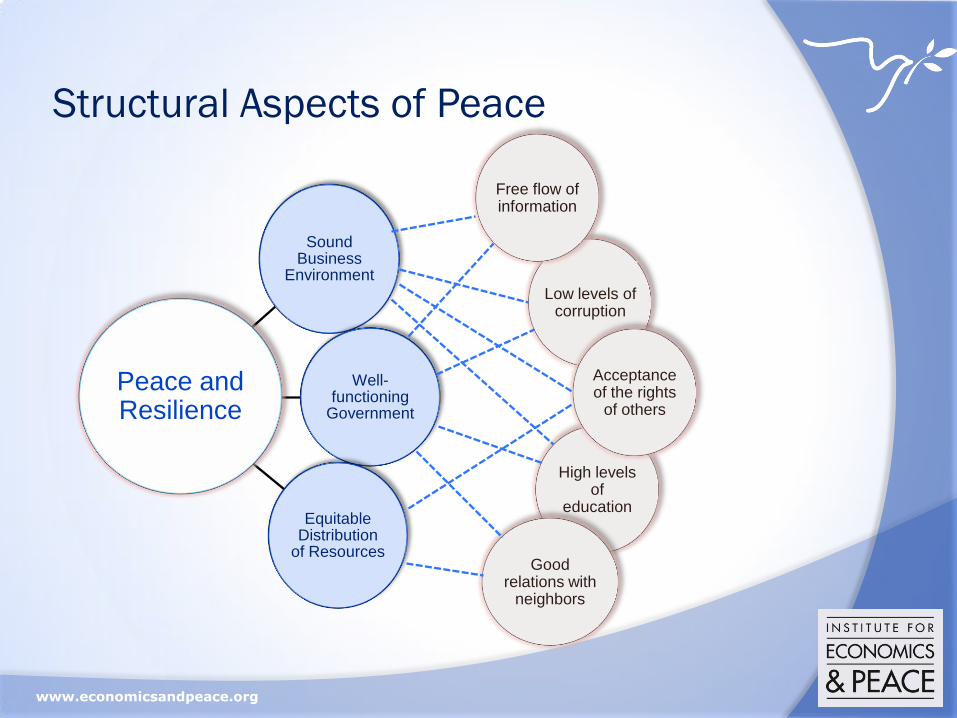
Structural Aspects of Peace
Sound Business
Environment
Well-functioning
Government
Equitable Distribution
of Resources
Peace and Resilience
Low levels of corruption
Free flow of information
High levels of
education
Acceptance of the rights
of others
Good relations with
neighbors
www.economicsandpeace.org
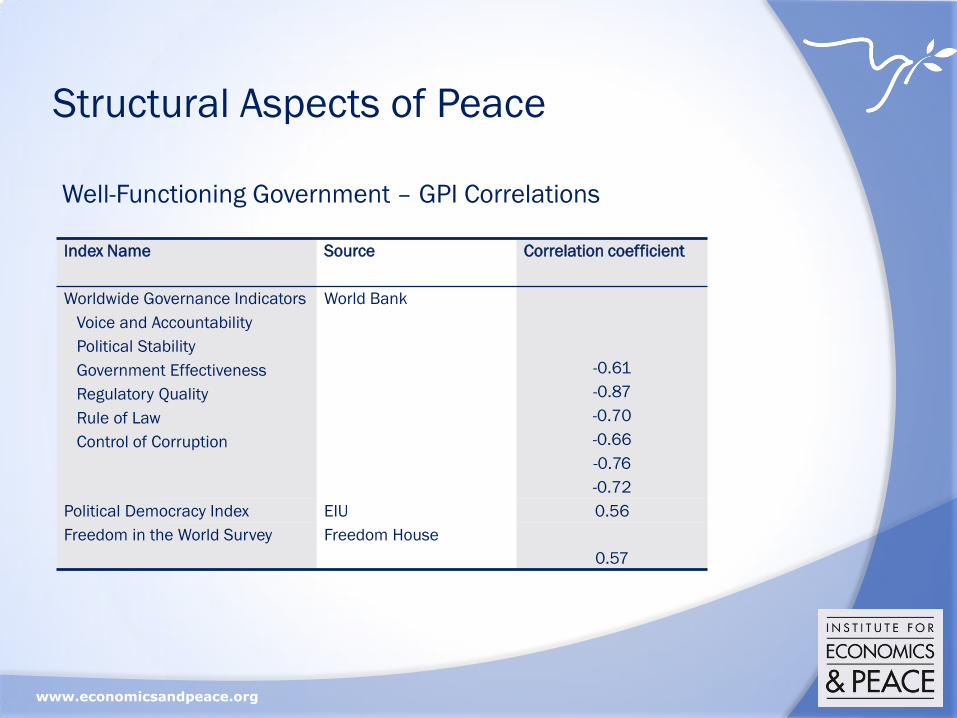
Structural Aspects of Peace
Well-Functioning Government – GPI Correlations
Index Name Source Correlation coefficient
Worldwide Governance Indicators
Voice and Accountability
Political Stability
Government Effectiveness
Regulatory Quality
Rule of Law
Control of Corruption
World Bank
-0.61
-0.87
-0.70
-0.66
-0.76
-0.72
Political Democracy Index EIU 0.56
Freedom in the World Survey Freedom House
0.57
www.economicsandpeace.org
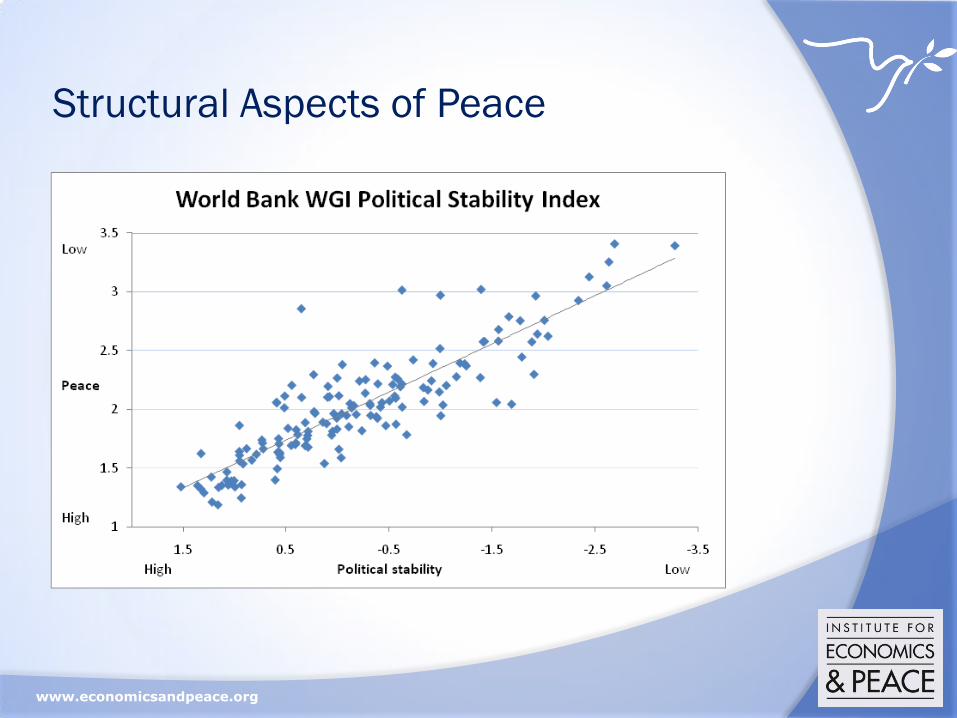
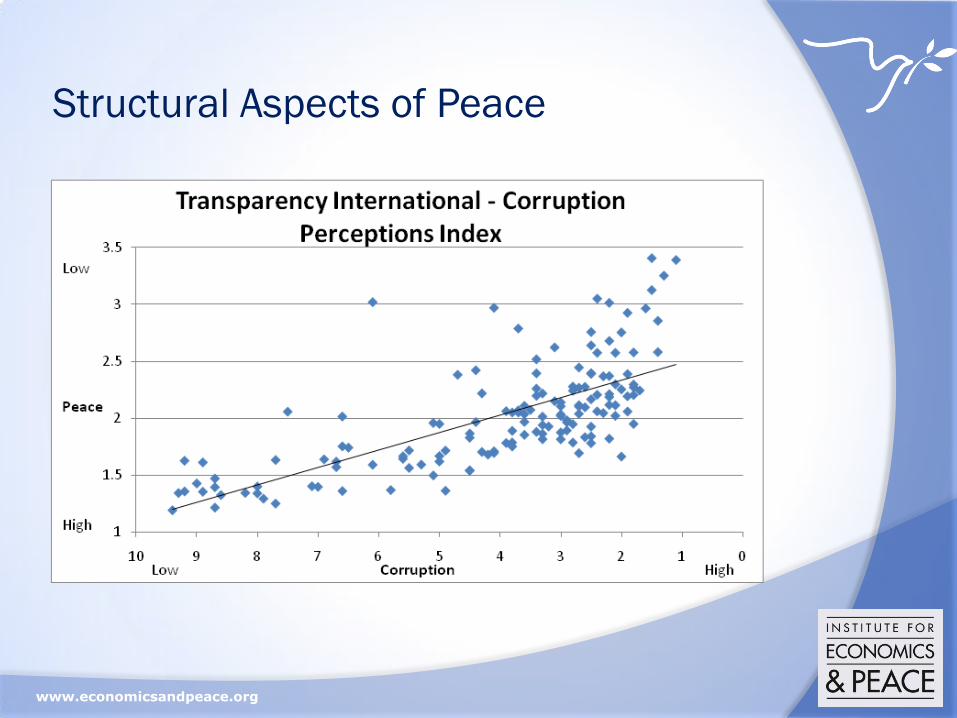
Structural Aspects of Peace
www.economicsandpeace.org
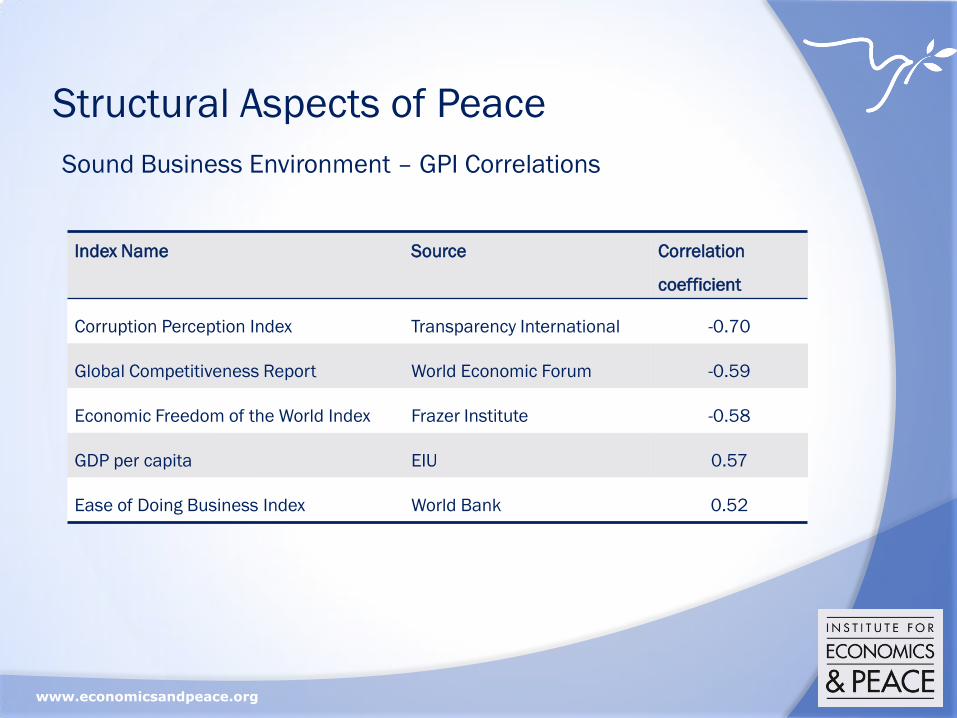
Structural Aspects of Peace
Sound Business Environment – GPI Correlations
Index Name Source Correlation
coefficient
Corruption Perception Index Transparency International -0.70
Global Competitiveness Report World Economic Forum -0.59
Economic Freedom of the World Index Frazer Institute -0.58
GDP per capita EIU 0.57
Ease of Doing Business Index World Bank 0.52
www.economicsandpeace.org
Structural Aspects of Peace
www.economicsandpeace.org
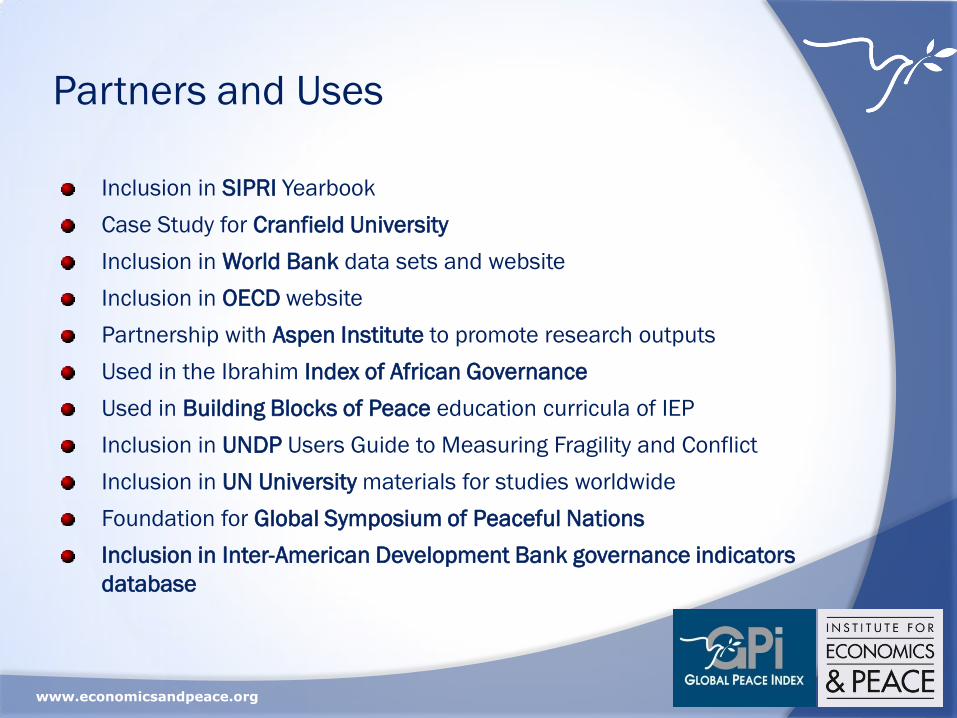
Partners and Uses
Inclusion in SIPRI Yearbook
Case Study for Cranfield University
Inclusion in World Bank data sets and website
Inclusion in OECD website
Partnership with Aspen Institute to promote research outputs
Used in the Ibrahim Index of African Governance
Used in Building Blocks of Peace education curricula of IEP
Inclusion in UNDP Users Guide to Measuring Fragility and Conflict
Inclusion in UN University materials for studies worldwide
Foundation for Global Symposium of Peaceful Nations
Inclusion in Inter-American Development Bank governance indicators
database
www.economicsandpeace.org
The Results
www.economicsandpeace.org
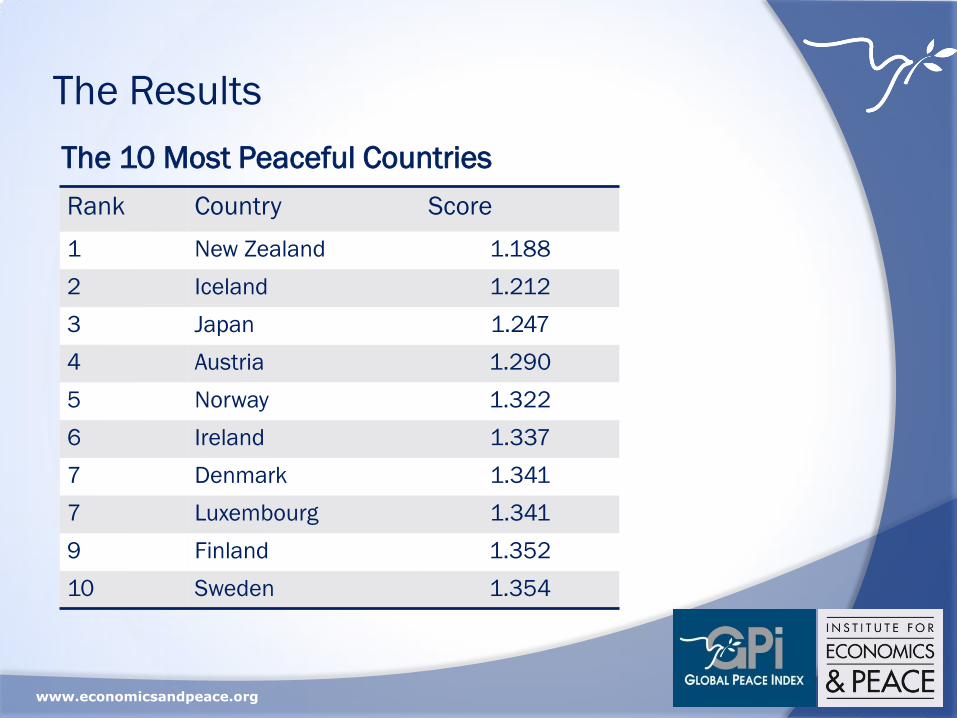
The Results
The 10 Most Peaceful Countries
Rank Country Score
1 New Zealand 1.188
2 Iceland 1.212
3 Japan 1.247
4 Austria 1.290
5 Norway 1.322
6 Ireland 1.337
7 Denmark 1.341
7 Luxembourg 1.341
9 Finland 1.352
10 Sweden 1.354
www.economicsandpeace.org
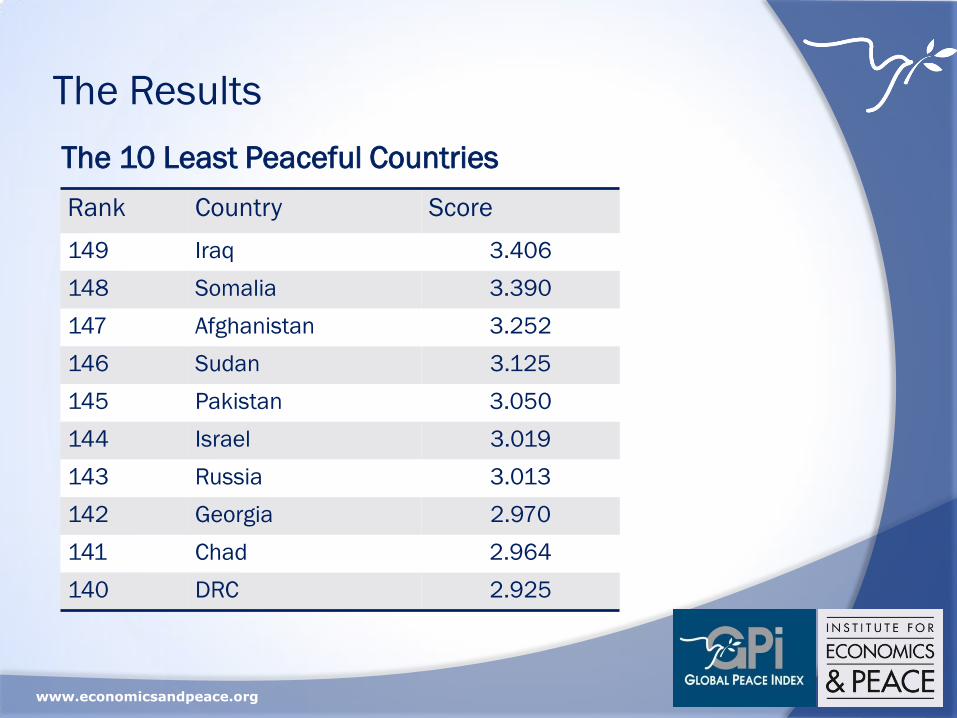
The Results
The 10 Least Peaceful Countries
Rank Country Score
149 Iraq 3.406
148 Somalia 3.390
147 Afghanistan 3.252
146 Sudan 3.125
145 Pakistan 3.050
144 Israel 3.019
143 Russia 3.013
142 Georgia 2.970
141 Chad 2.964
140 DRC 2.925
www.economicsandpeace.org
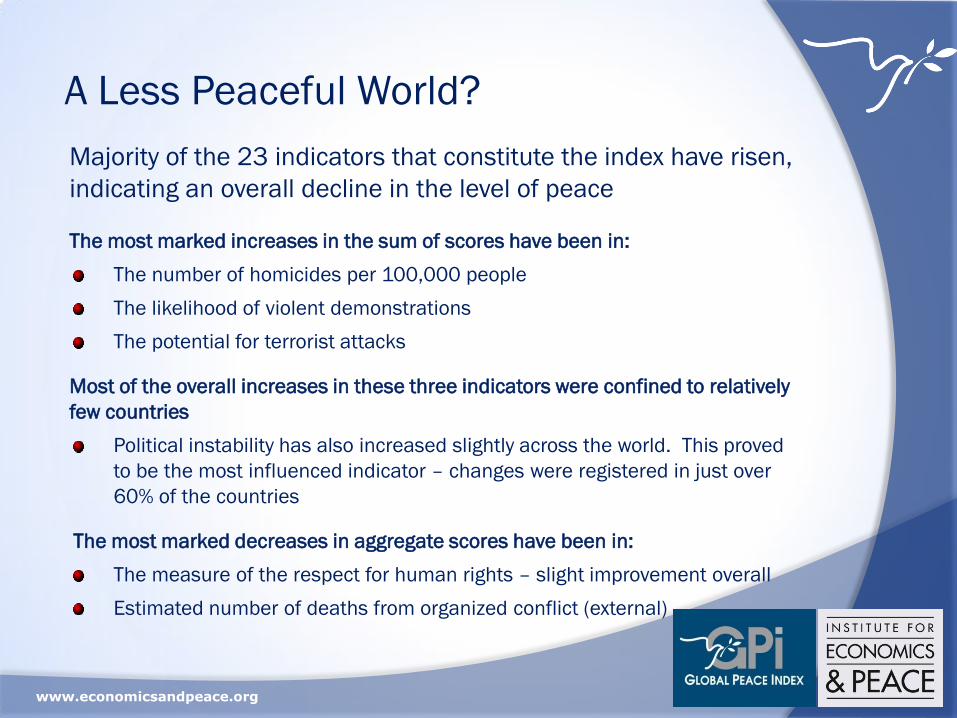
A Less Peaceful World?
Majority of the 23 indicators that constitute the index have risen,
indicating an overall decline in the level of peace
The most marked increases in the sum of scores have been in:
The number of homicides per 100,000 people
The likelihood of violent demonstrations
The potential for terrorist attacks
Most of the overall increases in these three indicators were confined to relatively
few countries
Political instability has also increased slightly across the world. This proved
to be the most influenced indicator – changes were registered in just over
60% of the countries
The most marked decreases in aggregate scores have been in:
The measure of the respect for human rights – slight improvement overall
Estimated number of deaths from organized conflict (external)
www.economicsandpeace.org
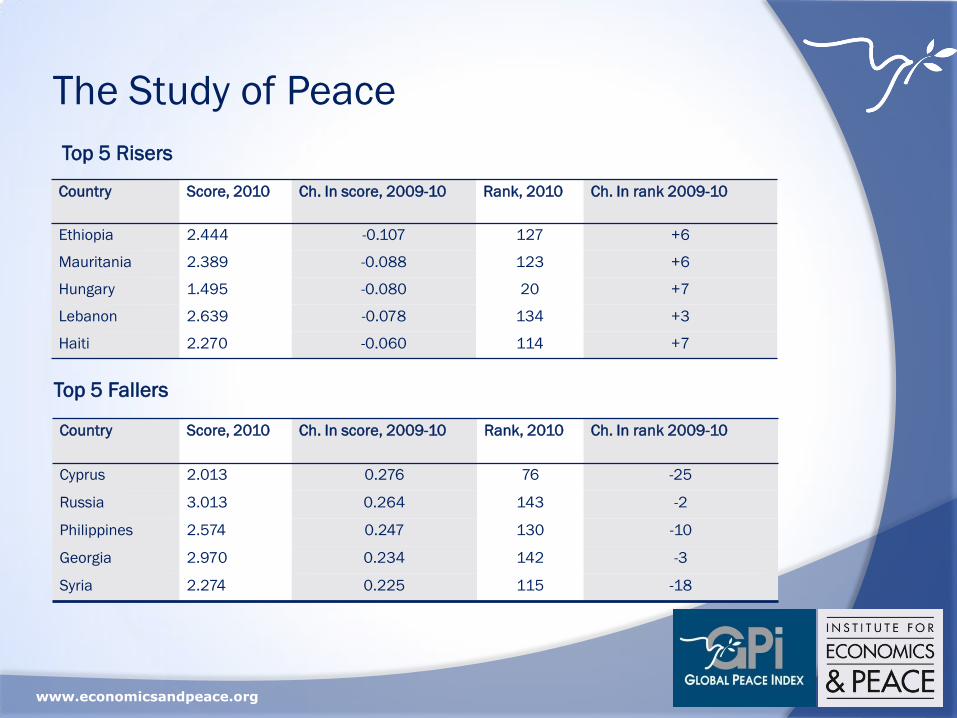
The Study of Peace
Country Score, 2010 Ch. In score, 2009-10 Rank, 2010 Ch. In rank 2009-10
Ethiopia 2.444 -0.107 127 +6
Mauritania 2.389 -0.088 123 +6
Hungary 1.495 -0.080 20 +7
Lebanon 2.639 -0.078 134 +3
Haiti 2.270 -0.060 114 +7
Top 5 Fallers
Country Score, 2010 Ch. In score, 2009-10 Rank, 2010 Ch. In rank 2009-10
Cyprus 2.013 0.276 76 -25
Russia 3.013 0.264 143 -2
Philippines 2.574 0.247 130 -10
Georgia 2.970 0.234 142 -3
Syria 2.274 0.225 115 -18
Top 5 Risers
www.economicsandpeace.org
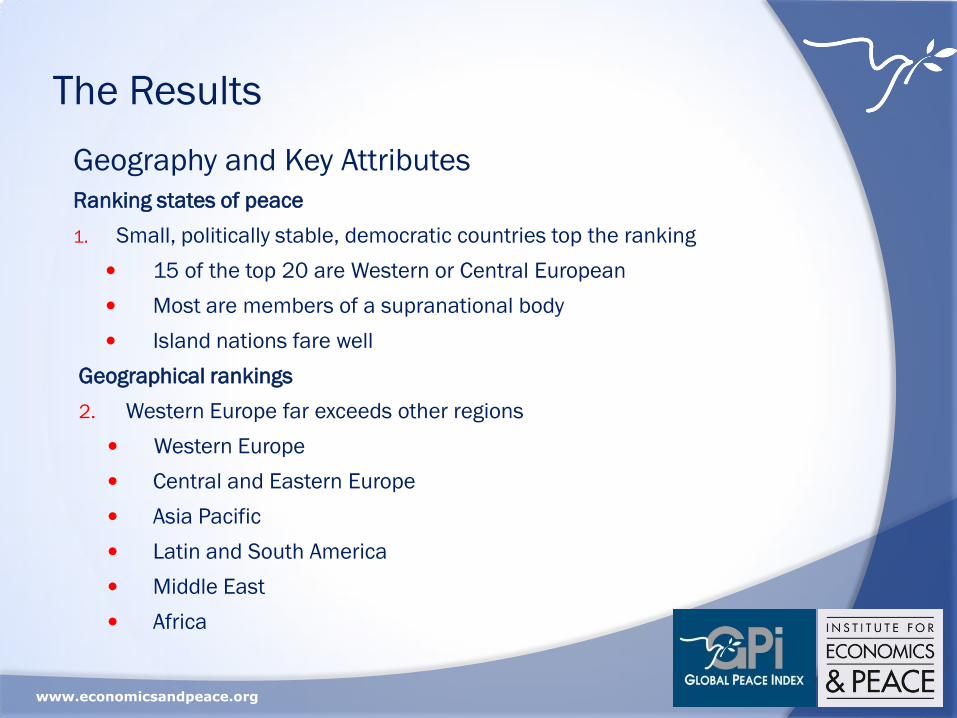
The Results
Geography and Key Attributes
Ranking states of peace
1. Small, politically stable, democratic countries top the ranking
15 of the top 20 are Western or Central European
Most are members of a supranational body
Island nations fare well
Geographical rankings
2. Western Europe far exceeds other regions
Western Europe
Central and Eastern Europe
Asia Pacific
Latin and South America
Middle East
Africa
www.economicsandpeace.org
Four-Year Trends
www.economicsandpeace.org
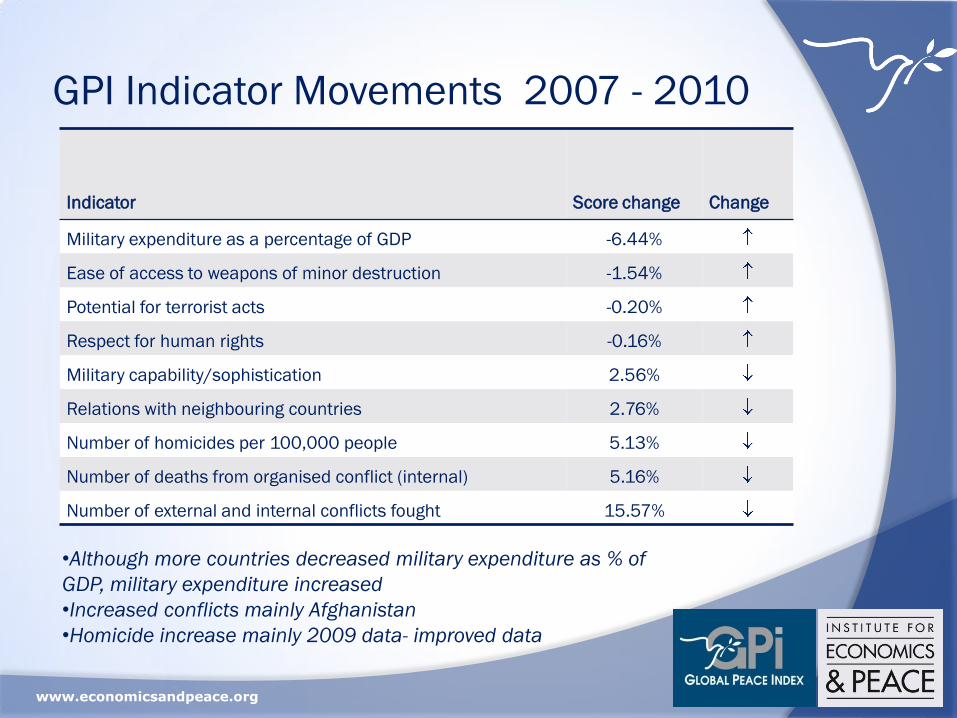
GPI Indicator Movements 2007 - 2010
Indicator Score change Change
Military expenditure as a percentage of GDP -6.44%
Ease of access to weapons of minor destruction -1.54%
Potential for terrorist acts -0.20%
Respect for human rights -0.16%
Military capability/sophistication 2.56%
Relations with neighbouring countries 2.76%
Number of homicides per 100,000 people 5.13%
Number of deaths from organised conflict (internal) 5.16%
Number of external and internal conflicts fought 15.57%
•Although more countries decreased military expenditure as % of
GDP, military expenditure increased
•Increased conflicts mainly Afghanistan
•Homicide increase mainly 2009 data- improved data
www.economicsandpeace.org
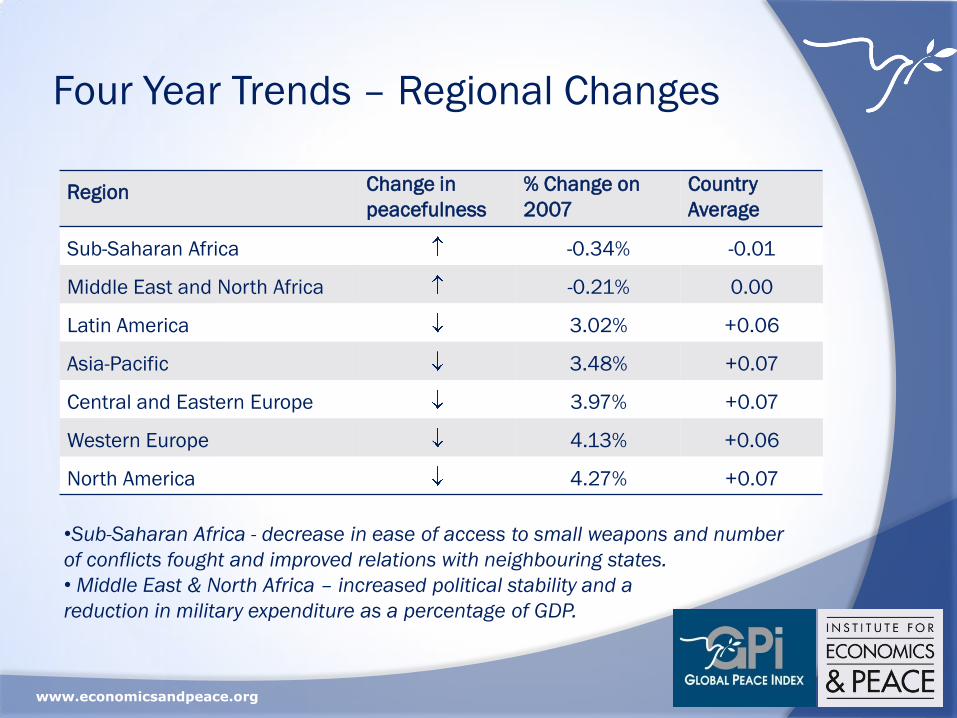
Four Year Trends – Regional Changes
Region Change in
peacefulness
% Change on
2007
Country
Average
Sub-Saharan Africa -0.34% -0.01
Middle East and North Africa -0.21% 0.00
Latin America 3.02% +0.06
Asia-Pacific 3.48% +0.07
Central and Eastern Europe 3.97% +0.07
Western Europe 4.13% +0.06
North America 4.27% +0.07
•Sub-Saharan Africa - decrease in ease of access to small weapons and number
of conflicts fought and improved relations with neighbouring states.
• Middle East & North Africa – increased political stability and a
reduction in military expenditure as a percentage of GDP.
www.economicsandpeace.org
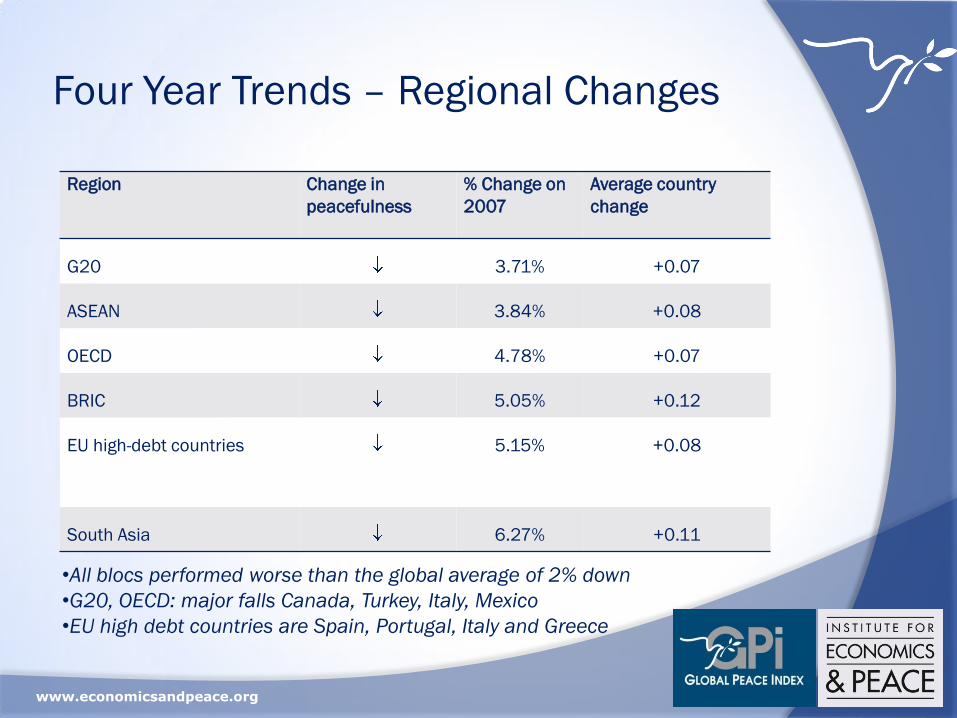
Four Year Trends – Regional Changes
Region Change in
peacefulness
% Change on
2007
Average country
change
G20 3.71% +0.07
ASEAN 3.84% +0.08
OECD 4.78% +0.07
BRIC 5.05% +0.12
EU high-debt countries 5.15% +0.08
South Asia 6.27% +0.11
•All blocs performed worse than the global average of 2% down
•G20, OECD: major falls Canada, Turkey, Italy, Mexico
•EU high debt countries are Spain, Portugal, Italy and Greece
www.economicsandpeace.org
Business and Peace
www.economicsandpeace.org
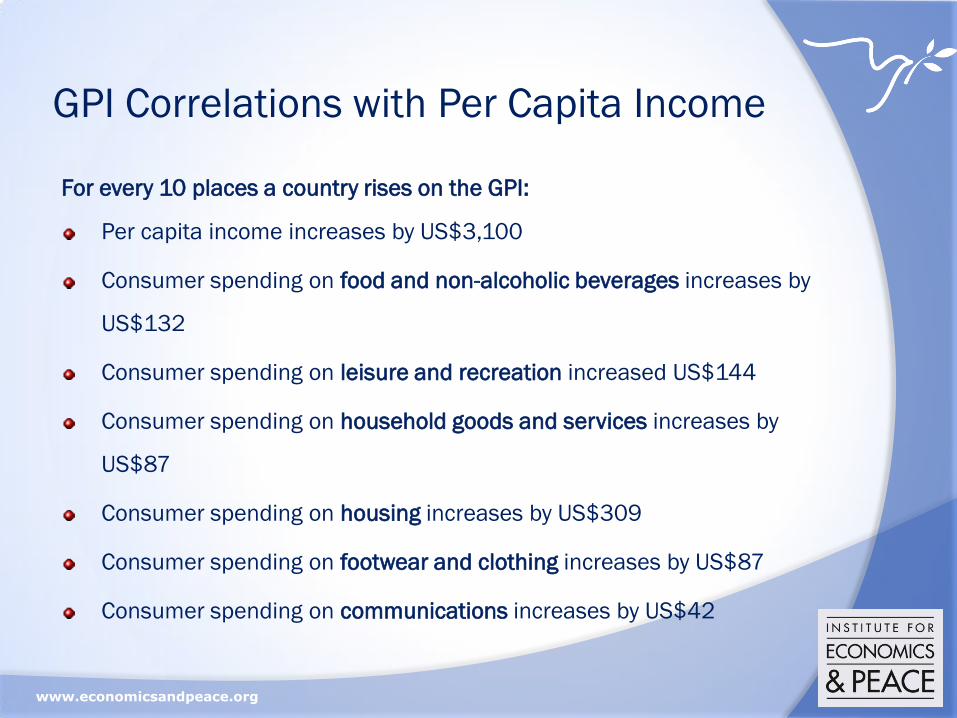
GPI Correlations with Per Capita Income
For every 10 places a country rises on the GPI:
Per capita income increases by US$3,100
Consumer spending on food and non-alcoholic beverages increases by
US$132
Consumer spending on leisure and recreation increased US$144
Consumer spending on household goods and services increases by
US$87
Consumer spending on housing increases by US$309
Consumer spending on footwear and clothing increases by US$87
Consumer spending on communications increases by US$42
www.economicsandpeace.org
Monetary Value of Peace
www.economicsandpeace.org
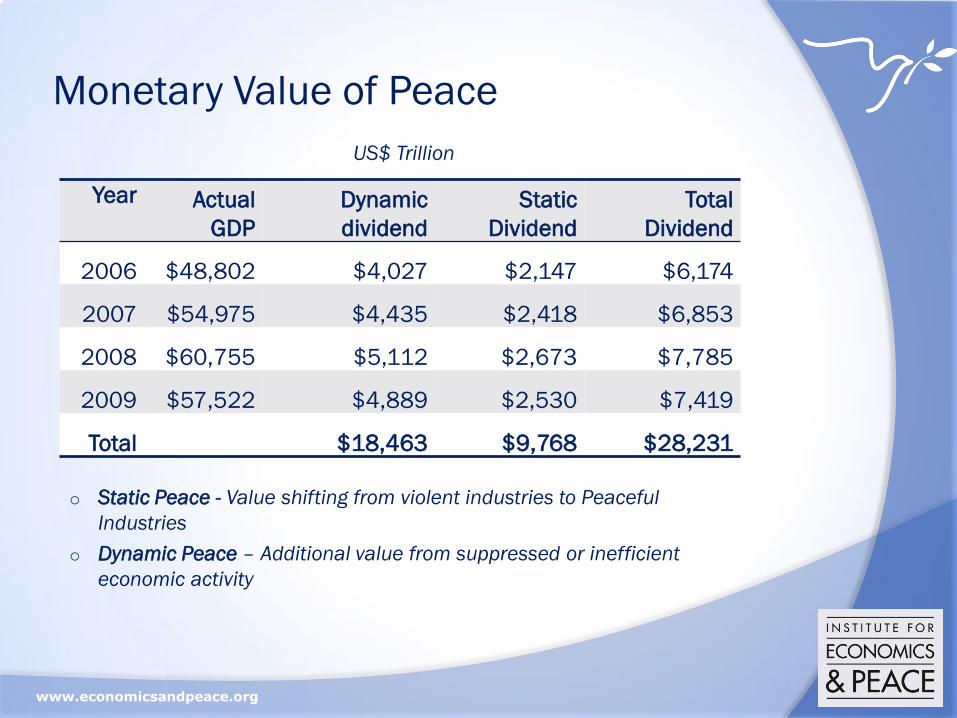
Monetary Value of Peace
Year Actual
GDP
Dynamic
dividend
Static
Dividend
Total
Dividend
2006 $48,802 $4,027 $2,147 $6,174
2007 $54,975 $4,435 $2,418 $6,853
2008 $60,755 $5,112 $2,673 $7,785
2009 $57,522 $4,889 $2,530 $7,419
Total $18,463 $9,768 $28,231
o Static Peace - Value shifting from violent industries to Peaceful
Industries
o Dynamic Peace – Additional value from suppressed or inefficient
economic activity
US$ Trillion
www.economicsandpeace.org
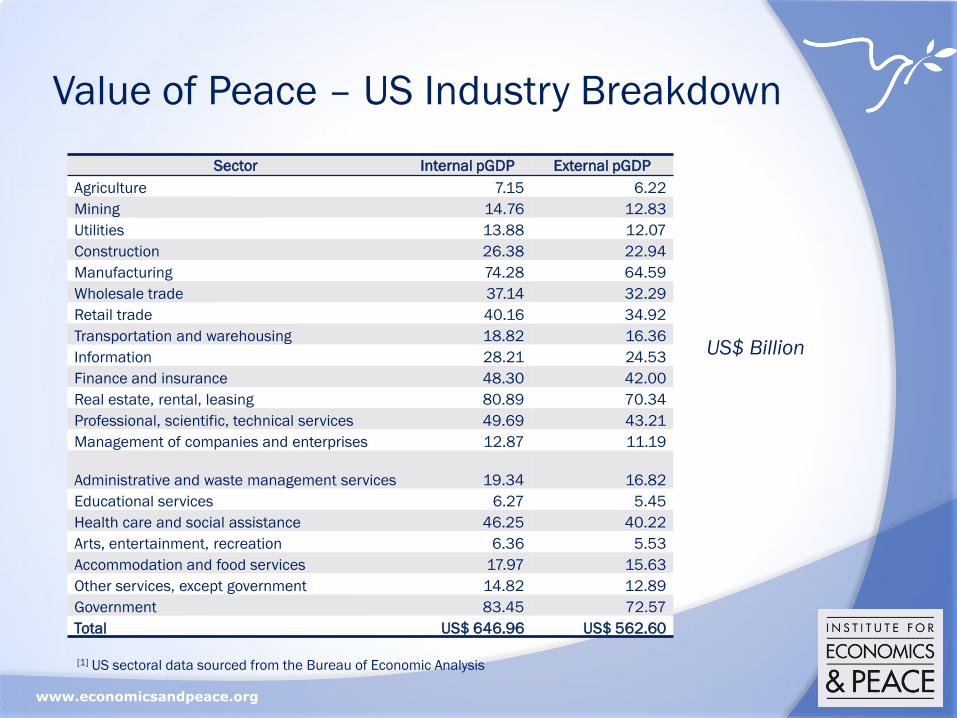
Value of Peace – US Industry Breakdown
US$ Billion
Sector Internal pGDP External pGDP
Agriculture 7.15 6.22
Mining 14.76 12.83
Utilities 13.88 12.07
Construction 26.38 22.94
Manufacturing 74.28 64.59
Wholesale trade 37.14 32.29
Retail trade 40.16 34.92
Transportation and warehousing 18.82 16.36
Information 28.21 24.53
Finance and insurance 48.30 42.00
Real estate, rental, leasing 80.89 70.34
Professional, scientific, technical services 49.69 43.21
Management of companies and enterprises 12.87 11.19
Administrative and waste management services 19.34 16.82
Educational services 6.27 5.45
Health care and social assistance 46.25 40.22
Arts, entertainment, recreation 6.36 5.53
Accommodation and food services 17.97 15.63
Other services, except government 14.82 12.89
Government 83.45 72.57
Total US$ 646.96 US$ 562.60
[1] US sectoral data sourced from the Bureau of Economic Analysis
www.economicsandpeace.org
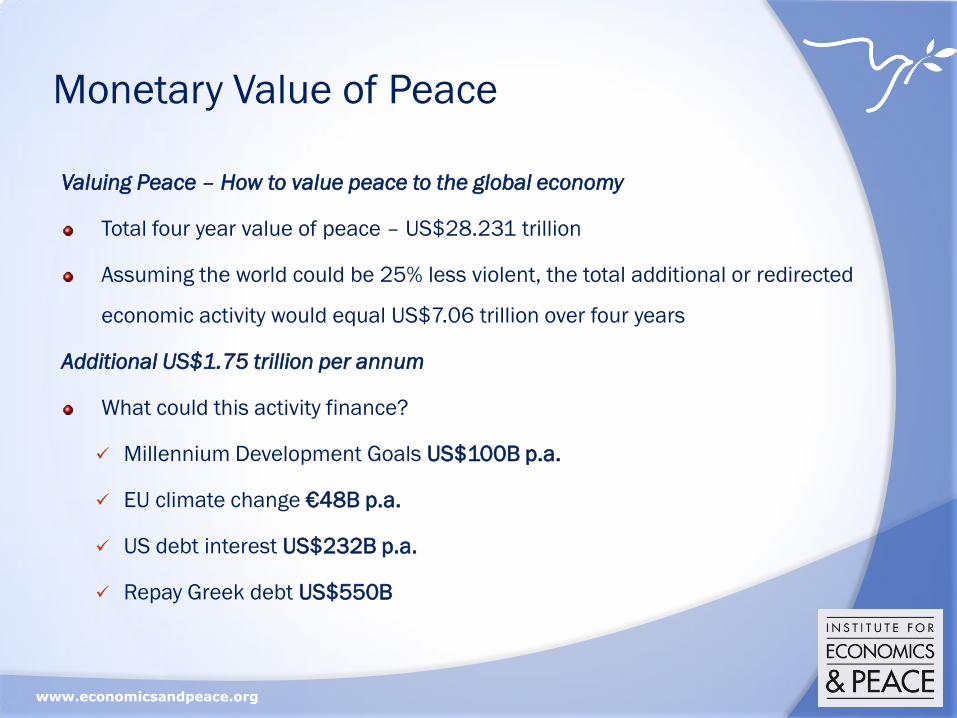
Monetary Value of Peace
Valuing Peace – How to value peace to the global economy
Total four year value of peace – US$28.231 trillion
Assuming the world could be 25% less violent, the total additional or redirected
economic activity would equal US$7.06 trillion over four years
Additional US$1.75 trillion per annum
What could this activity finance?
Millennium Development Goals US$100B p.a.
EU climate change €48B p.a.
US debt interest US$232B p.a.
Repay Greek debt US$550B
www.economicsandpeace.org
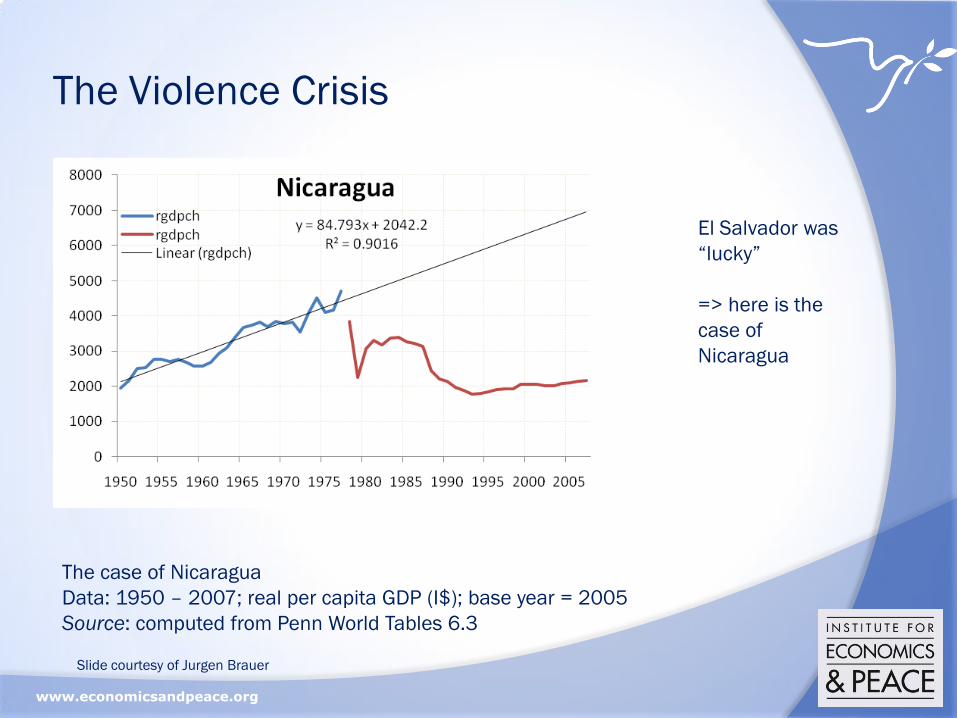
The Violence Crisis
The case of Nicaragua
Data: 1950 – 2007; real per capita GDP (I$); base year = 2005
Source: computed from Penn World Tables 6.3
El Salvador was
“lucky”
=> here is the
case of
Nicaragua
Slide courtesy of Jurgen Brauer
www.economicsandpeace.org
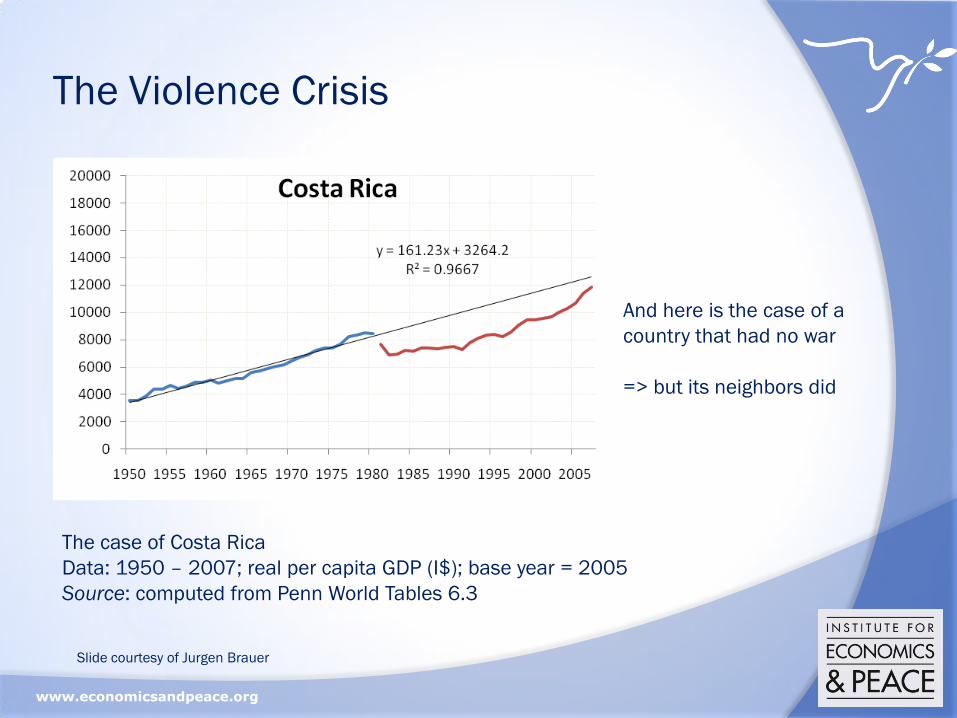
The Violence Crisis
The case of Costa Rica
Data: 1950 – 2007; real per capita GDP (I$); base year = 2005
Source: computed from Penn World Tables 6.3
And here is the case of a
country that had no war
=> but its neighbors did
Slide courtesy of Jurgen Brauer
www.economicsandpeace.org
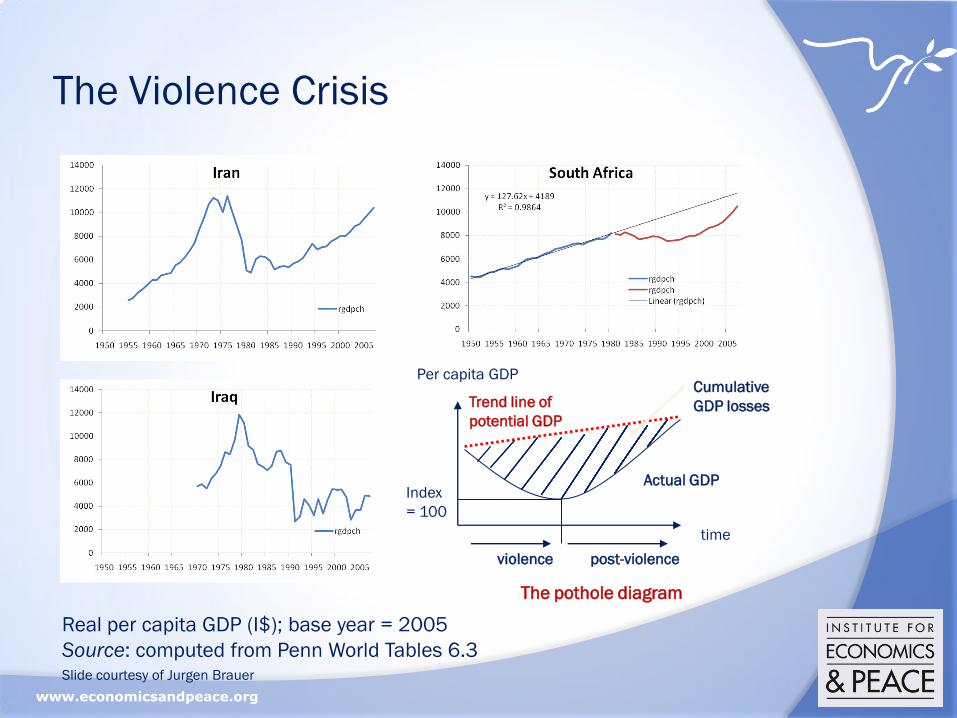
The Violence Crisis
Real per capita GDP (I$); base year = 2005
Source: computed from Penn World Tables 6.3
time
Per capita GDP
Actual GDP
Trend line of
potential GDP
Cumulative
GDP losses
violence post-violence
Index
= 100
The pothole diagram
Slide courtesy of Jurgen Brauer
www.economicsandpeace.org
Correlations With Other
Indices
www.economicsandpeace.org
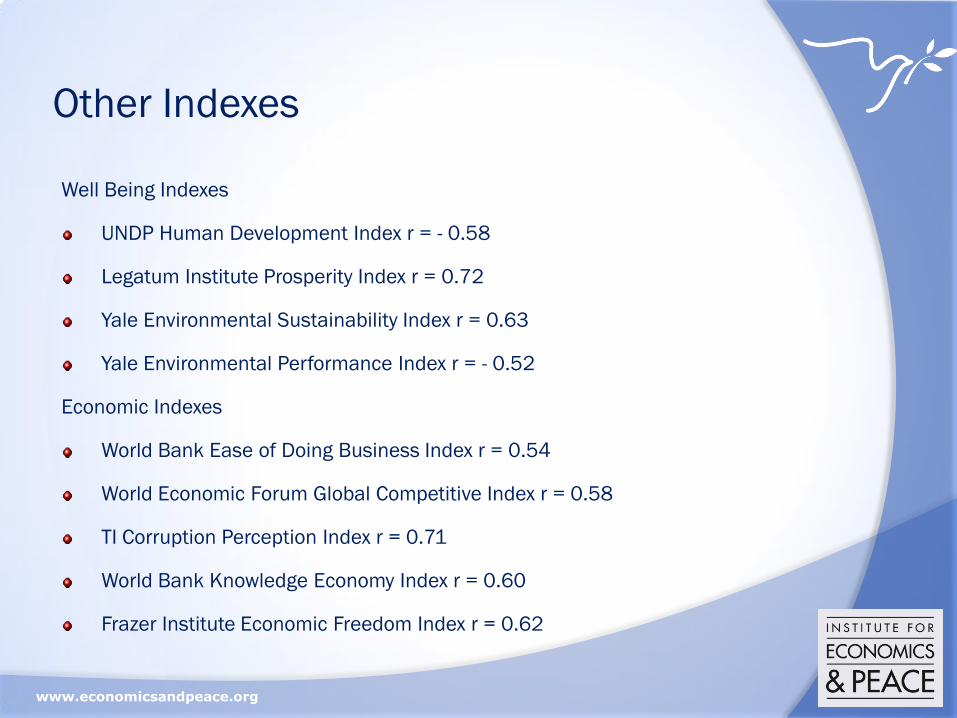
Other Indexes
Well Being Indexes
UNDP Human Development Index r = - 0.58
Legatum Institute Prosperity Index r = 0.72
Yale Environmental Sustainability Index r = 0.63
Yale Environmental Performance Index r = - 0.52
Economic Indexes
World Bank Ease of Doing Business Index r = 0.54
World Economic Forum Global Competitive Index r = 0.58
TI Corruption Perception Index r = 0.71
World Bank Knowledge Economy Index r = 0.60
Frazer Institute Economic Freedom Index r = 0.62
www.economicsandpeace.org
Strategic Business
Analysis
www.economicsandpeace.org
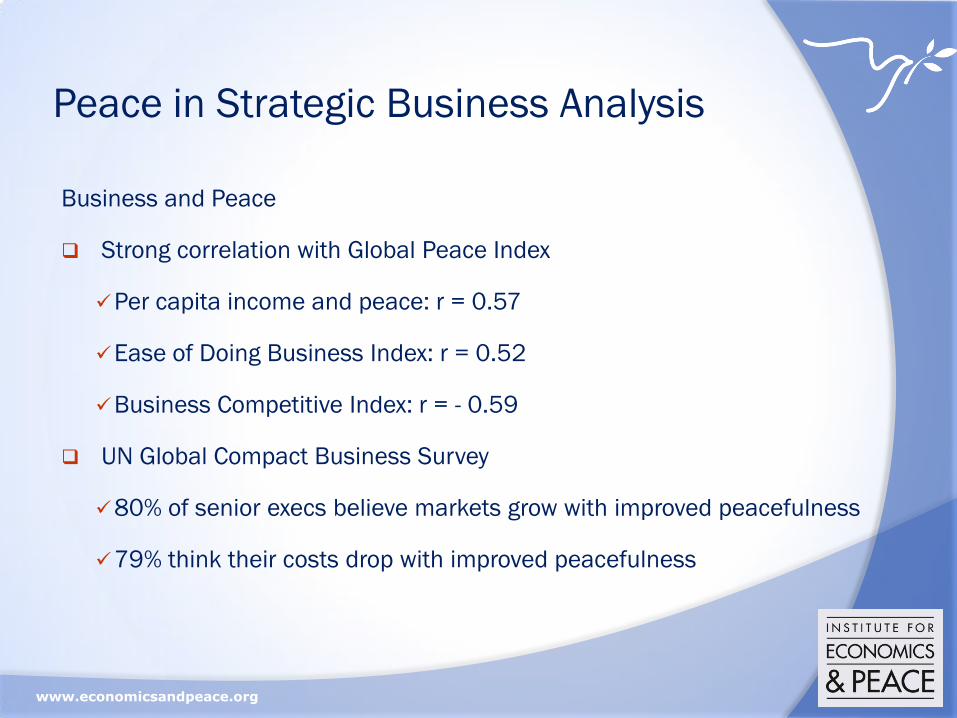
Peace in Strategic Business Analysis
Business and Peace
Strong correlation with Global Peace Index
Per capita income and peace: r = 0.57
Ease of Doing Business Index: r = 0.52
Business Competitive Index: r = - 0.59
UN Global Compact Business Survey
80% of senior execs believe markets grow with improved peacefulness
79% think their costs drop with improved peacefulness
www.economicsandpeace.org
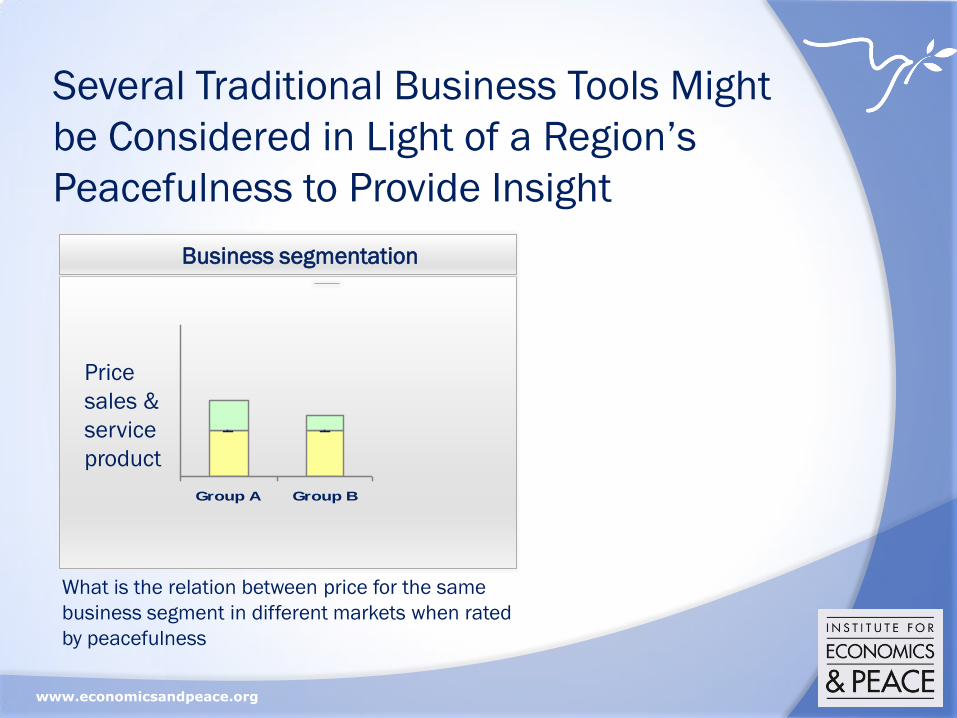
Several Traditional Business Tools Might
be Considered in Light of a Region’s
Peacefulness to Provide Insight
Group A Group B
Business segmentation
What is the relation between price for the same
business segment in different markets when rated
by peacefulness
Price
sales &
service
product
www.economicsandpeace.org
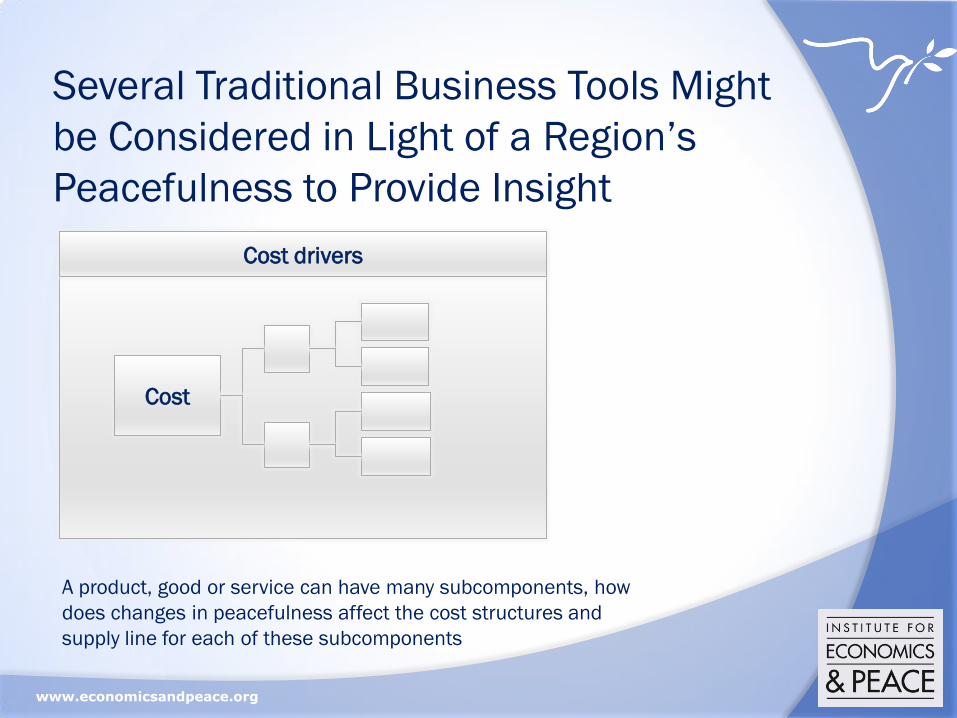
Several Traditional Business Tools Might
be Considered in Light of a Region’s
Peacefulness to Provide Insight
A product, good or service can have many subcomponents, how
does changes in peacefulness affect the cost structures and
supply line for each of these subcomponents
Cost drivers
Cost
www.economicsandpeace.org
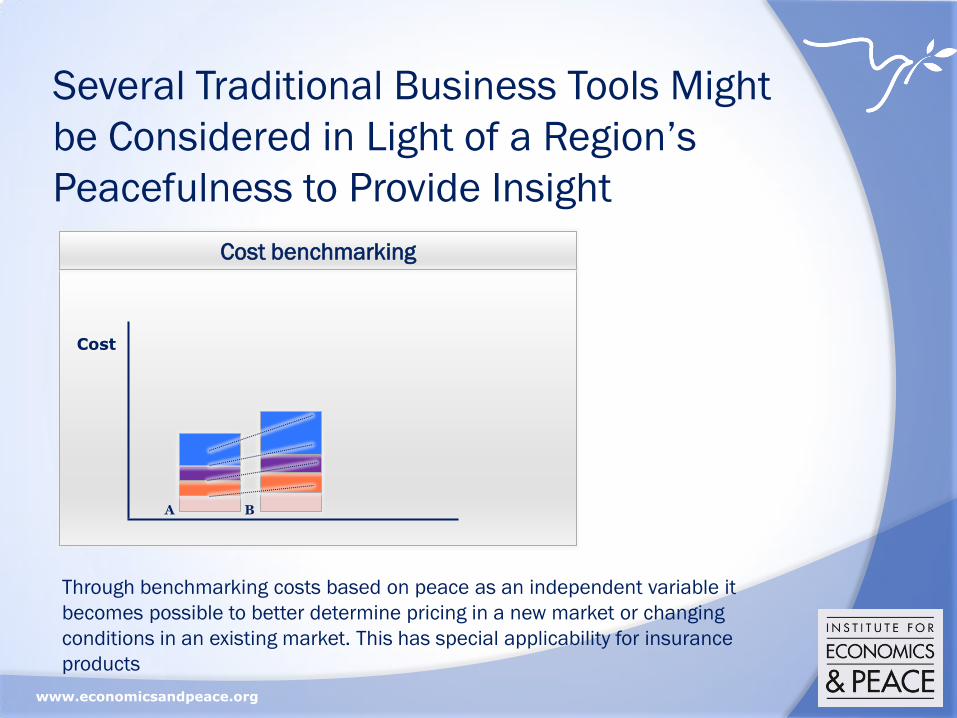
Several Traditional Business Tools Might
be Considered in Light of a Region’s
Peacefulness to Provide Insight
Through benchmarking costs based on peace as an independent variable it
becomes possible to better determine pricing in a new market or changing
conditions in an existing market. This has special applicability for insurance
products
Cost benchmarking
A B
Cost

www.economicsandpeace.org
Questions and Answers

www.economicsandpeace.org