Embed Size (px)
Citation preview

Smarter decisions, powered by insight
Global Offshore ProspectsSUT, Braemar Technical Services, London. 25th January 2018

01 Introduction
Presentation Title 2
3
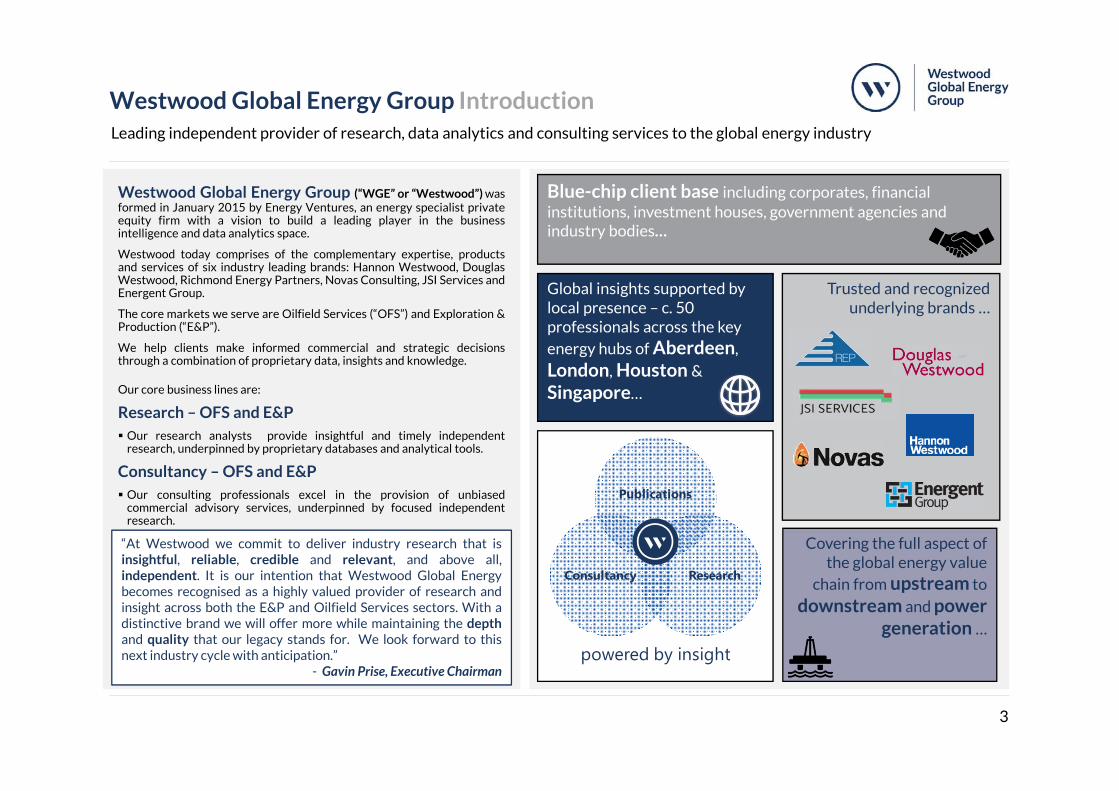
Westwood Global Energy Group IntroductionLeading independent provider of research, data analytics and consulting services to the global energy industry
Westwood Global Energy Group (“WGE” or “Westwood”) wasformed in January 2015 by Energy Ventures, an energy specialist privateequity firm with a vision to build a leading player in the businessintelligence and data analytics space.
Westwood today comprises of the complementary expertise, productsand services of six industry leading brands: Hannon Westwood, DouglasWestwood, Richmond Energy Partners, Novas Consulting, JSI Services andEnergent Group.
The core markets we serve are Oilfield Services (“OFS”) and Exploration &Production (“E&P”).
We help clients make informed commercial and strategic decisionsthrough a combination of proprietary data, insights and knowledge.
Our core business lines are:
Research – OFS and E&P Our research analysts provide insightful and timely independent
research, underpinned by proprietary databases and analytical tools.
Consultancy – OFS and E&P Our consulting professionals excel in the provision of unbiased
commercial advisory services, underpinned by focused independentresearch.
Blue-chip client base including corporates, financial institutions, investment houses, government agencies and industry bodies…
Global insights supported by local presence – c. 50 professionals across the key energy hubs of Aberdeen,
London, Houston &
Singapore…
Covering the full aspect of the global energy value
chain from upstream to
downstream and powergeneration …
Trusted and recognized underlying brands …
Consultancy Research
Publications
powered by insight
“At Westwood we commit to deliver industry research that isinsightful, reliable, credible and relevant, and above all,independent. It is our intention that Westwood Global Energybecomes recognised as a highly valued provider of research andinsight across both the E&P and Oilfield Services sectors. With adistinctive brand we will offer more while maintaining the depthand quality that our legacy stands for. We look forward to thisnext industry cycle with anticipation.”
- Gavin Prise, Executive Chairman
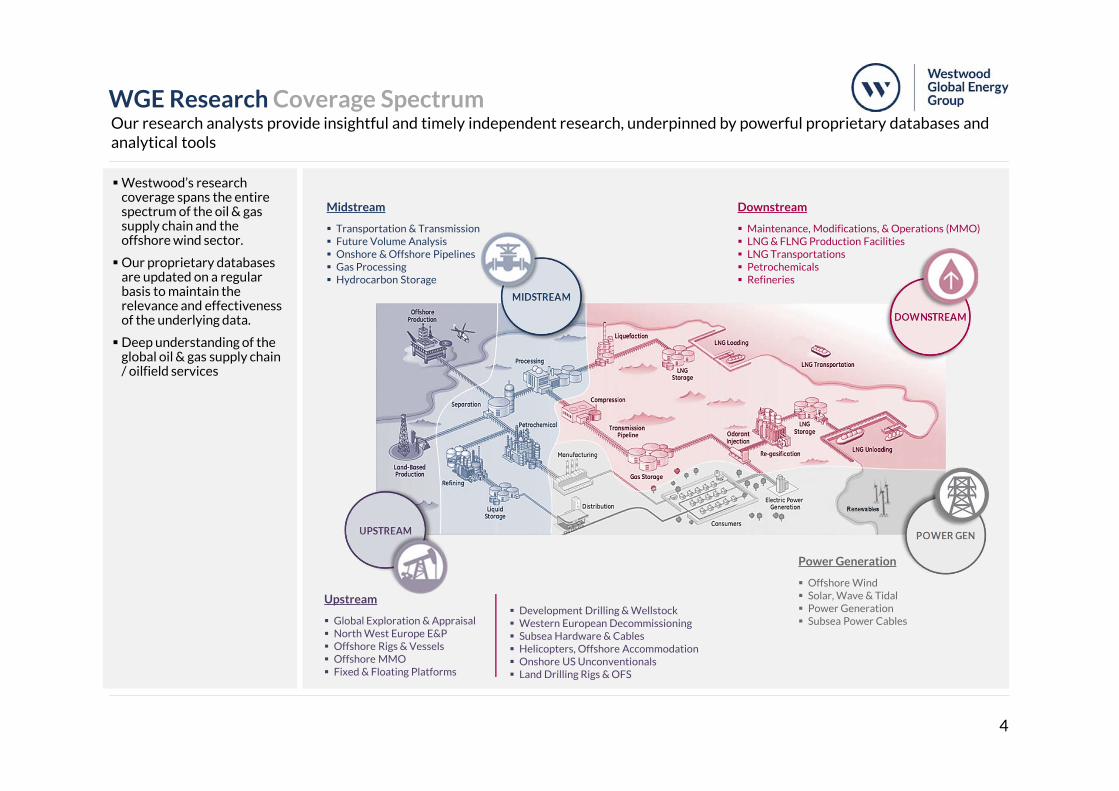
WGE Research Coverage SpectrumOur research analysts provide insightful and timely independent research, underpinned by powerful proprietary databases and analytical tools
4
Westwood’s research coverage spans the entire spectrum of the oil & gas supply chain and the offshore wind sector.
Our proprietary databases are updated on a regular basis to maintain the relevance and effectiveness of the underlying data.
Deep understanding of the global oil & gas supply chain / oilfield services
Midstream
Transportation & Transmission Future Volume Analysis Onshore & Offshore Pipelines Gas Processing Hydrocarbon Storage
Downstream
Maintenance, Modifications, & Operations (MMO) LNG & FLNG Production Facilities LNG Transportations Petrochemicals Refineries
Power Generation
Offshore Wind Solar, Wave & Tidal Power Generation Subsea Power Cables
Upstream
Global Exploration & Appraisal North West Europe E&P Offshore Rigs & Vessels Offshore MMO Fixed & Floating Platforms
Development Drilling & Wellstock Western European Decommissioning Subsea Hardware & Cables Helicopters, Offshore Accommodation Onshore US Unconventionals Land Drilling Rigs & OFS
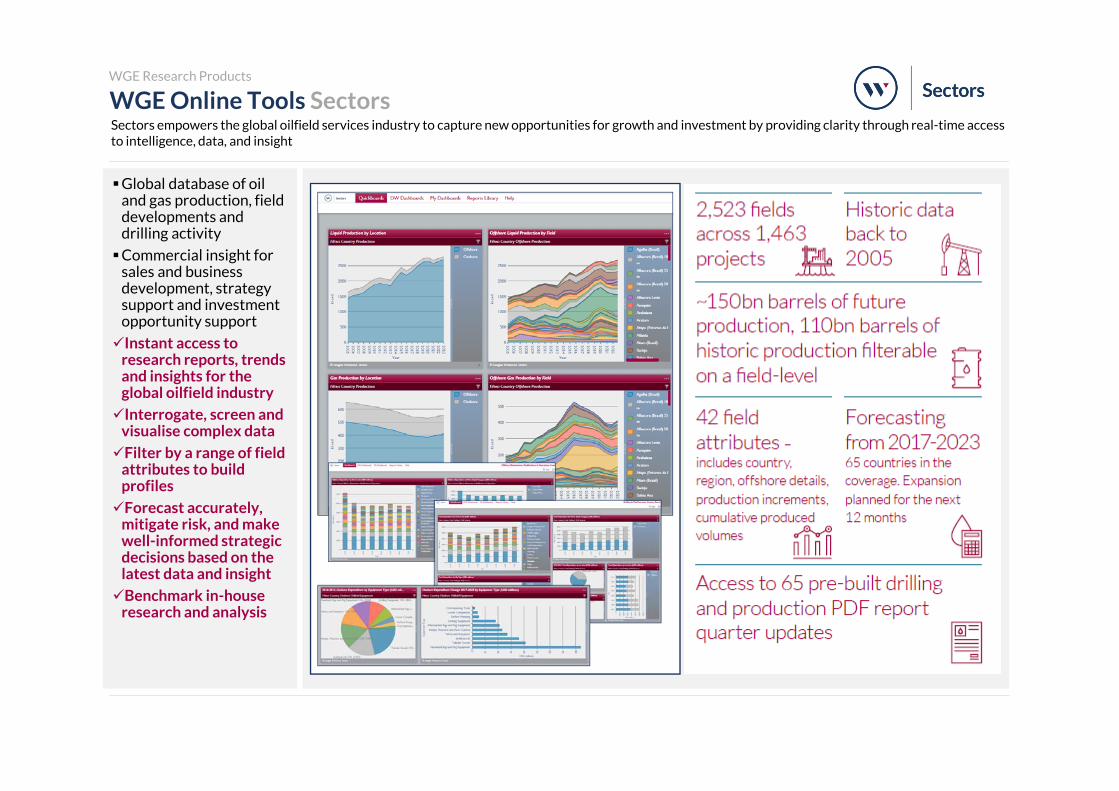
WGE Online Tools SectorsSectors empowers the global oilfield services industry to capture new opportunities for growth and investment by providing clarity through real-time access to intelligence, data, and insight
Global database of oil and gas production, field developments and drilling activity
Commercial insight for sales and business development, strategy support and investment opportunity support
Instant access to research reports, trends and insights for the global oilfield industry
Interrogate, screen and visualise complex data
Filter by a range of field attributes to build profiles
Forecast accurately, mitigate risk, and make well-informed strategic decisions based on the latest data and insight
Benchmark in-house research and analysis
WGE Research Products
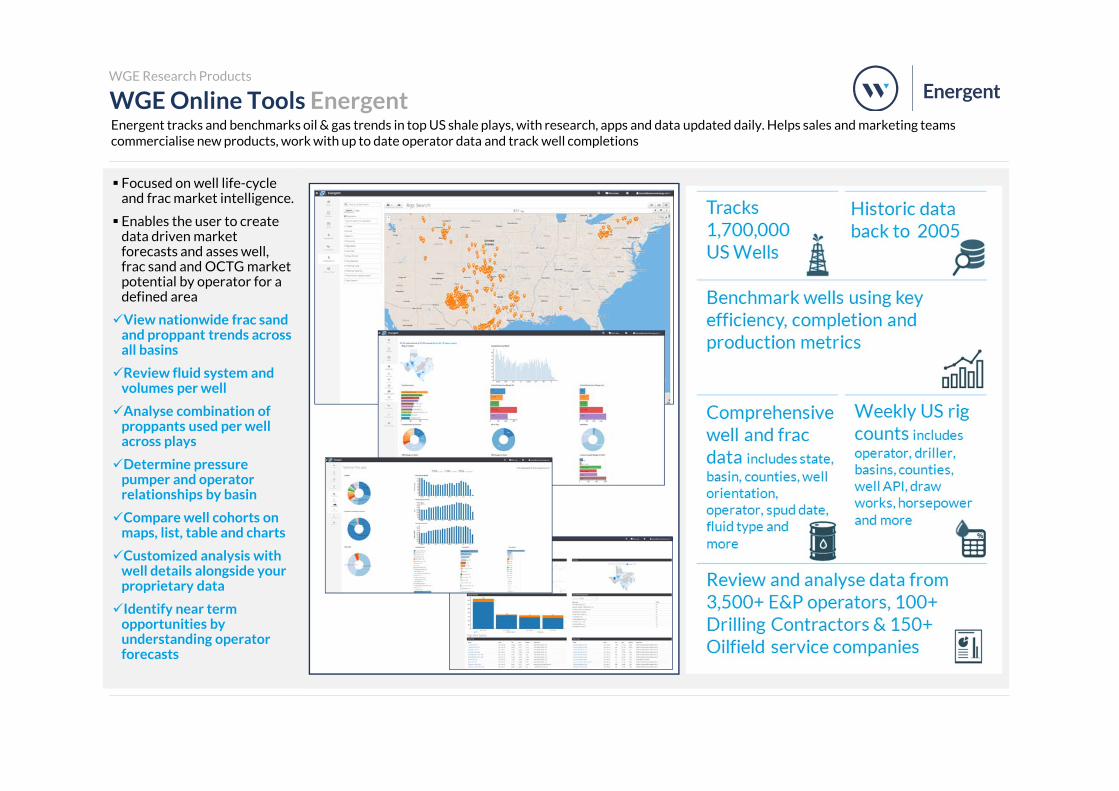
WGE Online Tools EnergentEnergent tracks and benchmarks oil & gas trends in top US shale plays, with research, apps and data updated daily. Helps sales and marketing teams commercialise new products, work with up to date operator data and track well completions
Focused on well life-cycle and frac market intelligence.
Enables the user to create data driven market forecasts and asses well, frac sand and OCTG market potential by operator for a defined area
View nationwide frac sand and proppant trends across all basins
Review fluid system and volumes per well
Analyse combination of proppants used per well across plays
Determine pressure pumper and operator relationships by basin
Compare well cohorts on maps, list, table and charts
Customized analysis with well details alongside your proprietary data
Identify near term opportunities by understanding operator forecasts
WGE Research Products
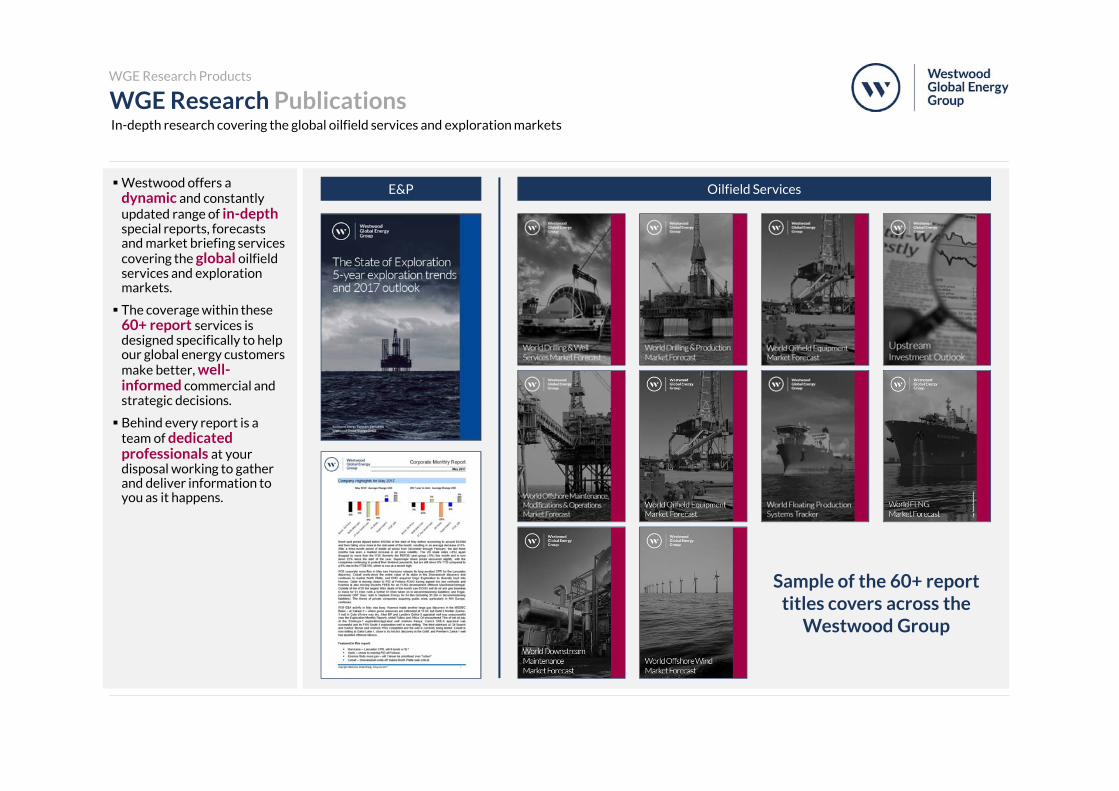
WGE Research PublicationsIn-depth research covering the global oilfield services and exploration markets
Westwood offers a dynamic and constantly updated range of in-depthspecial reports, forecasts and market briefing services covering the global oilfield services and exploration markets.
The coverage within these 60+ report services is designed specifically to help our global energy customers make better, well-informed commercial and strategic decisions.
Behind every report is a team of dedicated professionals at your disposal working to gather and deliver information to you as it happens.
Sample of the 60+ report titles covers across the
Westwood Group
E&P Oilfield Services
WGE Research Products
8
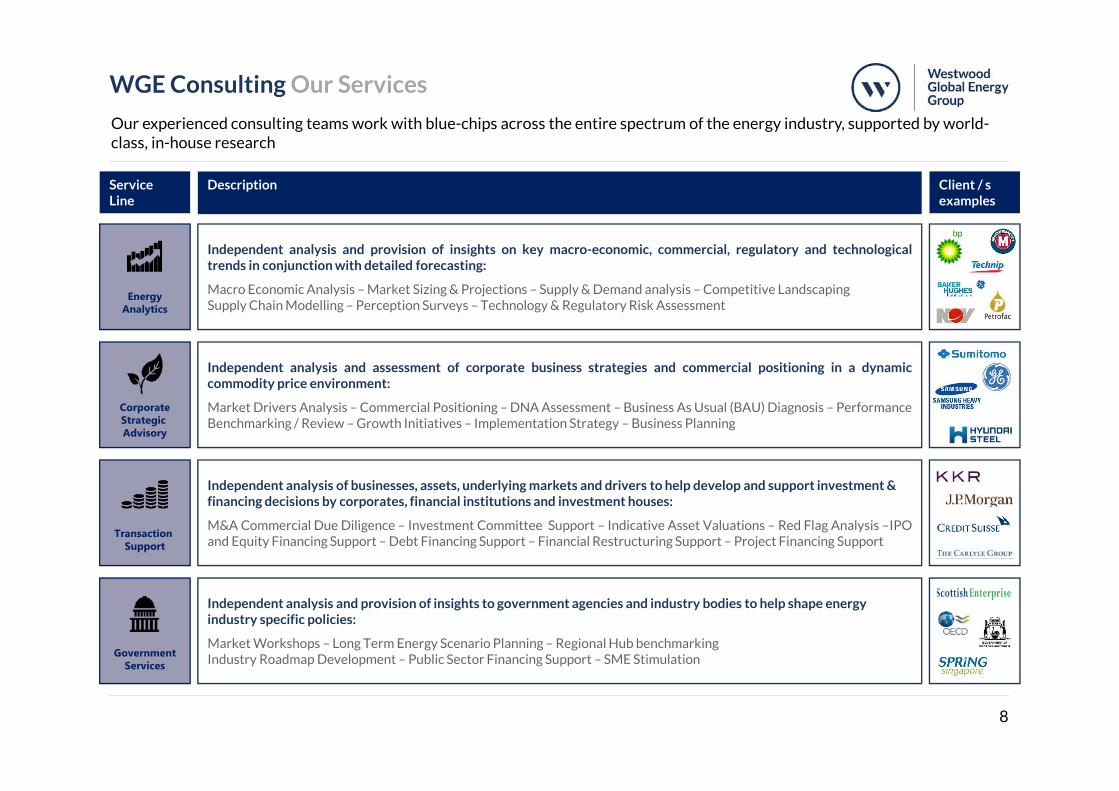
WGE Consulting Our Services
Our experienced consulting teams work with blue-chips across the entire spectrum of the energy industry, supported by world-class, in-house research
EnergyAnalytics
CorporateStrategic Advisory
Transaction Support
GovernmentServices
Service Line
Description Client / s examples
Independent analysis and provision of insights to government agencies and industry bodies to help shape energy industry specific policies:
Market Workshops – Long Term Energy Scenario Planning – Regional Hub benchmarkingIndustry Roadmap Development – Public Sector Financing Support – SME Stimulation
Independent analysis of businesses, assets, underlying markets and drivers to help develop and support investment & financing decisions by corporates, financial institutions and investment houses:
M&A Commercial Due Diligence – Investment Committee Support – Indicative Asset Valuations – Red Flag Analysis –IPOand Equity Financing Support – Debt Financing Support – Financial Restructuring Support – Project Financing Support
Independent analysis and assessment of corporate business strategies and commercial positioning in a dynamiccommodity price environment:
Market Drivers Analysis – Commercial Positioning – DNA Assessment – Business As Usual (BAU) Diagnosis – PerformanceBenchmarking / Review – Growth Initiatives – Implementation Strategy – Business Planning
Independent analysis and provision of insights on key macro-economic, commercial, regulatory and technologicaltrends in conjunction with detailed forecasting:
Macro Economic Analysis – Market Sizing & Projections – Supply & Demand analysis – Competitive LandscapingSupply Chain Modelling – Perception Surveys – Technology & Regulatory Risk Assessment

02 Macro-Economic
Energy Outlook
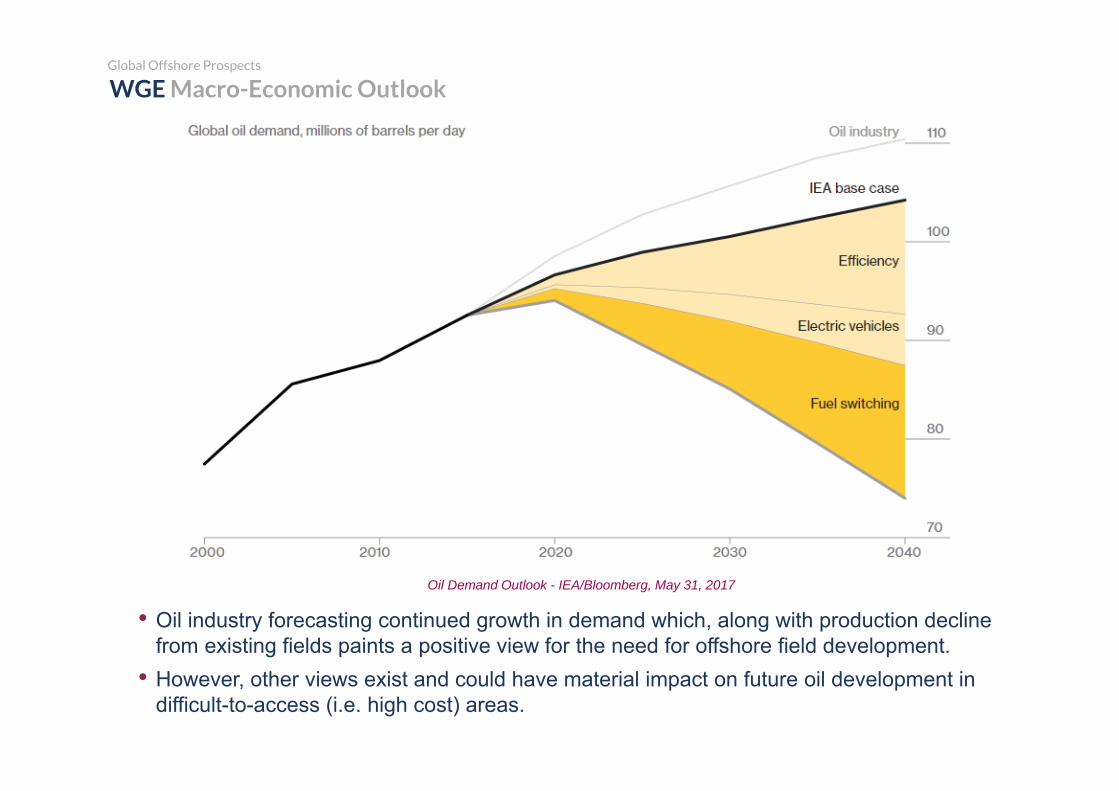
• Oil industry forecasting continued growth in demand which, along with production decline from existing fields paints a positive view for the need for offshore field development.
• However, other views exist and could have material impact on future oil development in difficult-to-access (i.e. high cost) areas.
Oil Demand Outlook - IEA/Bloomberg, May 31, 2017
WGE Macro-Economic OutlookGlobal Offshore Prospects
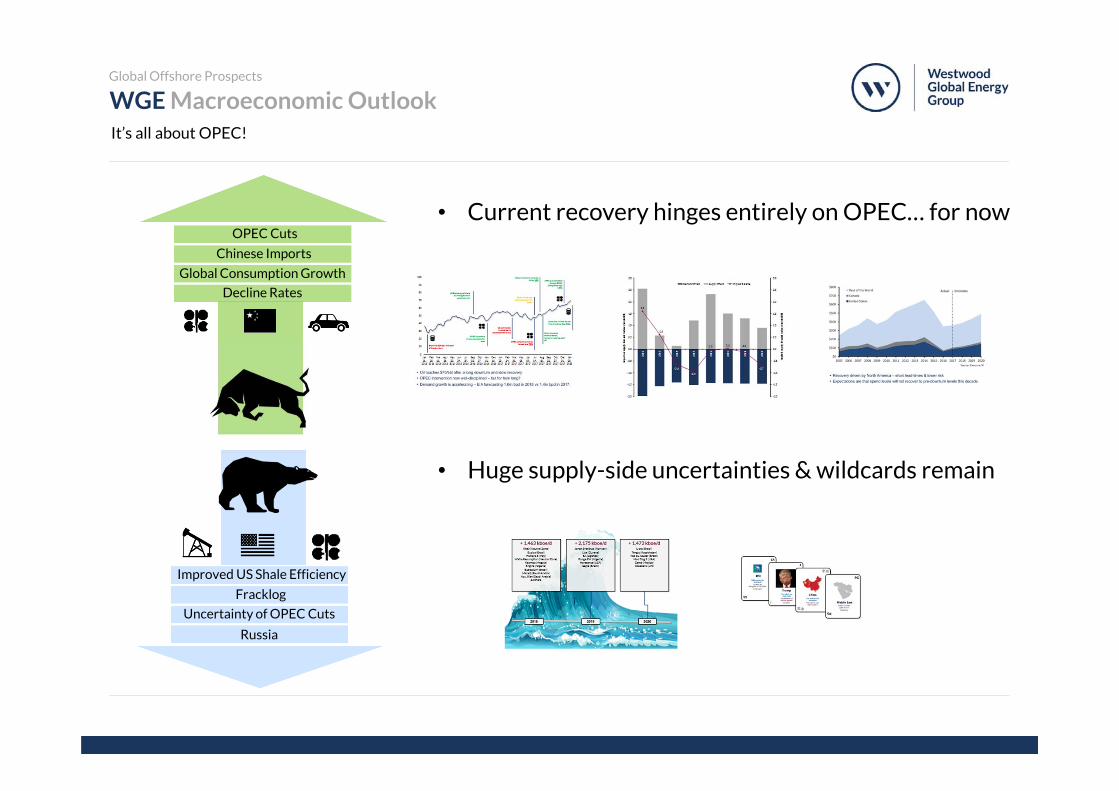
WGE Macroeconomic OutlookIt’s all about OPEC!
Global Offshore Prospects
• Current recovery hinges entirely on OPEC… for now
Uncertainty of OPEC Cuts
Fracklog
Improved US Shale Efficiency
Russia
Global Consumption Growth
Chinese Imports
OPEC Cuts
Decline Rates
• Huge supply-side uncertainties & wildcards remain
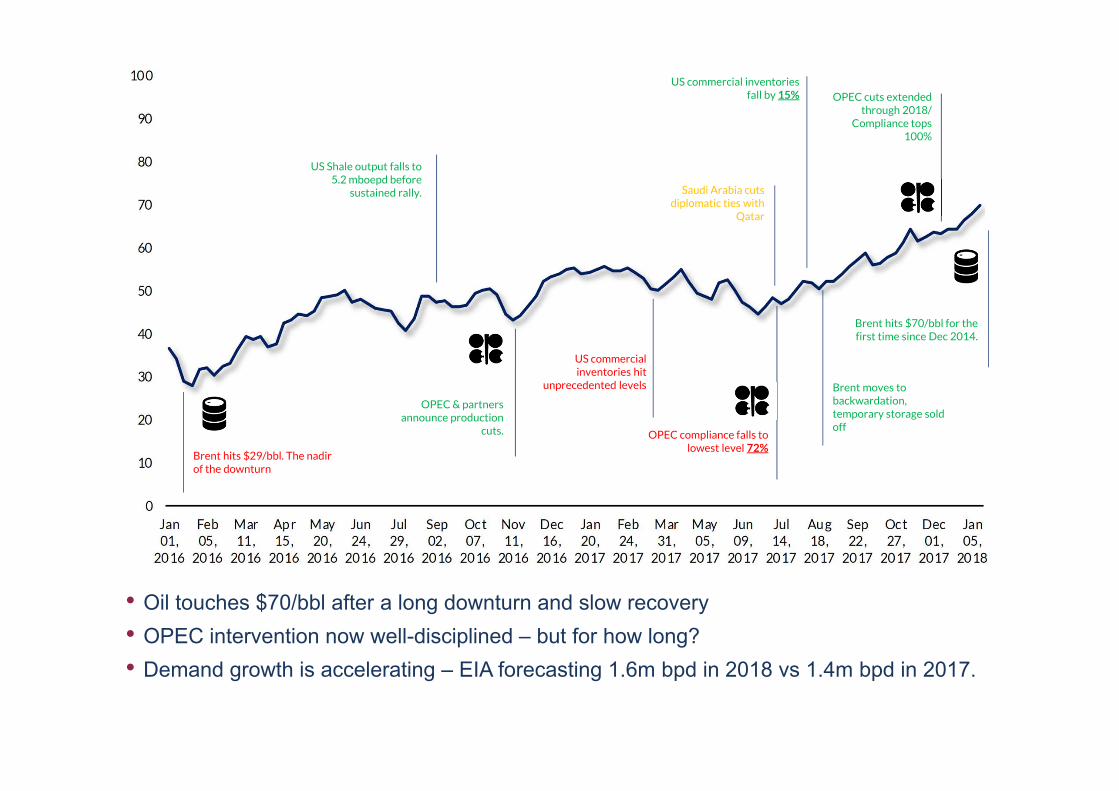
$28/bblPrices hit a low point in Jan 22 – the nadir of the downturn...
Brent hits $29/bbl. The nadir of the downturn
OPEC compliance falls to lowest level 72%
$54/bblMarket
US commercial inventories hit
unprecedented levels
OPEC cuts extended through 2018/
Compliance tops 100%
US Shale output falls to 5.2 mboepd before
sustained rally.
Brent hits $70/bbl for the first time since Dec 2014.
Brent moves to backwardation, temporary storage sold off
Saudi Arabia cuts diplomatic ties with
Qatar
OPEC & partners announce production
cuts.
US commercial inventories fall by 15%
• Oil touches $70/bbl after a long downturn and slow recovery• OPEC intervention now well-disciplined – but for how long?• Demand growth is accelerating – EIA forecasting 1.6m bpd in 2018 vs 1.4m bpd in 2017.
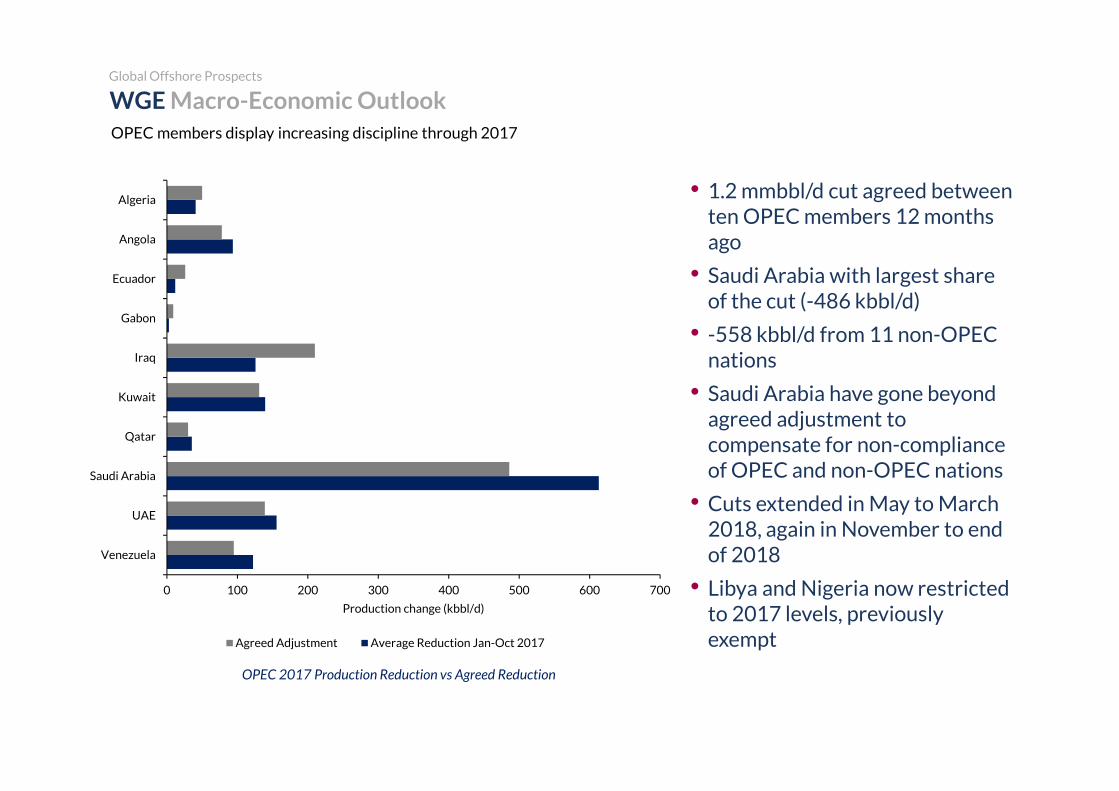
WGE Macro-Economic OutlookOPEC members display increasing discipline through 2017
Global Offshore Prospects
0 100 200 300 400 500 600 700
Venezuela
UAE
Saudi Arabia
Qatar
Kuwait
Iraq
Gabon
Ecuador
Angola
Algeria
Production change (kbbl/d)
Agreed Adjustment Average Reduction Jan-Oct 2017
• 1.2 mmbbl/d cut agreed between ten OPEC members 12 months ago
• Saudi Arabia with largest share of the cut (-486 kbbl/d)
• -558 kbbl/d from 11 non-OPEC nations
• Saudi Arabia have gone beyond agreed adjustment to compensate for non-compliance of OPEC and non-OPEC nations
• Cuts extended in May to March 2018, again in November to end of 2018
• Libya and Nigeria now restricted to 2017 levels, previously exempt
OPEC 2017 Production Reduction vs Agreed Reduction
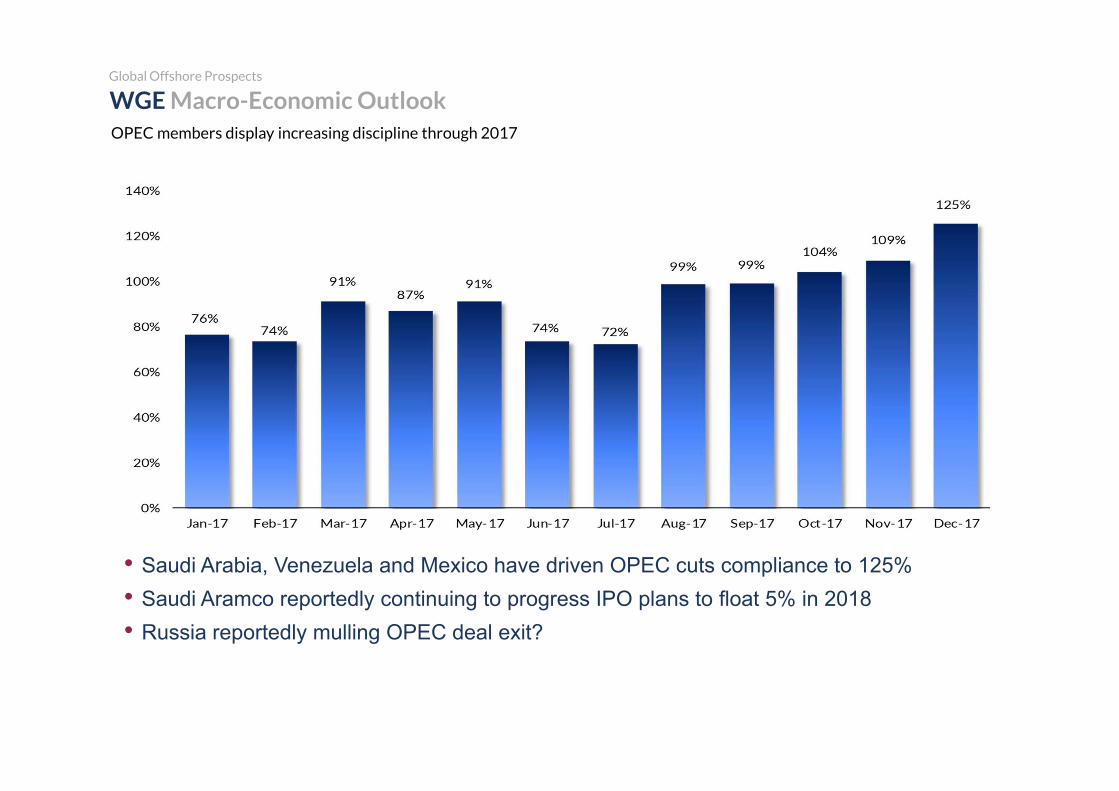
WGE Macro-Economic OutlookOPEC members display increasing discipline through 2017
Global Offshore Prospects
• Saudi Arabia, Venezuela and Mexico have driven OPEC cuts compliance to 125%• Saudi Aramco reportedly continuing to progress IPO plans to float 5% in 2018• Russia reportedly mulling OPEC deal exit?
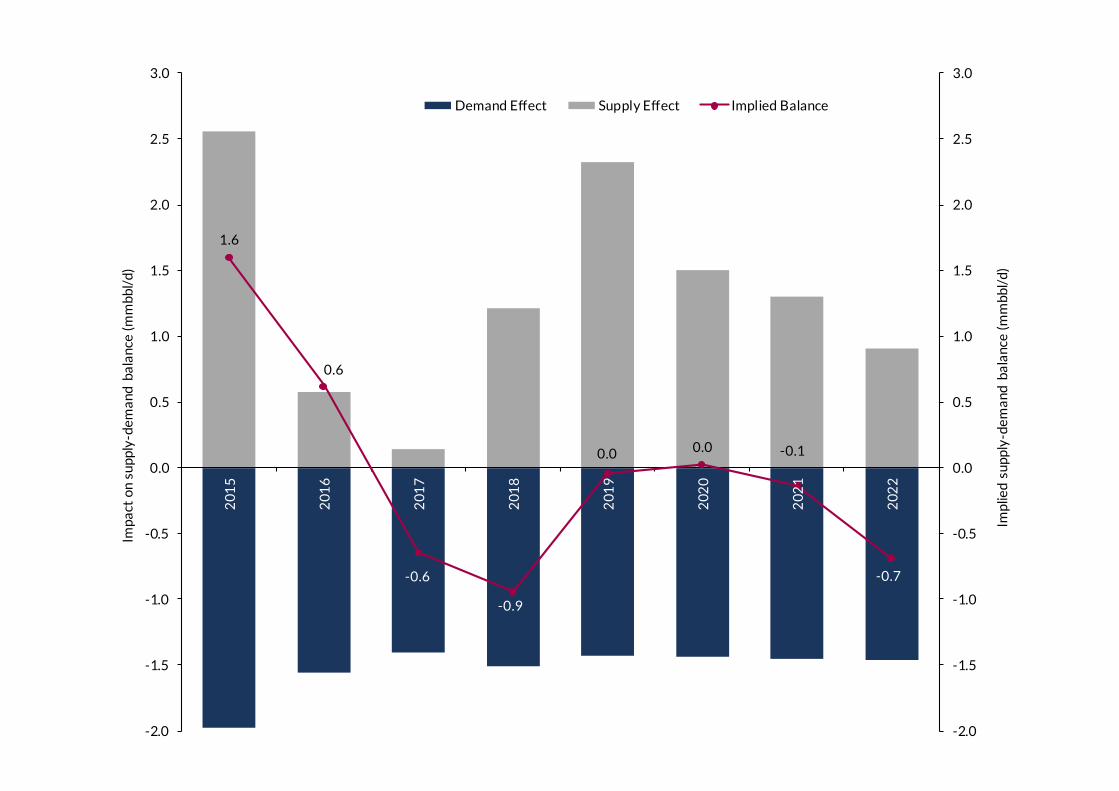
1.6
0.6
-0.6
-0.9
0.0 0.0 -0.1
-0.7
-2.0
-1.5
-1.0
-0.5
0.0
0.5
1.0
1.5
2.0
2.5
3.0
-2.0
-1.5
-1.0
-0.5
0.0
0.5
1.0
1.5
2.0
2.5
3.0
201
5
201
6
201
7
201
8
201
9
202
0
202
1
202
2
Impl
ied
supp
ly-d
eman
d ba
lanc
e (m
mbb
l/d)
Impa
ct o
n su
pply
-dem
and
bala
nce
(mm
bbl/
d)
Demand Effect Supply Effect Implied Balance
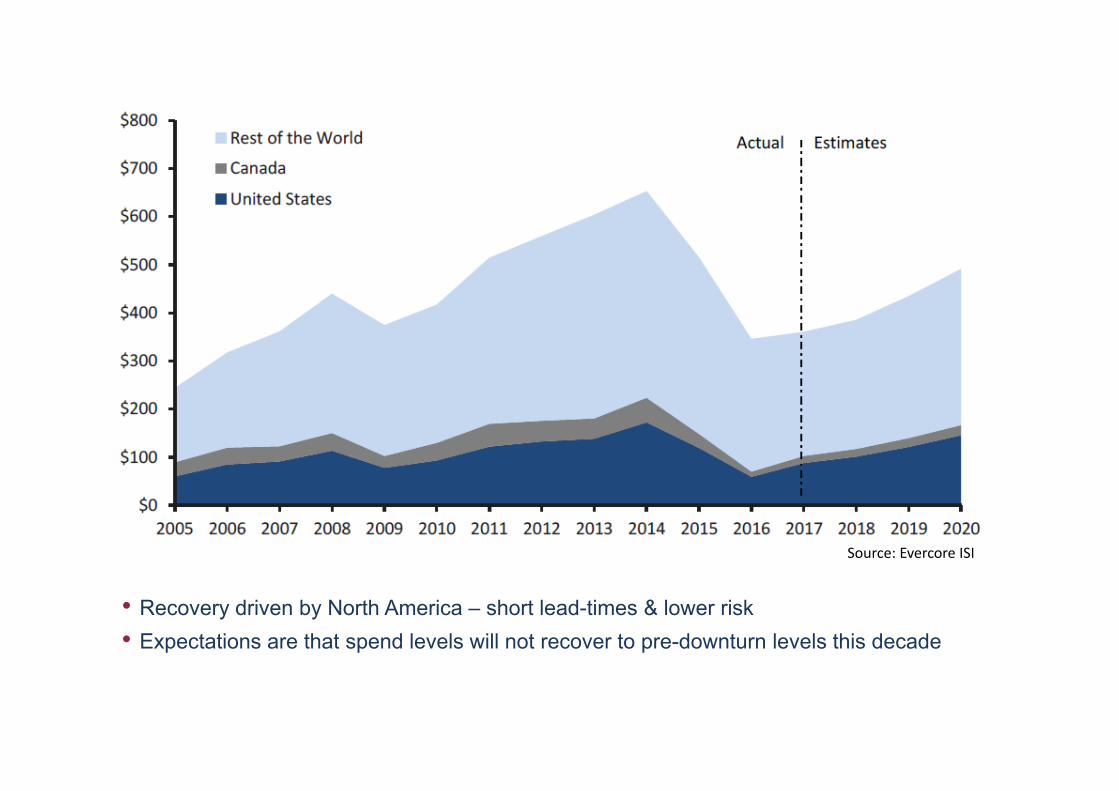
• Recovery driven by North America – short lead-times & lower risk• Expectations are that spend levels will not recover to pre-downturn levels this decade
Source: Evercore ISI
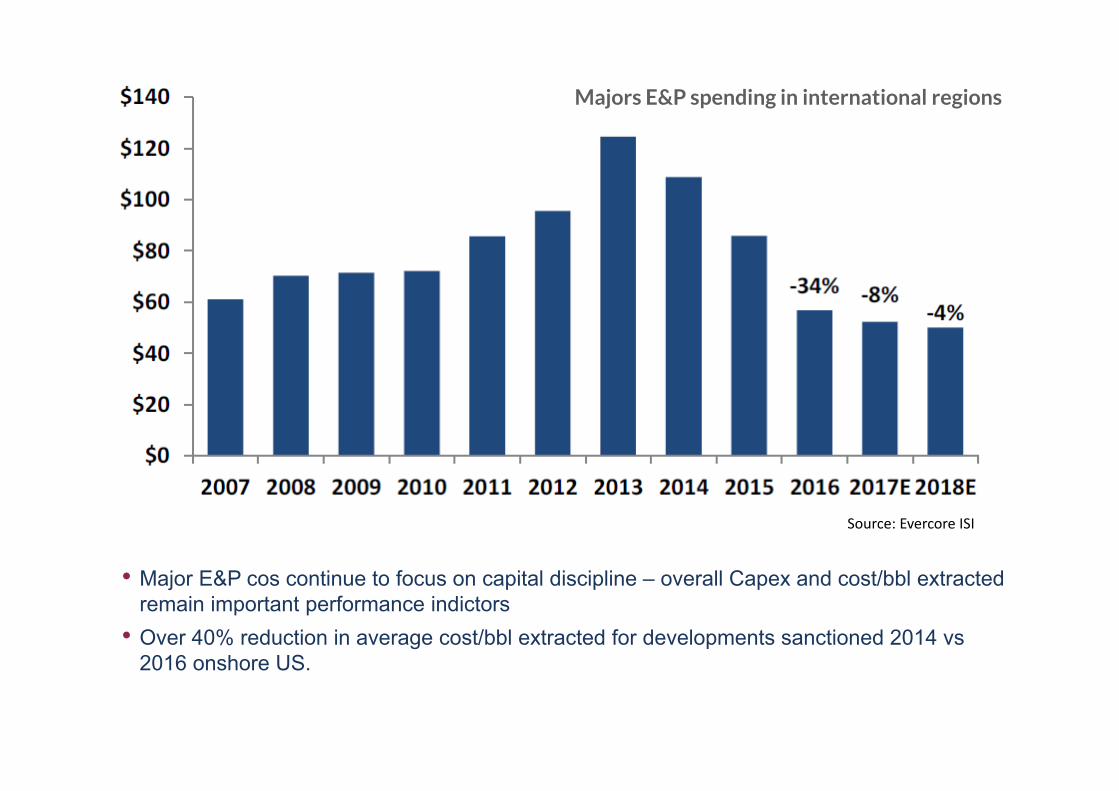
Majors E&P spending in international regions
• Major E&P cos continue to focus on capital discipline – overall Capex and cost/bbl extracted remain important performance indictors
• Over 40% reduction in average cost/bbl extracted for developments sanctioned 2014 vs 2016 onshore US.
Source: Evercore ISI
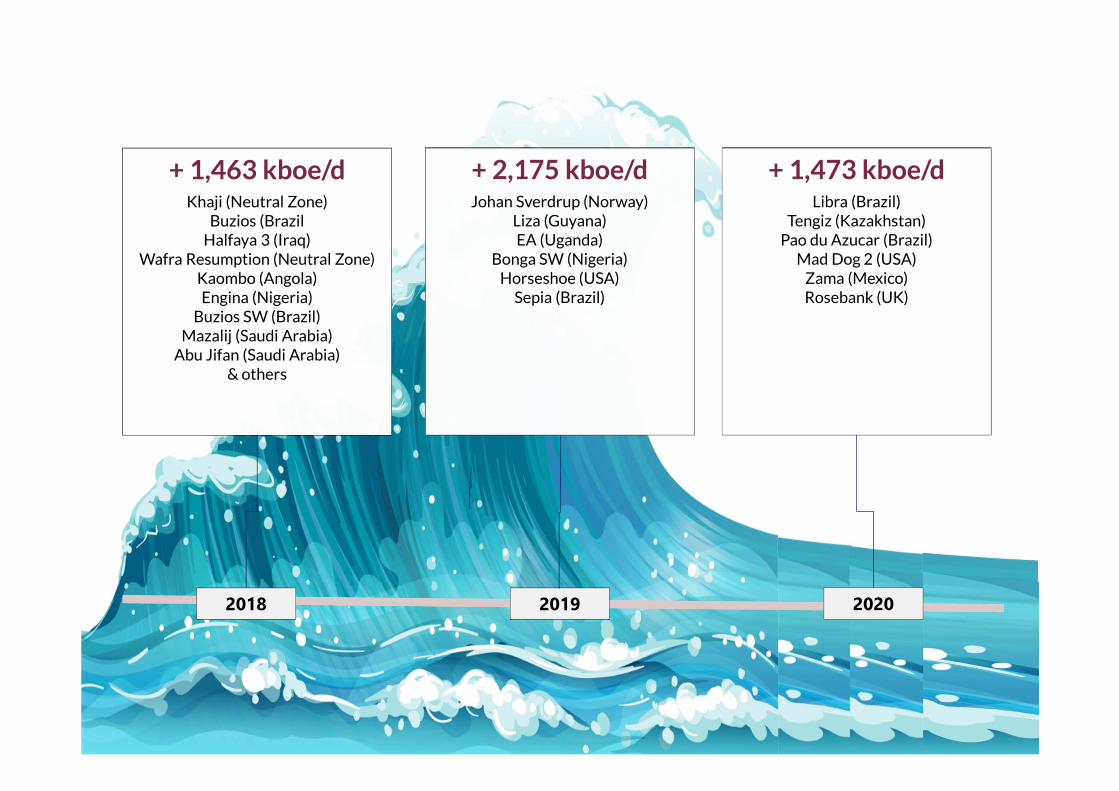
2018 2019 2020
+ 1,463 kboe/dKhaji (Neutral Zone)
Buzios (BrazilHalfaya 3 (Iraq)
Wafra Resumption (Neutral Zone)Kaombo (Angola)Engina (Nigeria)
Buzios SW (Brazil)Mazalij (Saudi Arabia)
Abu Jifan (Saudi Arabia)& others
+ 1,463 kboe/dKhaji (Neutral Zone)
Buzios (BrazilHalfaya 3 (Iraq)
Wafra Resumption (Neutral Zone)Kaombo (Angola)Engina (Nigeria)
Buzios SW (Brazil)Mazalij (Saudi Arabia)
Abu Jifan (Saudi Arabia)& others
+ 2,175 kboe/dJohan Sverdrup (Norway)
Liza (Guyana)EA (Uganda)
Bonga SW (Nigeria)Horseshoe (USA)
Sepia (Brazil)
+ 2,175 kboe/dJohan Sverdrup (Norway)
Liza (Guyana)EA (Uganda)
Bonga SW (Nigeria)Horseshoe (USA)
Sepia (Brazil)
+ 1,473 kboe/dLibra (Brazil)
Tengiz (Kazakhstan)Pao du Azucar (Brazil)
Mad Dog 2 (USA)Zama (Mexico)Rosebank (UK)
+ 1,473 kboe/dLibra (Brazil)
Tengiz (Kazakhstan)Pao du Azucar (Brazil)
Mad Dog 2 (USA)Zama (Mexico)Rosebank (UK)
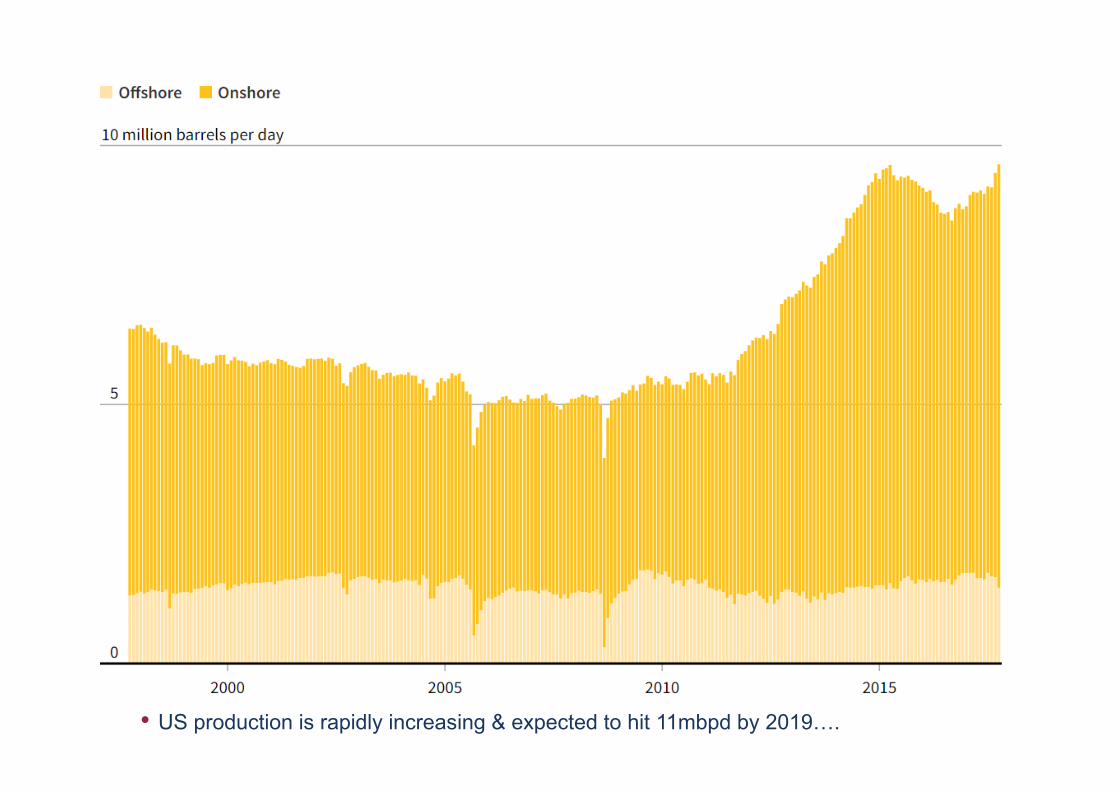
• US production is rapidly increasing & expected to hit 11mbpd by 2019….
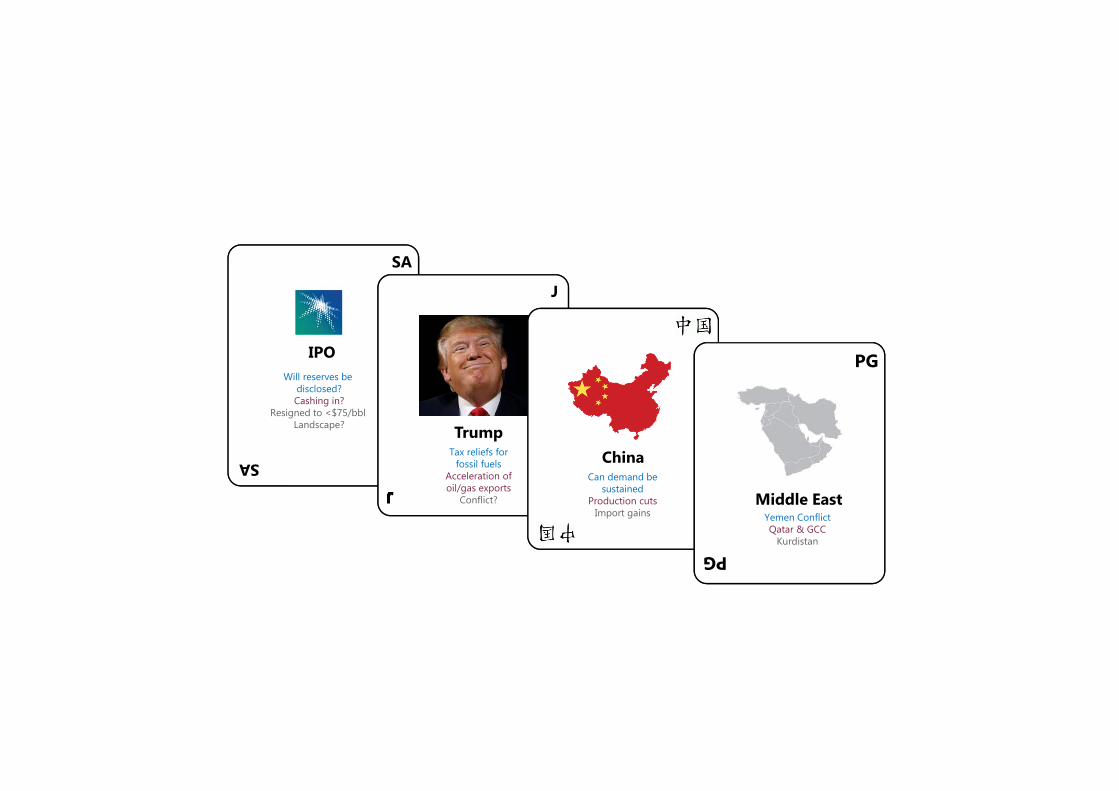
SA
SA
IPOWill reserves be
disclosed?Cashing in?
Resigned to <$75/bbl Landscape?
J
TrumpTax reliefs for
fossil fuelsAcceleration of oil/gas exports
Conflict?
ChinaCan demand be
sustainedProduction cuts
Import gains
PG
PG
Middle EastYemen ConflictQatar & GCC
Kurdistan

03Offshore Sector
Forecasts &
Leading Indicators
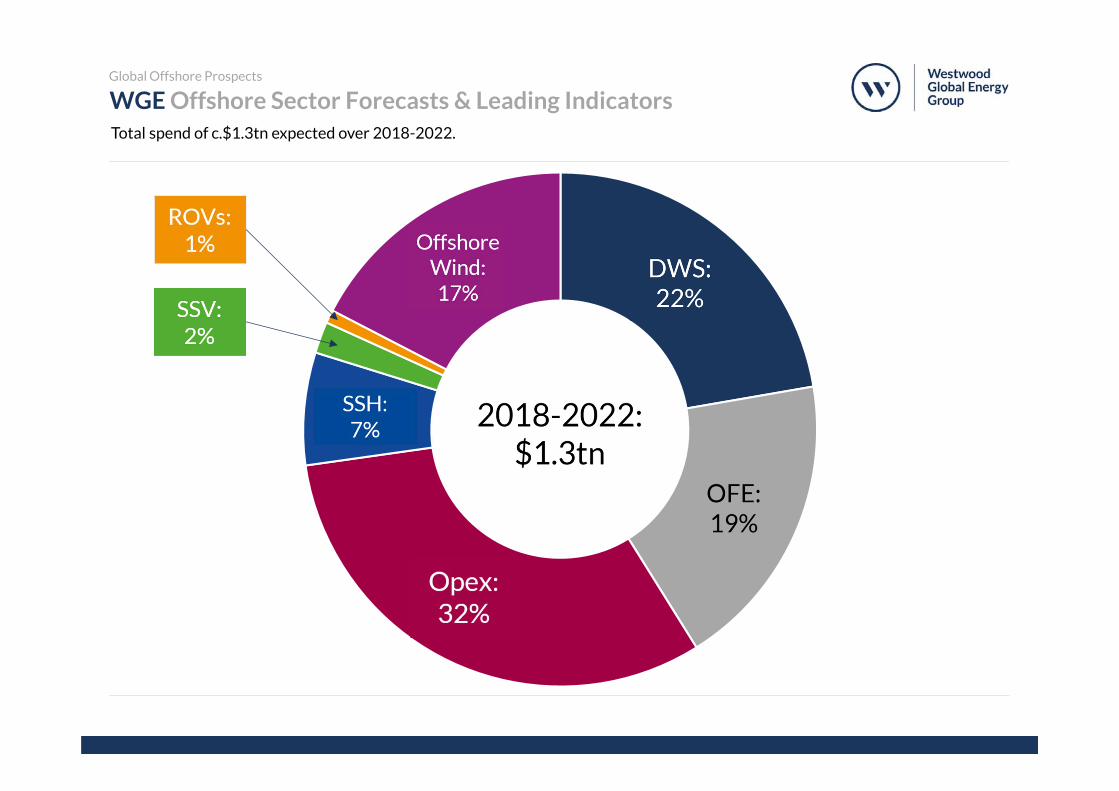
WGE Offshore Sector Forecasts & Leading IndicatorsGlobal Offshore Prospects
Total spend of c.$1.3tn expected over 2018-2022.
02013 2014 2015 2016 2017 2018 2019 2020 2021 2022
Dev
elop
men
t W
ells
Dri
lled
Subsea Surface
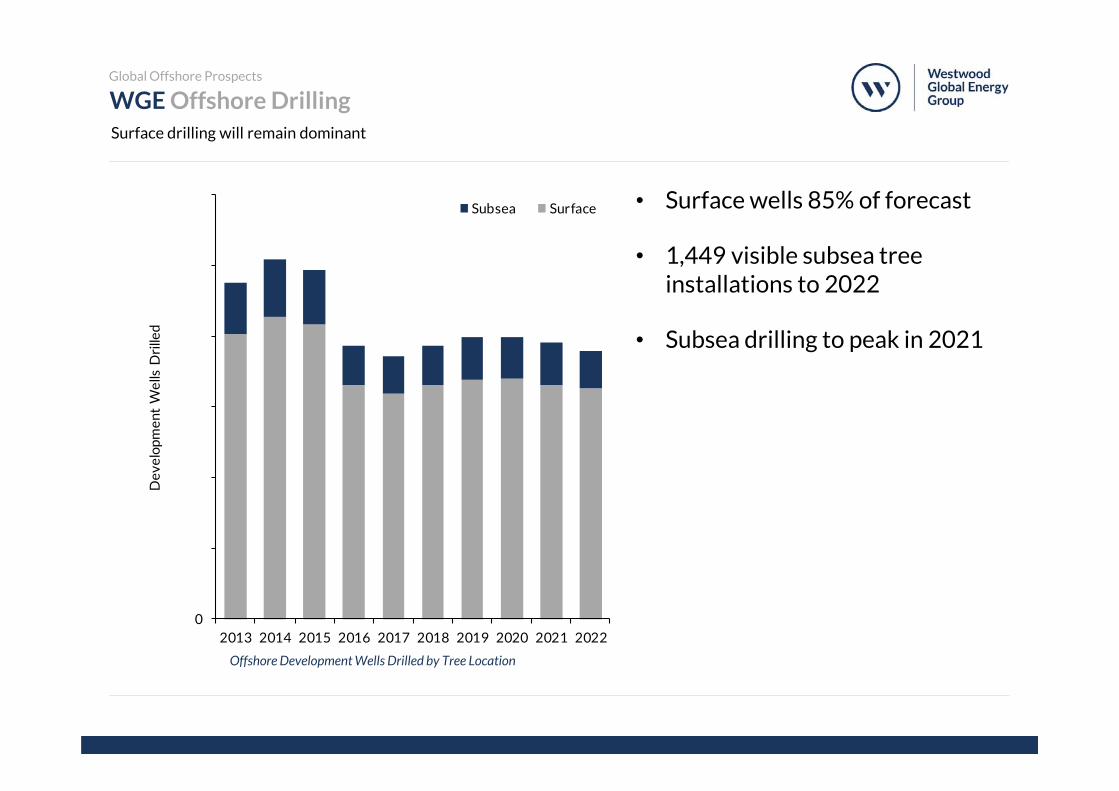
WGE Offshore DrillingSurface drilling will remain dominant
Global Offshore Prospects
Offshore Development Wells Drilled by Tree Location
• Surface wells 85% of forecast
• 1,449 visible subsea tree installations to 2022
• Subsea drilling to peak in 2021
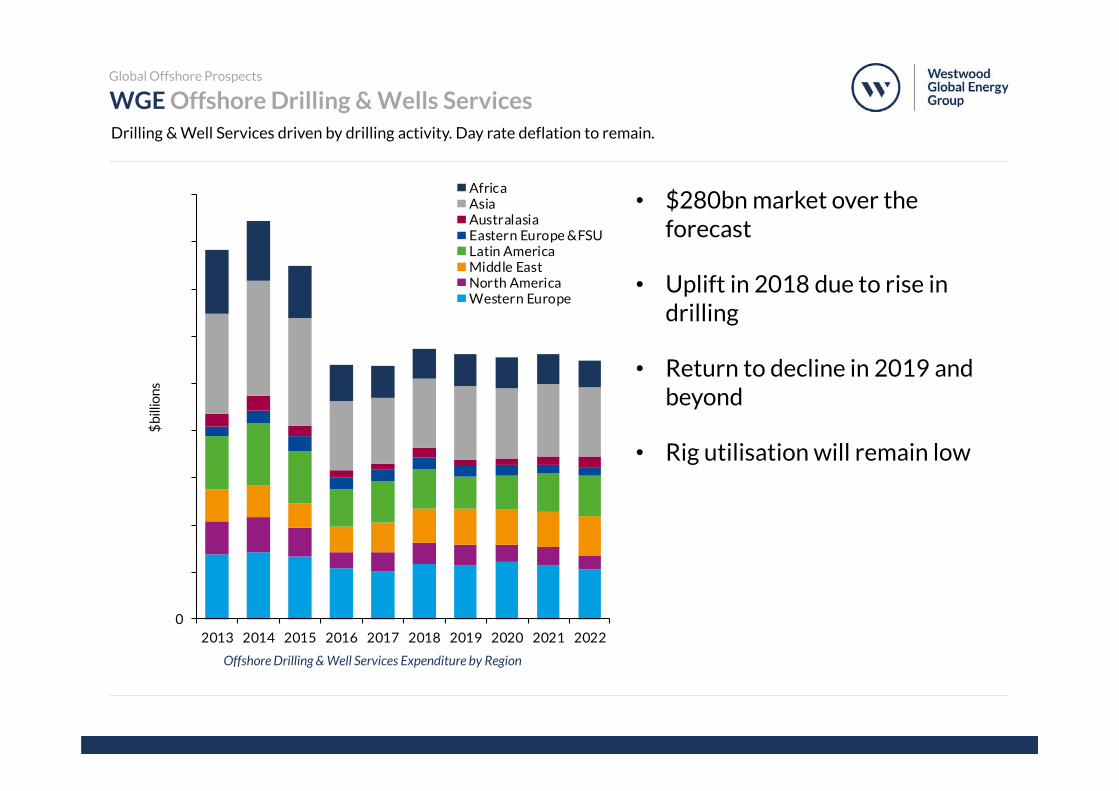
WGE Offshore Drilling & Wells ServicesDrilling & Well Services driven by drilling activity. Day rate deflation to remain.
Global Offshore Prospects
Offshore Drilling & Well Services Expenditure by Region
02013 2014 2015 2016 2017 2018 2019 2020 2021 2022
$bi
llion
s
AfricaAsiaAustralasiaEastern Europe &FSULatin AmericaMiddle EastNorth AmericaWestern Europe
• $280bn market over the forecast
• Uplift in 2018 due to rise in drilling
• Return to decline in 2019 and beyond
• Rig utilisation will remain low
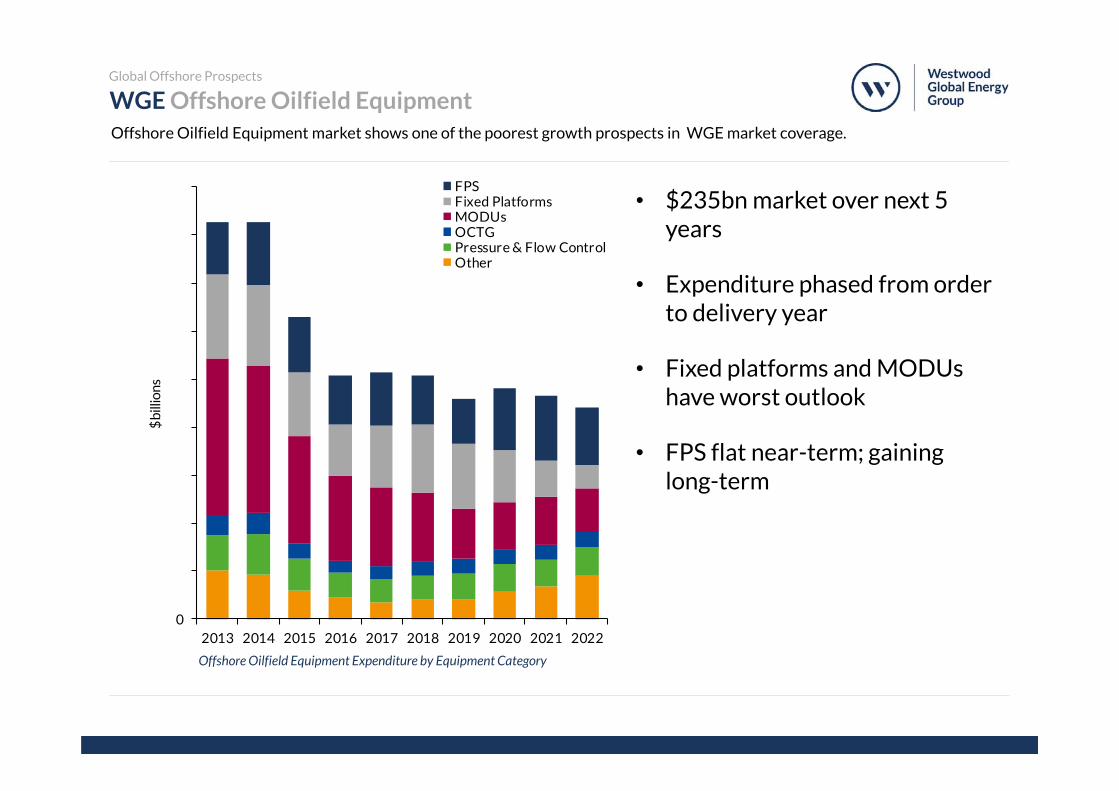
WGE Offshore Oilfield EquipmentOffshore Oilfield Equipment market shows one of the poorest growth prospects in WGE market coverage.
Global Offshore Prospects
Offshore Oilfield Equipment Expenditure by Equipment Category
02013 2014 2015 2016 2017 2018 2019 2020 2021 2022
$bi
llion
s
FPSFixed PlatformsMODUsOCTGPressure & Flow ControlOther
• $235bn market over next 5 years
• Expenditure phased from order to delivery year
• Fixed platforms and MODUs have worst outlook
• FPS flat near-term; gaining long-term
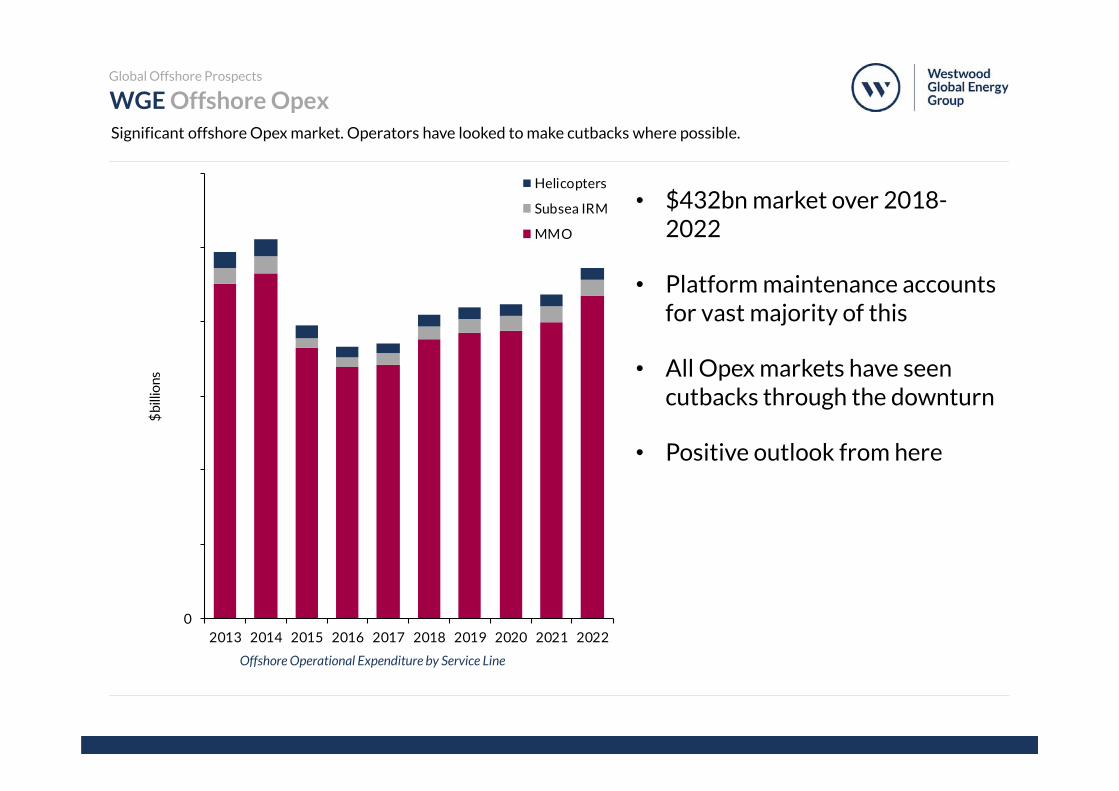
WGE Offshore OpexSignificant offshore Opex market. Operators have looked to make cutbacks where possible.
Global Offshore Prospects
Offshore Operational Expenditure by Service Line
02013 2014 2015 2016 2017 2018 2019 2020 2021 2022
$bi
llion
s
Helicopters
Subsea IRM
MMO
• $432bn market over 2018-2022
• Platform maintenance accounts for vast majority of this
• All Opex markets have seen cutbacks through the downturn
• Positive outlook from here
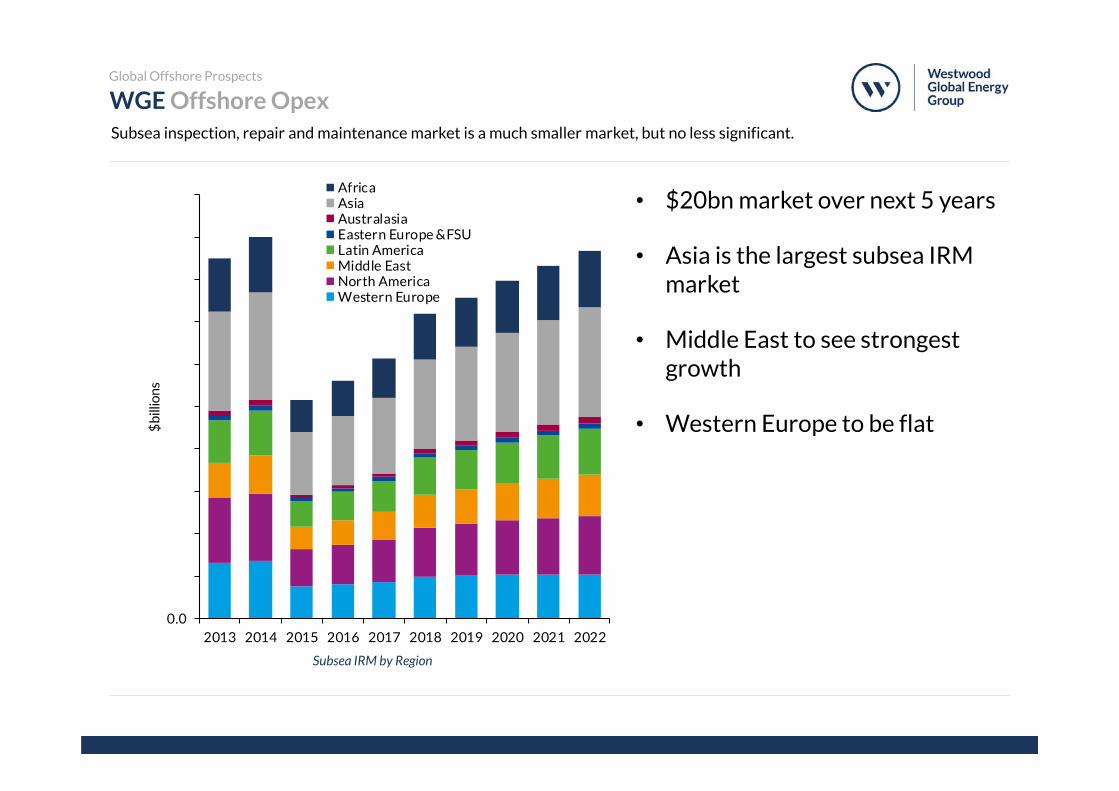
WGE Offshore OpexSubsea inspection, repair and maintenance market is a much smaller market, but no less significant.
Global Offshore Prospects
Subsea IRM by Region
0.02013 2014 2015 2016 2017 2018 2019 2020 2021 2022
$bi
llion
s
AfricaAsiaAustralasiaEastern Europe &FSULatin AmericaMiddle EastNorth AmericaWestern Europe
• $20bn market over next 5 years
• Asia is the largest subsea IRM market
• Middle East to see strongest growth
• Western Europe to be flat
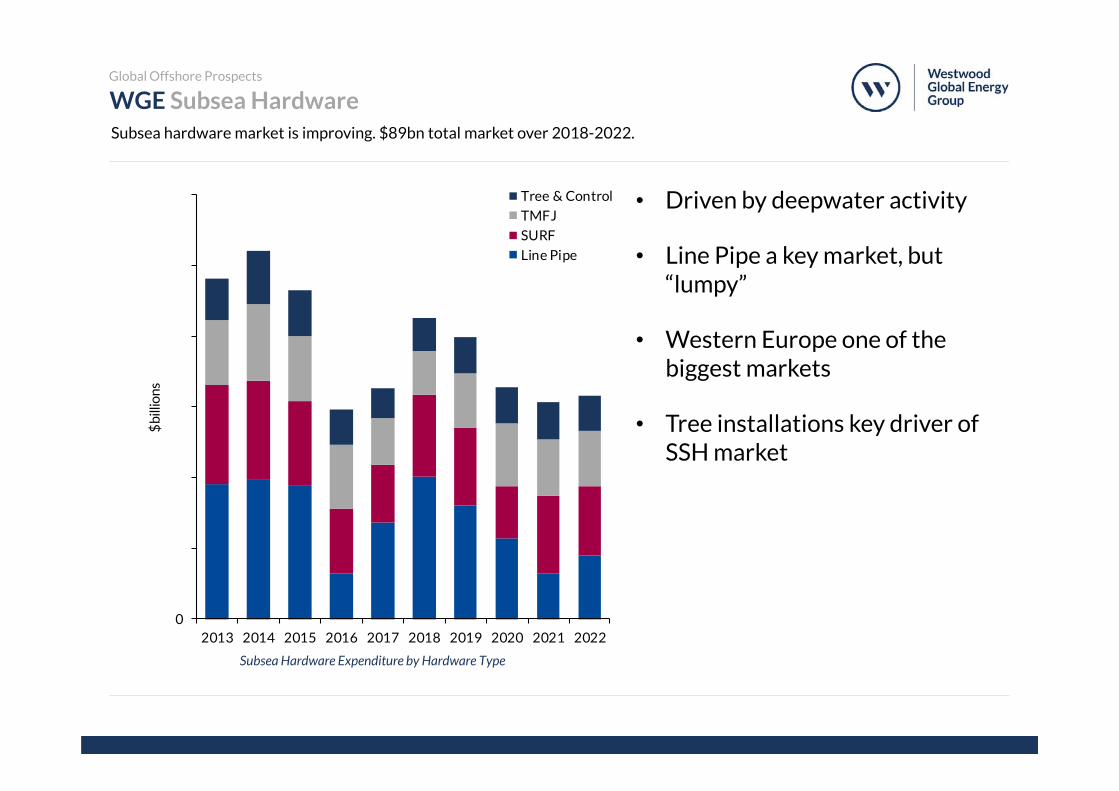
WGE Subsea HardwareSubsea hardware market is improving. $89bn total market over 2018-2022.
Global Offshore Prospects
Subsea Hardware Expenditure by Hardware Type
02013 2014 2015 2016 2017 2018 2019 2020 2021 2022
$bi
llion
s
Tree & Control
TMFJ
SURF
Line Pipe
• Driven by deepwater activity
• Line Pipe a key market, but “lumpy”
• Western Europe one of the biggest markets
• Tree installations key driver of SSH market
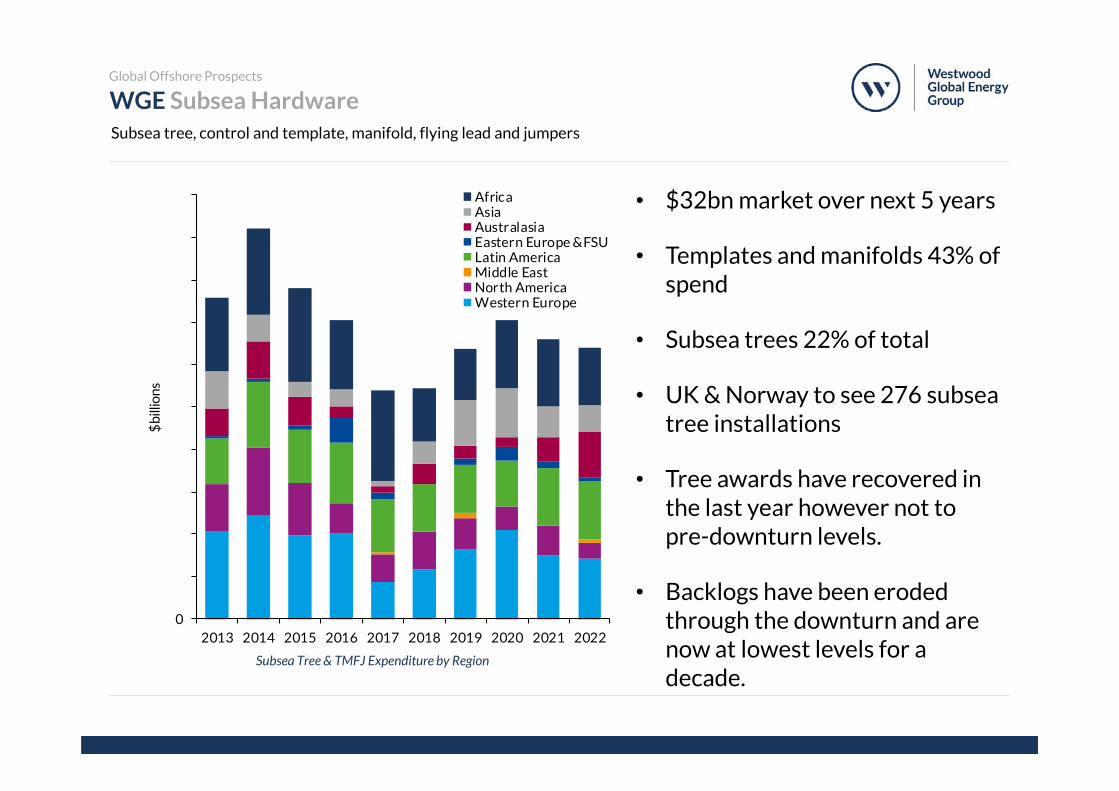
WGE Subsea HardwareSubsea tree, control and template, manifold, flying lead and jumpers
Global Offshore Prospects
Subsea Tree & TMFJ Expenditure by Region
02013 2014 2015 2016 2017 2018 2019 2020 2021 2022
$bi
llion
s
AfricaAsiaAustralasiaEastern Europe &FSULatin AmericaMiddle EastNorth AmericaWestern Europe
• $32bn market over next 5 years
• Templates and manifolds 43% of spend
• Subsea trees 22% of total
• UK & Norway to see 276 subsea tree installations
• Tree awards have recovered in the last year however not to pre-downturn levels.
• Backlogs have been eroded through the downturn and are now at lowest levels for a decade.
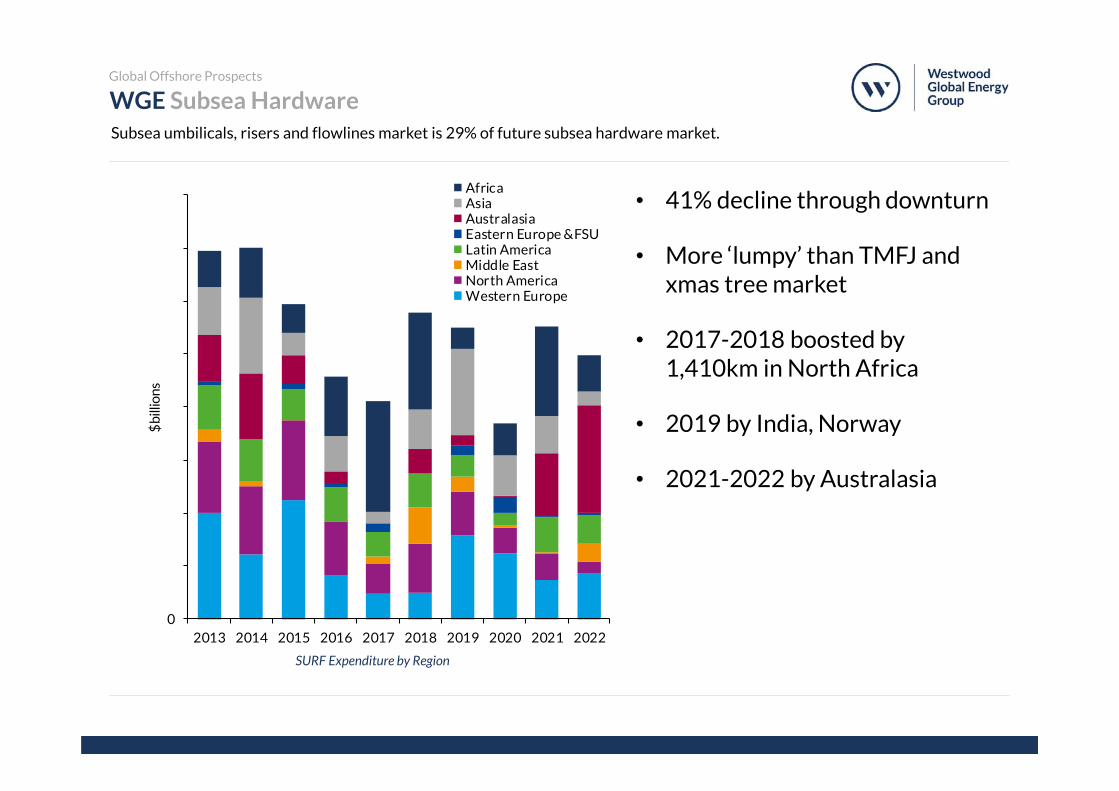
WGE Subsea HardwareSubsea umbilicals, risers and flowlines market is 29% of future subsea hardware market.
Global Offshore Prospects
SURF Expenditure by Region
02013 2014 2015 2016 2017 2018 2019 2020 2021 2022
$bi
llion
s
AfricaAsiaAustralasiaEastern Europe &FSULatin AmericaMiddle EastNorth AmericaWestern Europe
• 41% decline through downturn
• More ‘lumpy’ than TMFJ and xmas tree market
• 2017-2018 boosted by 1,410km in North Africa
• 2019 by India, Norway
• 2021-2022 by Australasia
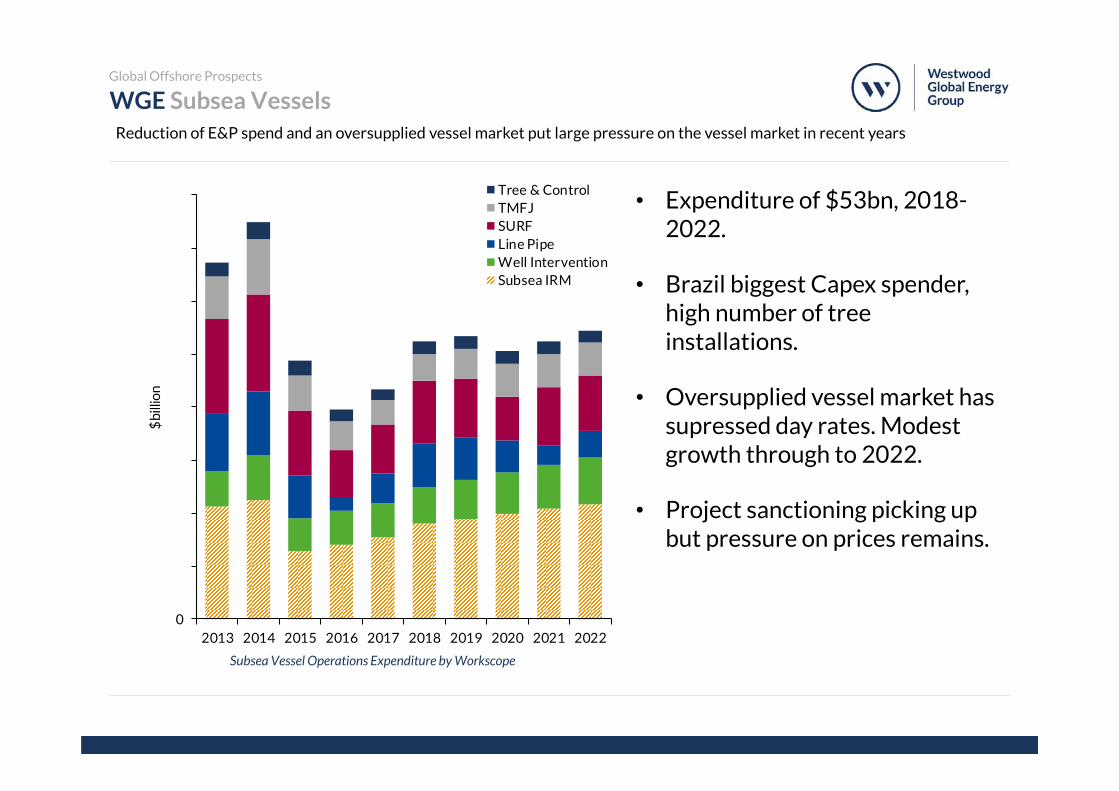
WGE Subsea VesselsReduction of E&P spend and an oversupplied vessel market put large pressure on the vessel market in recent years
Global Offshore Prospects
Subsea Vessel Operations Expenditure by Workscope
• Expenditure of $53bn, 2018-2022.
• Brazil biggest Capex spender, high number of tree installations.
• Oversupplied vessel market has supressed day rates. Modest growth through to 2022.
• Project sanctioning picking up but pressure on prices remains.
02013 2014 2015 2016 2017 2018 2019 2020 2021 2022
$bi
llion
Tree & ControlTMFJSURFLine PipeWell InterventionSubsea IRM
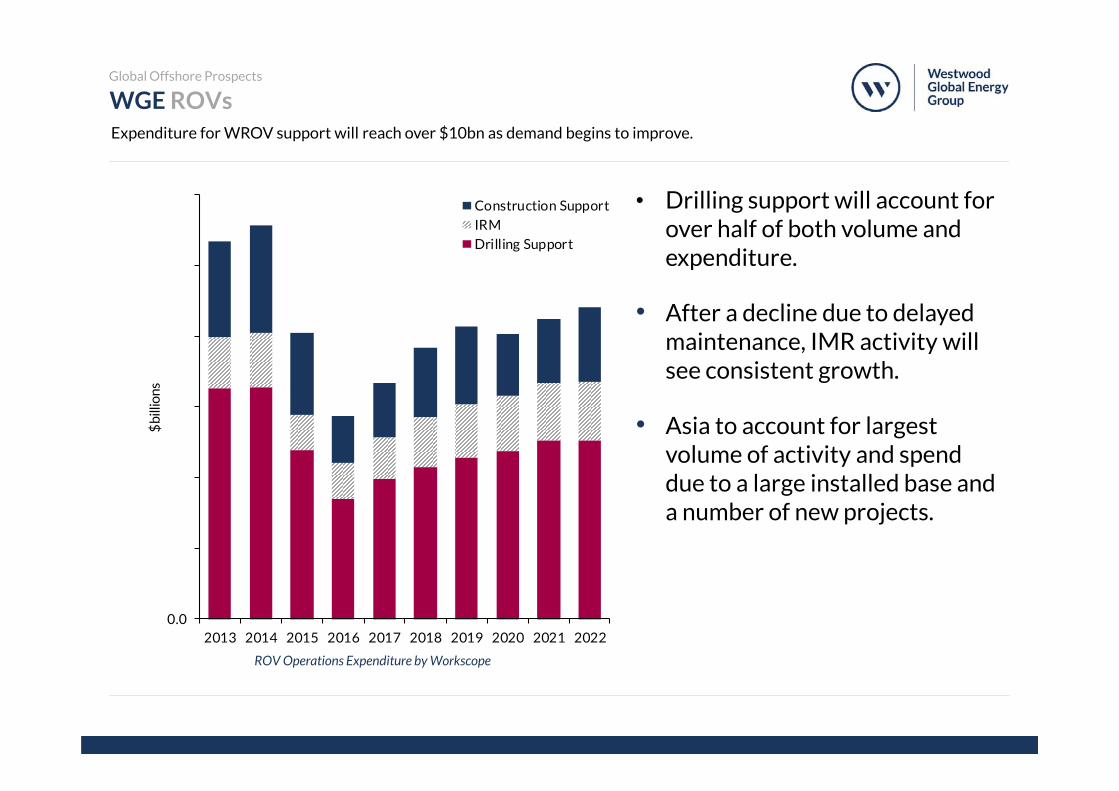
WGE ROVsExpenditure for WROV support will reach over $10bn as demand begins to improve.
Global Offshore Prospects
ROV Operations Expenditure by Workscope
• Drilling support will account for over half of both volume and expenditure.
• After a decline due to delayed maintenance, IMR activity will see consistent growth.
• Asia to account for largest volume of activity and spend due to a large installed base and a number of new projects.
0.02013 2014 2015 2016 2017 2018 2019 2020 2021 2022
$bi
llion
s
Construction Support
IRM
Drilling Support
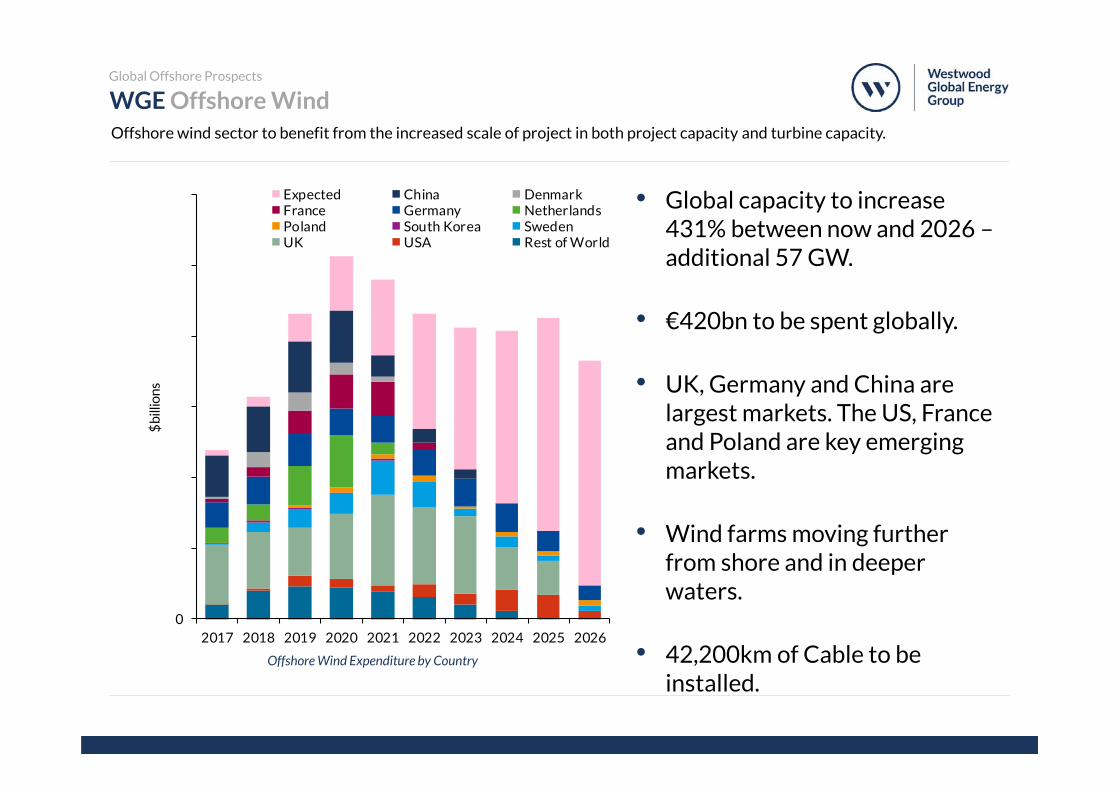
WGE Offshore WindOffshore wind sector to benefit from the increased scale of project in both project capacity and turbine capacity.
Global Offshore Prospects
Offshore Wind Expenditure by Country
02017 2018 2019 2020 2021 2022 2023 2024 2025 2026
$bi
llion
s
Expected China DenmarkFrance Germany NetherlandsPoland South Korea SwedenUK USA Rest of World
• Global capacity to increase 431% between now and 2026 –additional 57 GW.
• €420bn to be spent globally.
• UK, Germany and China are largest markets. The US, France and Poland are key emerging markets.
• Wind farms moving further from shore and in deeper waters.
• 42,200km of Cable to be installed.
02016 2018 2020 2022 2024 2026 2028 2030 2032 2034 2036 2038 2040
$b
illio
ns
FPS Removal Heavy TransportOnshore Deconstruction PSVSubstructure Removal Topside RemovalWell Decommissioning
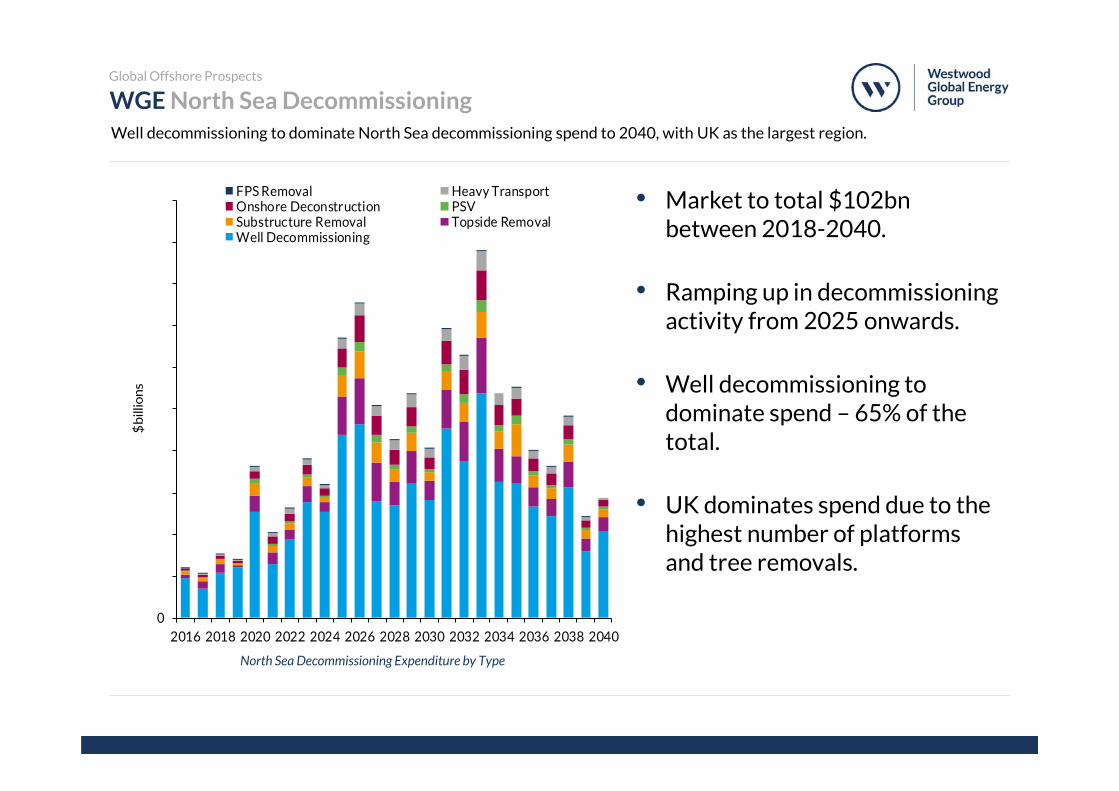
WGE North Sea DecommissioningWell decommissioning to dominate North Sea decommissioning spend to 2040, with UK as the largest region.
Global Offshore Prospects
North Sea Decommissioning Expenditure by Type
• Market to total $102bn between 2018-2040.
• Ramping up in decommissioning activity from 2025 onwards.
• Well decommissioning to dominate spend – 65% of the total.
• UK dominates spend due to the highest number of platforms and tree removals.

04 Countries in Focus
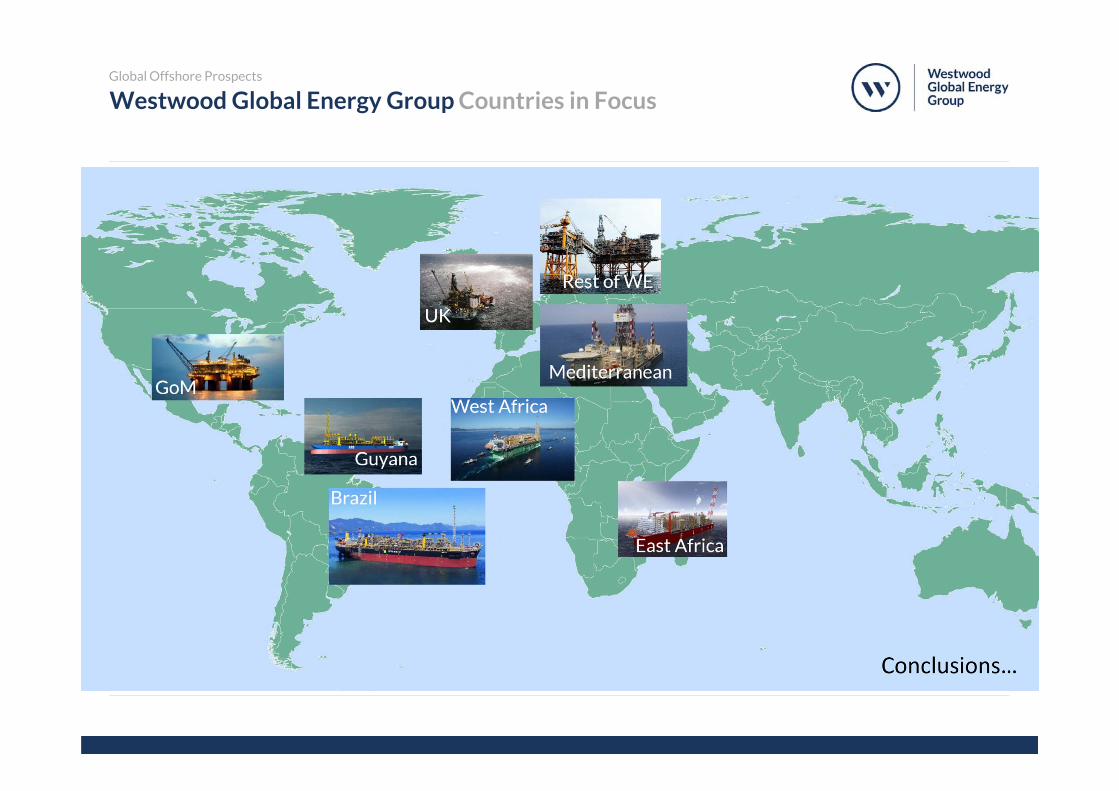
Westwood Global Energy Group Countries in FocusGlobal Offshore Prospects
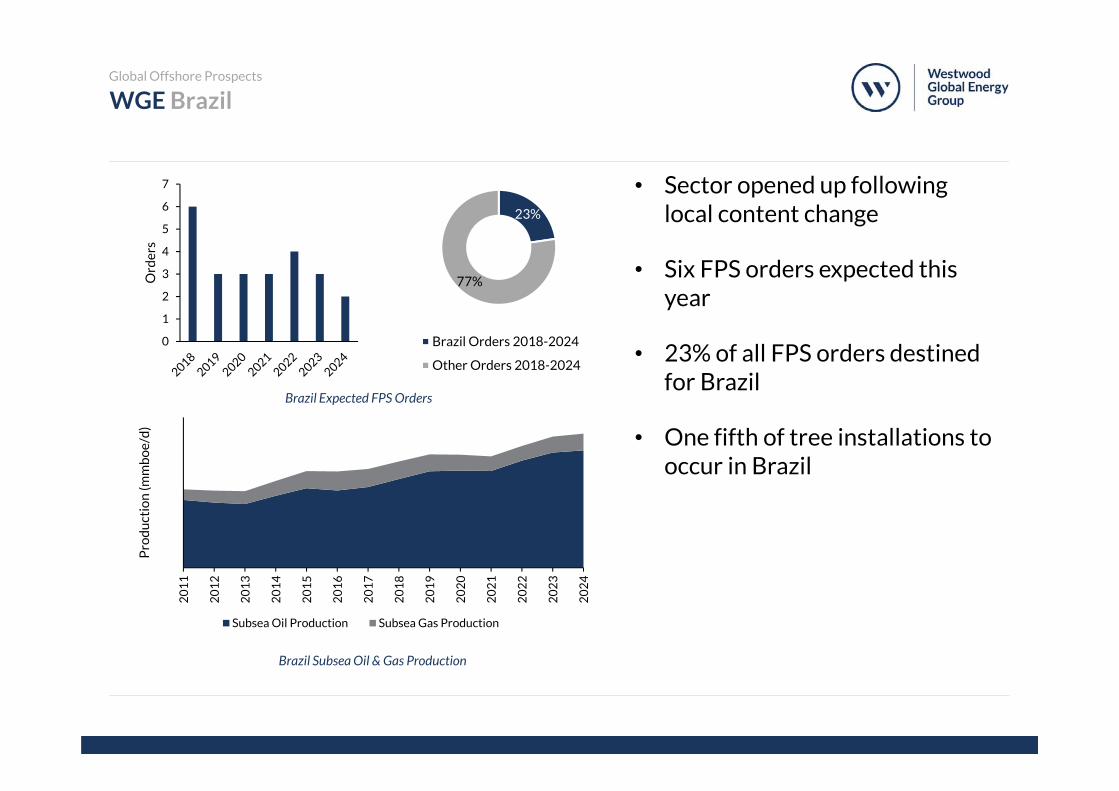
• Sector opened up following local content change
• Six FPS orders expected this year
• 23% of all FPS orders destined for Brazil
• One fifth of tree installations to occur in Brazil
WGE BrazilGlobal Offshore Prospects
Brazil Subsea Oil & Gas Production
20
11
20
12
20
13
20
14
20
15
20
16
20
17
20
18
20
19
20
20
20
21
20
22
20
23
20
24
Pro
du
ctio
n (m
mb
oe/
d)
Subsea Oil Production Subsea Gas Production
0
1
2
3
4
5
6
7
Ord
ers
23%
77%
Brazil Orders 2018-2024
Other Orders 2018-2024
Brazil Expected FPS Orders
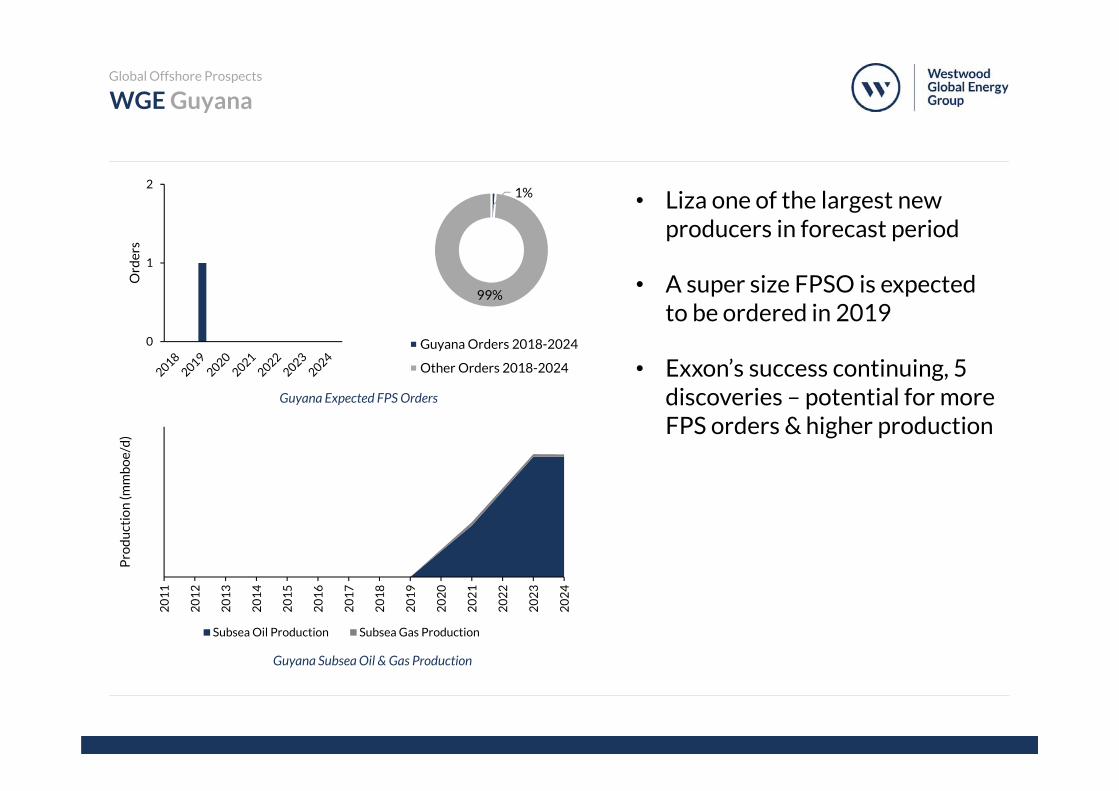
WGE GuyanaGlobal Offshore Prospects
Guyana Subsea Oil & Gas Production
• Liza one of the largest new producers in forecast period
• A super size FPSO is expected to be ordered in 2019
• Exxon’s success continuing, 5 discoveries – potential for more FPS orders & higher production
20
11
20
12
20
13
20
14
20
15
20
16
20
17
20
18
20
19
20
20
20
21
20
22
20
23
20
24
Pro
du
ctio
n (m
mb
oe/
d)
Subsea Oil Production Subsea Gas Production
0
1
2
Ord
ers
1%
99%
Guyana Orders 2018-2024
Other Orders 2018-2024
Guyana Expected FPS Orders
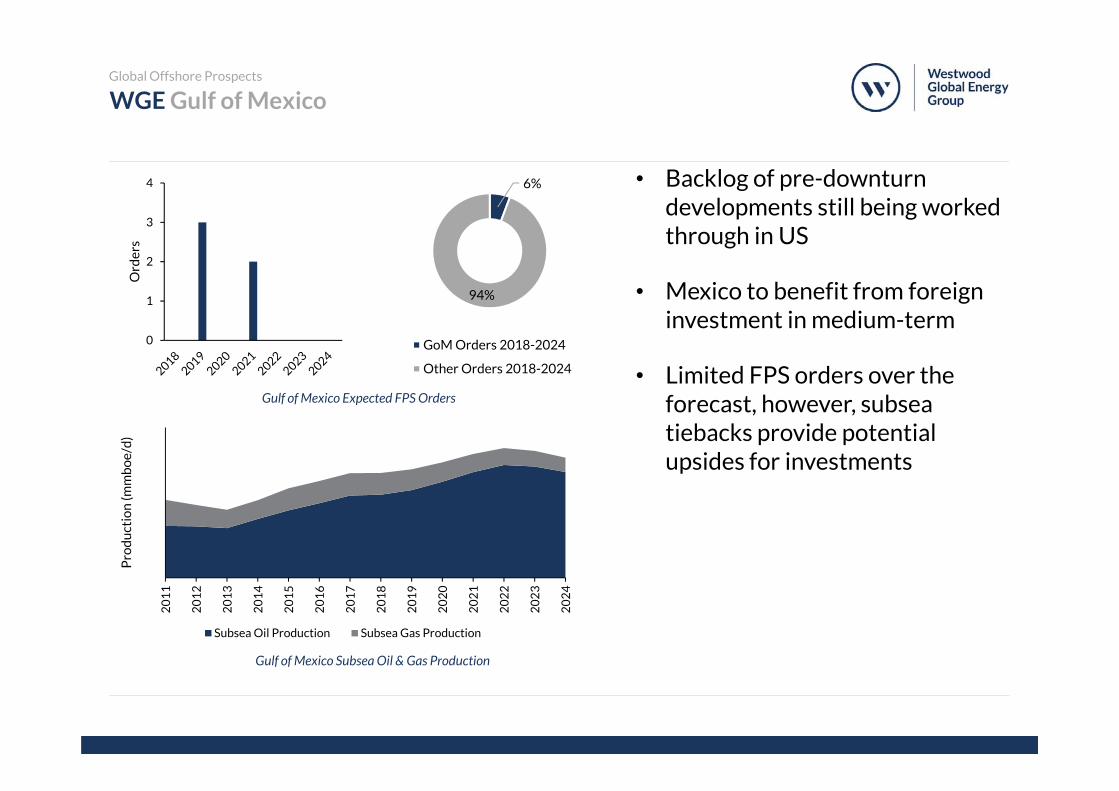
WGE Gulf of MexicoGlobal Offshore Prospects
Gulf of Mexico Subsea Oil & Gas Production
• Backlog of pre-downturn developments still being worked through in US
• Mexico to benefit from foreign investment in medium-term
• Limited FPS orders over the forecast, however, subsea tiebacks provide potential upsides for investments
20
11
20
12
20
13
20
14
20
15
20
16
20
17
20
18
20
19
20
20
20
21
20
22
20
23
20
24
Pro
du
ctio
n (m
mb
oe/
d)
Subsea Oil Production Subsea Gas Production
0
1
2
3
4
Ord
ers
6%
94%
GoM Orders 2018-2024
Other Orders 2018-2024
Gulf of Mexico Expected FPS Orders
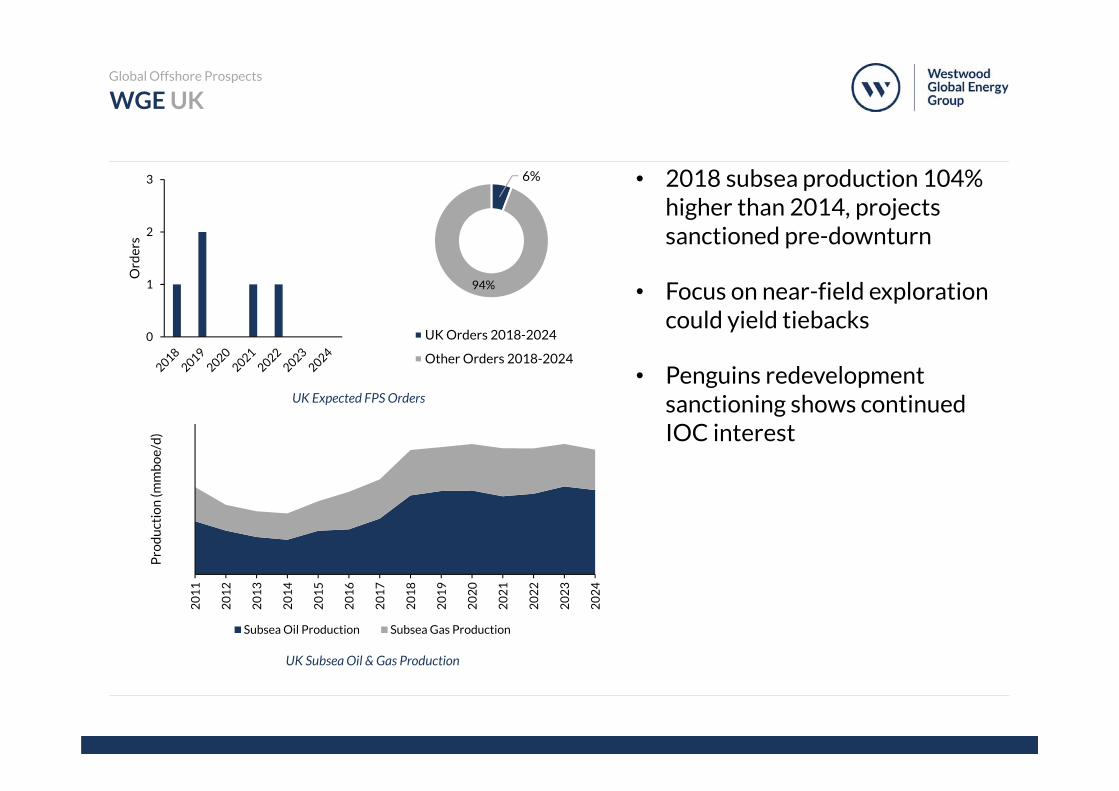
WGE UKGlobal Offshore Prospects
UK Subsea Oil & Gas Production
• 2018 subsea production 104% higher than 2014, projects sanctioned pre-downturn
• Focus on near-field exploration could yield tiebacks
• Penguins redevelopment sanctioning shows continued IOC interest
0
1
2
3
Ord
ers
6%
94%
UK Orders 2018-2024
Other Orders 2018-2024
20
11
20
12
20
13
20
14
20
15
20
16
20
17
20
18
20
19
20
20
20
21
20
22
20
23
20
24
Pro
du
ctio
n (m
mb
oe/
d)
Subsea Oil Production Subsea Gas Production
UK Expected FPS Orders
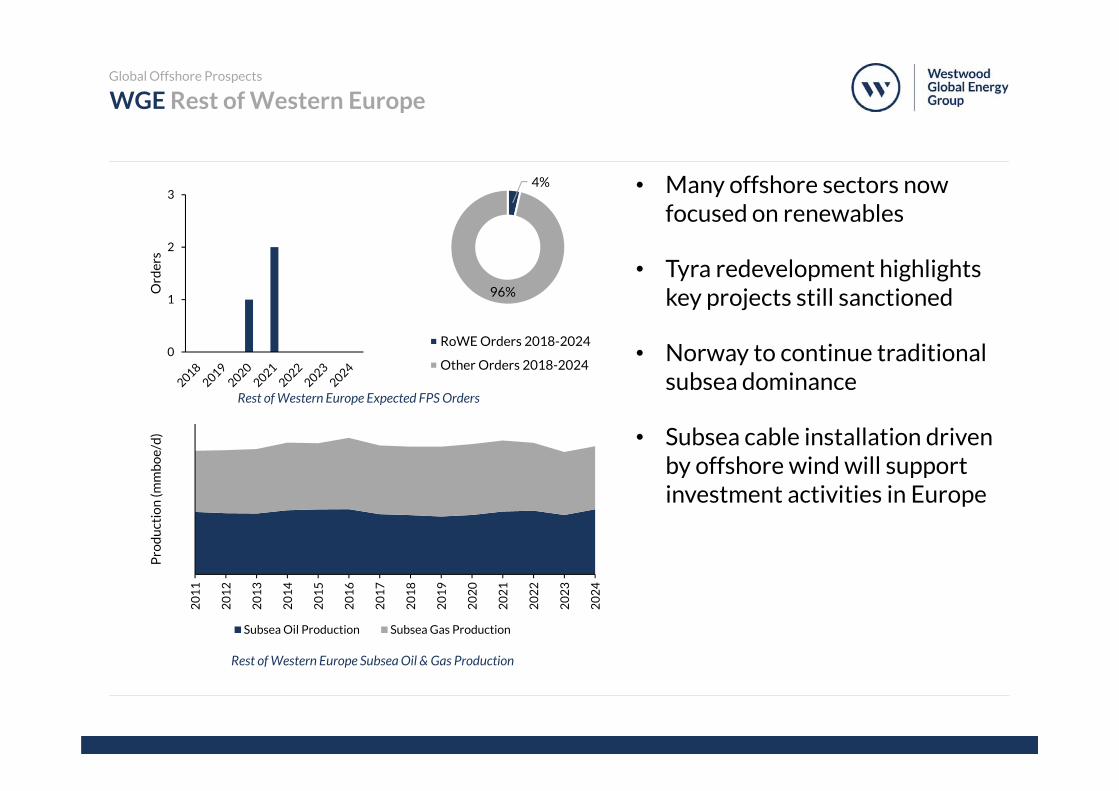
WGE Rest of Western EuropeGlobal Offshore Prospects
Rest of Western Europe Subsea Oil & Gas Production
• Many offshore sectors now focused on renewables
• Tyra redevelopment highlights key projects still sanctioned
• Norway to continue traditional subsea dominance
• Subsea cable installation driven by offshore wind will support investment activities in Europe
0
1
2
3
Ord
ers
4%
96%
RoWE Orders 2018-2024
Other Orders 2018-2024
20
11
20
12
20
13
20
14
20
15
20
16
20
17
20
18
20
19
20
20
20
21
20
22
20
23
20
24
Pro
du
ctio
n (m
mb
oe/
d)
Subsea Oil Production Subsea Gas Production
Rest of Western Europe Expected FPS Orders
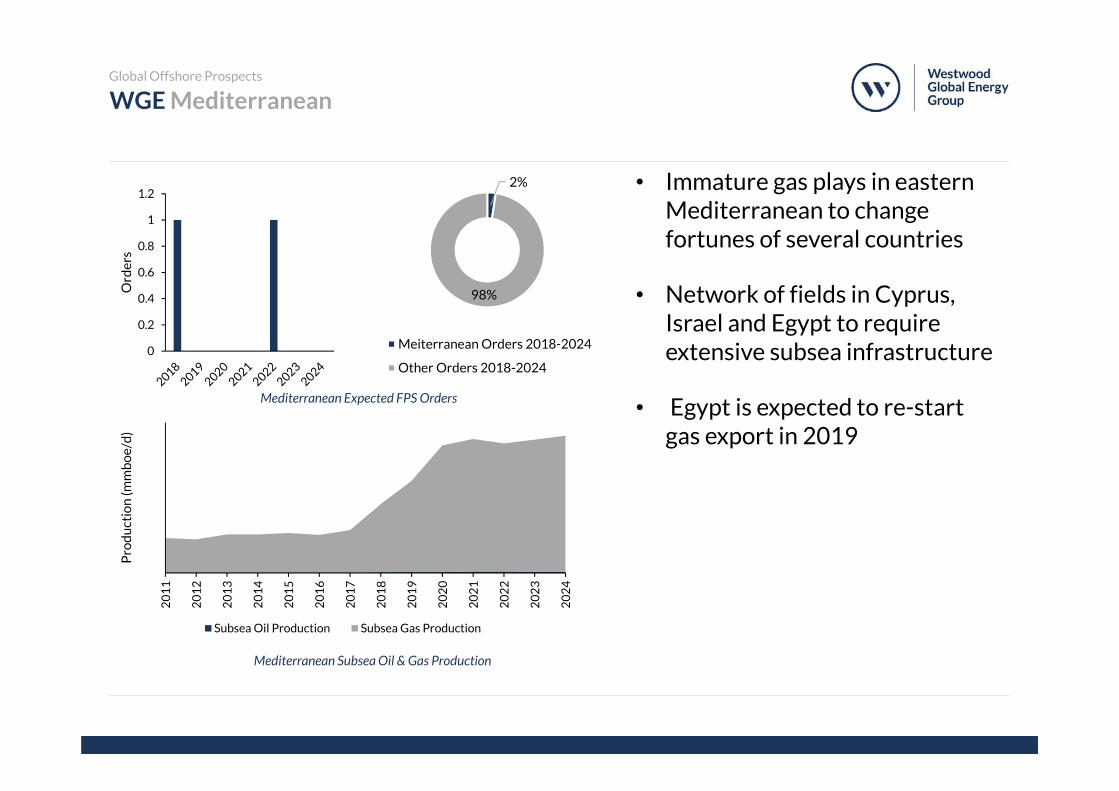
WGE MediterraneanGlobal Offshore Prospects
Mediterranean Subsea Oil & Gas Production
• Immature gas plays in eastern Mediterranean to change fortunes of several countries
• Network of fields in Cyprus, Israel and Egypt to require extensive subsea infrastructure
• Egypt is expected to re-start gas export in 2019
20
11
20
12
20
13
20
14
20
15
20
16
20
17
20
18
20
19
20
20
20
21
20
22
20
23
20
24
Pro
du
ctio
n (m
mb
oe/
d)
Subsea Oil Production Subsea Gas Production
0
0.2
0.4
0.6
0.8
1
1.2
Ord
ers
2%
98%
Meiterranean Orders 2018-2024
Other Orders 2018-2024
Mediterranean Expected FPS Orders
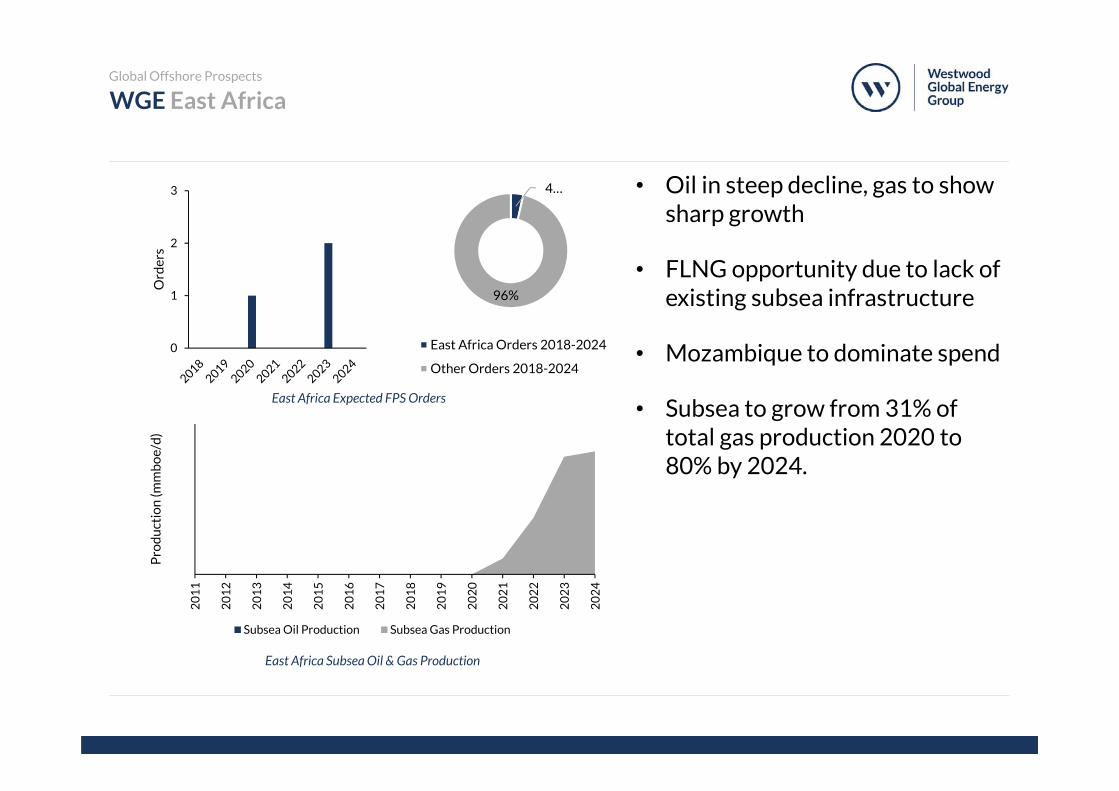
WGE East AfricaGlobal Offshore Prospects
East Africa Subsea Oil & Gas Production
• Oil in steep decline, gas to show sharp growth
• FLNG opportunity due to lack of existing subsea infrastructure
• Mozambique to dominate spend
• Subsea to grow from 31% of total gas production 2020 to 80% by 2024.
20
11
20
12
20
13
20
14
20
15
20
16
20
17
20
18
20
19
20
20
20
21
20
22
20
23
20
24
Pro
du
ctio
n (m
mb
oe/
d)
Subsea Oil Production Subsea Gas Production
0
1
2
3
Ord
ers
4…
96%
East Africa Orders 2018-2024
Other Orders 2018-2024
East Africa Expected FPS Orders
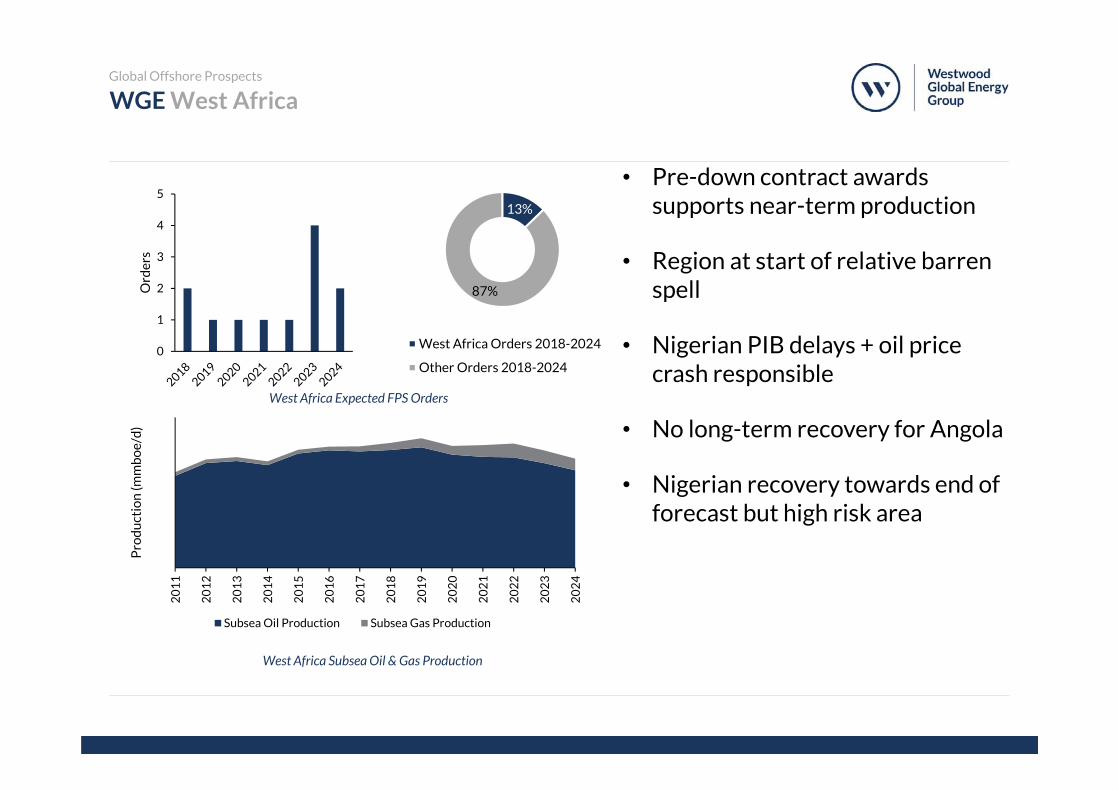
WGE West AfricaGlobal Offshore Prospects
West Africa Subsea Oil & Gas Production
• Pre-down contract awards supports near-term production
• Region at start of relative barren spell
• Nigerian PIB delays + oil price crash responsible
• No long-term recovery for Angola
• Nigerian recovery towards end of forecast but high risk area
20
11
20
12
20
13
20
14
20
15
20
16
20
17
20
18
20
19
20
20
20
21
20
22
20
23
20
24
Pro
du
ctio
n (m
mb
oe/
d)
Subsea Oil Production Subsea Gas Production
0
1
2
3
4
5
Ord
ers
13%
87%
West Africa Orders 2018-2024
Other Orders 2018-2024
West Africa Expected FPS Orders
05 Conclusions
Presentation Title 45
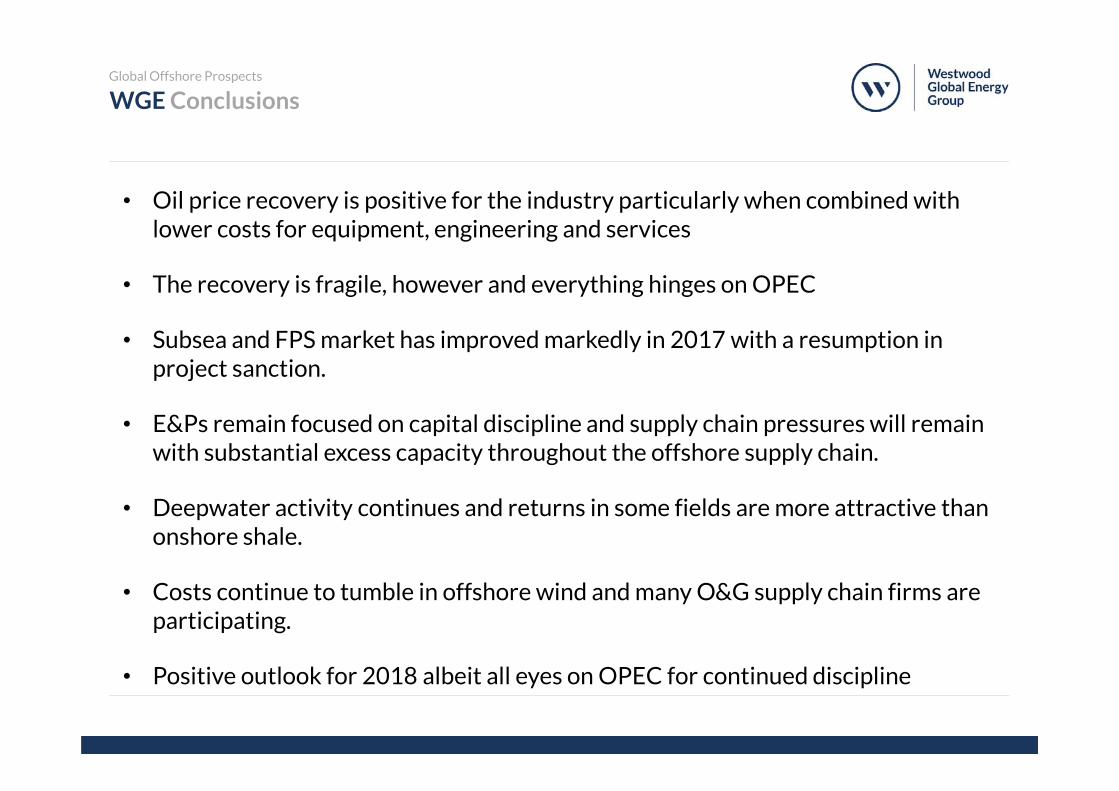
WGE ConclusionsGlobal Offshore Prospects
• Oil price recovery is positive for the industry particularly when combined with lower costs for equipment, engineering and services
• The recovery is fragile, however and everything hinges on OPEC
• Subsea and FPS market has improved markedly in 2017 with a resumption in project sanction.
• E&Ps remain focused on capital discipline and supply chain pressures will remain with substantial excess capacity throughout the offshore supply chain.
• Deepwater activity continues and returns in some fields are more attractive than onshore shale.
• Costs continue to tumble in offshore wind and many O&G supply chain firms are participating.
• Positive outlook for 2018 albeit all eyes on OPEC for continued discipline

06 Questions?
Presentation Title 47