Embed Size (px)
DESCRIPTION
Global Ocean Monitoring: Recent Evolution, Current Status, and Predictions. Prepared by Climate Prediction Center , NCEP/NOAA December 7, 2011. http://www.cpc.ncep.noaa.gov/products/GODAS/ This project to deliver real-time ocean monitoring products is implemented - PowerPoint PPT Presentation
Citation preview

1
Global Ocean Monitoring: Recent Evolution, Current Status, and Predictions
Prepared byClimate Prediction Center, NCEP/NOAA
December 7, 2011
http://www.cpc.ncep.noaa.gov/products/GODAS/This project to deliver real-time ocean monitoring products is implemented
by CPC in cooperation with NOAA's Climate Observation Division (COD)
2
Outline
• Overview
• Recent highlights
– Pacific/Arctic Ocean
– Indian Ocean
– Atlantic Ocean
• CFS SST Predictions

3
Overview• Pacific Ocean
– La Nina conditions persisted with NINO3.4=-0.97oC in Nov 2011.
– NOAA “ENSO Diagnostic Discussion” suggests weak-to-moderate strength La Niña is expected to continue through the Northern Hemisphere winter 2011-12.
– Negative PDO enhanced, with PDOI=-2.4 in Nov 2011.
– Both CFSv1 and CFSv2 predicted negative PDO to last through the Northern Hemisphere winter and continue into spring/summer 2012.
• Indian Ocean– Easterly wind anomalies have persisted in the east-central tropical
Indian Ocean since May 2011, and weak positive IOD conditions emerged with DMI=0.56oC in Aug-Oct 2011.
• Atlantic Ocean– Positive SSTA and below-normal vertical wind shear in the Atlantic
Hurricane Main Development Region in JJASON 2011 are much weaker than those in JJASON 2010.
– In JJASON 2011, similar to JJASON 2010, North Atlantic Subtropical High retreated eastward, which helps steer tropical cyclones northward and away from the land.

4
Global Ocean
5
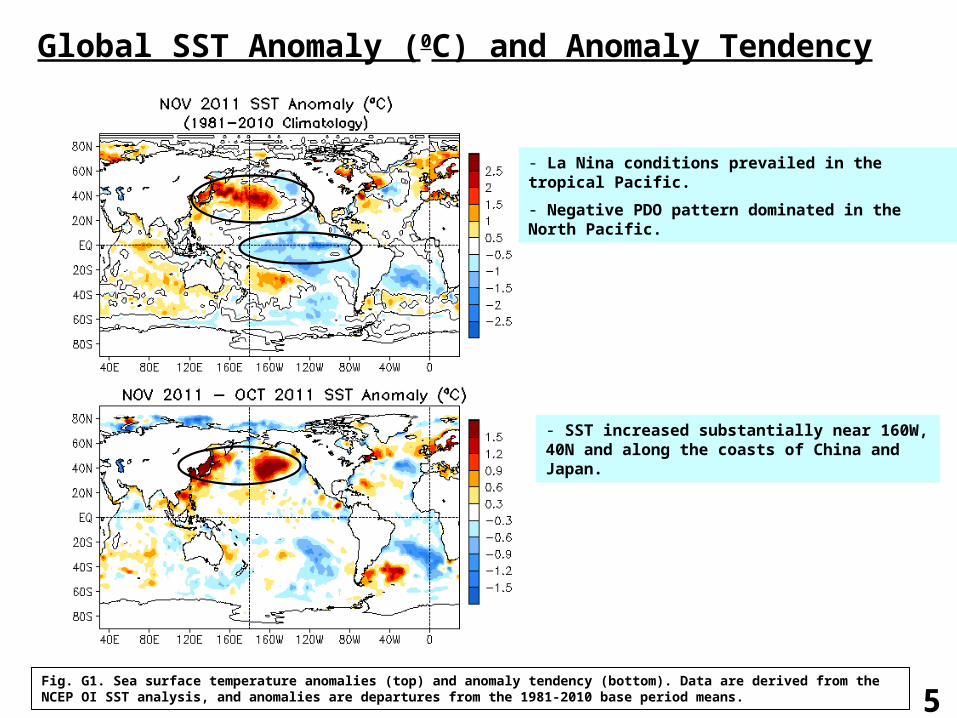
Global SST Anomaly (0C) and Anomaly Tendency
Fig. G1. Sea surface temperature anomalies (top) and anomaly tendency (bottom). Data are derived from the NCEP OI SST analysis, and anomalies are departures from the 1981-2010 base period means.
- La Nina conditions prevailed in the tropical Pacific.
- Negative PDO pattern dominated in the North Pacific.
- SST increased substantially near 160W, 40N and along the coasts of China and Japan.
6
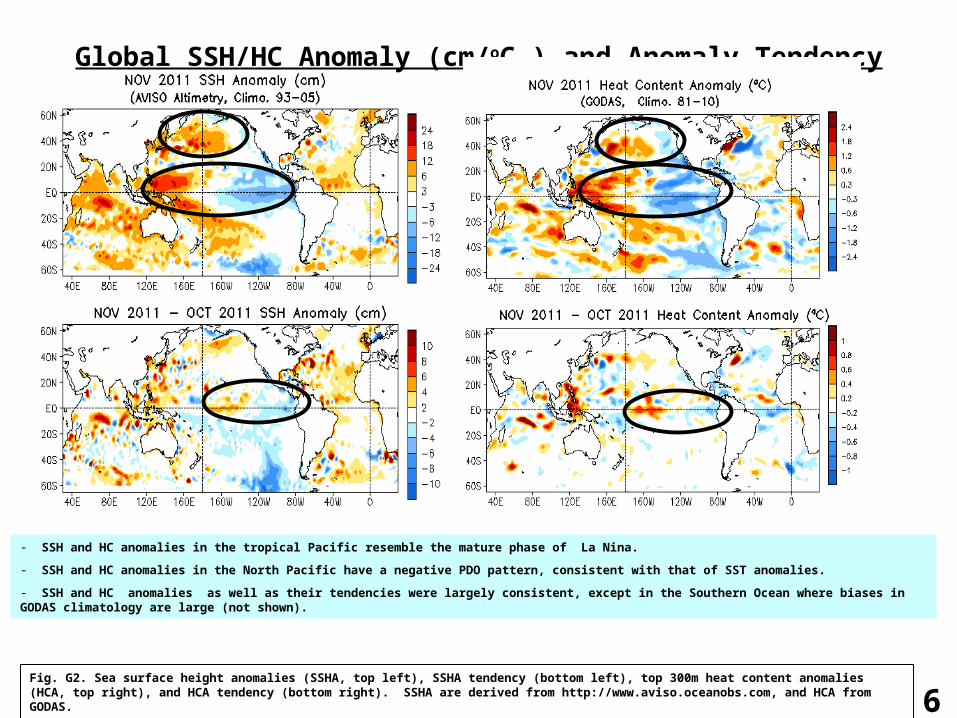
Global SSH/HC Anomaly (cm/oC ) and Anomaly Tendency
Fig. G2. Sea surface height anomalies (SSHA, top left), SSHA tendency (bottom left), top 300m heat content anomalies (HCA, top right), and HCA tendency (bottom right). SSHA are derived from http://www.aviso.oceanobs.com, and HCA from GODAS.
- SSH and HC anomalies in the tropical Pacific resemble the mature phase of La Nina.
- SSH and HC anomalies in the North Pacific have a negative PDO pattern, consistent with that of SST anomalies.
- SSH and HC anomalies as well as their tendencies were largely consistent, except in the Southern Ocean where biases in GODAS climatology are large (not shown).

7
Longitude-Depth Temperature Anomaly and Anomaly Tendency in 2OS-2ON
Fig. G3. Equatorial depth-longitude section of ocean temperature anomalies (top) and anomaly tendency (bottom). Data are derived from the NCEP's global ocean data assimilation system which assimilates oceanic observations into an oceanic GCM. Anomalies are departures from the 1981-2010 base period means.
- Dipole temperature anomalies, warm
(cold) in the west (east), are consistent
with La Nina conditions.
- Dipole temperature anomalies near
depth 100m in the equatorial Indian
Ocean are associated with positive IOD
conditions.
- Dipole temperature anomalies were
observed in the equatorial Atlantic
Ocean.
- Temperature increased (decreased )
in the western and central (eastern)
tropical Pacific in Nov 2011.
- Temperature decreased near depth
100m in the eastern equatorial Indian
Ocean.
- Temperature decreased near the
thermocline in the equatorial Atlantic
Ocean.

8
Global Tropical Ocean

9
Evolution of SST and 850mb Wind Anom.
- Persistent SST anom. (SSTA): Negative SSTA in trop. Pacific, positive SSTA in trop. N. Atlantic, positive (negative)
SSTA in W. and C. trop. Indian Ocean (north of Australia).
- Persistent surface wind anom.: easterly in W. and C. trop. Pacific and trop. Indian Ocean, westerly in N.E. trop.
Pacific and tropical Atlantic.

10
Evolution of OLR and 850mb Wind Anom.
- Persistent OLR anom.: Suppressed (enhanced) convection in C. trop. Pacific and S.E. Indian Ocean (W. trop. Indian
Ocean and N.W. trop. Pacific). Convection modulated by MJO activities in Oct-Nov 2011
(http://www.cpc.ncep.noaa.gov/products/precip/CWlink/MJO/mjo.shtml).
- Surface wind anomalies converged to (diverged from ) the center of enhanced (suppressed) convection.

11
ENSO Conditions

12
Evolution of Pacific NINO SST Indices
- All NINO indices were negative and persisted.
- Nino3.4 = -0.97oC in Nov 2011.
- The indices were calculated based on OISST. They may
have some differences compared with those based on
ERSST.v3b.
Fig. P1a. Nino region indices, calculated as the area-averaged monthly mean sea surface temperature anomalies (oC) for the specified region. Data are derived from the NCEP OI SST analysis, and anomalies are departures from the 1981-2010 base period means.
13
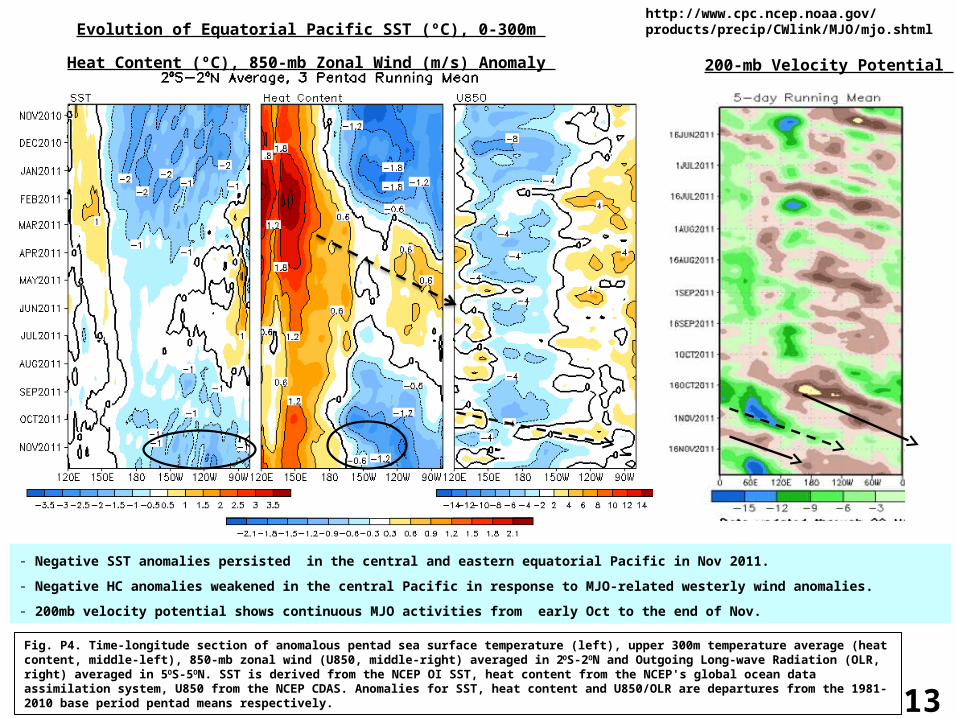
Evolution of Equatorial Pacific SST (ºC), 0-300m
Heat Content (ºC), 850-mb Zonal Wind (m/s) Anomaly
- Negative SST anomalies persisted in the central and eastern equatorial Pacific in Nov 2011.
- Negative HC anomalies weakened in the central Pacific in response to MJO-related westerly wind anomalies.
- 200mb velocity potential shows continuous MJO activities from early Oct to the end of Nov.
Fig. P4. Time-longitude section of anomalous pentad sea surface temperature (left), upper 300m temperature average (heat content, middle-left), 850-mb zonal wind (U850, middle-right) averaged in 2OS-2ON and Outgoing Long-wave Radiation (OLR, right) averaged in 5OS-5ON. SST is derived from the NCEP OI SST, heat content from the NCEP's global ocean data assimilation system, U850 from the NCEP CDAS. Anomalies for SST, heat content and U850/OLR are departures from the 1981-2010 base period pentad means respectively.
http://www.cpc.ncep.noaa.gov/products/precip/CWlink/MJO/mjo.shtml
200-mb Velocity Potential
14
Warm Water Volume (WWV) and NINO3.4 Anomalies
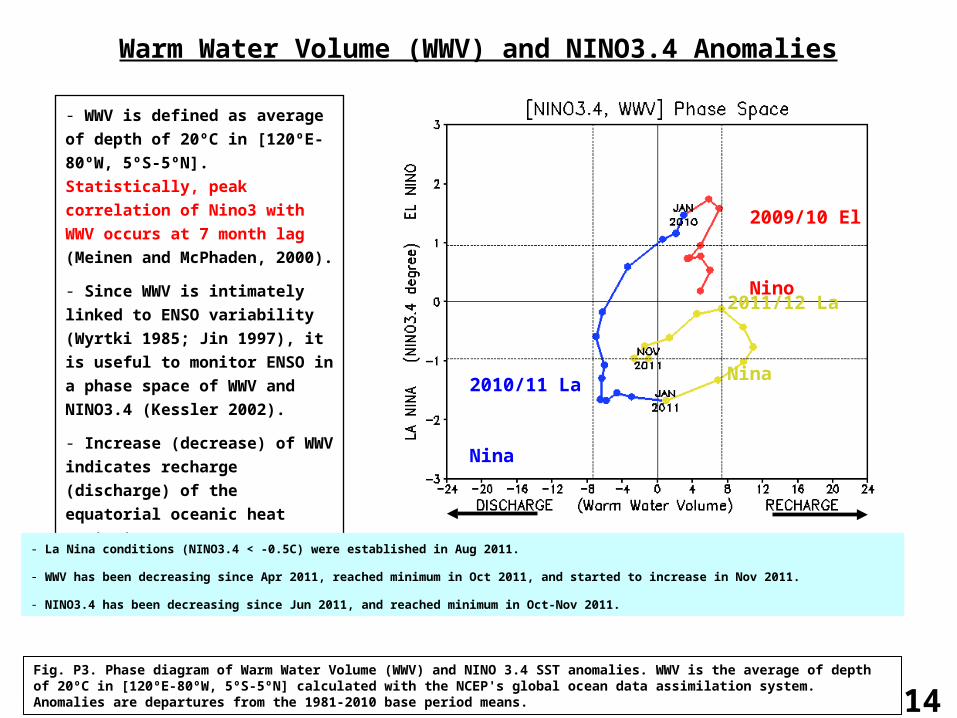
Fig. P3. Phase diagram of Warm Water Volume (WWV) and NINO 3.4 SST anomalies. WWV is the average of depth of 20ºC in [120ºE-80ºW, 5ºS-5ºN] calculated with the NCEP's global ocean data assimilation system. Anomalies are departures from the 1981-2010 base period means.
- WWV is defined as average of depth
of 20ºC in [120ºE-80ºW, 5ºS-5ºN].
Statistically, peak correlation of Nino3
with WWV occurs at 7 month lag
(Meinen and McPhaden, 2000).
- Since WWV is intimately linked to
ENSO variability (Wyrtki 1985; Jin
1997), it is useful to monitor ENSO in a
phase space of WWV and NINO3.4
(Kessler 2002).
- Increase (decrease) of WWV
indicates recharge (discharge) of the
equatorial oceanic heat content.
2009/10 El Nino
2010/11 La Nina
- La Nina conditions (NINO3.4 < -0.5C) were established in Aug 2011.
- WWV has been decreasing since Apr 2011, reached minimum in Oct 2011, and started to increase in Nov 2011.
- NINO3.4 has been decreasing since Jun 2011, and reached minimum in Oct-Nov 2011.
2011/12 La Nina

15
Tropical Pacific: SST Anom., SST Anom. Tend., OLR, Sfc Rad, Sfc Flx, 925-mb & 200-mb Winds
- Negative SSTA
prevailed in the tropical
Pacific.
- Convection was
suppressed near the
Dateline and enhanced
over northern Australia.
- Low- and upper-level
wind anomalies were
modulated by MJO
activities in Nov.
Fig. P2. Sea surface temperature (SST) anomalies (top-left), anomaly tendency (top-right), Outgoing Long-wave Radiation (OLR) anomalies (middle-left), sum of net surface short- and long-wave radiation, latent and sensible heat flux anomalies (middle-right), 925-mb wind anomaly vector and its amplitude (bottom-left), 200-mb wind anomaly vector and its amplitude (bottom-right). SST are derived from the NCEP OI SST analysis, OLR from the NOAA 18 AVHRR IR window channel measurements by NESDIS, winds and surface radiation and heat fluxes from the NCEP CDAS. Anomalies are departures from the 1981-2010 base period means.

16
NINO3.4 Heat Budget- SSTA tendency (dT/dt) in NINO 3.4 (dotted line) increased rapidly, and switched from negative to positive in Nov, indicating weakening of La Nina conditions.
- Qu and Qw+Qzz, zonal advection and vertical entrainment/diffusion, were the dominant cooling terms with the former leading the latter by two months.
- Both Qu and Qw+Qzz reached minimum in late Oct and started to increase rapidly and reached near zero by the end of Nov.
- The total heat budget term (RHS) has large cold biases compared with the tendency (dT/dt) since early Sep 2011.
Huang, B., Y. Xue, X. Zhang, A. Kumar, and M. J. McPhaden, 2010 : The NCEP GODAS ocean analysis of the tropical Pacific mixed layer heat budget on seasonal to interannual time scales, J. Climate., 23, 4901-4925.
Qu: Zonal advection; Qv: Meridional advection;
Qw: Vertical entrainment; Qzz: Vertical diffusion
Qq: (Qnet - Qpen + Qcorr)/ρcph; Qnet = SW + LW + LH +SH;
Qpen: SW penetration; Qcorr: Flux correction due to relaxation to OI SST

17
North Pacific & Arctic Ocean

18
North Pacific & Arctic Ocean: SST Anom., SST Anom. Tend., OLR, SLP, Sfc Rad, Sfc Flx
- Positive (negative) SSTA
presented in the western
and central (eastern) North
Pacific, consistent with the
negative PDO index (next
slide).
- Net surface heat flux
anomalies contributed to
the SST tendency in the
North Pacific.
- Above-normal sea level
pressure and associated
northerly wind anomalies
along the coast were
favourable for upwelling.
Fig. NP1. Sea surface temperature (SST) anomalies (top-left), anomaly tendency (top-right), Outgoing Long-wave Radiation (OLR) anomalies (middle-left), sea surface pressure anomalies (middle-right), sum of net surface short- and long-wave radiation anomalies (bottom-left), sum of latent and sensible heat flux anomalies (bottom-right). SST are derived from the NCEP OI SST analysis, OLR from the NOAA 18 AVHRR IR window channel measurements by NESDIS, sea surface pressure and surface radiation and heat fluxes from the NCEP CDAS. Anomalies are departures from the 1981-2010 base period means.
19
PDO index
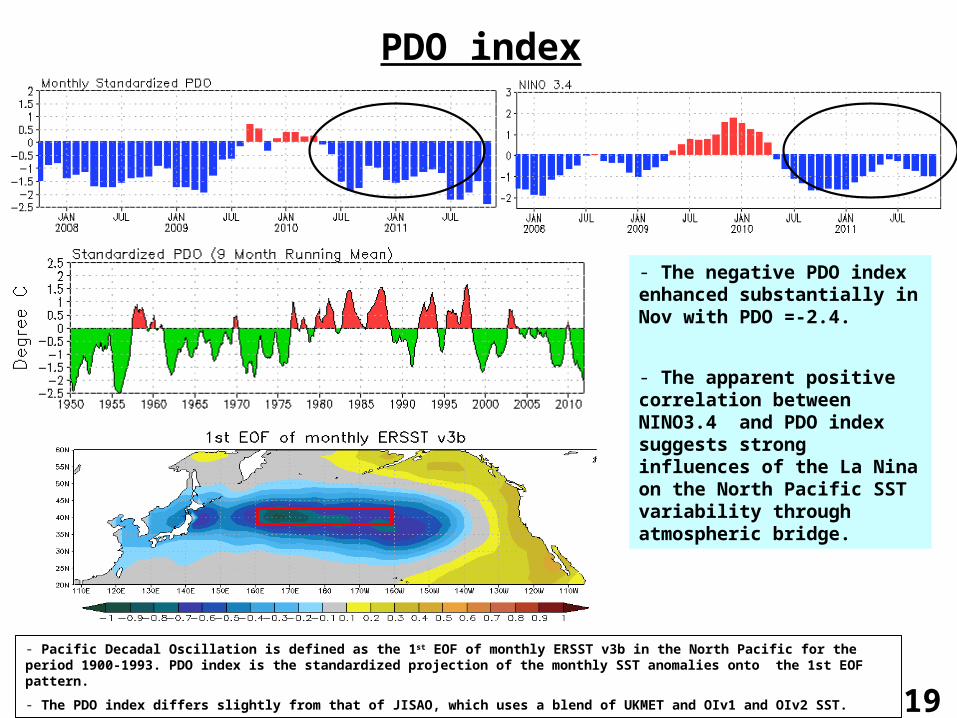
- Pacific Decadal Oscillation is defined as the 1st EOF of monthly ERSST v3b in the North Pacific for the period 1900-1993. PDO index is the standardized projection of the monthly SST anomalies onto the 1st EOF pattern.
- The PDO index differs slightly from that of JISAO, which uses a blend of UKMET and OIv1 and OIv2 SST.
- The negative PDO index enhanced substantially in Nov with PDO =-2.4.
- The apparent positive correlation between NINO3.4 and PDO index suggests strong influences of the La Nina on the North Pacific SST variability through atmospheric bridge.

20
- PDO has strong signature of subsurface temperature anomalies that can penetrate to below 300m.
- Deep ocean warming in the central N. Pacific (160E-160W, 38N-42N) was particularly strong during the negative phases
of PDO in 2009, 2010 and 2011.
- Positive temperature anomalies more than 0.9C penetrated to 200m depth, indicating strong vertical mixing in Nov 2011.
Subsurface Temperature Anom. in Central North Pacific
21
Seasonal Re-emergence of Temperature Anomaly
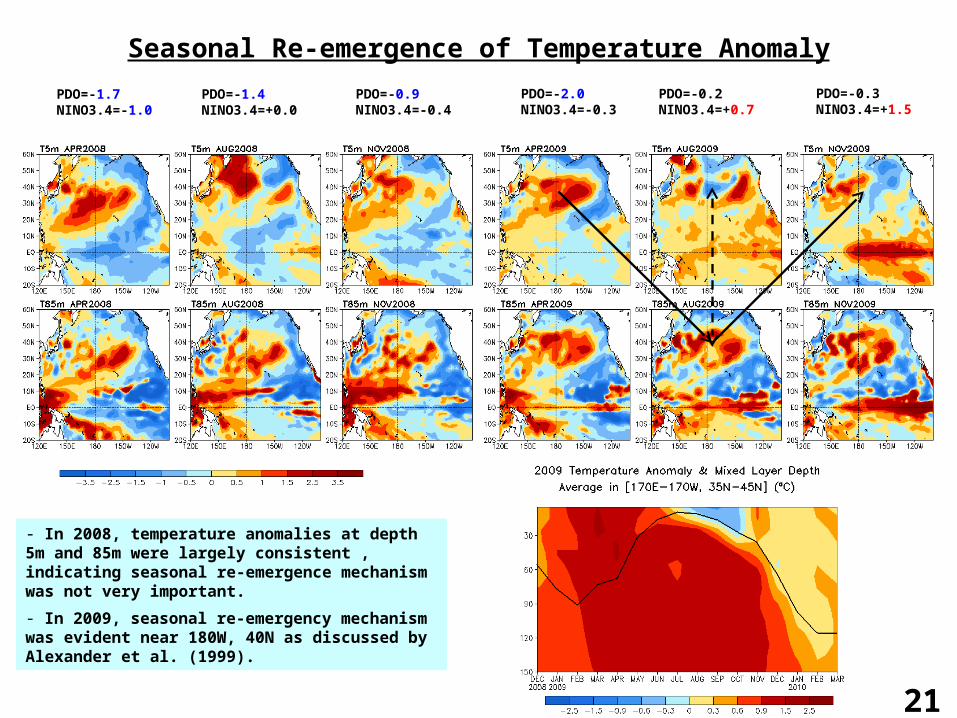
PDO=-1.7NINO3.4=-1.0
PDO=-1.4NINO3.4=+0.0
PDO=-0.9NINO3.4=-0.4
PDO=-2.0NINO3.4=-0.3
PDO=-0.2NINO3.4=+0.7
PDO=-0.3NINO3.4=+1.5
- In 2008, temperature anomalies at depth 5m and 85m were largely consistent , indicating seasonal re-emergence mechanism was not very important.
- In 2009, seasonal re-emergency mechanism was evident near 180W, 40N as discussed by Alexander et al. (1999).

22
Seasonal Re-emergence of Temperature AnomalyPDO=+0.2NINO3.4=+0.6
PDO=-1.9NINO3.4=-1.3
PDO=-1.0NINO3.4=-1.6
PDO=-1.2NINO3.4=-0.8
PDO=-2.2NINO3.4=-0.6
PDO=-2.4NINO3.4=-1.0
- In 2010, seasonal re-emergency mechanism was evident near 150W, 40N as that discussed by Alexander et al. (1999).
- In 2011, temperature anomalies at depth 5m and 85m were largely consistent , indicating seasonal re-emergence mechanism was not very important.
- La Nino conditions (NINO3.4 < -0.5) were largely in phase with negative PDOs.
23
North America Western Coastal Upwelling
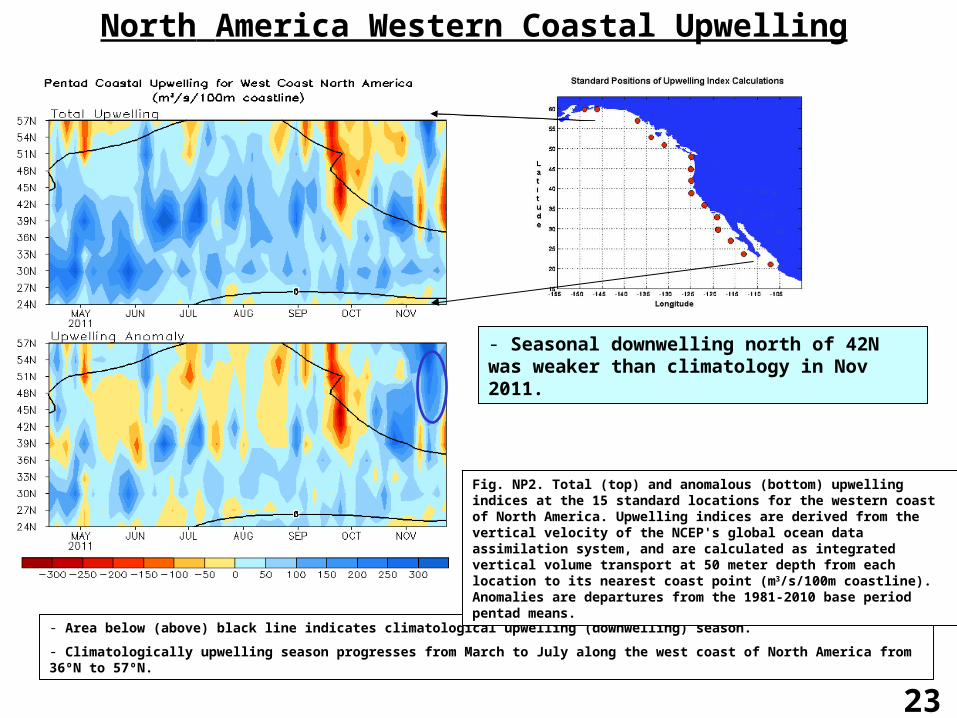
- Area below (above) black line indicates climatological upwelling (downwelling) season.
- Climatologically upwelling season progresses from March to July along the west coast of North America from 36ºN to 57ºN.
Fig. NP2. Total (top) and anomalous (bottom) upwelling indices at the 15 standard locations for the western coast of North America. Upwelling indices are derived from the vertical velocity of the NCEP's global ocean data assimilation system, and are calculated as integrated vertical volume transport at 50 meter depth from each location to its nearest coast point (m3/s/100m coastline). Anomalies are departures from the 1981-2010 base period pentad means.
- Seasonal downwelling north of 42N was weaker than climatology in Nov 2011.

24
Tropical Indian Ocean
25
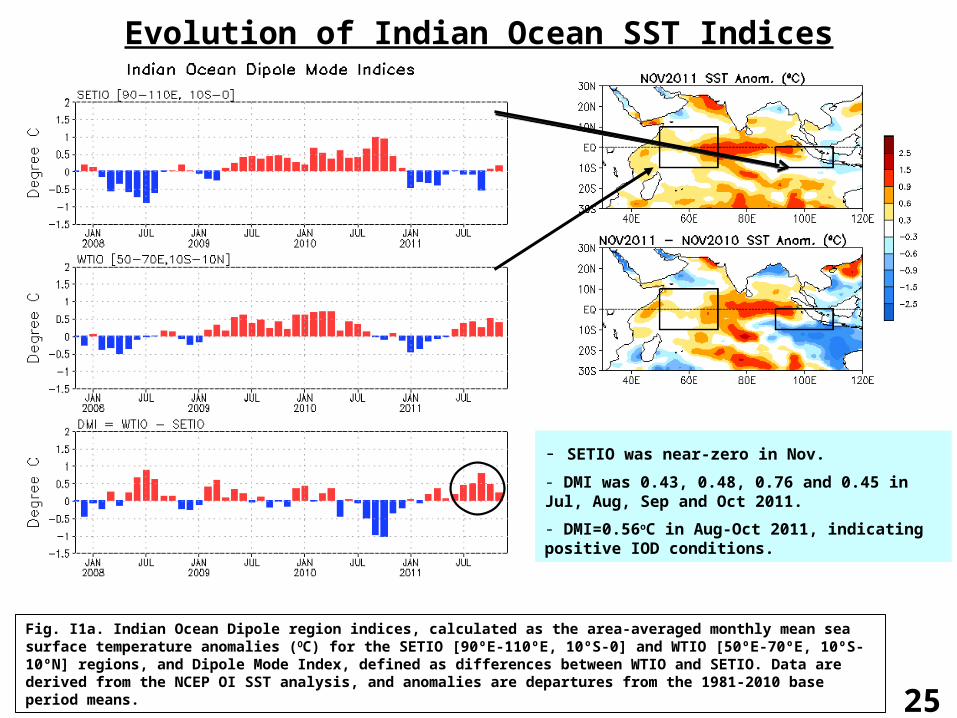
Evolution of Indian Ocean SST Indices
Fig. I1a. Indian Ocean Dipole region indices, calculated as the area-averaged monthly mean sea surface temperature anomalies (OC) for the SETIO [90ºE-110ºE, 10ºS-0] and WTIO [50ºE-70ºE, 10ºS-10ºN] regions, and Dipole Mode Index, defined as differences between WTIO and SETIO. Data are derived from the NCEP OI SST analysis, and anomalies are departures from the 1981-2010 base period means.
- SETIO was near-zero in Nov.
- DMI was 0.43, 0.48, 0.76 and 0.45 in Jul, Aug, Sep and Oct 2011.
- DMI=0.56oC in Aug-Oct 2011, indicating positive IOD conditions.

26
Recent Evolution of Equatorial Indian SST (ºC), 0-300m Heat Content (ºC), and 850-mb Zonal Wind (m/s) Anomalies
- Positive SSTA has persisted in the western tropical Indian Ocean from May 2011 to Nov 2011.
- Positive SSTA enhanced in the central-eastern tropical Indian Ocean in Nov 2011.
- Easterly wind anomalies have persisted in the central-east tropical Indian Ocean since May 2011.
Fig. I3. Time-longitude section of anomalous pentad sea surface temperature (left), upper 300m temperature average (heat content, middle-left), 850-mb zonal wind (U850, middle-right) averaged in 2OS-2ON and Outgoing Long-wave Radiation (OLR, right) averaged in 5OS-5ON. SST are derived from the NCEP OI SST, heat content from the NCEP's global ocean data assimilation system, and U850 from the NCEP CDAS. Anomalies are departures from the 1981-2010 base period pentad means.

27
- Positive SSTA was observed in the central and eastern equatorial Indian Ocean.
- Convection was enhanced (suppressed) over the western and central tropical Indian Ocean (Bay of Bengal).
- Low level easterly wind anomalies were located over positive SSTA.
Tropical Indian: SST Anom., SST Anom.
Tend., OLR, Sfc Rad, Sfc Flx, 925-mb &
200-mb Wind Anom.
Fig. I2. Sea surface temperature (SST) anomalies (top-left), anomaly tendency (top-right), Outgoing Long-wave Radiation (OLR) anomalies (middle-left), sum of net surface short- and long-wave radiation, latent and sensible heat flux anomalies (middle-right), 925-mb wind anomaly vector and its amplitude (bottom-left), 200-mb wind anomaly vector and its amplitude (bottom-right). SST are derived from the NCEP OI SST analysis, OLR from the NOAA 18 AVHRR IR window channel measurements by NESDIS, winds and surface radiation and heat fluxes from the NCEP CDAS. Anomalies are departures from the 1981-2010 base period means.
28
Tropical Atlantic Ocean

29
Evolution of Tropical Atlantic SST Indices
Fig. A1a. Tropical Atlantic Variability region indices, calculated as the area-averaged monthly mean sea surface temperature anomalies (ºC) for the TNA [60ºW-30ºW, 5ºN-20ºN], TSA [30ºW-10ºE, 20ºS-0] and ATL3 [20ºW-0, 2.5ºS-2.5ºN] regions, and Meridional Gradient Index, defined as differences between TNA and TSA. Data are derived from the NCEP OI SST analysis, and anomalies are departures from the 1981-2010 base period means.
- Tropical North Atlantic (TNA) was weakly positive.
- Tropical South Atlantic (TSA) was weakly negative.
- Meridional Gradient Mode (TNA-TSA) has been
positive during the hurricane season.
- ATL3 SSTA was near normal in Nov 2011.

30
- Positive SSTA persisted in Caribbean Sea, but dissipated in the eastern tropical North
Atlantic and equatorial Atlantic.
- Below-normal vertical wind shear persisted in the tropical North Atlantic.
Tropical Atlantic:

31
North Atlantic Hurricane Season
32
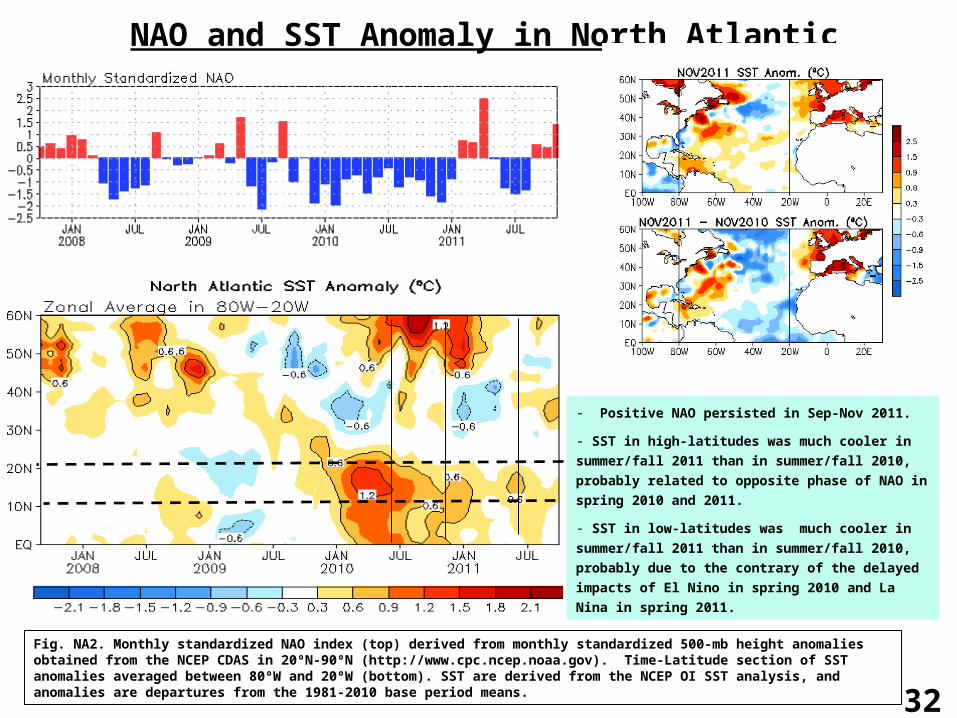
NAO and SST Anomaly in North Atlantic
Fig. NA2. Monthly standardized NAO index (top) derived from monthly standardized 500-mb height anomalies obtained from the NCEP CDAS in 20ºN-90ºN (http://www.cpc.ncep.noaa.gov). Time-Latitude section of SST anomalies averaged between 80ºW and 20ºW (bottom). SST are derived from the NCEP OI SST analysis, and anomalies are departures from the 1981-2010 base period means.
- Positive NAO persisted in Sep-Nov 2011.
- SST in high-latitudes was much cooler in
summer/fall 2011 than in summer/fall 2010,
probably related to opposite phase of NAO in
spring 2010 and 2011.
- SST in low-latitudes was much cooler in
summer/fall 2011 than in summer/fall 2010,
probably due to the contrary of the delayed
impacts of El Nino in spring 2010 and La Nina
in spring 2011.
33
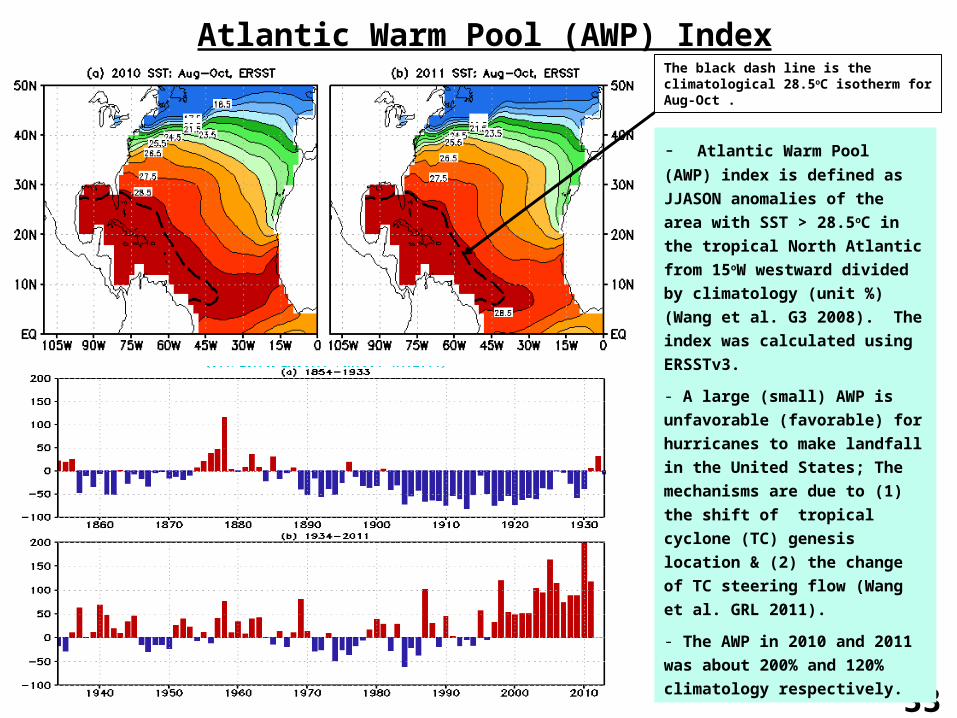
Atlantic Warm Pool (AWP) Index
- Atlantic Warm Pool (AWP)
index is defined as JJASON
anomalies of the area with
SST > 28.5oC in the tropical
North Atlantic from 15oW
westward divided by
climatology (unit %) (Wang
et al. G3 2008). The index
was calculated using
ERSSTv3.
- A large (small) AWP is
unfavorable (favorable) for
hurricanes to make landfall
in the United States; The
mechanisms are due to (1)
the shift of tropical cyclone
(TC) genesis location & (2)
the change of TC steering
flow (Wang et al. GRL 2011).
- The AWP in 2010 and 2011
was about 200% and 120%
climatology respectively.
The black dash line is the climatological 28.5oC isotherm for Aug-Oct .

34
- In the Hurricane Main Development Region (80W-20W, 10N-20N), low-level easterly (upper
panel) and vertical wind shear (lower panel) were below-normal in JJASON 2011, which is
favorable for hurricane development.
- However, anomalies in JJASON 2011 were much weaker than those in JJASON 2010.
North Atlantic U850 and U200-U850

35
North Atlantic Subtropical High (NASH)
Models & data show that a large AWP is associated with a smaller, weakened North Atlantic subtropical high (NASH) that retreats eastward toward Europe and that SLP weakens off the east coast of the US creating a weakness where tropical cyclones (TCs) can be steered northward and away from land (Wang et al. 2011). The situation in 2010 (left) is an illustrative case in point.
In 2011, like in 2010, the high pressure of the NASH has retreated eastward leaving an area of weakness off the east coast where TCs can recurve, as we have observed. The next slide shows how the storm tracks in 2011 have generally avoided making landfall in the US. Even Irene, which narrowly made landfall, was diverted northward by the pressure distribution (personal communication, David Enfield).

36
- By Dec. 1, 2011, 19 tropical
storms, 7 hurricanes and 3 major
hurricanes (category 3, 4)
formed in the North Atlantic
Ocean.
- The NOAA’s Atlantic Hurricane
Outlook verified very well.
Normal May 19 Aug. 4 Obs.by Dec. 1
Named storms 11 12-18 14-19 19
Hurricanes 6 6-10 7-10 7
Major hurricanes 2 3-6 3-5 3
ACE (% median) 100 105-200 135-215 119
NOAA Predicts an Active Atlantic Hurricane Season in 2011
http://en.wikipedia.org/wiki/2011_Atlantic_hurricane_season

37
SST Predictions

38
- The majority of models predicted that weak to moderate La Nina conditions peak in the winter 2011/12, dissipate in spring and return to normal-conditions by late spring and summer.
IRI NINO3.4 Forecast Plum

39
- Both CFSv1 and CFSv2 predicted that strong La Nina conditions (NINO3.4 less than -1.5oC) would peak in Mar 2012 and Feb 2012 respectively.
- CFSv2 predicted the La Nina would dissipate and return to normal-conditions by summer 2012, while CFSv1 predicted the La Nina to last through summer 2012.
- PDF corrected CFSv1 forecast favors moderate La Nina conditions to peak in Jan 2012.
- NOAA “ENSO Diagnostic Discussion” suggests weak-to-moderate strength La Niña is expected to continue through the Northern Hemisphere winter 2011-12.
NCEP CFSv1 and CFSv2 NINO3.4 Forecast
40
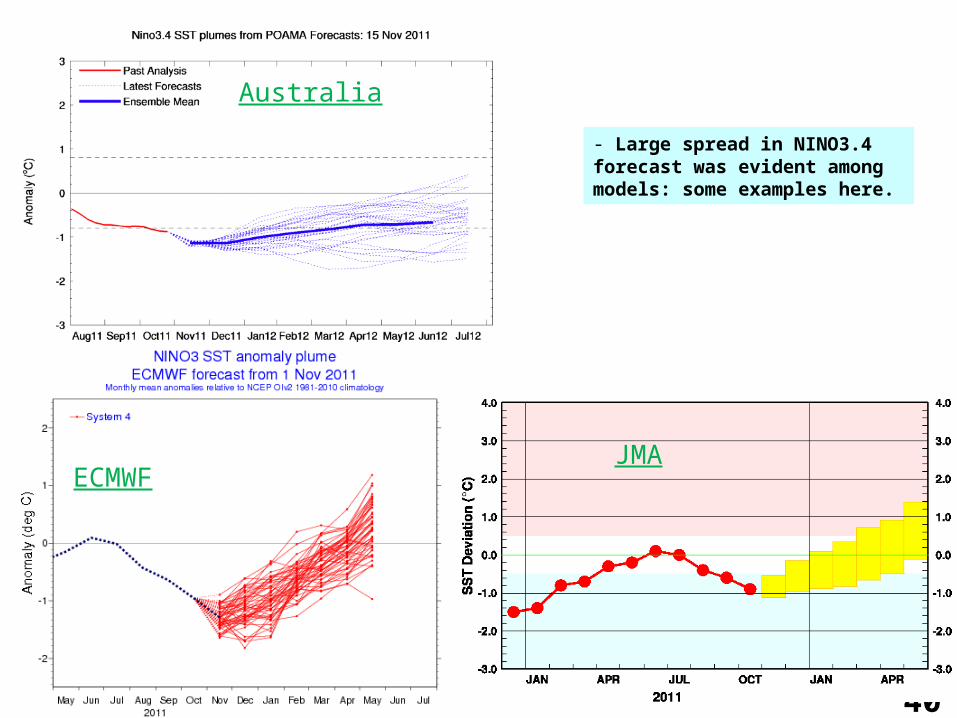
- Large spread in NINO3.4 forecast was evident among models: some examples here.
Australia
ECMWFJMA

41
- Both CFSv1 and CFSv2 predicted that negative PDO would last through the Northern Hemisphere winter 2011/12, and continue into spring and summer 2012.
- CFSv2 (CFSv1) predicted negative PDO to strengthen (weaken) in spring 2012.
NCEP CFSv1 and CFSv2 PDO Forecast
- Pacific Decadal Oscillation is defined as the 1st EOF of monthly ERSSTv3b in the North Pacific for the period 1900-1993. PDO index is the standardized projection of the monthly SST anomalies onto the 1st EOF pattern.
*Nov

42
http://www.cpc.ncep.noaa.gov/products/people/wd51yf/NMME experimental product
Thanks Qin Zhang, Huug van den Dool, Suru Saha, Malaquias Pena Mendez, Patrick Tripp, Peitao Peng and Emily Becker plus the originators at NASA, NCAR, GFDL, IRI (all coupled models)
National Multi-Model Ensemble (NMME) SST Forecast for JFM 2011(Oct 2011 I.C.)
Ensemble Mean of 7 Models(CFSv1, CFSv2, ECHAMA, ECHAMF, GFDL, NCAR, NASA)
CFSv1 CFSv2
- National Multi-Model Ensemble (NMME) forecast favors La Nina conditions and negative PDO in JFM.
- CFSv2 forecast agrees well with NMME forecast.
- Compared to NMME forecast, CFSv1 forecast SST is too cold and has too broad meridional extent in the tropical Pacific, too cold near the Kuroshio Extension, tropical Indian and tropical Atlantic Ocean.
NMME

43
- CFSv1 suggested positive TNA would weaken rapidly, switch to negative in mid-winter, and continue to cool in spring 2012, becoming below-normal in summer 2012.
- However, CFSv2 forecast positive TNA would weaken slowly, return to near normal in spring 2012, and then increase and become above-normal in summer 2012.
NCEP CFSv1 and CFSv2 Tropical North Atlantic SST Forecast

44
National Multi-Model Ensemble (NMME) SST Forecast for Jun 2012(Oct 2011 I.C.)
CFSv1 CFSv2
Ensemble Mean of 7 Models(CFSv1, CFSv2, ECHAMA, ECHAMF, GFDL, NCAR, NASA)
http://www.cpc.ncep.noaa.gov/products/people/wd51yf/NMME experimental product
Thanks Qin Zhang, Huug van den Dool, Suru Saha, Malaquias Pena Mendez, Patrick Tripp, Peitao Peng and Emily Becker plus the originators at NASA, NCAR, GFDL, IRI (all coupled models)
- National Multi-Model Ensemble (NMME) forecast favors ENSO-neutral conditions and neutral tropical North Atlantic SST in Jun 2012.
- CFSv2 forecast agrees with NMME forecast better than CFSv1 forecast.
- All models predicted negative PDO phase in Jun 2012.
NMME
45
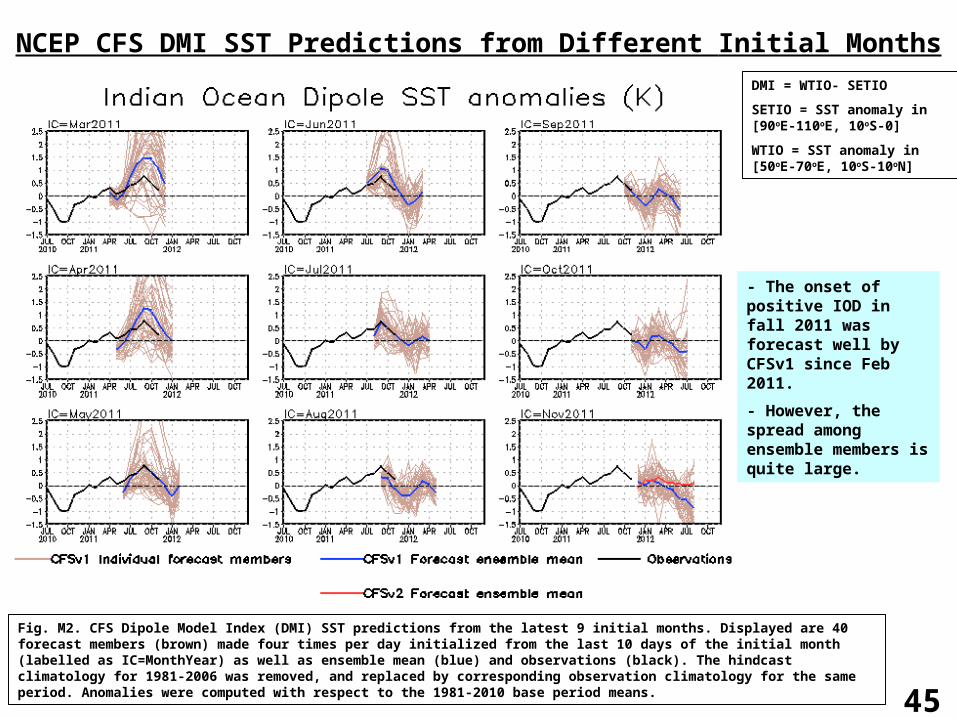
NCEP CFS DMI SST Predictions from Different Initial MonthsDMI = WTIO- SETIO
SETIO = SST anomaly in [90oE-110oE, 10oS-0]
WTIO = SST anomaly in [50oE-70oE, 10oS-10oN]
Fig. M2. CFS Dipole Model Index (DMI) SST predictions from the latest 9 initial months. Displayed are 40 forecast members (brown) made four times per day initialized from the last 10 days of the initial month (labelled as IC=MonthYear) as well as ensemble mean (blue) and observations (black). The hindcast climatology for 1981-2006 was removed, and replaced by corresponding observation climatology for the same period. Anomalies were computed with respect to the 1981-2010 base period means.
- The onset of positive IOD in fall 2011 was forecast well by CFSv1 since Feb 2011.
- However, the spread among ensemble members is quite large.

46
Overview• Pacific Ocean
– La Nina conditions persisted with NINO3.4=-0.97oC in Nov 2011.
– NOAA “ENSO Diagnostic Discussion” suggests weak-to-moderate strength La Niña is expected to continue through the Northern Hemisphere winter 2011-12.
– Negative PDO enhanced, with PDOI=-2.4 in Nov 2011.
– Both CFSv1 and CFSv2 predicted negative PDO to last through the Northern Hemisphere winter and continue into spring/summer 2012.
• Indian Ocean– Easterly wind anomalies have persisted in the east-central tropical
Indian Ocean since May 2011, and weak positive IOD conditions emerged with DMI=0.56oC in Aug-Oct 2011.
• Atlantic Ocean– Positive SSTA and below-normal vertical wind shear in the Atlantic
Hurricane Main Development Region in JJASON 2011 are much weaker than those in JJASON 2010.
– In JJASON 2011, similar to JJASON 2010, North Atlantic Subtropical High retreated eastward, which helps steer tropical cyclones northward and away from the land.

47
Backup Slides

48
Equatorial Pacific Temperature Anomaly
TAO GODAS-TAO

49
Monthly Chlorophyll Anomaly
http://coastwatch.pfel.noaa.gov/FAST
50
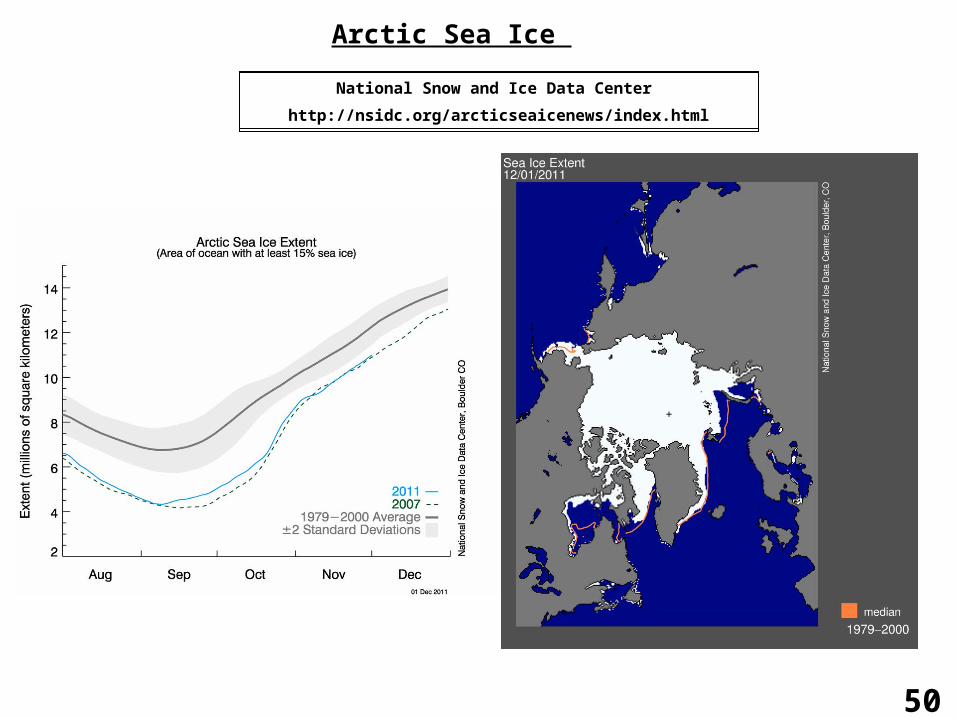
Arctic Sea Ice
National Snow and Ice Data Center
http://nsidc.org/arcticseaicenews/index.html
51
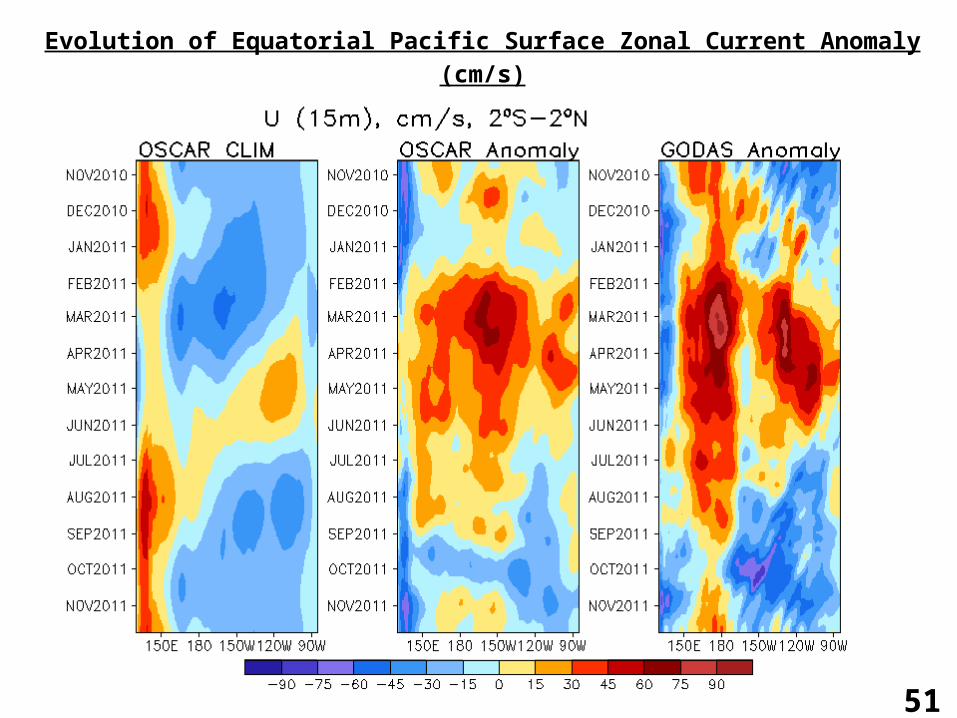
Evolution of Equatorial Pacific Surface Zonal Current Anomaly (cm/s)
52
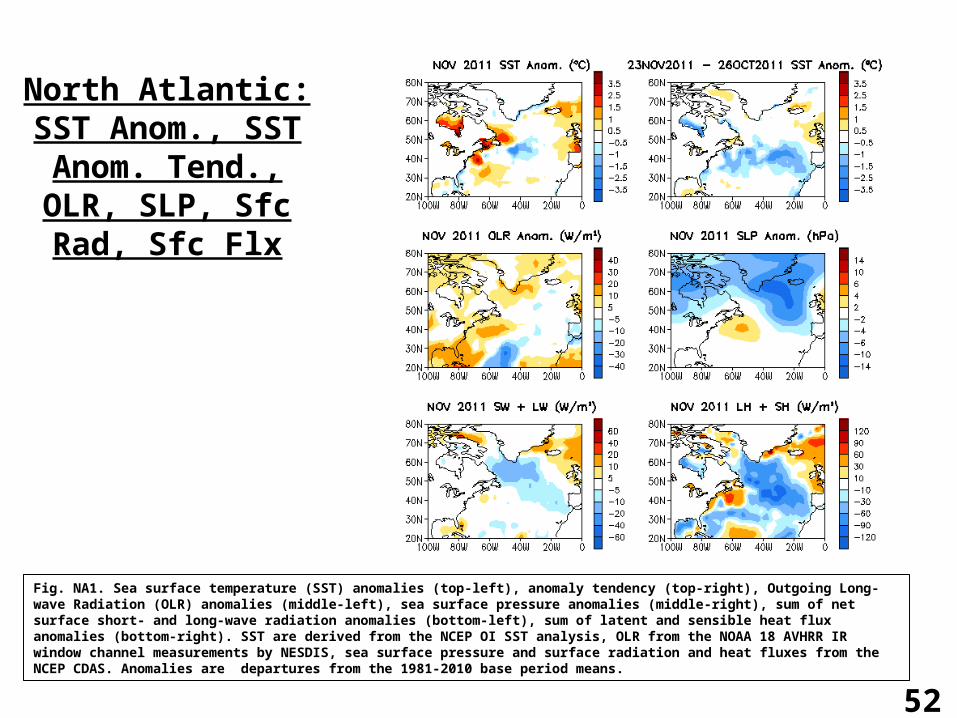
North Atlantic: SST Anom., SST
Anom. Tend., OLR, SLP, Sfc Rad, Sfc Flx
Fig. NA1. Sea surface temperature (SST) anomalies (top-left), anomaly tendency (top-right), Outgoing Long-wave Radiation (OLR) anomalies (middle-left), sea surface pressure anomalies (middle-right), sum of net surface short- and long-wave radiation anomalies (bottom-left), sum of latent and sensible heat flux anomalies (bottom-right). SST are derived from the NCEP OI SST analysis, OLR from the NOAA 18 AVHRR IR window channel measurements by NESDIS, sea surface pressure and surface radiation and heat fluxes from the NCEP CDAS. Anomalies are departures from the 1981-2010 base period means.

53
CFS Niño3.4 SST Predictions from Different Initial Months
Fig. M1. CFS Nino3.4 SST prediction from the latest 9 initial months. Displayed are 40 forecast members (brown) made four times per day initialized from the last 10 days of the initial month (labelled as IC=MonthYear) as well as ensemble mean (blue) and observations (black). Anomalies were computed with respect to the 1981-2010 base period means.
54
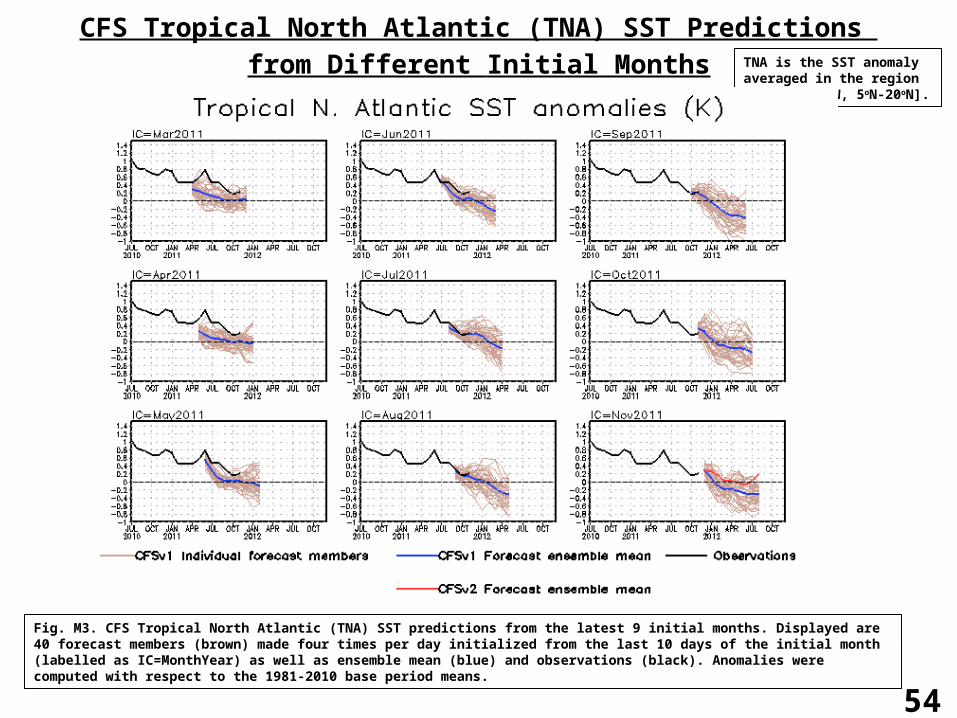
CFS Tropical North Atlantic (TNA) SST Predictions from Different Initial Months TNA is the SST anomaly
averaged in the region of [60oW-30oW, 5oN-20oN].
Fig. M3. CFS Tropical North Atlantic (TNA) SST predictions from the latest 9 initial months. Displayed are 40 forecast members (brown) made four times per day initialized from the last 10 days of the initial month (labelled as IC=MonthYear) as well as ensemble mean (blue) and observations (black). Anomalies were computed with respect to the 1981-2010 base period means.

55
CFS Pacific Decadal Oscillation (PDO) Index Predictions from Different Initial Months
Fig. M4. CFS Pacific Decadal Oscillation (PDO) index predictions from the latest 9 initial months. Displayed are 40 forecast members (brown) made four times per day initialized from the last 10 days of the initial month (labelled as IC=MonthYear) as well as ensemble mean (blue) and observations (black). Anomalies were computed with respect to the 1981-2010 base period means.
PDO is the first EOF of monthly ERSSTv3b anomaly in the region of [110oE-100oW, 20oN-60oN].
CFS PDO index is the standardized projection of CFS SST forecast anomalies onto the PDO EOF pattern.

56
Switch to 1981-2010 Climatology
• SST from 1971-2000 to 1981-2010
Weekly OISST.v2, monthly ERSST.3b
• Atmospheric fields from 1979-1995 to 1981-2010
NCEP CDAS winds, sea level pressure, 200mb velocity potential, surface shortwave and longwave radiation, surface latent and sensible fluxes, relative humidity
Outgoing Long-wave Radiation
• Oceanic fields from 1982-2004 to 1981-2010
GODAS temperature, heat content, depth of 20oC, sea surface height, mixed layer depth, tropical cyclone heat potential, surface currents, upwelling
• Satellite data climatology 1993-2005 unchanged
Aviso Altimetry Sea Surface Height
Ocean Surface Current Analyses – Realtime (OSCAR)

57
- The seasonal mean SST in February-April (FMA) increased by more than 0.2oC over much of the Tropical Oceans and N. Atlantic, but decreased by more than 0.2oC in high-latitude N. Pacific, Gulf of Mexico and along the east coast of U.S.
- Compared to FMA, the seasonal mean SST in August-October (ASO) has a stronger warming in the tropical N. Atlantic, N. Pacific and Arctic Ocean, and a weaker cooling in Gulf of Mexico and along the east coast of U.S.
1971-2000 SST Climatology (Xue et al. 2003): http://www.cpc.ncep.noaa.gov/products/predictions/30day/SSTs/sst_clim.htm
1981-2010 SST Climatology: http://origin.cpc.ncep.noaa.gov/products/people/yxue/sstclim/
Be aware that new climatology (1981-2010) was applied since Jan 2011
58
Data Sources and References
• Optimal Interpolation SST (OI SST) version 2 (Reynolds et al. 2002)
• NCEP CDAS winds, surface radiation and heat fluxes
• NESDIS Outgoing Long-wave Radiation
• NDBC TAO data (http://tao.noaa.gov)
• PMEL TAO equatorial temperature analysis
• NCEP’s Global Ocean Data Assimilation System temperature, heat content, currents (Behringer and Xue 2004)
• Aviso Altimetry Sea Surface Height
• Ocean Surface Current Analyses – Realtime (OSCAR)
Please send your comments and suggestions to [email protected]. Thanks!