Embed Size (px)
Citation preview

Global Newsprint OutlookWill steep adjustments give way to moderation?
Derek MahlburgSenior Economist, Graphic Paper
San Diego, RISI North American ConferenceOctober 5th, 2016
© Copyright 2016 RISI, Inc. | Proprietary Information

© Copyright 2016 RISI, Inc. | Proprietary Information
• Has covered graphic paper markets with RISI since 2008
• Co‐author of the monthly Paper Trader and North American graphic paper forecasts
• Special studies include single‐client projects and Global Woodfree Risk of Closure Study, North American Containerboard Conversion Study and Global Outlook for Cut Size Uncoated Freesheet Markets
Senior Economist, Graphic PapersDerek Mahlburg
2
© Copyright 2016 RISI, Inc. | Proprietary Information 33
World Newsprint DemandFive straight years of accelerating demand declines culminate in 8.6% drop in 2015, the worst performance since 2009; can global demand find some stability?
‐15%
‐10%
‐5%
0%
5%
10%
20
22
24
26
28
30
32
34
36
38
40
96 97 98 99 00 01 02 03 04 05 06 07 08 09 10 11 12 13 14 15 16 17 18
Millions of Ton
nes
Volume (L)Percent Change (R)
3
© Copyright 2016 RISI, Inc. | Proprietary Information 44
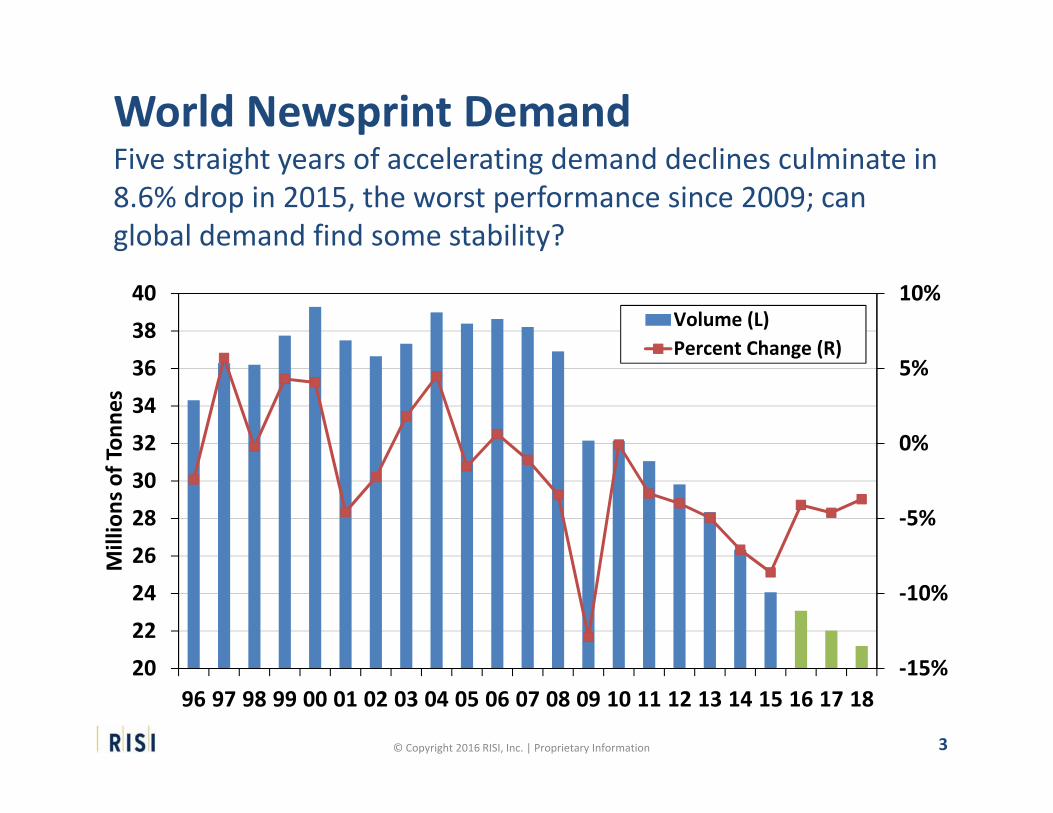
Newsprint Demand Now Declining Across the GlobeThousand Tonnes, Percent per Year, 2016‐2018
Global: ‐2,870 (‐4.1%)
‐10 (‐1.2%)
‐1,005 (‐6.2%)
‐812 (‐2.6%)
‐42 (‐2.5%)
‐155 (‐3.4%)
‐52 (‐4.0%)
‐691 (‐6.7%)
‐101 (‐2.7%)
3‐year total growth in tonnes(3‐year average % change)
4
© Copyright 2016 RISI, Inc. | Proprietary Information
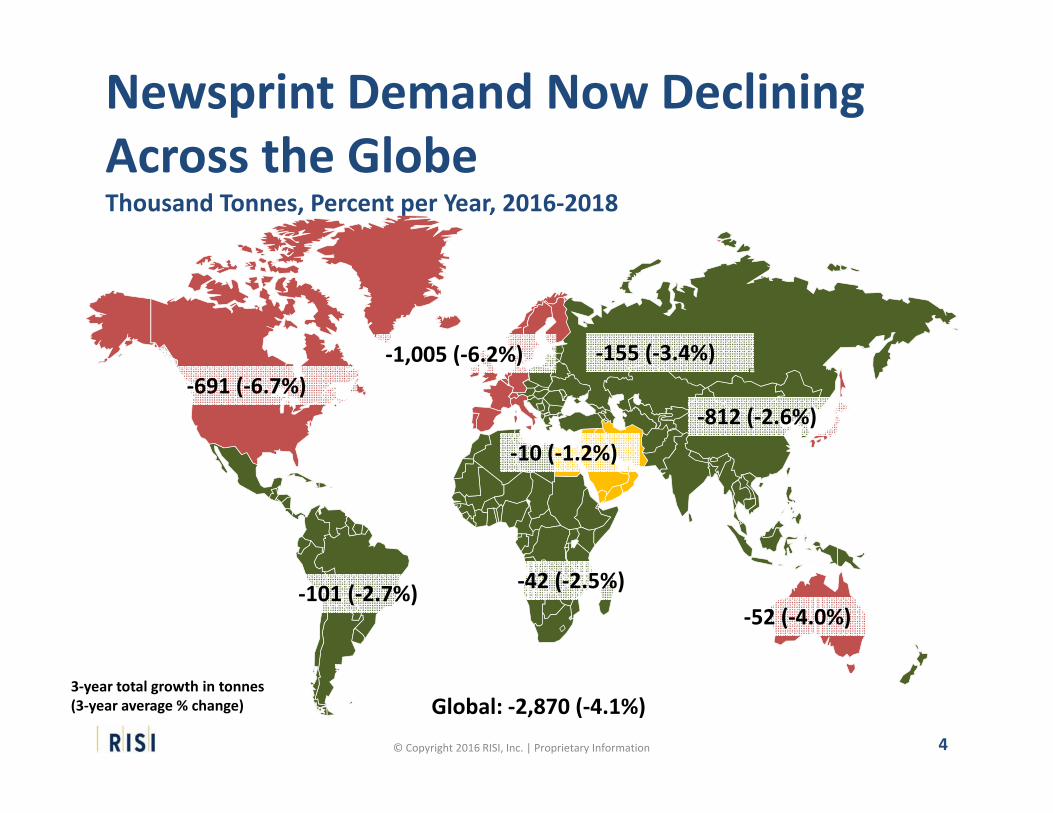
Global Demand Losses of 2014‐2015 Exacerbated by Weak Emerging Markets
-2.5
-2.0
-1.5
-1.0
-0.5
0.0
0.5
2010 2011 2012 2013 2014 2015 2016 2017 2018
Annual Newsprint Demand Decline by Region, Millions of Tonnes
Asia North America Europe Latin America Rest of World
5
© Copyright 2016 RISI, Inc. | Proprietary Information 66
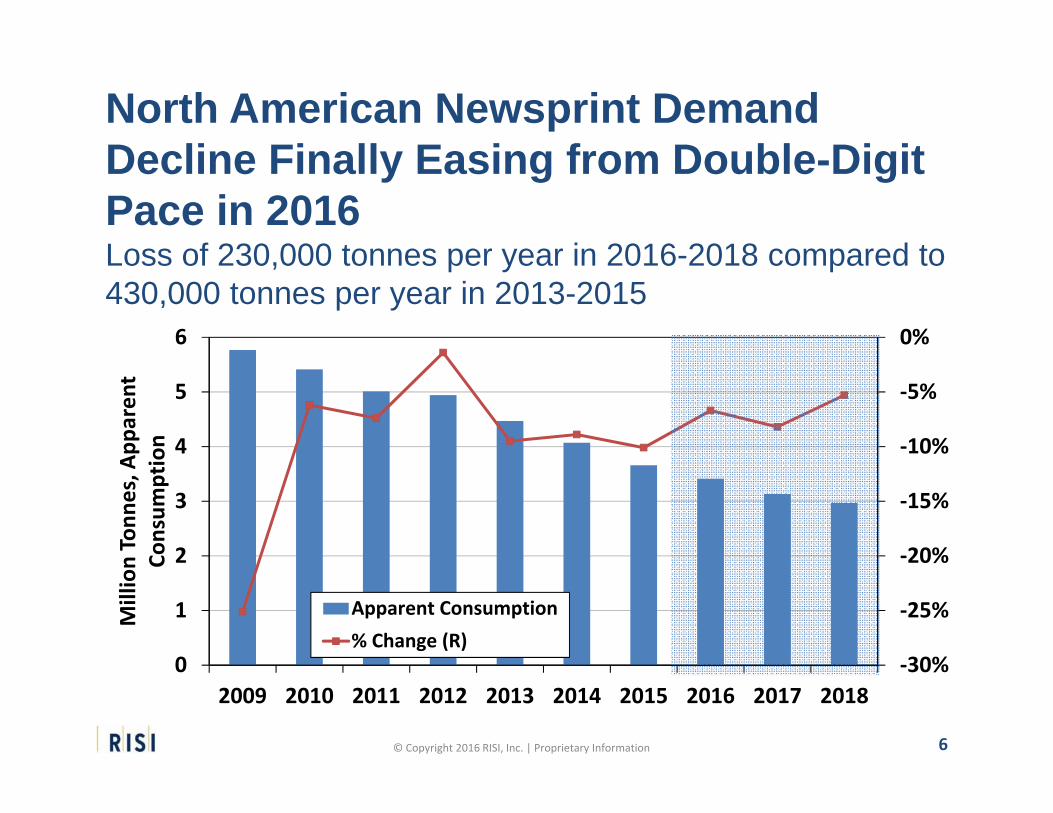
‐30%
‐25%
‐20%
‐15%
‐10%
‐5%
0%
0
1
2
3
4
5
6
2009 2010 2011 2012 2013 2014 2015 2016 2017 2018
Million Tonn
es, A
pparen
t Co
nsum
ption
Apparent Consumption% Change (R)
North American Newsprint Demand Decline Finally Easing from Double-Digit Pace in 2016Loss of 230,000 tonnes per year in 2016-2018 compared to 430,000 tonnes per year in 2013-2015
6
© Copyright 2016 RISI, Inc. | Proprietary Information 77
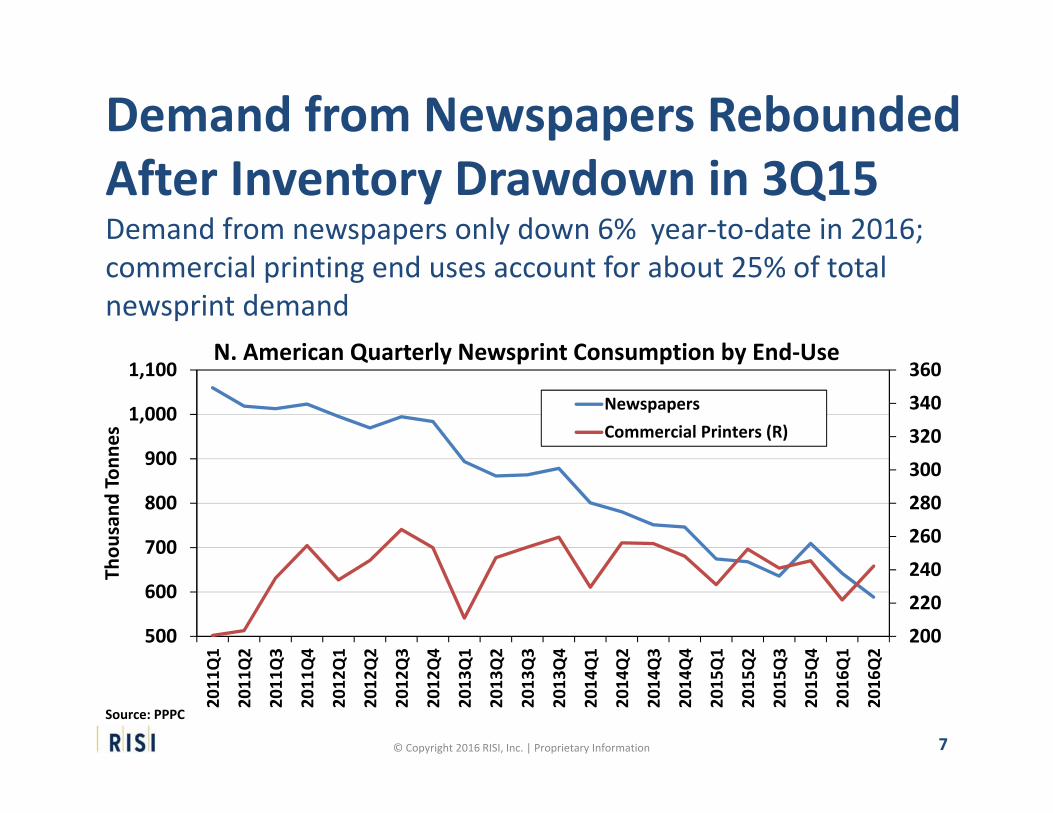
Demand from Newspapers Rebounded After Inventory Drawdown in 3Q15Demand from newspapers only down 6% year‐to‐date in 2016; commercial printing end uses account for about 25% of total newsprint demand
200220240
260280300320
340360
500
600
700
800
900
1,000
1,100
2011
Q1
2011
Q2
2011
Q3
2011
Q4
2012
Q1
2012
Q2
2012
Q3
2012
Q4
2013
Q1
2013
Q2
2013
Q3
2013
Q4
2014
Q1
2014
Q2
2014
Q3
2014
Q4
2015
Q1
2015
Q2
2015
Q3
2015
Q4
2016
Q1
2016
Q2
Thou
sand
Ton
nes
N. American Quarterly Newsprint Consumption by End‐Use
NewspapersCommercial Printers (R)
Source: PPPC
7
© Copyright 2016 RISI, Inc. | Proprietary Information 88
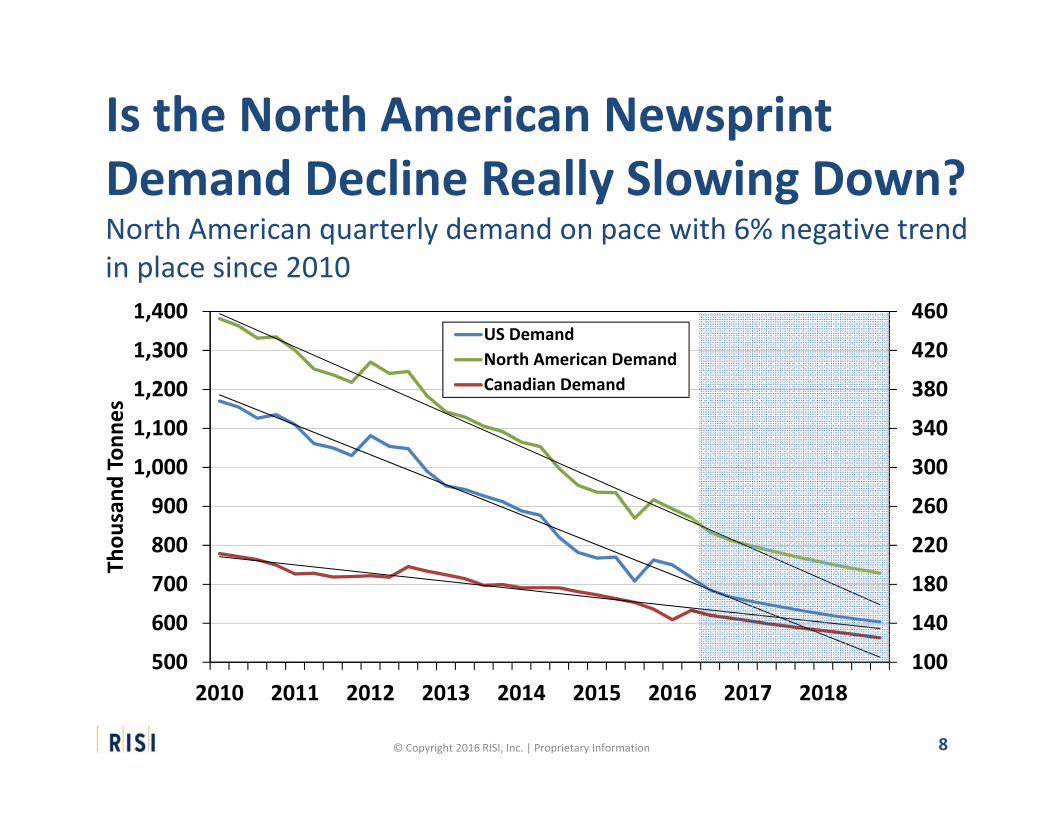
Is the North American Newsprint Demand Decline Really Slowing Down?North American quarterly demand on pace with 6% negative trend in place since 2010
100
140
180
220
260
300
340
380
420
460
500
600
700
800
900
1,000
1,100
1,200
1,300
1,400
2010 2011 2012 2013 2014 2015 2016 2017 2018
Thou
sand
Ton
nes
US DemandNorth American DemandCanadian Demand
8
© Copyright 2016 RISI, Inc. | Proprietary Information 99
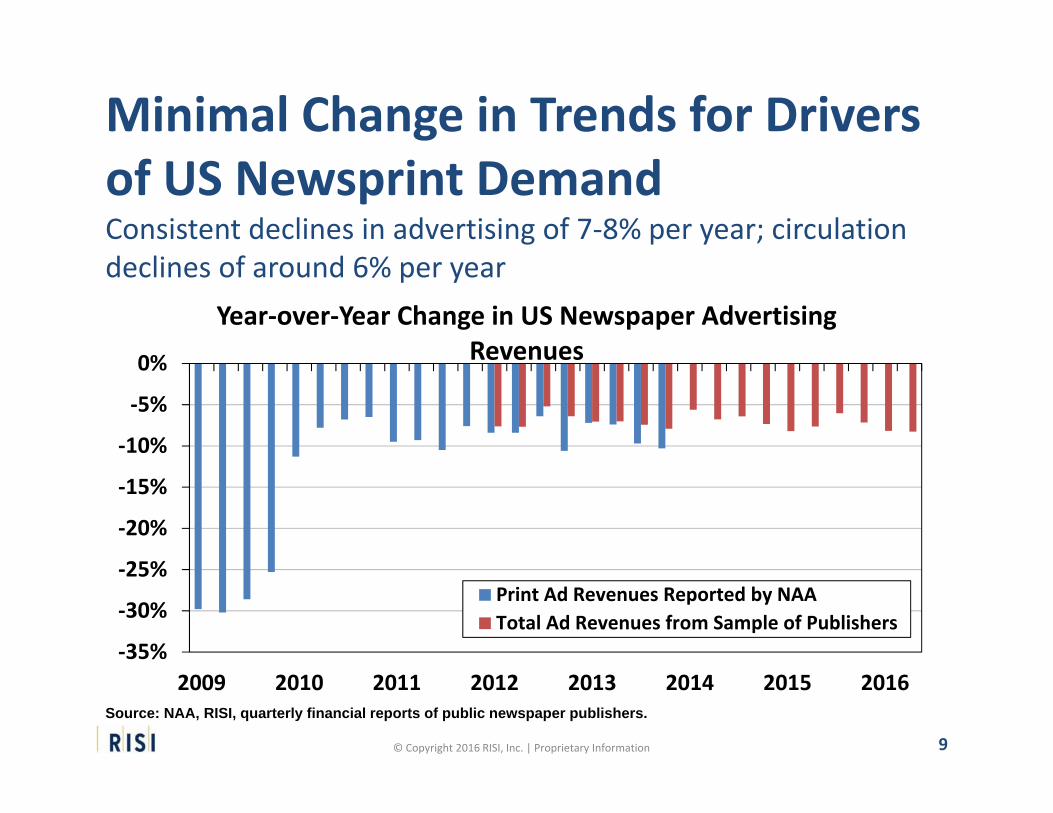
Minimal Change in Trends for Drivers of US Newsprint DemandConsistent declines in advertising of 7‐8% per year; circulation declines of around 6% per year
‐35%
‐30%
‐25%
‐20%
‐15%
‐10%
‐5%
0%
2009 2010 2011 2012 2013 2014 2015 2016
Year‐over‐Year Change in US Newspaper Advertising Revenues
Print Ad Revenues Reported by NAATotal Ad Revenues from Sample of Publishers
Source: NAA, RISI, quarterly financial reports of public newspaper publishers.
9
© Copyright 2016 RISI, Inc. | Proprietary Information 1010
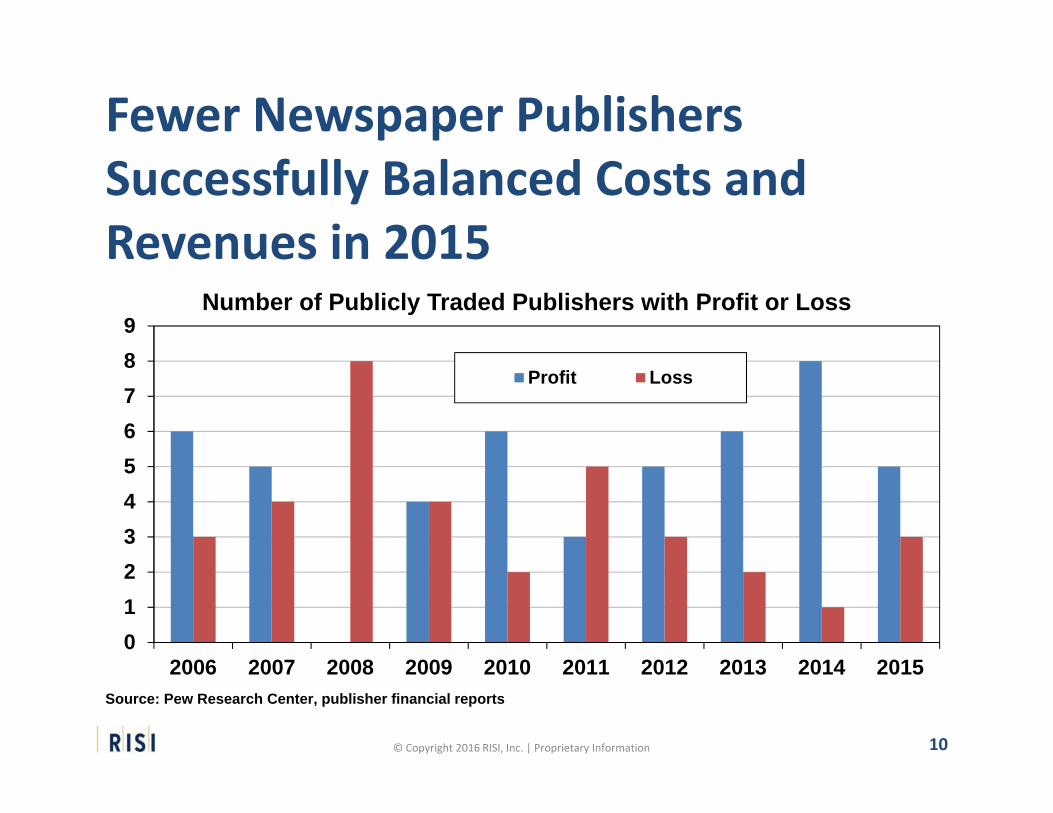
Fewer Newspaper Publishers Successfully Balanced Costs and Revenues in 2015
0123456789
2006 2007 2008 2009 2010 2011 2012 2013 2014 2015
Number of Publicly Traded Publishers with Profit or Loss
Profit Loss
Source: Pew Research Center, publisher financial reports
10
© Copyright 2016 RISI, Inc. | Proprietary Information 1111
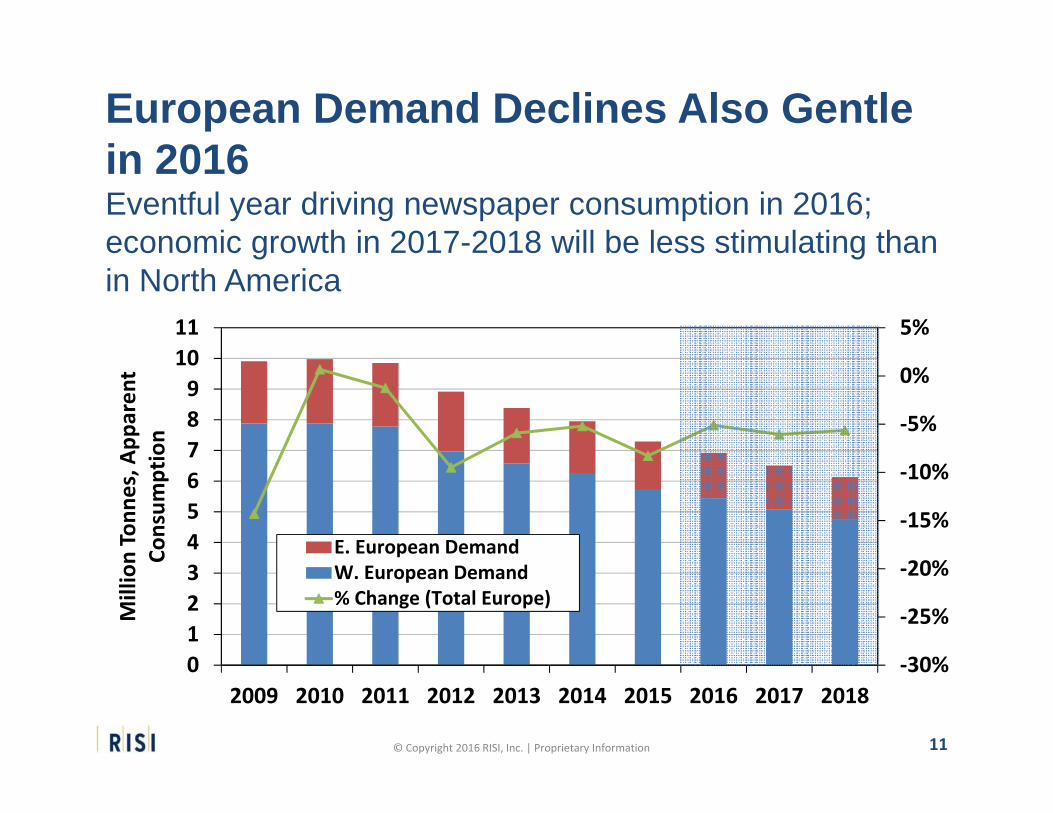
‐30%
‐25%
‐20%
‐15%
‐10%
‐5%
0%
5%
01234567891011
2009 2010 2011 2012 2013 2014 2015 2016 2017 2018
Million Tonn
es, A
pparen
t Co
nsum
ption
E. European DemandW. European Demand% Change (Total Europe)
European Demand Declines Also Gentle in 2016Eventful year driving newspaper consumption in 2016; economic growth in 2017-2018 will be less stimulating than in North America
11
© Copyright 2016 RISI, Inc. | Proprietary Information 1212
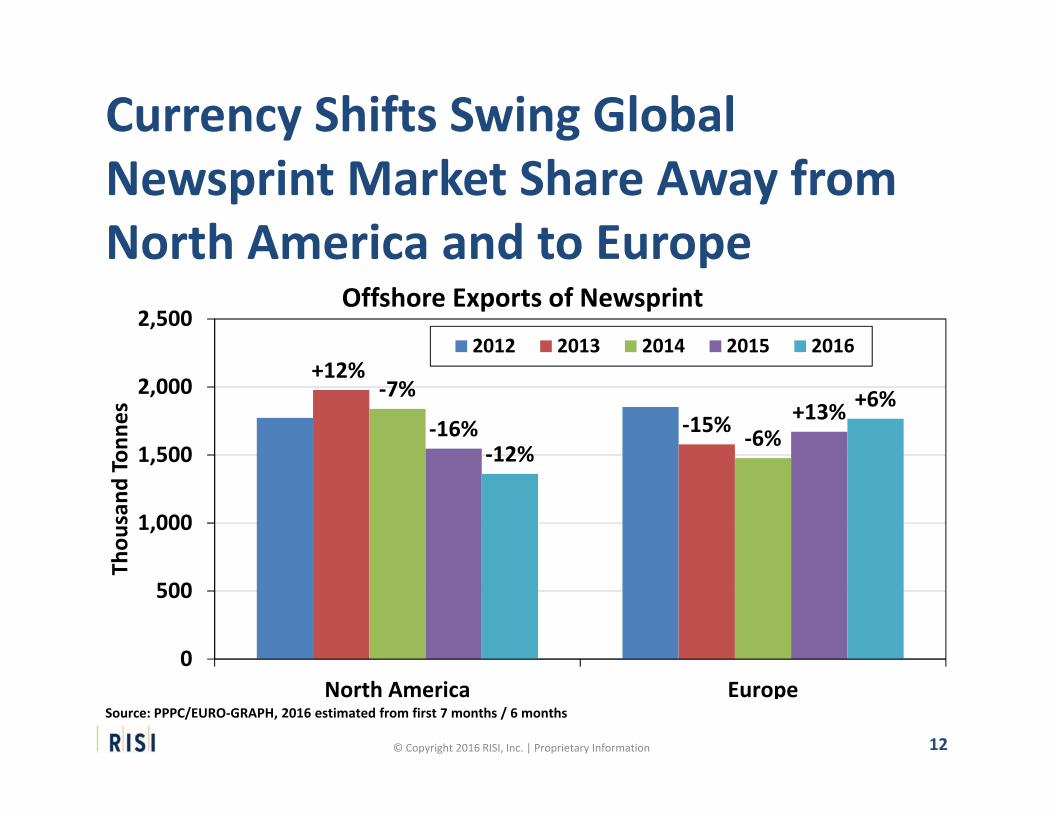
Currency Shifts Swing Global Newsprint Market Share Away from North America and to Europe
+12%
‐15%‐7%
‐6%‐16%+13%
‐12%
+6%
0
500
1,000
1,500
2,000
2,500
North America Europe
Thou
sand
Ton
nes
Offshore Exports of Newsprint
2012 2013 2014 2015 2016
Source: PPPC/EURO‐GRAPH, 2016 estimated from first 7 months / 6 months
12
© Copyright 2016 RISI, Inc. | Proprietary Information 1313
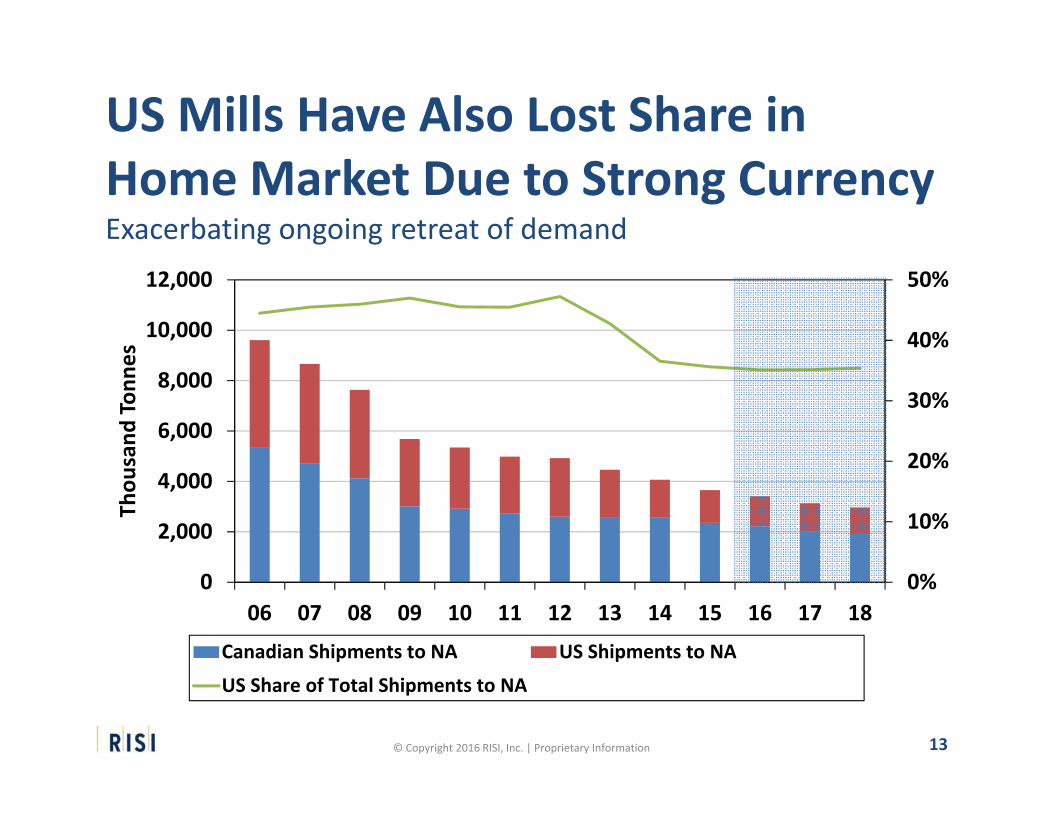
US Mills Have Also Lost Share in Home Market Due to Strong CurrencyExacerbating ongoing retreat of demand
0%
10%
20%
30%
40%
50%
0
2,000
4,000
6,000
8,000
10,000
12,000
06 07 08 09 10 11 12 13 14 15 16 17 18
Thou
sand
Ton
nes
Canadian Shipments to NA US Shipments to NA
US Share of Total Shipments to NA
13
© Copyright 2016 RISI, Inc. | Proprietary Information
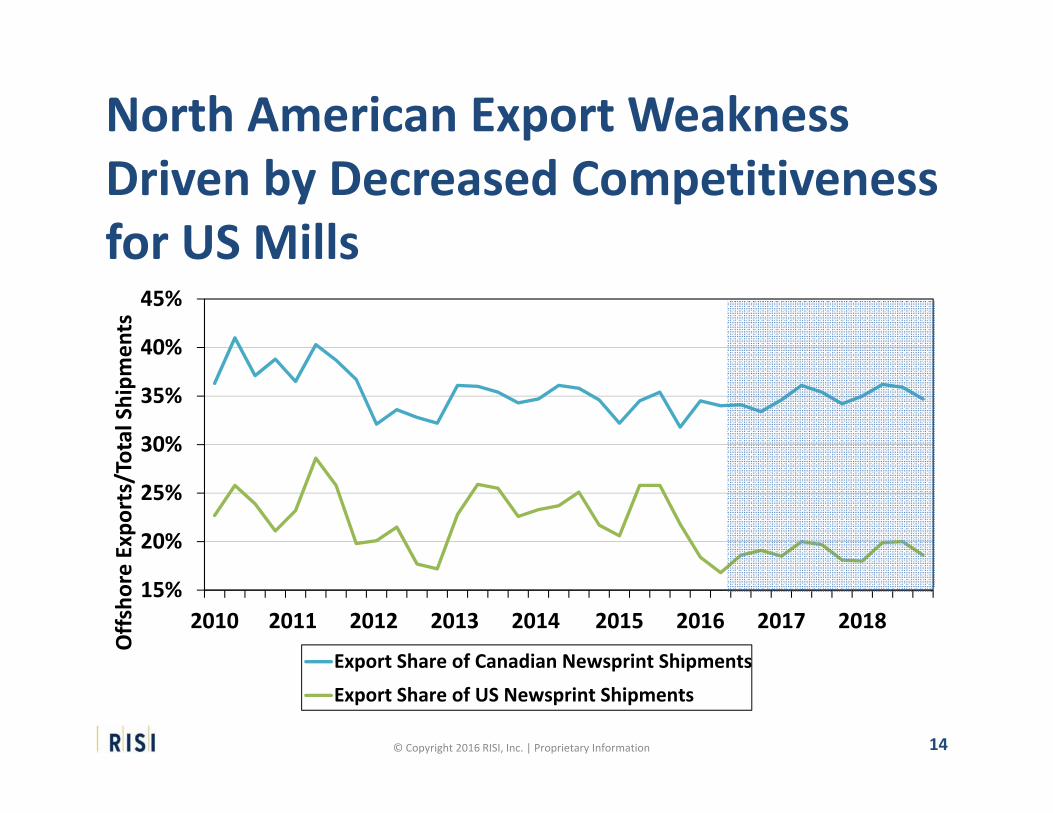
North American Export Weakness Driven by Decreased Competitiveness for US Mills
15%
20%
25%
30%
35%
40%
45%
2010 2011 2012 2013 2014 2015 2016 2017 2018
Offs
hore Exports/Total Shipm
ents
Export Share of Canadian Newsprint Shipments
Export Share of US Newsprint Shipments
14
© Copyright 2016 RISI, Inc. | Proprietary Information 1515
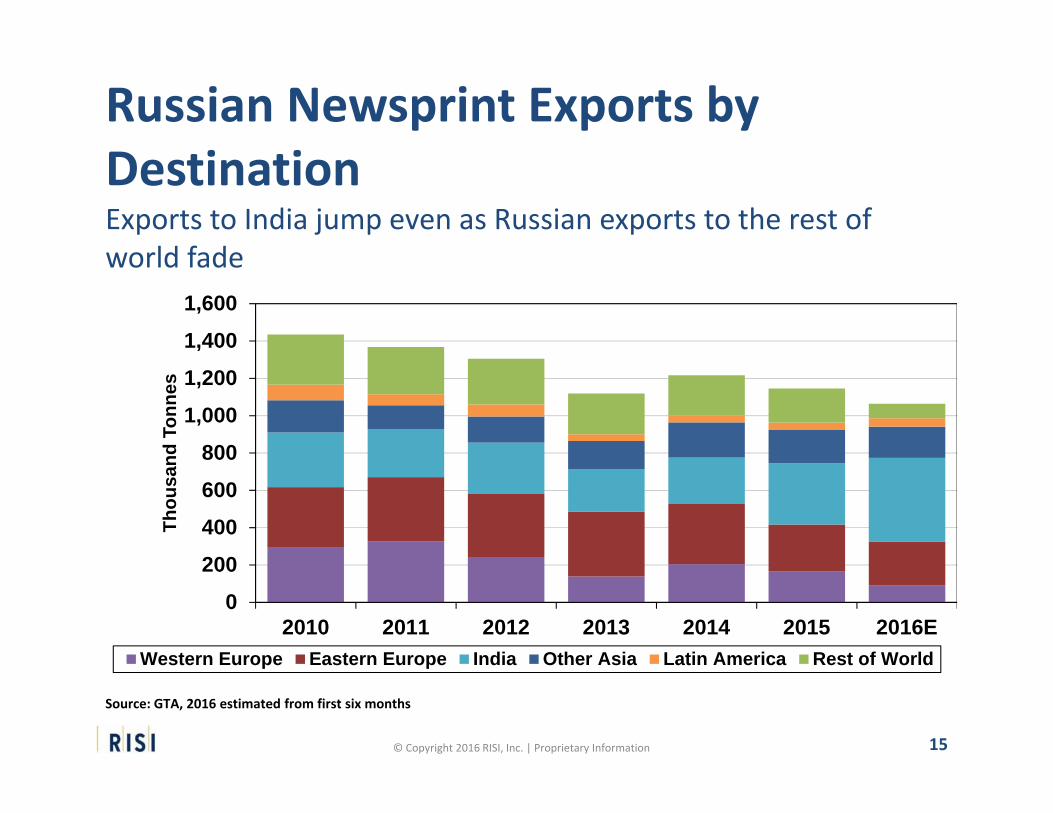
Russian Newsprint Exports by DestinationExports to India jump even as Russian exports to the rest of world fade
0
200
400
600
800
1,000
1,200
1,400
1,600
2010 2011 2012 2013 2014 2015 2016E
Thou
sand
Ton
nes
Western Europe Eastern Europe India Other Asia Latin America Rest of World
Source: GTA, 2016 estimated from first six months
15
© Copyright 2016 RISI, Inc. | Proprietary Information 1616
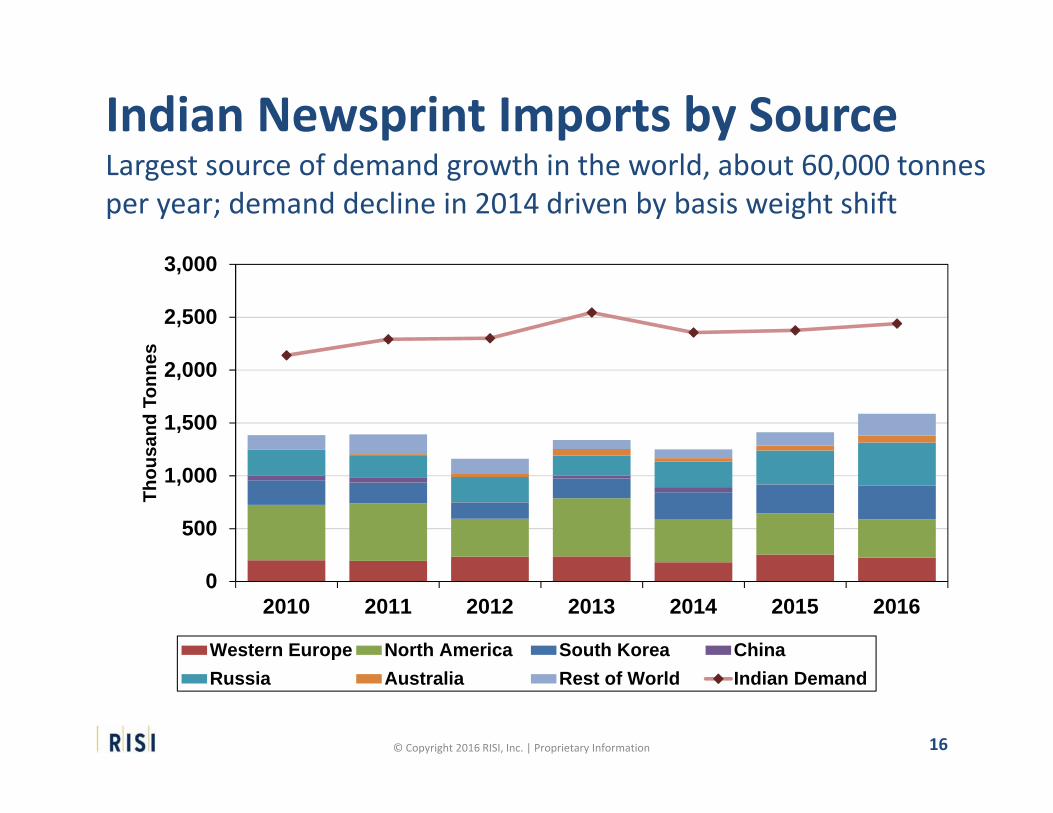
Indian Newsprint Imports by SourceLargest source of demand growth in the world, about 60,000 tonnesper year; demand decline in 2014 driven by basis weight shift
0
500
1,000
1,500
2,000
2,500
3,000
2010 2011 2012 2013 2014 2015 2016
Thou
sand
Ton
nes
Western Europe North America South Korea ChinaRussia Australia Rest of World Indian Demand
16
© Copyright 2016 RISI, Inc. | Proprietary Information 1717
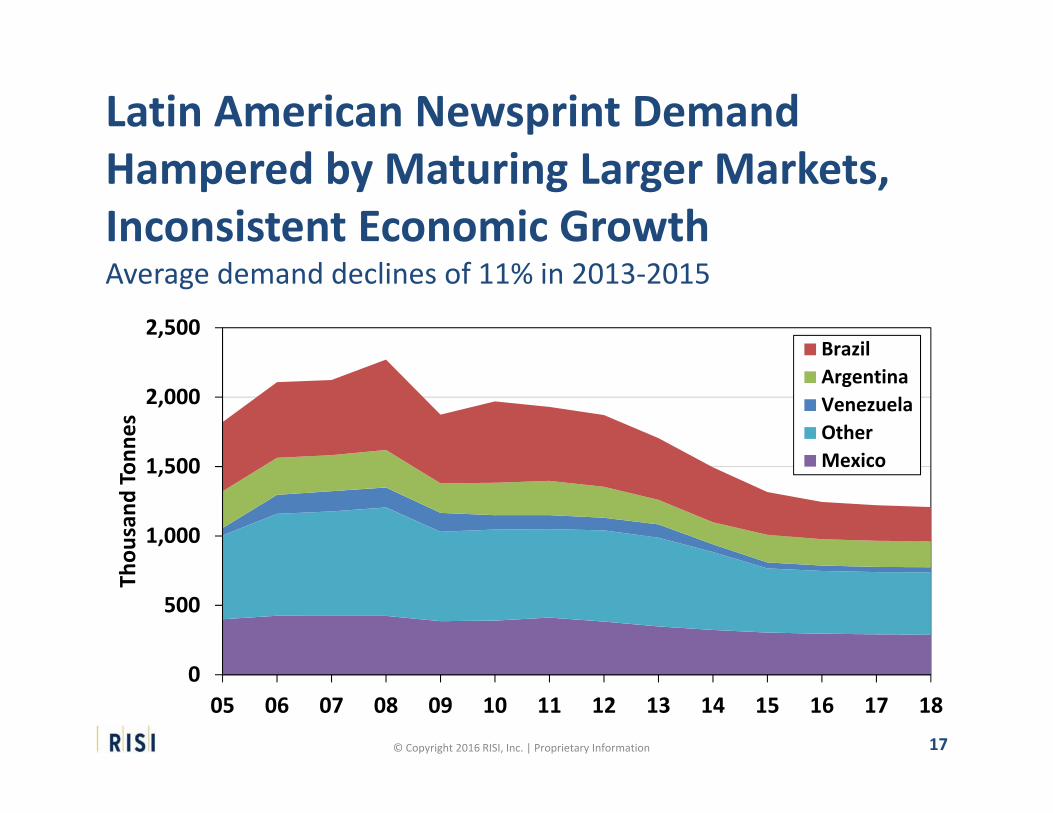
Latin American Newsprint Demand Hampered by Maturing Larger Markets, Inconsistent Economic GrowthAverage demand declines of 11% in 2013‐2015
0
500
1,000
1,500
2,000
2,500
05 06 07 08 09 10 11 12 13 14 15 16 17 18
Thou
sand
Ton
nes
BrazilArgentinaVenezuelaOtherMexico
17
© Copyright 2016 RISI, Inc. | Proprietary Information
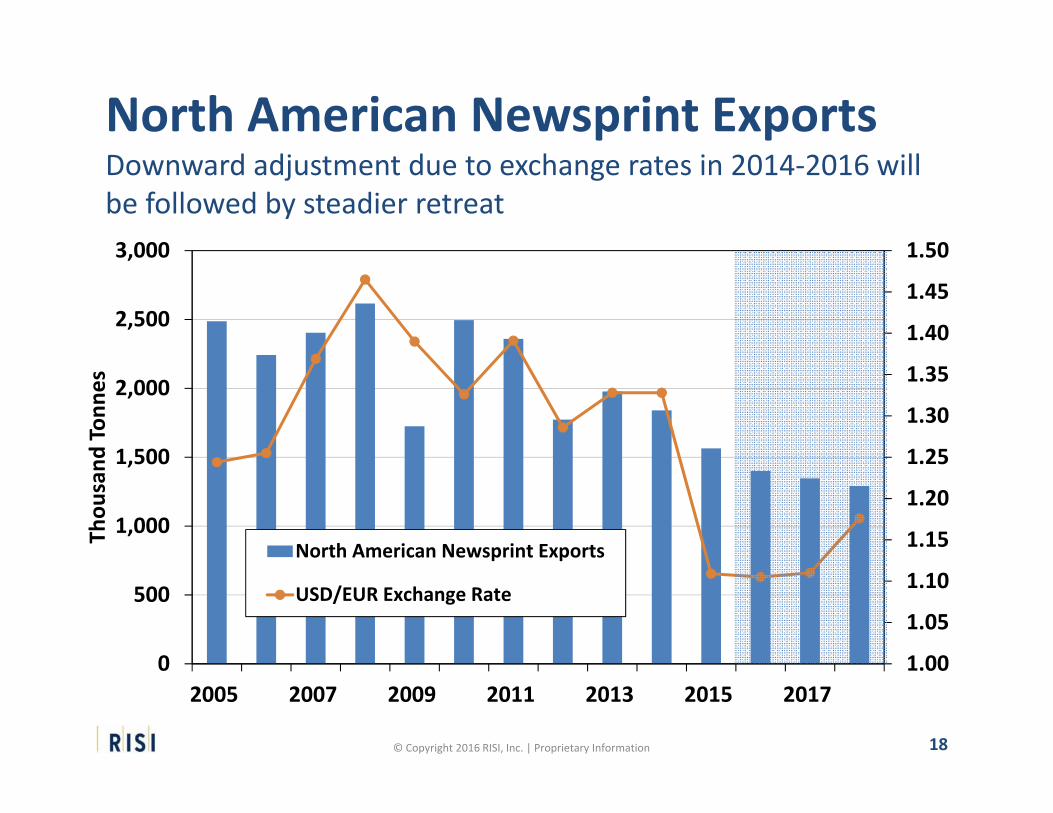
North American Newsprint Exports Downward adjustment due to exchange rates in 2014‐2016 will be followed by steadier retreat
1.00
1.05
1.10
1.15
1.20
1.25
1.30
1.35
1.40
1.45
1.50
0
500
1,000
1,500
2,000
2,500
3,000
2005 2007 2009 2011 2013 2015 2017
Thou
sand
Ton
nes
North American Newsprint Exports
USD/EUR Exchange Rate
18
© Copyright 2016 RISI, Inc. | Proprietary Information
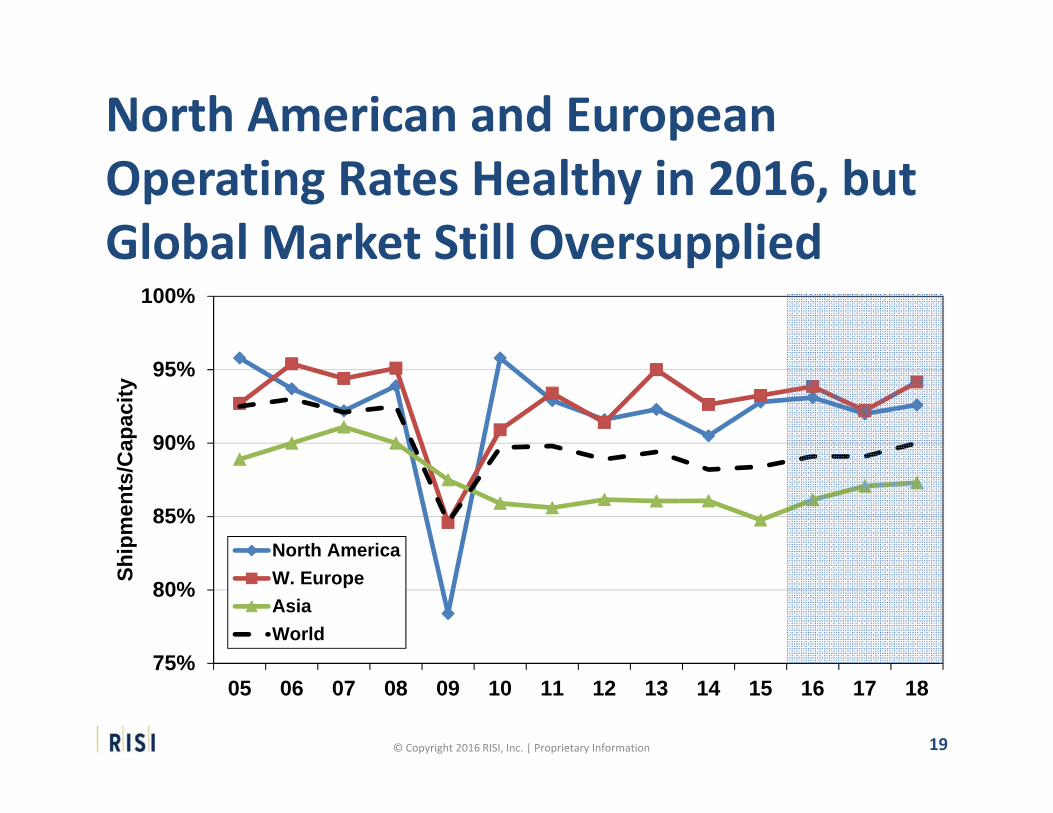
North American and European Operating Rates Healthy in 2016, but Global Market Still Oversupplied
75%
80%
85%
90%
95%
100%
05 06 07 08 09 10 11 12 13 14 15 16 17 18
Ship
men
ts/C
apac
ity
North AmericaW. EuropeAsiaWorld
19
© Copyright 2016 RISI, Inc. | Proprietary Information
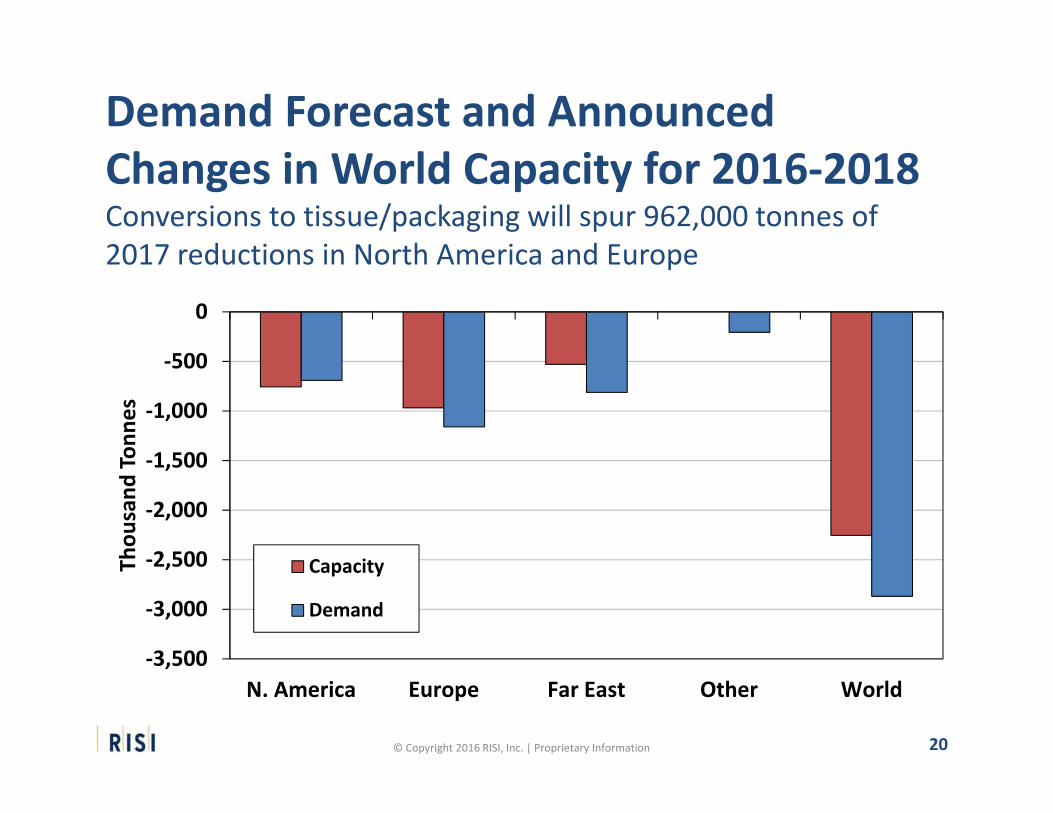
Demand Forecast and Announced Changes in World Capacity for 2016‐2018Conversions to tissue/packaging will spur 962,000 tonnes of 2017 reductions in North America and Europe
‐3,500
‐3,000
‐2,500
‐2,000
‐1,500
‐1,000
‐500
0
N. America Europe Far East Other World
Thou
sand
Ton
nes
Capacity
Demand
20
© Copyright 2016 RISI, Inc. | Proprietary Information
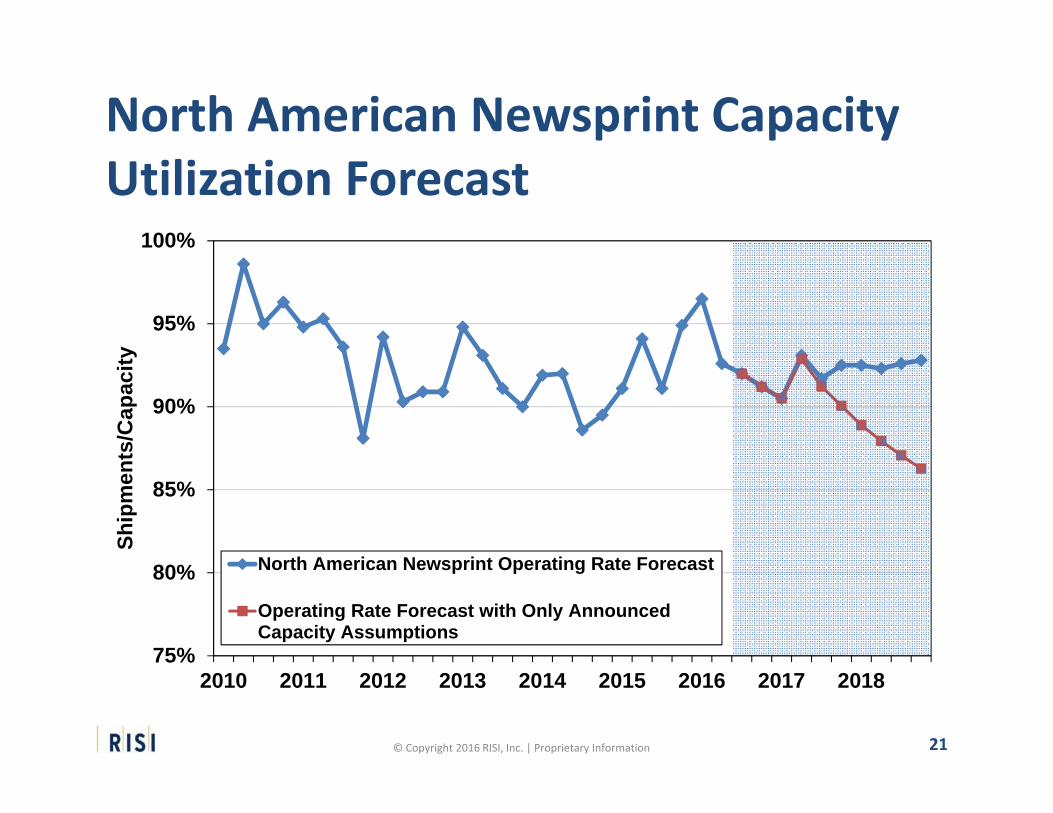
North American Newsprint Capacity Utilization Forecast
75%
80%
85%
90%
95%
100%
2010 2011 2012 2013 2014 2015 2016 2017 2018
Ship
men
ts/C
apac
ity
North American Newsprint Operating Rate Forecast
Operating Rate Forecast with Only AnnouncedCapacity Assumptions
21
© Copyright 2016 RISI, Inc. | Proprietary Information
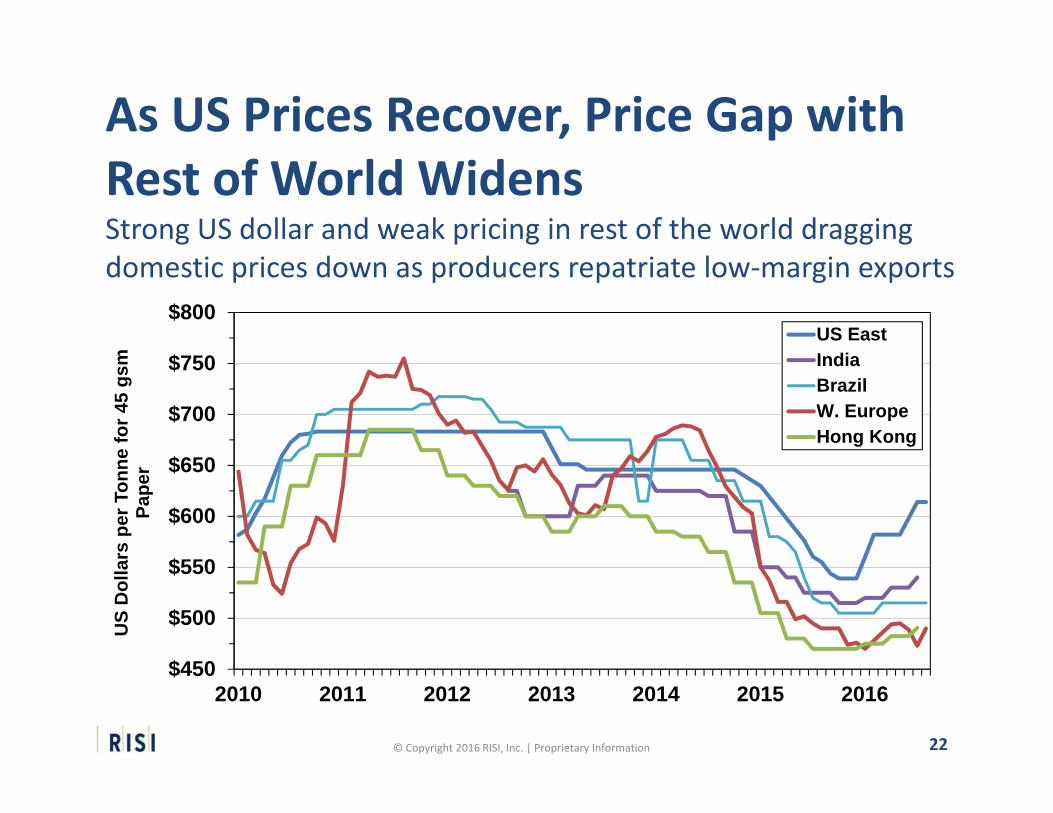
As US Prices Recover, Price Gap with Rest of World WidensStrong US dollar and weak pricing in rest of the world dragging domestic prices down as producers repatriate low‐margin exports
$450
$500
$550
$600
$650
$700
$750
$800
2010 2011 2012 2013 2014 2015 2016
US
Dol
lars
per
Ton
ne fo
r 45
gsm
Pa
per
US EastIndiaBrazilW. EuropeHong Kong
22
© Copyright 2016 RISI, Inc. | Proprietary Information
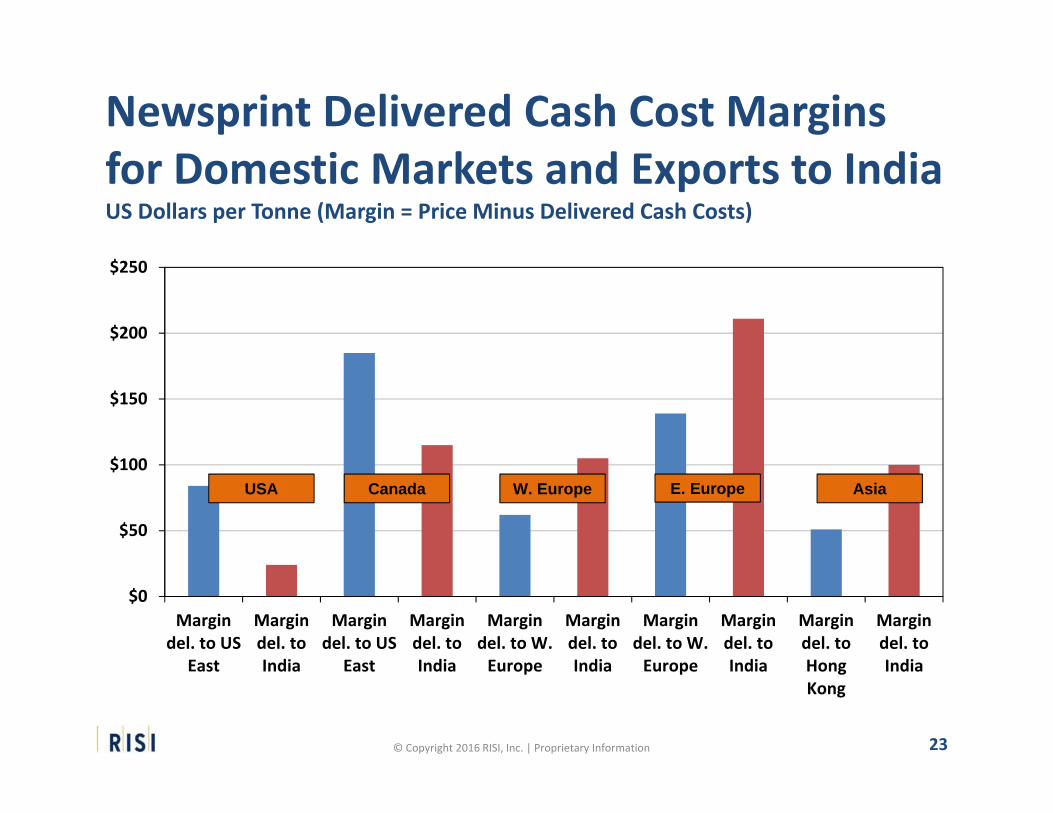
Newsprint Delivered Cash Cost Margins for Domestic Markets and Exports to IndiaUS Dollars per Tonne (Margin = Price Minus Delivered Cash Costs)
$0
$50
$100
$150
$200
$250
Margindel. to US
East
Margindel. toIndia
Margindel. to US
East
Margindel. toIndia
Margindel. to W.Europe
Margindel. toIndia
Margindel. to W.Europe
Margindel. toIndia
Margindel. toHongKong
Margindel. toIndia
E. EuropeCanada W. Europe AsiaUSA
23
© Copyright 2016 RISI, Inc. | Proprietary Information
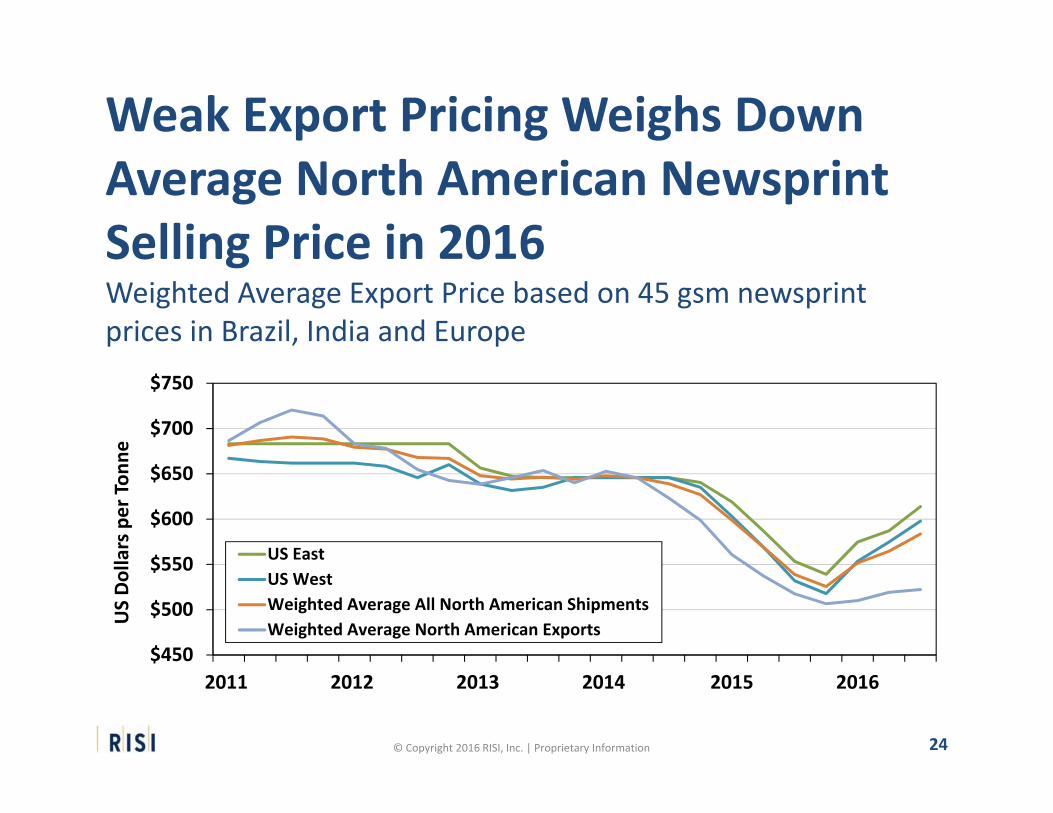
Weak Export Pricing Weighs Down Average North American Newsprint Selling Price in 2016Weighted Average Export Price based on 45 gsm newsprint prices in Brazil, India and Europe
$450
$500
$550
$600
$650
$700
$750
2011 2012 2013 2014 2015 2016
US Dollars per Ton
ne
US EastUS WestWeighted Average All North American ShipmentsWeighted Average North American Exports
24
© Copyright 2016 RISI, Inc. | Proprietary Information 2525
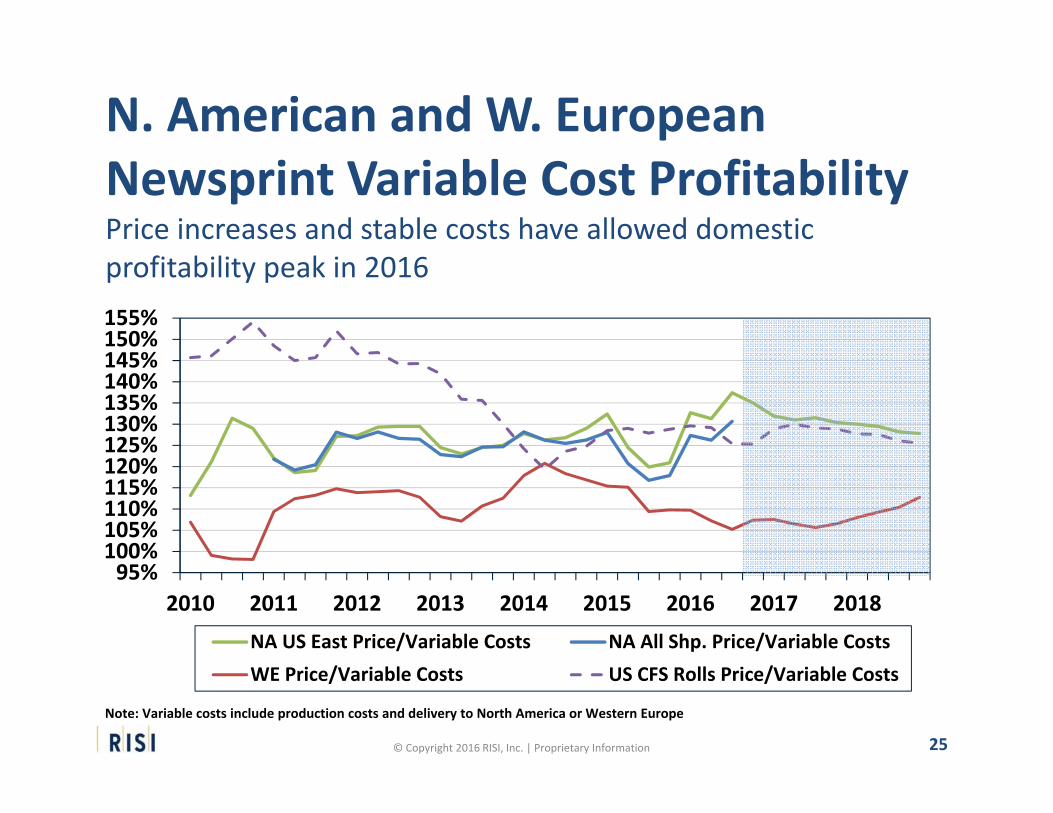
N. American and W. European Newsprint Variable Cost ProfitabilityPrice increases and stable costs have allowed domestic profitability peak in 2016
95%100%105%110%115%120%125%130%135%140%145%150%155%
2010 2011 2012 2013 2014 2015 2016 2017 2018
NA US East Price/Variable Costs NA All Shp. Price/Variable CostsWE Price/Variable Costs US CFS Rolls Price/Variable Costs
Note: Variable costs include production costs and delivery to North America or Western Europe
25
© Copyright 2016 RISI, Inc. | Proprietary Information
World Graphic Paper 5‐Year Forecastwww.risi.com/worldgraphic
Global Cut Size Uncoated Freesheet Studywww.risi.com/cutsize
China’s Influence on WorldGraphic Paper Markets in theComing Decadewww.risi.com/chinagraphic
Thank you for your attention!For more information:
26