Embed Size (px)
Citation preview
Georgia State University Georgia State University
ScholarWorks @ Georgia State University ScholarWorks @ Georgia State University
Public Health Faculty Publications School of Public Health
2013
Global Mortality Estimates for the 2009 Influenza Pandemic from Global Mortality Estimates for the 2009 Influenza Pandemic from
the GLaMOR Project: A Modeling Study the GLaMOR Project: A Modeling Study
Lone Simonsen George Washington University, [email protected]
Peter Spreeuwenberg Netherlands Institute for Health Services Research
Roger Lustig Sage Analytica
Robert J. Taylor Sage Analytica
Douglas M. Fleming Royal College of General Practitioners, [email protected]
See next page for additional authors
Follow this and additional works at: https://scholarworks.gsu.edu/iph_facpub
Part of the Public Health Commons
Recommended Citation Recommended Citation Simonsen L, Spreeuwenberg P, Lustig R, Taylor RJ, Fleming DM, et al. (2013) Global Mortality Estimates for the 2009 Influenza Pandemic from the GLaMOR Project: A Modeling Study. PLoS Med 10(11): e1001558. doi:10.1371/journal.pmed.1001558
This Article is brought to you for free and open access by the School of Public Health at ScholarWorks @ Georgia State University. It has been accepted for inclusion in Public Health Faculty Publications by an authorized administrator of ScholarWorks @ Georgia State University. For more information, please contact [email protected].

Authors Authors Lone Simonsen, Peter Spreeuwenberg, Roger Lustig, Robert J. Taylor, Douglas M. Fleming, Madelon Kroneman, Maria D. Van Kerkhove, Anthony W. Mounts, W. John Paget, and Gerardo Chowell
This article is available at ScholarWorks @ Georgia State University: https://scholarworks.gsu.edu/iph_facpub/99

Global Mortality Estimates for the 2009 InfluenzaPandemic from the GLaMOR Project: A Modeling StudyLone Simonsen1,2*, Peter Spreeuwenberg3, Roger Lustig2, Robert J. Taylor2, Douglas M. Fleming4,
Madelon Kroneman3, Maria D. Van Kerkhove5,6, Anthony W. Mounts6, W. John Paget3,
the GLaMOR Collaborating Teams"
1 Department of Global Health, George Washington University School of Public Health and Health Services, Washington, District of Columbia, United States of America,
2 Sage Analytica, Bethesda, Maryland, United States of America, 3 Netherlands Institute for Health Services Research, Utrecht, Netherlands, 4 Royal College of General
Practitioners, London, United Kingdom, 5 Medical Research Council Centre for Outbreak Analysis and Modelling, Department of Infectious Disease Epidemiology, Imperial
College, London, United Kingdom, 6 Global Influenza Programme, World Health Organization, Geneva, Switzerland
Abstract
Background: Assessing the mortality impact of the 2009 influenza A H1N1 virus (H1N1pdm09) is essential for optimizingpublic health responses to future pandemics. The World Health Organization reported 18,631 laboratory-confirmedpandemic deaths, but the total pandemic mortality burden was substantially higher. We estimated the 2009 pandemicmortality burden through statistical modeling of mortality data from multiple countries.
Methods and Findings: We obtained weekly virology and underlying cause-of-death mortality time series for 2005–2009 for20 countries covering ,35% of the world population. We applied a multivariate linear regression model to estimatepandemic respiratory mortality in each collaborating country. We then used these results plus ten country indicators in amultiple imputation model to project the mortality burden in all world countries. Between 123,000 and 203,000 pandemicrespiratory deaths were estimated globally for the last 9 mo of 2009. The majority (62%–85%) were attributed to personsunder 65 y of age. We observed a striking regional heterogeneity, with almost 20-fold higher mortality in some countries inthe Americas than in Europe. The model attributed 148,000–249,000 respiratory deaths to influenza in an average pre-pandemic season, with only 19% in persons ,65 y. Limitations include lack of representation of low-income countriesamong single-country estimates and an inability to study subsequent pandemic waves (2010–2012).
Conclusions: We estimate that 2009 global pandemic respiratory mortality was ,10-fold higher than the World HealthOrganization’s laboratory-confirmed mortality count. Although the pandemic mortality estimate was similar in magnitudeto that of seasonal influenza, a marked shift toward mortality among persons ,65 y of age occurred, so that many morelife-years were lost. The burden varied greatly among countries, corroborating early reports of far greater pandemic severityin the Americas than in Australia, New Zealand, and Europe. A collaborative network to collect and analyze mortality andhospitalization surveillance data is needed to rapidly establish the severity of future pandemics.
Please see later in the article for the Editors’ Summary.
Citation: Simonsen L, Spreeuwenberg P, Lustig R, Taylor RJ, Fleming DM, et al. (2013) Global Mortality Estimates for the 2009 Influenza Pandemic from theGLaMOR Project: A Modeling Study. PLoS Med 10(11): e1001558. doi:10.1371/journal.pmed.1001558
Academic Editor: Simon I. Hay, University of Oxford, United Kingdom
Received February 26, 2013; Accepted October 15, 2013; Published November 26, 2013
Copyright: � 2013 Simonsen et al. This is an open-access article distributed under the terms of the Creative Commons Attribution License, which permitsunrestricted use, distribution, and reproduction in any medium, provided the original author and source are credited.
Funding: This study was supported by the WHO on a contract with NIVEL (APW 20043611 and 200617995). LS acknowledges support from the RAPIDD (Researchand Policy for Infectious Disease Dynamics) program of the Science and Technology Directorate, Department of Homeland Security, the Fogarty InternationalCenter, and National Institutes of Health. MDVK acknowledges salary support from the Medical Research Centre and the Bill & Melinda Gates Foundation. Nofunding bodies had any role in study design, data collection and analysis, decision to publish, or preparation of the manuscript.
Competing Interests: LS has provided consultancy services to GlaxoSmithKline (GSK) and served on expert advisory boards for GSK, Roche, Pfizer, Merck, andNovartis. LS and RJT have an ownership interest in Sage Analytica, a consultancy in epidemiology and bioinformatics. DMF has provided consultancy services forGSK, Novartis, and MedImmune relating to influenza epidemiology and vaccine effectiveness and has been supported to attend international influenza meetings.WJP has served on an influenza advisory board for GSK.
Abbreviations: GLaMOR, Global Pandemic Mortality; GNI, gross national income; H1N1pdm09, 2009 influenza A H1N1 pandemic; ICD-10, InternationalClassification of Diseases–10; WHO, World Health Organization.
* E-mail: [email protected]
" Membership of the GLaMOR Collaborating Teams is provided in the Acknowledgments.
PLOS Medicine | www.plosmedicine.org 1 November 2013 | Volume 10 | Issue 11 | e1001558

Introduction
Recurring seasonal influenza epidemics impose a moderate, if
variable, mortality burden every year. But when a new human-
transmissible influenza virus emerges, the ensuing pandemic can
be catastrophic; the 1918 Spanish influenza pandemic, for
example, killed approximately 1%–2% of the global population.
Understanding the global mortality impact of pandemic influen-
za—who died, where, and when—is fundamental to understand-
ing how pandemics emerge and evolve, and will help to guide
responses to future pandemics. And because so few pandemics
have occurred in the modern era, it is essential that each one be
studied thoroughly—even if, as was the case with the 2009
influenza A H1N1 pandemic (H1N1pdm09), the catastrophe
failed to appear.
As of 31 August 2010 the World Health Organization (WHO)
received reports of 18,449 laboratory-confirmed deaths from
H1N1pdm09 infection [1]. This modest number has caused many
to wonder what all the excitement was about, and some to
question whether the pandemic response was excessive [2,3]. But
what is not widely appreciated is that the laboratory-confirmed
total greatly underestimates the mortality burden, because only a
minority of influenza-related deaths are ever definitively diagnosed
as such. Additional influenza deaths result from secondary
bacterial infections and exacerbation of preexisting chronic
conditions, but are not recorded as being in any way related to
influenza infection.
Statistical methods are therefore used to separate the influenza-
attributable fraction of deaths from the background [4,5]. These
methods involve modeling seasonal cyclical patterns in mortality
time series compiled from vital statistics, often coupled with viral
surveillance data to provide information on the timing of influenza
circulation. Vital statistics data usually contain information about
cause of death, allowing researchers to estimate influenza-
attributable ‘‘excess’’ deaths in broad categories such as pneumo-
nia, respiratory, or cardiorespiratory deaths during influenza
periods. The influenza-related excess in respiratory deaths can be
measured with higher precision than the less specific all-cause and
cardiorespiratory categories. However, because some deaths
triggered by influenza are recorded as having been caused by
underlying non-respiratory causes such as heart attack, stroke,
diabetes, or chronic kidney conditions, analysis of the broader
cardiorespiratory and all-cause categories typically captures more
completely the influenza-related burden.
The majority of deaths from seasonal influenza occur among
people aged 65 y or older, but in a pandemic the proportion of
deaths among the young increases [4,6–8]. Single-country studies
of H1N1pdm09 mortality, using various cause-of-death outcomes
and modeling techniques [9–14], have repeatedly documented
such an age shift. For example, a comprehensive hospital-based
sentinel surveillance study by Liang and colleagues found that in
China only 4% of cases, 8% of hospitalizations, and 23% of
pandemic deaths occurred in persons over 50 y of age [15]. On a
global level, Van Kerkhove et al. reported a median age of 46 y
among fatal laboratory-confirmed cases [16]. McCallum et al.
reported that in the Western Pacific region during 2009, only 1%
of laboratory-confirmed cases and 13% of laboratory-confirmed
deaths were among persons 65 y of age or older [17].
The Global Pandemic Mortality (GLaMOR) project aimed to
make a conservative estimate of the global H1N1pdm09 mortality
burden in 2009 using statistical models applied to mortality,
virology, and other available data. The project was funded by
WHO, which requested global and regional estimates of
H1N1pdm09 influenza deaths for the year 2009; thus, all
mentions of pandemic flu mortality refer specifically to deaths
that occurred in the last 9 mo of 2009. We invited global
collaborators to contribute national mortality data detailed by
week, age, and cause of death for 2005 through 2009, at
minimum.
Our novel method was inspired by a study that estimated the
1918–1920 global pandemic mortality burden using a two-stage
statistical approach [18]. In Stage 1, we used detailed time series of
national mortality and virology data from collaborating teams to
estimate the 2009 pandemic respiratory mortality in each
collaborating country/administrative region. Each participating
GLaMOR team included influenza experts with whom the core
GLaMOR team discussed Stage 1 mortality estimates in detail.
The Stage 1 model and results were made available to each
collaborating team to encourage individual country publications of
national burden estimates. In Stage 2, we used a hierarchical
multiple imputation model that used geographical, economic, and
health country indicators to project the Stage 1 single-country
estimates to all world countries, and summed to obtain regional
and world estimates (Figure S2) .
A previous study of global H1N1pdm09 mortality, published in
2012 by Dawood et al. [19], was conducted before 2009 mortality
data became available. To overcome that problem, these authors
implemented a probability model that took into account symp-
tomatic attack rates and case fatality ratios measured in a set of
wealthier countries, then used a ‘‘respiratory mortality multiplier’’
based on pre-2009 data to adjust for differences in respiratory
disease fatality rates in different parts of the world. In contrast, we
used national vital statistics data for 2009 to measure the actual
pandemic mortality and its age patterns in countries representing
,35% of the global population, then estimated the burden in the
remaining countries using a novel projection method. As a result,
while our global burden estimate is comparable to that of Dawood
et al. [19], the regional pattern we found, with the Americas hit
hard and Europe largely spared, corresponds more closely to what
was reported as the pandemic unfolded. In addition, our method
simultaneously generates pre-pandemic global seasonal influenza
mortality estimates that we have presented here for comparison.
Methods
Data Sources and PreparationWe obtained weekly virology data from the WHO FluNet [20]
to identify influenza active periods (some collaborators provided
more detailed virology data). We created 3-wk moving averages of
these data with a lag of 1 wk, to achieve the clinically observed lag
of 1 wk from disease onset to death. We inspected the data for
weeks in which the reported count dropped dramatically
coincident with a major holiday; in three cases (Spain, Mexico,
and Japan) we replaced the reported number with the average of
positive counts in the two surrounding weeks. In most cases we
encountered insufficient subtyping of influenza A viruses. Age-
specific virology data were not available.
We requested weekly national mortality time series based on the
‘‘underlying’’ cause-of-death determination from 1 January 2005
to 31 December 2009, stratified by at least two age groups (,65
and $65 y) and by four International Classification of Diseases–10
(ICD-10)–coded outcomes: all causes, cardiorespiratory (J and I
codes), respiratory (J codes), and pneumonia and influenza (codes
J10–J18) (Table 1). Contributing countries/administrative zones
represented ,35% of the global population. To prepare the time
series mortality data for modeling, we created 3-wk moving
2009 H1N1pdm Global Influenza Pandemic Mortality
PLOS Medicine | www.plosmedicine.org 2 November 2013 | Volume 10 | Issue 11 | e1001558

averages after removing data in affected countries from summer
weeks with a documented heat wave or armed conflict with
significant mortality. We de-trended the time series using a spline
factor modeled from summer periods. The exclusions and summer
periods are given in Table 2. We obtained age distribution data for
H1N1pdm09 laboratory-confirmed deaths from collaborators in a
subset of GLaMOR countries. Because of concerns about sharing
data, collaborators in the UK and China ran the GLaMOR SAS
code on their own data. As only aggregate (de-identified) national
summary mortality data were used in this study, it was exempt
from human subjects regulations.
When choosing which outcome to use as our primary estimate
of mortality, we had to make a trade-off between sensitivity and
specificity while maintaining sufficient precision. Modeling all-
cause mortality data would by definition ensure that all deaths are
captured (100% sensitivity), but would sacrifice specificity and
therefore precision. At the other extreme, pneumonia and
influenza (P&I) is a specific influenza outcome but captures only
a fraction of total pandemic deaths.
After much deliberation and advice from the Ad Hoc Advisory
Committee on H1N1pdm09 Mortality Estimates [21], we focused
on respiratory deaths in order to provide a minimum estimate of
pandemic mortality burden with reasonable confidence limits.
This was necessary as we had found that it was difficult to tease out
any influenza-attributable increase in all-cause mortality in most
countries.
Table 1. Participating countries for which GLaMOR estimated all-cause, cardiorespiratory, or respiratory pandemic-associatedmortality (Stage 1) or which were used to evaluate performance of global projection methods (Stage 2).
WHO Region (Number ofCountries) Country Income Levela Data Years Outcomeb Detailc Virology Source
Percent WorldPopulation
Countries for which GLaMOR made all-cause, cardiorespiratory, or respiratory Stage 1 estimates
Africa (1) South Africa Upper middle 2003–2009 AC,CR,R Monthly FluNet 0.7
Eastern Mediterranean (0)
Europe (9) Denmark High 1998–2009 AC Weekly FluNet 0.1
Israel High 2004–2009 AC,CR,Rd Weekly Israel 0.1
France High 1998–2009 AC,CR,R Weekly FluNet 0.9
Germany High 1998–2009 AC,CR,R Weekly Germany 1.3
Poland Upper middle 2003–2009 AC,CR,R Weekly FluNet 0.4
Romania Upper middle 2005–2009 AC,CR,R Weekly EuroFlu 0.3
Slovenia High 2003–2009 AC,CR,R Weekly FluNet 0.1
Spain High 2000–2009 AC,CR,R Weekly Spain 0.7
UK High 2000–2009 AC,CR,R Weekly UK 0.9
Americas (4) Argentina Upper middle 2001–2009 AC,CR,R Monthly FluNet 0.6
Chile Upper middle 2002–2009 AC,CR,R Weekly FluNet 0.2
Mexico Upper middle 2000–2009 AC,CR,R Weekly FluNet 1.6
US High 2000–2009 AC,CR,R Weekly FluNet 4.6
South-East Asia (0)
Western Pacific (7) Australia High 2003–2009 AC,CR,R Weekly FluNet 0.3
Chinae Lower middle 2004–2009 AC,CR,R Weekly China 19.5
Hong Kong High 1999–2009 AC,CR,R Weekly Hong Kong 0.1
Japan High 1998–2009 AC,CR,R Weekly FluNet 1.9
New Zealand High 2000–2009 AC,CR,R Weekly FluNet 0.1
Republic of Korea High 2003–2009 CR,R Weekly FluNet 0.7
Singapore High 2007–2009 CR,R Weekly Singapore, FluNet 0.1
Validation countries to evaluate performance of Stage 2 projection methods
Americas (3) Brazil Upper middle NA R Weekly NA 2.8
Canada High NA R Weekly Canada 0.5
Peru Upper middle NA R Monthly Peru 0.4
Europe (1) Netherlandsf High NA R Weekly Netherlands 0.2
South-East Asia (1) Bangladeshg Low NA R NA Bangladesh 2.1
aIncome level in 2009 [28].bUnderlying cause of mortality: AC, all cause; CR, cardiorespiratory (ICD-10 I and J codes); R, respiratory (ICD-10 J codes).cStandard request was for age groupings: 0–4, 5–14, 15–44, 45–64, 65–84, and $85 y of age.dDid not include influenza with pneumonia.eData from multiple surveillance settings representing rural and urban areas across China [14].fRespiratory mortality estimated by Netherlands team based on estimated all-cause pandemic mortality [13].gRespiratory mortality estimated by Bangladesh team using a novel method combining virology surveillance and verbal autopsy data [45].NA, not available.doi:10.1371/journal.pmed.1001558.t001
2009 H1N1pdm Global Influenza Pandemic Mortality
PLOS Medicine | www.plosmedicine.org 3 November 2013 | Volume 10 | Issue 11 | e1001558
Stage 1: Single-Country Pandemic Mortality EstimatesWe developed a multivariate linear regression model of influenza
burden based on correlations between laboratory surveillance and
national mortality data [22–25]. The model included virology
surveillance time series data, as well as terms for linear, square,
cubic, and cyclical secular trends. We applied the same model form
to each country. Where possible, the analysis was performed for four
different mortality outcomes: all-cause deaths, respiratory and
cardiovascular deaths, respiratory deaths, and deaths due to
pneumonia and influenza. Data collection was carried out between
1 July 2011 and 31 March 2012. Stage 1 estimates were comparable
in that we used standard ICD-10 definitions of mortality outcomes
for each cause and applied the same multivariable linear regression
model. We made estimates of respiratory and cardiorespiratory
mortality for 20 countries, and estimates of all-cause mortality for 19
countries. Only estimates made with the GLaMOR model were
used in the Stage 2 projections.
The GLaMOR Stage 1 model form was:
Outcome tð Þ~b0zb1tzb2t2zb3t3zb4sin 2pt=52ð Þ
zb5cos 2pt=52ð Þzb6sin 2pt=26ð Þ
zb7cos 2pt=26ð Þzb8 influenza B t½ �ð Þ
zb9 pH1N1 t½ �ð Þzb s1ð Þ influenza A s1½ � t½ �ð Þ
z . . . zb snð Þ influenza A sn½ � t½ �ð Þzet
ð1Þ
where t is the running week variable, and the linear and
polynomial terms track remaining secular trends. The cyclical
terms (as whole- and half-year cycles) tracked seasonal mortality
patterns from other respiratory pathogens and factors such as
temperature and relative humidity. Each influenza A season had
its own variable, which we set to 0 in all other seasons. This way,
case fatality in individual seasons is allowed to vary. Models of this
type usually use separate terms for influenza A subtypes because
the mortality burden of H3N2 is known to be far greater than that
of seasonal H1N1; however, because adequate subtyped labora-
tory surveillance data were not available from many Stage 1
countries, we instead introduced into the model separate influenza
A terms for each season. Collaborators supplied data for a variable
number of seasons (s1 to sn), with b(s1) to b(sn) the respective
coefficients. Most collaborators supplied five seasons; thus, the
model had ,14 explanatory factors and ,250 observed data
points for most countries. The H1N1pdm09 season was defined as
the weeks beginning 5 April through 27 December 2009, inclusive.
For Hong Kong, Japan, and South Africa, where H3N2 co-
circulated with the pandemic virus, we included separate time
series of H1N1pdm09 and H3N2 samples during the pandemic
period. We did not remove nonsignificant terms from the model.
Because of a lack of respiratory syncytial virus virology data, we
did not control for respiratory syncytial virus co-circulation.
We computed the pandemic attributions as the sums of the
products of the pandemic model parameter b9 multiplied by the
H1N1pdm09 positive count. When negative parameter values
were obtained, mortality burden estimates were set to zero (as
negative burden is not biologically meaningful). The confidence
intervals were derived from uncertainty on the pandemic model
parameter estimate b9. We determined the Stage 1 95%
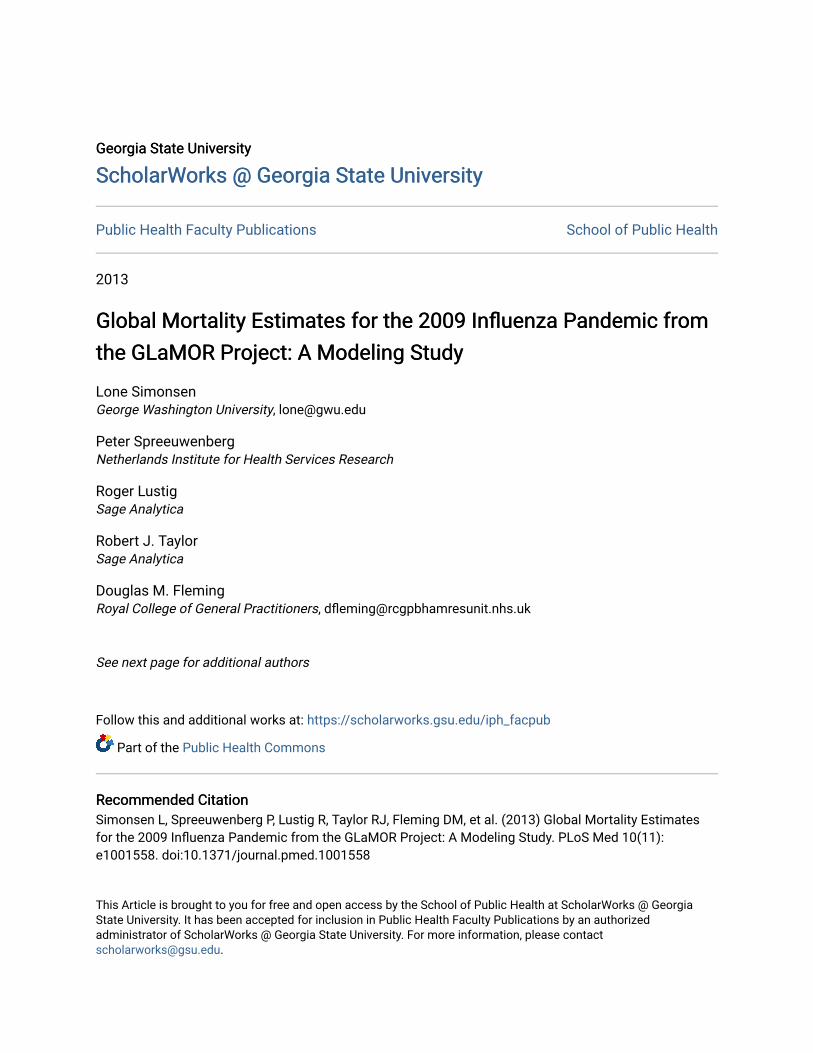
Table 2. Stage 1 customizations and all-ages model fit for 20 GLaMOR participating countries.
Country ExclusionsSummer Definition (WeekNumbers)
Secular ModelFit (R2) Full Model Fit (R2)
PandemicParameter p-Value
Argentina None 1–10,45–52 0.8290 0.9301 ,0.0001
Australia None 1–18,46–52 0.8657 0.9098 0.1206
Chile None 1–17,42–52 0.7032 0.9128 ,0.0001
China None — — — ,0.0001
France Heat wavess May–Sep 0.6989 0.8830 0.3836
Germany Heat wavess 19–45 0.6684 0.9196 0.2918
Hong Kong None None 0.6098 0.7266 ,0.0001
Israel 2006 Lebanese war 15–42 0.6832 0.9246 0.2718
Japan None 27–40 0.7926 0.8813 0.0527
Mexico None Jun–Aug 0.7497 0.8500 ,0.0001
New Zealand None 1–19,43–52 0.7122 0.8320 0.0176
Poland None 18–41 0.7096 0.8660 0.1634
Republic of Korea None 23–43 0.6739 0.8320 0.0749
Romania None 19–45 0.8047 0.8738 0.0054
Singapore None None 0.5306 0.6676 0.3705
Slovenia None 17–44 0.5101 0.7270 0.4362
South Africa None 1–14,39–52 0.8193 0.9254 ,0.0001
Spain Heat wavesa 21–39 0.6640 0.8973 0.8243
UK None NA 0.7190 0.8756 0.1505
US None 23–39 0.8086 0.9408 ,0.0001
aEurope experienced severe heat waves in 2003 and 2006; hence, summer weeks with elevated mortality were excluded.NA, not available.doi:10.1371/journal.pmed.1001558.t002
2009 H1N1pdm Global Influenza Pandemic Mortality
PLOS Medicine | www.plosmedicine.org 4 November 2013 | Volume 10 | Issue 11 | e1001558

confidence intervals from the standard error on the H1N1pdm09
parameter estimate. We did not address autocorrelation in the
residuals, and therefore the confidence intervals are narrow. We
evaluated the model fit by three criteria: (1) the adjusted R2 for
the full model, (2) the ‘‘lift’’ achieved by adding the virology terms
to a base model of only secular and cyclical terms, and (3) the
significance of the pandemic term b9 in the model. We used SAS
9.2 for all Stage 1 analyses.
Choosing among Four Stage 2 Global ProjectionStrategies
We explored four strategies to project our single-country
estimates to the rest of the world before settling on multiple
imputation, a Monte Carlo method that imputes values to missing
data points and is often used to supply missing values in survey and
census data [26].
1. Survey method. The survey method was a direct
extrapolation of the average Stage 1 pandemic mortality rates
using bootstrapping, in which the average excess mortality rate
and upper and lower 95% confidence levels were used to calculate
the global numbers and rates of pandemic deaths by age group
and WHO region.
The limitation of this method is that it assumes that the average
pandemic mortality experience in the Stage 1 countries is
representative of the experience in all countries, and gives only a
global estimate (no country- or region-specific estimates).
2. Gross national income/latitude method. The gross
national income (GNI)/latitude method was derived from the
method Murray et al. employed to estimate the 1918 global
pandemic burden [18]. Influenza-attributable mortality was based
on the relationship between measured pandemic mortality and per
capita GNI and geographical latitude. Ordinary least squares
regression models were used to relate the Stage 1 estimates to GNI
and absolute latitude after natural logarithmic transformation of
GNI and the dependent variable. The relationship was then used
to estimate mortality in all world countries.
The limitation of this method is that the model assumes that
GNI and latitude are sufficient proxies for the many variables that
influence influenza mortality, and that mortality and the reasons
for its variability in Stage 1 countries are representative for all
countries. Importantly, there was an assumption that the
relationship between GNI and excess mortality is exponential, so
that the method yields very high mortality rates for low-income
countries (e.g., countries in Africa).
3. Matching method. The matching method was devised by
the GLaMOR team. It obtains the missing data points by
matching (as closely as possible) Stage 1 countries to non–Stage 1
countries based on a set of country indicators. It involves two steps:
(1) a data creation step using the matching approach, and (2) a
data analysis step where a hierarchical linear random effects model
is used to provide a single estimate for each country.
The data creation step involves calculation of multiple estimates
per country based on the indicators listed in Table 3. We chose
these indicators because they could reasonably be expected to
affect pandemic mortality and were available for all countries in
the world from public domain sources [27–30]. WHO region and
latitude reflect the differing epidemiology of seasonal influenza in
the differing regions of the world. Age group all-cause mortality
rates, population density, physician density, and rural population
percent reflect both the access to health care and the likelihood of
influenza transmission. Population age structure reflects the
documented age-related impact of influenza virus infections. The
prevalence of comorbidities (i.e., obesity, HIV, and tuberculosis) is
likely to be correlated with a greater probability of a severe
outcome of influenza infection. The mortality estimates in the
Stage 1 countries were examined and matched, for each indicator,
to countries in which the mortality was not known.
Figure 1 illustrates the matching procedure for an example
country (Country Y) and three example indicators.
The data analysis step of the matching method is similar to that
of the multiple imputation method (below), with the same
hierarchical linear random effects model but with the imputed
datasets replaced by the matched datasets.
4. Multiple imputation method. We chose this method to
make our Stage 2 extrapolations. Like the matching method, the
multiple imputation method involves two steps, a data creation
step followed by a hierarchical regression modeling step to project
the burden in all world countries.
In the data creation step, we used statistical correlations
between the same set of country indicators that we used in the
matching method (Table 3) and all the Stage 1 mortality estimates
to create a distribution of possible mortality values for each
unknown country in the world. We then chose a random sample of
20 possible values from each country’s distribution for further
analysis. Because each Stage 1 point estimate was associated with
uncertainty, we repeated the data creation step for each of the
Stage 1 lower and upper 95% CI bounds. Thus, the final analysis
dataset contained 60 estimates per country.
In the analysis step, we applied a hierarchical linear random
effects regression model [31] to the final dataset to generate a point
estimate (with standard error) for each country [32,33]. We
calculated the Stage 2 mortality rates (and their confidence intervals)
simultaneously (i.e., in one model) for each country, each region,
and the entire globe. The procedure was undertaken for persons of
all ages and separately for persons ,65 y. The model used was
Yij~b0zX6
r~1
brXzXn
f ~1
bf XzmjzXn
f ~1
ef ð2Þ
where
Y = imputed individual rate
i = individual measurement
j = country (1 … 197)
mj = between-country variance; mj,N(0, t2j )
ef = error variance for factor/imputed dataset, normally distrib-
uted; mf,N(0, t2f )
r = WHO region (1 … 7); coding (r = 1…6), ([0,1]21)/6; r = 7,
countries not belonging to a region (1 if r = 7, else 0)
f = imputed datasets (1 … 20); coding ([0,1]21)/n; n = number
of factors or datasets
Estimated rates were then given by:
World = b0
WHO region = b0+br
Country = b0+br+mj
Statistical 95% confidence intervals for these estimates were
calculated using standard methods. We performed the imputation
procedures with the Amelia II software package [34], and used the
MLwiN version 2.1 package for the analysis model [35].
We evaluated the performance of each of the four candidate
Stage 2 methods. We rejected the survey method because the
results could not show regional variation, a major disadvantage
given that the Stage 1 results showed considerable variation
among the regions. We rejected the GNI/latitude method for two
reasons. First, the estimates for our validation countries did not
match the validation estimates the method produced (Table 4).
Second, GNI and latitude did not result in statistically significant
coefficients.
2009 H1N1pdm Global Influenza Pandemic Mortality
PLOS Medicine | www.plosmedicine.org 5 November 2013 | Volume 10 | Issue 11 | e1001558

Choosing between Matching and Multiple ImputationAfter eliminating the first two methods, only the matching and
the multiple imputation methods remained. We first compared the
multiple imputation and matching data creation steps for a single
country in each WHO region. The results (Figure 2) demonstrate
that each method produces a range of values and provides an
indication of the uncertainty of the actual value. We then applied
the following validation criteria to choose between the two.1. Reliability coefficients. Reliability, or internal consis-
tency, is an important consideration. The reliability coefficient
ranges from 0 to 1 (zero indicates no systematic effect) [36]. A
value of 0.8 or higher indicates good (high) reliability. For the
multiple imputation method the reliability coefficient for
respiratory mortality was 0.78 for all ages and 0.87 for people
,65 y. For the matching method the corresponding values were
0.94 and 0.96, respectively. It is important to realize, however,
that this indicates only that both models had sufficient
information to capture the country differences in a statistically
reliable way, with no indication that one method performed
better than the other.
2. Stage 1 versus Stage 2 estimates. We assessed the
difference between the Stage 2 single-country estimates obtained
with the matching and multiple imputation methods and the
original Stage 1 estimates. The differences, expressed as standard
deviations, were smaller for the multiple imputation method.
3. Lab-confirmed deaths as a minimum ground
truth. We compared the Stage 2 estimates to country reports
of the number of laboratory-confirmed H1N1pdm09 deaths
(Table S1; data available for 67 countries until 31 December
2009). The GLaMOR estimates should logically be higher than
the total number of laboratory-confirmed deaths in each country.
Both models performed well, and the test indicated that both
models had sufficient information to capture differences between
countries in a statistically reliable way.
Figure 1. Schematic illustration of the matching method based on country indicators. BMI, body mass index; Resp. disease, respiratorydisease.doi:10.1371/journal.pmed.1001558.g001
2009 H1N1pdm Global Influenza Pandemic Mortality
PLOS Medicine | www.plosmedicine.org 6 November 2013 | Volume 10 | Issue 11 | e1001558
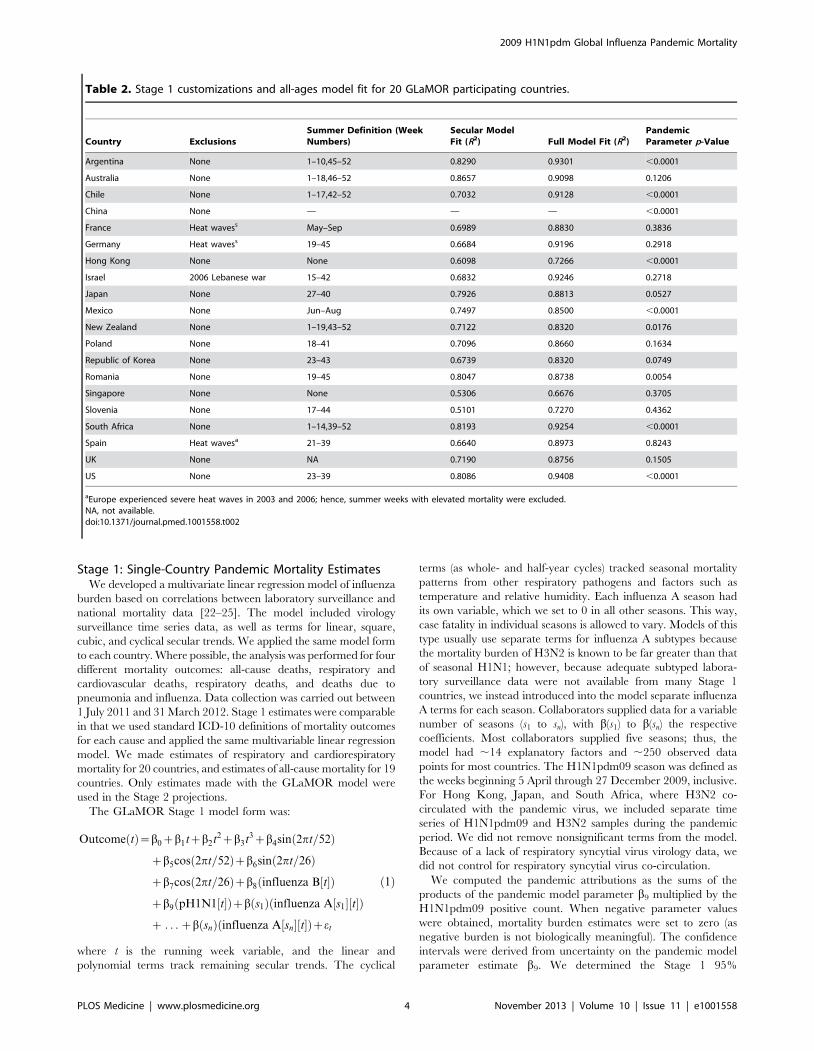
4. Distribution of the predicted Stage 2 estimates. We
compared the highest and lowest 20% of national estimates (both
for all ages and for persons ,65 y of age) derived from the
multiple imputation and matching methods. For all ages, the
matching method distributes the highest burden over Africa and
the Americas, with 88% of the countries in the highest quintile in
the Americas and 18% in Africa. The multiple imputation method
distributes the highest burden not only over the Americas and
Africa, but also over South-East Asia. As we have no Stage 1
estimates for South-East-Asia and only one for Africa, we cannot
be sure which method is better, and this test was inconclusive.
5. Comparison to five GLaMOR validation estimates. Five
of the 26 Stage 1 countries (Bangladesh, Brazil, Canada, Peru, and
the Netherlands) could not be analyzed with the GLaMOR Stage 1
model for various reasons. Country collaborators in Bangladesh and
Canada had each generated estimates using their own methods, as
national vital statistics could not be provided. For Brazil and Peru the
virological data did not align with pneumonia pandemic mortality
spikes (see also Schuck-Paim et al. [12]); instead we applied a classical
Serfling model to regional data, which does not require virology data
(similar to the approach used by Charu et al. [9]). For the
Netherlands, the GLaMOR H1N1pdm09 estimates were substan-
tially lower than those generated by the country collaborators [13].
We ran both their and our model on respiratory mortality data and
found that the GLaMOR estimates were negative for the elderly, and
that the upper 95% confidence interval on the all-age estimate
excluded the number of laboratory-confirmed deaths. However, the
Dutch model placed most H1N1pdm09 deaths in seniors ($65 y),
which was in disagreement with the age distribution in the Dutch
laboratory-confirmed mortality data. Unable to reconcile these
discrepancies, we accepted the country collaborators’ preference for
their own model results. These five country estimates (based on
alternative modeling strategies) were used only to validate the Stage 2
projections. The multiple imputation method estimates were more
often closer to the independent national estimates than the matching
method estimates were (Table 4).
Multiple Imputation Method ChosenThe validation tests for the most part yielded only small differences
between the multiple imputation and matching methods. We selected
the multiple imputation method because it produced estimates that
were more consistent with those generated by country collaborators
in the five GLaMOR validation countries than the estimates
produced by the matching method, and because multiple imputation
is an established method while the matching method was one we
developed. The choice of multiple imputation had two important
consequences: it resulted in systematically higher country mortality
rates compared to the matching method, and it placed a higher
burden in people aged 65 y and over, especially in Asia and Africa.
Global Seasonal Burden EstimatesWe computed the average global seasonal influenza burden
(type A plus type B) for the years immediately prior to the
pandemic. Specifically, we calculated the average pre-pandemic
seasonal influenza mortality for each Stage 1 country using model
parameter values from each pre-pandemic season, then projected
these estimates to global and regional values using our Stage 2
multiple imputation procedure (Table S4). The number of pre-
pandemic seasons available to us from each country was variable,
and we made no attempt to control for differences in influenza
type or subtype dominance.
Calculating All-Age MortalityBecause of large background mortality in the elderly, it was
difficult to measure all-age influenza-related mortality with
precision in lower-burden countries. For example, in some
European countries the H1N1pdm09 mortality impact was so
subtle that the model applied to all-age time series produced a
Figure 2. Output of the data creation phase for multipleimputation and matching for one randomly selected countryper region. Eastern Med, Eastern Mediterranean; Imp, multipleimputation method; Match, matching method.doi:10.1371/journal.pmed.1001558.g002
Table 3. Country indicators used as factors in the Stage 2 model that projects the measured Stage 1 pandemic and seasonalinfluenza mortality estimates to global and regional estimates.
Indicator Number Indicator
1 WHO region (Africa, the Americas, Eastern Mediterranean, Europe, South-East Asia, Western Pacific)
2 Age group all-cause mortality rates (0–14, 15–59, 60+ y) [29]
3 Physician density (per 10,000 population) [27]
4 Obesity (percent with body mass index .30 kg/m2) [27]
5 Population density (per km2) [28]
6 Major infectious diseases (percent HIV and percent tuberculosis prevalence) [28]
7 GNI per capita (US dollars) [27]
8 Rural population (percent) [28]
9 Population age structure: percent ,15 y and .60 y [29]
10 Latitude (absolute value) [30]
doi:10.1371/journal.pmed.1001558.t003
2009 H1N1pdm Global Influenza Pandemic Mortality
PLOS Medicine | www.plosmedicine.org 7 November 2013 | Volume 10 | Issue 11 | e1001558

negative point estimate for the H1N1pdm09 burden, with
confidence intervals that at times excluded the ‘‘ground truth’’
minimum of the reported number of laboratory-confirmed
H1N1pdm09 deaths from that country. Modeling the data for
the ,65-y age group, however, almost always resulted in estimated
H1N1pdm09 mortality rates that were comparable to, or far
higher than, the laboratory-confirmed mortality count.
We therefore elected to generate Stage 2 all-age burden
projections in two ways: one based on Stage 2 all-age estimates,
and the other based on the ,65-y Stage 2 estimates, which we
proportionally projected to all ages using data from laboratory
surveillance indicating that 85% of confirmed H1N1pdm09 deaths
occurred in the younger group (Table S1).
Sensitivity AnalysisWe investigated the sensitivity of our global Stage 2 burden
estimates to changes in the Stage 1 sample by successively
removing one Stage 1 country from the Stage 2 input dataset and
rerunning the Stage 2 model. Because the range from this analysis
was always wider than the 95% confidence intervals derived from
the Stage 1 and 2 statistical procedures, we chose to report this
range as a more realistic view of the uncertainty (see Table 5; the
statistical 95% CIs can be found in Tables S2 and S3).
Results
Stage 1 FindingsThe GLaMOR Stage 1 countries experienced one to three
pandemic waves during 2009. Most H1N1pdm09 deaths occurred
in winter months: November–December in the northern hemi-
sphere and July–August in the southern hemisphere. Several Asian
countries experienced an H3N2 epidemic in the months imme-
diately before their major H1N1pdm09 wave.
Figure 3 shows Stage 1 country H1N1pdm09 mortality rates per
100,000 population with 95% confidence intervals. The model fit
(adjusted R2) for Stage 1 respiratory mortality estimates among
people ,65 y was generally excellent (80%–90%), and the ‘‘lift’’
upon introducing the influenza virus explanatory components into
the base secular model was substantial (Table 2). The pandemic
burden varied considerably between countries. For countries
where the burden was high, the Stage 1 model could easily
separate the pandemic signal from the background noise. But
where the burden was low, the H1N1pdm09 mortality point
estimates became unreliable.
The various outcomes and age stratifications each provided a
different balance between sensitivity and specificity. In high-
burden countries such as Mexico and Argentina, the pandemic
impact could be modeled with precision even for all-age time series
of all-cause and cardiorespiratory mortality outcomes, as evi-
denced by tight 95% confidence intervals and agreement with a
published Mexico study using a different Serfling regression
modeling approach [9]. But in lower-burden countries, such as
France and Germany, we could estimate a significant
H1N1pdm09 mortality attribution only in persons ,65 y and
for respiratory deaths; Figure 4 illustrates the burdens in Mexico
and France. Furthermore, for multiple countries we could not
obtain a good model fit for finer age groups (e.g., ,5, 5–14, 15–
44, and 45–64 y) because of the small and fluctuating numbers of
weekly deaths. We therefore chose to focus the global analysis on
respiratory mortality among persons ,65 y and $65 y, summing
these point estimates to arrive at the all-age estimates.
Overall, Stage 1 respiratory mortality rates were consistently
higher in the Americas, with the highest measurements in Central
and South American countries. South Africa’s pandemic burden
was moderate and on par with that of the US and China,
suggesting that Africa may have experienced a lower pandemic
burden than Central and South America. In Europe, the
pandemic burden was generally low and on par with national
numbers of laboratory-confirmed H1N1pdm09 deaths. Spain,
France, and Germany averaged a rate of just 0.3/100,000, while
Romania, the lowest-income European country included in this
study, felt an approximately 6-fold greater impact. In South and
Table 4. External validation of GLaMOR Stage 2 projections for pandemic respiratory deaths, comparing GLaMOR Stage 2projections for each projection method to five single-entity estimates made by collaborators using methods other than theGLaMOR regression model.
Country Source Estimate 95% CI Projection Method
MatchingMultipleImputation GNI/Latitude Survey
All ages
Bangladesh Verbal autopsy [45] 4.0 NA 2.1 4.0* 0.4 2.0
Brazil GLaMOR; Serfling 4.3 NA 2.8 3.5* 0.1 2.0
Canada Lab-confirmed deaths [53] 2.1 1.6–2.6 1.8* 3.1 1.0 2.0
Netherlands Poisson regression [13] 0.9 0.3–1.5 0.9* 0.9* 0.7 2.0
Peru GLaMOR; Serfling 6.8 NA 2.5 3.6* 0.1 2.0
Under 65 y
Bangladesh Verbal autopsy [45] 3.0 1.6–3 1.2 1.8* 2.6 1.2
Brazil GLaMOR; Serfling 3.1 NA 2.0 2.5* 0.6 1.2
Canada Lab-confirmed deaths [53] 1.1 0.9–1.3 1.1* 2.0 0.7 1.2
Netherlands Poisson regression [13] 0.2 0.2–0.4 0.5* 0.9 0.6 1.2
Peru GLaMOR; Serfling 5.2 NA 1.4 2.5* 0.5 1.2
The asterisk indicates for each country and category which of the four tested Stage 2 methods was in best agreement.NA, not available.doi:10.1371/journal.pmed.1001558.t004
2009 H1N1pdm Global Influenza Pandemic Mortality
PLOS Medicine | www.plosmedicine.org 8 November 2013 | Volume 10 | Issue 11 | e1001558

Central America, however, we did not find a consistent
relationship between H1N1pdm09 mortality and country income
group: Argentina and Mexico had particularly high pandemic
death rates (,5/100,000), whereas Chile, a country with a similar
economy, had a pandemic death rate that was more than 3-fold
lower.
Across all Stage 1 countries, the model placed an average of
66% of respiratory pandemic deaths in persons ,65 y. However,
that proportion varied widely, from 100% in several European
countries, to 70%–90% in Argentina and Mexico, to less than
10% in Hong Kong and Japan. Our Stage 1 estimates for seniors
($65 y) were considerably more uncertain than those for the ,65-
y age group; this was due in part to the difficulty in precisely
measuring the small H1N1pdm09 burden in seniors against their
high background mortality, and partly because Hong Kong and
Japan were outliers with a far higher burden among seniors than
all the other countries.
In the few high-burden countries where we could measure Stage
1 all-cause mortality with confidence (e.g., Argentina and Mexico),
the ratio of all-cause to respiratory mortality ranged from 1.6 to 2.3.
Stage 2 Global ProjectionsUsing the Stage 1 model results for all ages (sum of ,65-y and
$65-y age group estimates) as input, the Stage 2 model projected a
global pandemic respiratory mortality during 2009 of 189,000
(range, 175,000–203,000) deaths. These estimates correspond to an
incidence rate of 2.77 (range, 2.57–2.98) per 100,000 population.
Globally, 62% of these deaths were estimated to occur in persons
,65 y, varying from 41% to 75% among WHO regions.
Because the pandemic virus caused considerable excess mortality
in the ,65-y age group, Stage 1 estimates for this age group were
more reliable. To take advantage of that greater reliability, we
computed the Stage 2 global and regional projections based on
these estimates alone, by adjusting the ,65-y estimates to all ages.
To accomplish this we compiled data on the age distribution of
laboratory-confirmed H1N1pdm09 deaths from mortality surveil-
lance efforts in seven countries; these data indicated that an average
of 85% of all pandemic deaths occurred in persons ,65 y (Table
S1). This alternative approach yielded a lower global pandemic
respiratory mortality of 138,000 deaths (range, 123,000–155,000).
Table 5 shows the estimated numbers of global and regional deaths
obtained by both methods; mortality rates and 95% confidence
intervals are given in Tables S2 and S3.
We found substantial regional heterogeneity in H1N1pdm09
mortality rates (Figure 5). The regional patterns observed among
Stage 1 countries were borne out in the Stage 2 estimates, with
high rates in the Americas and low rates in Europe.
In the sensitivity analysis in which one Stage 1 country at a time
was removed from the Stage 2 analysis, the global H1N1pdm09
mortality estimates were stable, with all-age point estimates
ranging from 2.6 to 3.0 per 100,000 population from all-ages
data (Figure 6A) and 1.7 to 2.1 per 100,000 from ,65-y age group
data (Figure 6B). However, regional estimates were more sensitive
to the removal of individual countries, reflecting the importance of
inclusion or exclusion of countries with ‘‘outlier’’ Stage 1
measurements such as Mexico and Chile in the Americas and
Hong Kong in the South-East Asia region.
Seasonal Influenza Mortality EstimatesWe generated an estimate of the average global seasonal
influenza mortality burden, based on Stage 1 average seasonal
Table 5. Global and regional GLaMOR Stage 2 projections of pandemic respiratory mortality, where all age estimates were derivedboth from Stage 1 all-age estimates and from the ,65-y age group results adjust to 100% using the laboratory-confirmed mortalitysurveillance age distribution.
Region ,65 y, Stage 1 All Ages, Stage 1 All Ages (from Stage 1 ,65 y)a
Estimate Rangeb Estimate Rangeb Estimate Rangeb
World 117,130 104,450–132,080 188,660 175,280–203,250 137,800 122,882–155,388
Africa 17,922 15,408–21,172 25,476 22,431–28,447 21,085 18,127–24,908
Eastern Mediterranean 11,108 10,092–12,564 14,911 13,592–17,718 13,068 11,873–14,781
Europe 8,463 6,686–8,894 11,223 10,557–13,883 9,956 7,866–10,464
Americas 22,975 20,768–28,328 35,298 29,107–38,461 27,029 24,433–33,327
South-East Asia 30,412 25,829–36,861 73,449 50,012–83,346 35,779 30,387–43,366
Western Pacific 20,179 17,023–25,259 30,554 28,427–41,862 23,740 20,027–29,716
aCalculated assuming 85% of all deaths occurred among persons ,65 y, as was the case with laboratory-confirmed pandemic deaths identified in seven countries; seeTable S1.bThe confidence range was derived from a sensitivity analysis in which we successively removed one Stage 1 county at a time from the Stage 2 input set andrecalculated the global and regional burden.doi:10.1371/journal.pmed.1001558.t005
Figure 3. Pandemic excess mortality estimates for Stage 1countries, by age and outcome (respiratory, cardiorespiratory,and all cause). Data are grouped into four geographical regions.doi:10.1371/journal.pmed.1001558.g003
2009 H1N1pdm Global Influenza Pandemic Mortality
PLOS Medicine | www.plosmedicine.org 9 November 2013 | Volume 10 | Issue 11 | e1001558

influenza attributions across the pre-pandemic period. The Stage 2
multiple imputation method projected a global seasonal influenza
burden of 210,000 influenza-related respiratory deaths per
influenza season; of these only 19% occurred in persons ,65 y
of age. The range of seasonal influenza mortality estimates in the
sensitivity analysis (148,000 to 249,000 deaths per year) was again
wider than the 95% confidence intervals; thus we believe the range
to be a better measure of uncertainty. The effect of removing
individual Stage 1 countries on the seasonal influenza mortality
estimates was more pronounced than for the pandemic estimates
(Figure S1). Figure 7 shows the marked age shift in global and
regional pandemic mortality burden toward persons aged ,65 y.
Discussion
Our analysis suggests that between 123,000 and 203,000
H1N1pdm09 respiratory deaths occurred globally in 2009. This
range is derived from the all-age burden computed in two different
ways: the higher figure is the upper bound of the all-age Stage 2
projection as given by the sensitivity analysis, while the lower
estimate is the lower sensitivity analysis bound of the more reliable
,65-y age group estimate projected to all ages.
That range places H1N1pdm09 mortality below that of
previous influenza pandemics, which varied from ,1 million
deaths in 1968 to ,50 million deaths in 1918 [37]. But the
majority (62%–85%) of the H1N1pdm09 deaths occurred among
persons under 65 y of age, compared to only 19% of the 148,000
to 249,000 seasonal influenza respiratory deaths per season. It is
this ‘‘signature age shift’’ that sets pandemic influenza apart from
seasonal influenza [4,6,38,39]. The severity of the 2009 pandemic
would therefore be better measured with more complex metrics,
such as life-years lost [8], when the necessary age- and risk-
stratified mortality data become available.
When the H1N1pdm09 virus first emerged, early assessments of
the threat level were mixed. Events in Mexico and Argentina in
April and May 2009 suggested a severe pandemic on par with the
1957 pandemic or worse [40,41], while data from New Zealand
during June through August (their winter season) revealed a mild
mortality impact [42]. By applying the same Stage 1 model form
to comparable mortality data across countries, we documented
that large regional variability did in fact occur: the GLaMOR
Stage 1 estimates revealed an almost 20-fold higher mortality
impact for several countries in the Americas than for New
Zealand, Australia, and most countries in Europe.
Many factors might have contributed to the regional differences
in H1N1pdm09 mortality impact, including the previous influenza
exposure history of the population, use of antiviral drugs, the
number and duration of pandemic waves during 2009, influenza
vaccination coverage in preceding seasons, access to intensive care,
and use of public health mitigation strategies. Use of pandemic
vaccine is not on the list as it became available too late to play a
role in 2009 [43]. One intriguing possibility is that H1N1pdm09
severity might have been exacerbated by recent circulation of
H1N1 viruses distantly related to the pandemic virus. This is
consistent with H1N1 having predominated in the Americas and
H3N2 in Europe in the 2008–2009 season. It is also supported by
a recent study demonstrating enhanced H1N1pdm09 disease in
piglets recently immunized with a genetically distant seasonal
H1N1 vaccine [44].
Our global estimates were in reasonable agreement with those of
Dawood et al. [19], to our knowledge the only other published study
of global mortality from the 2009 pandemic. The GLaMOR
respiratory estimate range fell within Dawood’s ranges of global
respiratory deaths (25th to 75th percentile, 105,700 to 395,600; 5th
to 95th percentile, 39,000 to 1,315,800). However, the two studies
used very different modeling strategies. Dawood et al. collected
Figure 4. Examples of regional heterogeneity in pandemic mortality impact: Mexico (high burden) and France (low burden). InMexico, a substantial H1N1pdm09 respiratory mortality burden (red areas above gray background mortality) occurred among children, young adults,and middle-aged persons (,65 y) of age but not among seniors ($65 y). In France, however, there was a far less dramatic pandemic impact that,despite the similar population size, was captured only in the ,65-y age group model. Seasonal influenza burden (blue areas) was also generated bythe Stage 1 model. The vertical black line represents the start of the pandemic.doi:10.1371/journal.pmed.1001558.g004
2009 H1N1pdm Global Influenza Pandemic Mortality
PLOS Medicine | www.plosmedicine.org 10 November 2013 | Volume 10 | Issue 11 | e1001558

symptomatic attack rates and case fatality rates from a set of high-
income countries, then applied a country-specific ‘‘respiratory
mortality multiplier’’ proportional to the underlying risk of dying
from respiratory diseases in pre-pandemic years.
But at the regional level, the two approaches produced entirely
different patterns (Figure 8). For example, we measured the
highest H1N1pdm09 mortality rates in the Americas, while
Dawood et al. projected low mortality rates there, having set the
‘‘respiratory mortality multiplier’’ to 1 for that region. Further-
more, Dawood et al. projected the highest mortality in Africa,
while our Stage 1 pandemic respiratory estimate for South
Africa—based on actual mortality data from South Africa—was
manyfold lower than Dawood et al.’s. Their projection for India
and South Asia was also high, although a Bangladesh study team
measured a pandemic burden that was not particularly high [45].
Finally, surveillance data indicate that H1N1pdm09 virus activity
was delayed in African countries, so that most H1N1pdm09 deaths
occurred in subsequent years in those countries [46].
Neither Dawood et al. nor our study had many data from Africa
and South-East Asia, however, so what actually happened in these
largely tropical regions remains unclear. However, a recent study
demonstrated that the H1N1pdm09 mortality impact was far greater
in temperate and wealthy southern regions of Brazil than in tropical
and less-wealthy northern regions [12]. This unique insight from one
large country that straddles climate zones suggests that the burden in
the tropics was not necessarily higher than in temperate climates.
Figure 5. Pandemic respiratory mortality rates projected to all world countries with the Stage 2 multiple imputation model,stratified by age. (A) Under 65 y and (B) all ages. Numbers in map legend are pandemic mortality rates per 100,000 persons.doi:10.1371/journal.pmed.1001558.g005
2009 H1N1pdm Global Influenza Pandemic Mortality
PLOS Medicine | www.plosmedicine.org 11 November 2013 | Volume 10 | Issue 11 | e1001558
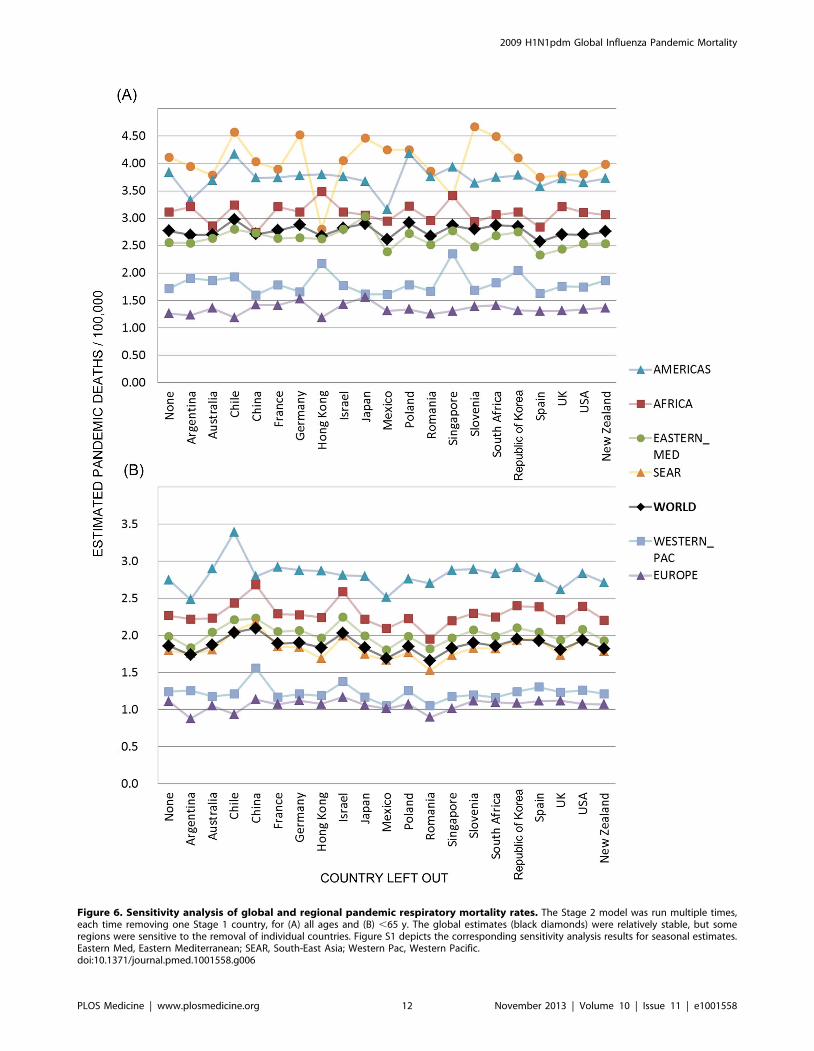
Figure 6. Sensitivity analysis of global and regional pandemic respiratory mortality rates. The Stage 2 model was run multiple times,each time removing one Stage 1 country, for (A) all ages and (B) ,65 y. The global estimates (black diamonds) were relatively stable, but someregions were sensitive to the removal of individual countries. Figure S1 depicts the corresponding sensitivity analysis results for seasonal estimates.Eastern Med, Eastern Mediterranean; SEAR, South-East Asia; Western Pac, Western Pacific.doi:10.1371/journal.pmed.1001558.g006
2009 H1N1pdm Global Influenza Pandemic Mortality
PLOS Medicine | www.plosmedicine.org 12 November 2013 | Volume 10 | Issue 11 | e1001558

The H1N1pdm09 burden estimates from a few GLaMOR
participating countries have been published. As shown in Figures 9
and 10, the GLaMOR Stage 2 projections for persons ,65 y are
in good agreement with published estimates for Mexico, China,
Australia, US, and France, despite substantial differences in
modeling approaches. In contrast, the senior ($65 y) estimates are
quite variable, as were the GLaMOR all-age results.
Although our conservative range of global respiratory mortality
estimates is an order of magnitude greater than the reported global
number of WHO laboratory-confirmed deaths, it likely substan-
tially understated the total H1N1pdm09 mortality burden. First,
our study missed deaths that occurred late in the 2009–2010
winter as well as those occurring in later pandemic waves. For
example, one-third of Germany’s laboratory-confirmed first-wave
deaths occurred in early 2010, while substantial waves of
H1N1pmd09 mortality were observed later in the UK in 2010–
2011 [47] and in Mexico in 2011–2012 [48,49]. Second, many
H1N1pdm09 deaths may not have been recorded as respiratory
deaths. Furthermore, we were forced to model ‘‘underlying cause
of death’’ data, which may be biased towards underlying chronic
disease and thus undercount respiratory deaths. Moreover, we
refrained from generating a global estimate based on all-cause or
cardiorespiratory deaths (the latter a preferred outcome for
measuring seasonal influenza burden), since we were unable to
detect significant pandemic excess mortality for these outcomes in
most Stage 1 countries. We agree with Lemaitre et al. [10] that all-
cause mortality is not a useful outcome for assessing H1N1pdm09
mortality in mild impact countries. However, in the few high-
burden countries where we could measure all-cause mortality with
confidence (e.g., Argentina and Mexico), the ratio of all-cause to
respiratory mortality was ,2:1; Charu et al. reported a similar
ratio for Mexico [9]. If this 2:1 ratio pertained globally, the global
pandemic all-cause mortality burden would have been about
300,000–400,000 deaths, approximately double our range of
respiratory estimates.
Our approach had several strengths. Because the analysis was
based on the pandemic ‘‘excess’’ mortality that actually occurred
in 20 Stage 1 countries in 2009, we were able to map large and
important regional differences in the H1N1pdm09 mortality
burden that had not been captured in a previous study [19].
Because our collaborators contributed several years of data, we
also were able to generate a global estimate of average seasonal
influenza mortality, to which we could compare the pandemic
burden. And because our single-country Stage 1 estimates were
based on widely used analytical methods, our H1N1pdm09
mortality burden estimates are comparable to estimates made
for historic influenza pandemics.
We recognize several caveats of our study, however. First, we
lacked good representation of low-income countries and countries
in South-East Asia, the Eastern Mediterranean, and Africa. Second,
we were unable to explain the substantial pandemic mortality
attributions among seniors that we and others measured in Hong
Kong [50] and Japan, a pattern very unlike that documented by
laboratory-confirmed mortality surveillance efforts in multiple
countries globally (Table S1). Our Hong Kong collaborators
maintained that seniors could have been missed in the laboratory-
confirmed surveillance effort, while our Japanese collaborators
argued that their pandemic mortality surveillance system was not
age biased. Thus, the high measured burden among seniors may be
real, or a mis-measurement due to an inability of statistical models
to fully control for H3N2 co-circulation in 2009 in some Asian
settings. In any event, we could not resolve the issue. We therefore
also generated global and regional estimates based on the less
contentious ,65-y age group results. Third, we might not have
accounted sufficiently for spatial dependency between countries and
the likely spillover effect of influenza. And finally, the seasonal
estimates were not ideal because Stage 1 countries contributed data
from a variable number of seasons, and not all modeling issues were
fully resolved (e.g., we noted some degree of misalignment between
influenza virology and seasonal pneumonia mortality peaks in some
countries).
Health care policy decisions depend on reliable and timely data
whereby the risks and cost-effectiveness of interventions can be
evaluated. In the GLaMOR study we developed methods whereby
we can make robust and comparable mortality estimates in any
future pandemic. But the lack of timeliness of such reports must be
remedied. Ideally, a set of sentinel countries with timely hospital-
ization and/or mortality data could form a global sentinel system
measuring severity, provided a common protocol was in place to
allow comparisons across settings. EuroMOMO (European
Monitoring of Excess Mortality for Public Health Action), which
collects timely age-specific all-cause mortality data in European
countries, is a big step in the right direction [51]. Also Mexico,
Hong Kong, and New Zealand should be lauded for timely
surveillance systems that captured hospitalization, case fatality, and
Figure 7. Age distribution of projected global and regionalrespiratory mortality, for both pandemic and seasonal influ-enza mortality estimates. East.Med, Eastern Mediterranean.doi:10.1371/journal.pmed.1001558.g007
Figure 8. Comparison of GLaMOR mortality estimates to thoseof Dawood et al. GLaMOR all-age respiratory mortality estimateddirectly from all-age multiple imputation (open circles) and byproportional extrapolation of the ,65-y age group estimate to allages using the age distribution of laboratory-confirmed mortalitysurveillance (black circles), compared to estimates by Dawood et al. [19](black plus signs). Eastern Med, Eastern Mediterranean.doi:10.1371/journal.pmed.1001558.g008
2009 H1N1pdm Global Influenza Pandemic Mortality
PLOS Medicine | www.plosmedicine.org 13 November 2013 | Volume 10 | Issue 11 | e1001558

mortality impact in a large segment of their populations in near real
time [42,49,52] and Canada for its timely investigations into
unexpected effects of seasonal vaccines on the pandemic [55].
Going forward, these and other countries and existing networks
should partner to collaboratively and rapidly assess the severity of
future pandemic threats.
Figure 9. Comparison of Stage 1 modeled pandemic respiratory mortality rates, by age, to published estimates for Mexico,Australia, US, China, and France by authors using various modeling strategies. Asterisks indicate significance at the p,0.05 level.doi:10.1371/journal.pmed.1001558.g009
Figure 10. Comparison of Stage 1 modeled pandemic all-age mortality rates, by cause, to published estimates for Mexico,Australia, US, China, and France by authors using various modeling strategies. Asterisks indicate significance at the p,0.05 level.doi:10.1371/journal.pmed.1001558.g010
2009 H1N1pdm Global Influenza Pandemic Mortality
PLOS Medicine | www.plosmedicine.org 14 November 2013 | Volume 10 | Issue 11 | e1001558

Supporting Information
Figure S1 Sensitivity analysis of the multiple imputa-tion method seasonal estimates. We carried out the same
sensitivity analysis on the seasonal estimates—leaving one country
out at a time—that we had done on the pandemic estimate. The
seasonal estimates were much more sensitive to the exclusion of a
country than the pandemic estimates (Figure 6). The exclusion of
China had a particularly large impact on the all-age seasonal
excess respiratory mortality estimate.
(TIF)
Figure S2 A map showing WHO regions.(TIF)
Table S1 Age distribution of laboratory-confirmedH1N1pdm09 deaths from surveillance efforts in sevencountries.(DOCX)
Table S2 Global and regional GLaMOR Stage 2 projec-tions of pandemic respiratory mortality (numbers ofdeaths) with 95% CIs and sensitivity analysis ranges.(DOCX)
Table S3 Global and regional GLaMOR Stage 2 projec-tions of pandemic respiratory mortality rates with 95%CIs and sensitivity analysis ranges.(DOCX)
Table S4 Results from the hierarchical linear randomeffects regression model for the all-age and ,65-ymodels.(DOCX)
Acknowledgments
This work would not have been possible without the generosity of the
GLaMOR Collaborating Teams. The members of the GLaMORCollaborating Teams are: Argentina: Horacio Echenique, Ministry of
Health (Buenos Aires), Vilma Savy, National Influenza Center (Buenos
Aires); Australia: David Muscatello, New South Wales Ministry of Health
(North Sydney) and University of New South Wales (Kensington), C.
Raina MacIntyre, School of Public Health and Community Medicine,
University of New South Wales, Dominic E. Dwyer, Westmead Hospital
and University of Sydney (Sydney); Bangladesh: Eduardo Azziz-Baum-
gartner and Nusrat Homaira, International Centre for Diarrhoeal Disease
Research (Dhaka); Brazil: Fernanda Edna Araujo Moura, Federal
University of Ceara (Ceara), Cynthia Schuck, Origem Scientifica
(Florianopolis); Canada: Holy Akwar and Dena Schanzer, Public Health
Agency of Canada (Ottawa); Chile: Rodrigo Fuentes, Andrea Olea, and
Viviana Sotomayor, Ministry of Health (Santiago); China: Luzhao Feng
and Hongjie Yu, Chinese Center for Disease Control and Prevention
(Beijing); Denmark: Anne Mazick, Kare Mølbak, and Jens Nielsen, Statens
Serum Institut (Copenhagen); France: Fabrice Carrat, UMR-S707,
University Paris 06, and INSERM, Public Health, Saint-Antoine Hospital,
APHP (Paris), Magali Lemaitre, National Agency for the Safety of
Medicine and Health Products (Saint-Denis); Germany: Udo Buchholz,
Brunhilde Schweiger, and Michael Hohle, Robert Koch Institute (Berlin),
Silvan Vesenbeckh, Harvard School of Public Health (Boston, US) and
Emil von Behring Hospital (Berlin); Hong Kong Special Administrative
Region, China: Ben Cowling and Gabriel Leung, The University of Hong
Kong (Hong Kong), Thomas Tsang and Shuk-Kwan Chuang, Department
of Health (Hong Kong); Israel: Michal Bromberg and Zalman Kaufman,
Israel Center for Disease Control, Ministry of Health (Tel-Hashomer);
Japan: Norio Sugaya, Keiyu Hospital (Yokohama), Kuniko Oka Ezoe,
Shuichiro Hayashi, and Megumi Matsuda, Ministry of Health, Labor and
Welfare (Tokyo); Mexico: Hugo Lopez-Gatell and Celia Alpuche-Aranda,
Instituto Nacional de Salud Publica (Cuernavaca), Daniel Noyola,
Universidad Autonoma de San Luis Potosı (San Luis Potosı), Gerardo
Chowell, Arizona State University (Tempe, US) and Fogarty International
Center, National Institutes of Health (Bethesda, US); Netherlands: Liselotte
van Asten, Adam Meijer, and Kees van den Wijngaard, National Institute
for Public Health and the Environment (RIVM) (Bilthoven), Marianne van
der Sande, RIVM (Bilthoven) and Julius Center for Health Sciences and
Primary Care University Medical Center Utrecht (Utrecht); New Zealand:
Michael Baker and Jane Zhang, University of Otago (Wellington); Peru:
Jorge Gomez Benavides, Ministerio de Salud (Lima), Cesar Munayco,
Uniformed University of Health Sciences (Bethesda, US), Alberto Laguna-
Torres, Naval Medical Research Unit-6 (Lima); Poland: Daniel Rabczenko
and Bogdan Wojtyniak, National Institute of Public Health–National
Institute of Hygiene (Warsaw); Republic of Korea: Sun-Hee Park and
Yeon-Kyeng Lee, Korea Centers for Disease Control and Prevention
(Cheongwon-gun); Romania: Laurentiu Zolotusca, Ministry of Health
(Bucharest), Odette Popovici and Rodica Popescu, National Institute of
Public Health (Bucharest); Singapore: Li Wei Ang, Jeffery Cutter,
Raymond Lin, and Stefan Ma, Ministry of Health (Singapore), Mark
Chen and Vernon J. Lee, National University of Singapore (Singapore);
Slovenia: Katarina Prosenc and Maja Socan, National Institute of Public
Health (Ljubljana); South Africa: Cheryl Cohen, National Health
Laboratory Service (Johannesburg); Spain: Amparo Larrauri, Salvador
de Mateo, Lorena Simon Mendez, and Concha Delgado Sanz, Institute of
Health Carlos III (Madrid); United Kingdom: Nick Andrews, Helen K.
Green, Richard Pebody, and Ayoub Saei, Public Health England
(London); US: David Shay, Centers for Disease Control and Prevention
(Atlanta), Cecile Viboud, National Institutes of Health (Bethesda). The
views expressed in this article do not necessarily reflect the official policy or
position of any ministry of health or government.
The authors also thank the Ad Hoc Advisory Committee on
H1N1pdm09 Mortality Estimates: Isabelle Bonmarin, Mark Chen I-
Cheng, Cheryl Cohen, Benjamin J. Cowling, Jean-Claude Desenclos,
David N. Durrheim, Luzhao Feng, Neil M. Ferguson, Peter G. Grove,
Bryan Grenfell, El Bushra Hassan, Pernille Jorgensen, Francis Kasolo,
Gabriel Leung, Marc Lipsitch, Fatima Marinho, Colin Mathers, Anne
Mazick, Kare Mølbak, Anthony Mounts, Angus Nicoll, Yasushi Ohkusa,
Otavio Oliva, Richard Pebody, Caterina Rizzo, Colin Russell, David Shay,
Kumnuan Ungchusak, C. C. van den Wijngaard, Maria D. Van
Kerkhove, Cecile Viboud, Sirenda Vong, Lara Wolfson, Joseph T. Wu,
and Hongjie Yu.
Thanks also to the European Centre for Disease Prevention and Control
(Angus Nicoll), the Pan American Health Organization/WHO Regional
Office for the Americas (Fatima Marinho), the WHO Regional Office for
Europe (Caroline Brown and Pernille Jørgensen) for facilitating access to
national datasets in the Americas and Europe, and the WHO headquarters
in Geneva(Julia Fitzner) for providing access to the FluNET data; to Lewis
Kim, Megan McDonough, and Danae Spencer of the George Washington
University School of Public Health and Health Services; and to Francois
Schellevis and Liana Martirosyan at the Netherlands Institute for Health
Services Research for expert editorial and technical assistance.
We thank the public health institutes in local governments of Japan,
Germany, Spain, Canada, Hong Kong, and the Netherlands for providing
additional laboratory data.
And finally we warmly thank the awesome researchers with the
Multinational Influenza Seasonal Mortality Study Group influenza
modeling network at the US National Institutes of Health Fogarty
International Center, especially Cecile Viboud, Gerardo Chowell, Vivek
Charu, and Cynthia Schuck, who worked alongside the GLaMOR core
team to develop the methodology. Without their generous support this
project would not have been possible.
Author Contributions
Conceived and designed the experiments: LS WJP DMF. Performed the
experiments: LS PS RL. Analyzed the data: LS PS RL RJT WJP DMF.
Contributed reagents/materials/analysis tools: AWM MDVK. Wrote the
first draft of the manuscript: LS RJT WJP MK PS. Contributed to the
writing of the manuscript: LS RJT WJP MK DMF PS RL AWM MDVK.
ICMJE criteria for authorship read and met: LS RJT WJP MK DMF PS
RL AWM MDVK. Agree with manuscript results and conclusions: LS
RJT WJP MK DMF PS RL AWM MDVK.
2009 H1N1pdm Global Influenza Pandemic Mortality
PLOS Medicine | www.plosmedicine.org 15 November 2013 | Volume 10 | Issue 11 | e1001558
References
1. World Health Organization (2010) Pandemic (H1N1) 2009—update 112.
Available: http://www.who.int/csr/don/2010_08_06/en/index.html. Accessed
12 October 2012.2. Enserink M, Cohen J (2009) Virus of the year. The novel H1N1 influenza.
Science 326: 1607.3. Flynn P (2010) The handling of the H1N1 pandemic: more transparency
needed. Council of Europe Parliamentary Assembly.
4. Simonsen L, Clarke MJ, Schonberger LB, Arden NH, Cox NJ, et al. (1998)Pandemic versus epidemic influenza mortality: a pattern of changing age
distribution. J Infect Dis 178: 53–60.5. Viboud C, Grais RF, Lafont BA, Miller MA, Simonsen L (2005) Multinational
impact of the 1968 Hong Kong influenza pandemic: evidence for a smolderingpandemic. J Infect Dis 192: 233–248.
6. Miller MA, Viboud C, Balinska M, Simonsen L (2009) The signature features of
influenza pandemics—implications for policy. N Engl J Med 360: 2595–2598.7. Miller MA, Viboud C, Olson DR, Grais RF, Rabaa MA, et al. (2008)
Prioritization of influenza pandemic vaccination to minimize years of life lost.J Infect Dis 198: 305–311.
8. Viboud C, Miller M, Olson D, Osterholm M, Simonsen L (2010) Preliminary
estimates of mortality and years of life lost associated with the 2009 A/H1N1pandemic in the US and comparison with past influenza seasons. PLoS Curr 2:
RRN1153. doi:10.1371/currents.RRN11539. Charu V, Chowell G, Palacio Mejia LS, Echevarria-Zuno S, Borja-Aburto VH,
et al. (2011) Mortality burden of the A/H1N1 pandemic in Mexico: acomparison of deaths and years of life lost to seasonal influenza. Clin Infect Dis
53: 985–993.
10. Lemaitre M, Carrat F, Rey G, Miller M, Simonsen L, et al. (2012) Mortalityburden of the 2009 A/H1N1 influenza pandemic in France: comparison to
seasonal influenza and the A/H3N2 pandemic. PLoS ONE 7: e45051.doi:10.1371/journal.pone.0045051
11. Muscatello DJ, Cretikos MA, Macintyre CR (2010) All-cause mortality during
first wave of pandemic (H1N1) 2009, New South Wales, Australia, 2009. EmergInfect Dis 16: 1396–1402.
12. Schuck-Paim C, Viboud C, Simonsen L, Miller MA, Moura FE, et al. (2012)Were equatorial regions less affected by the 2009 influenza pandemic? The
Brazilian experience. PLoS ONE 7: e41918. doi:10.1371/journal.pone.004191813. Wijngaard CC, Asten L, Koopmans MP, Pelt W, Nagelkerke NJ, et al. (2012)
Comparing pandemic to seasonal influenza mortality: moderate impact overall
but high mortality in young children. PLoS ONE 7: e31197. doi:10.1371/journal.pone.0031197
14. Yu H, Feng L, Viboud CG, Shay DK, Jiang Y, et al. (2013) Regional variationin mortality impact of the 2009 A(H1N1) influenza pandemic in China.
Influenza Other Respi Viruses. E-pub ahead of print. doi: 10.1111/irv.12121
15. Liang W, Feng L, Xu C, Xiang N, Zhang Y, et al. (2012) Response to the firstwave of pandemic (H1N1) 2009: experiences and lessons learnt from China.
Public Health 126: 427–436.16. Van Kerkhove MD, Vandemaele KA, Shinde V, Jaramillo-Gutierrez G,
Koukounari A, et al. (2011) Risk factors for severe outcomes following 2009influenza A (H1N1) infection: a global pooled analysis. PLoS Med 8: e1001053.
doi:10.1371/journal.pmed.1001053
17. McCallum L (2010) Epidemiological characteristics of the influenza A(H1N1)2009 pandemic in the Western Pacific Region. Western Pac Surveill Response J
1: 5–11.18. Murray CJ, Lopez AD, Chin B, Feehan D, Hill KH (2006) Estimation of
potential global pandemic influenza mortality on the basis of vital registry data
from the 1918–20 pandemic: a quantitative analysis. Lancet 368: 2211–2218.19. Dawood FS, Iuliano AD, Reed C, Meltzer MI, Shay DK, et al. (2012) Estimated
global mortality associated with the first 12 months of 2009 pandemic influenzaA H1N1 virus circulation: a modelling study. Lancet Infect Dis 12: 687–695.
20. World Health Organization (2013) FluNet [database]. Available: http://www.
who.int/influenza/gisrs_laboratory/flunet/en/. Accessed 22 October 2013.21. World Health Organization (2011) Summary of WHO technical consultation:
H1N1pdm mortality estimates. Available: http://www.who.int/influenza/surveillance_monitoring/updates/MortalityEstimates/en/. Accessed 26 Octo-
ber 2013.22. Pitman RJ, Melegaro A, Gelb D, Siddiqui MR, Gay NJ, et al. (2007) Assessing
the burden of influenza and other respiratory infections in England and Wales.
J Infect 54: 530–538.23. Thompson WW, Shay DK, Weintraub E, Brammer L, Cox N, et al. (2003)
Mortality associated with influenza and respiratory syncytial virus in the UnitedStates. JAMA 289: 179–186.
24. Thompson WW, Weintraub E, Dhankhar P, Cheng PY, Brammer L, et al.
(2009) Estimates of US influenza-associated deaths made using four differentmethods. Influenza Other Respi Viruses 3: 37–49.
25. Zhou H, Thompson WW, Viboud CG, Ringholz CM, Cheng PY, et al. (2012)Hospitalizations associated with influenza and respiratory syncytial virus in the
United States, 1993–2008. Clin Infect Dis 54: 1427–1436.26. Buuren S (2012) Flexible imputation of missing data. Boca Raton (Florida): CRC
Press.
27. World Health Organization (2013) Global health observatory data repository[database]. Available: http://apps.who.int/gho/data/view.main. Accessed 11
November 2011.
28. World Bank (2013) Data: indicators [database]. Available: http://data.
worldbank.org/indicator/. Accessed 1 November 2011.
29. United Nations Statistics Division (2013) UNdata: explorer [database]. Available:
http://data.un.org/Explorer.aspx?d = POP. Accessed 1 November 2011.
30. Thematic Mapping (2013) World borders database [database]. Available:http://thematicmapping.org/downloads/world_borders.php. Accessed 1 No-
vember 2011.
31. Raudenbush SW, Bryk AS (2002) Hierarchical linear models, applications and
data analysis methods. Thousand Oaks (California): Sage Publications.
32. Goldstein H, Spiegelhalter DJ (1996) League tables and their limitations:statistical issues in comparisons of institutional performance. J R Stat Soc
Ser A Stat Soc 159: 385–443.
33. Normand S, Glickman M, Gastonis CA (1997) Statistical methods for profilingproviders of medical care: issues and applications. J Am Stat Assoc 92: 803–814.
34. Honaker J, King G, Blackwell M (2011) Amelia II: a program for missing data.J Stat Softw 45: 1–47. Available: http://www.jstatsoft.org/v45/i07/. Accessed
29 October 2013.
35. Hasbash J, Charlton C, Browne WJ, Healy M, Cameron B (2009) MLwiN,version 2.1. Bristol: Centre for Multilevel Modelling, University of Bristol.
36. Cook DA, Beckman TJ (2006) Current concepts in validity and reliability for
psychometric instruments: theory and application. Am J Med 119: 166.e7–16.
37. World Health Organization (2005) WHO global influenza preparedness plan: the
role of WHO and recommendations for national measures before and duringpandemics. WHO/CDS/CSR/GIP/20055. Geneva: World Health Organization.
38. Andreasen V, Viboud C, Simonsen L (2008) Epidemiologic characterization of
the 1918 influenza pandemic summer wave in Copenhagen: implications forpandemic control strategies. J Infect Dis 197: 270–278.
39. Olson DR, Simonsen L, Edelson PJ, Morse SS (2005) Epidemiological evidence
of an early wave of the 1918 influenza pandemic in New York City. Proc NatlAcad Sci U S A 102: 11059–11063.
40. Chowell G, Bertozzi SM, Colchero MA, Lopez-Gatell H, Alpuche-Aranda C,et al. (2009) Severe respiratory disease concurrent with the circulation of H1N1
influenza. N Engl J Med 361: 674–679.
41. Fraser C, Donnelly CA, Cauchemez S, Hanage WP, Van Kerkhove MD, et al.(2009) Pandemic potential of a strain of influenza A (H1N1): early findings.
Science 324: 1557–1561.
42. Baker M, Kelly H, Wilson N (2009) Pandemic H1N1 influenza lessons from thesouthern hemisphere. Euro Surveill 14.
43. Borse RH, Shrestha SS, Fiore AE, Atkins CY, Singleton JA, et al. (2013) Effectsof vaccine program against pandemic influenza A(H1N1) virus, United States,
2009–2010. Emerg Infect Dis 19: 439–448.
44. Gauger PC, Vincent AL, Loving CL, Lager KM, Janke BH, et al. (2011)Enhanced pneumonia and disease in pigs vaccinated with an inactivated human-
like (delta-cluster) H1N2 vaccine and challenged with pandemic 2009 H1N1influenza virus. Vaccine 29: 2712–2719.
45. Homaira N, Luby SP, Alamgir AS, Islam K, Paul R, et al. (2012) Influenza-
associated mortality in 2009 in four sentinel sites in Bangladesh. Bull WorldHealth Organ 90: 272–278.
46. Katz MA, Lebo E, Emukule G, Njuguna HN, Aura B, et al. (2012)
Epidemiology, seasonality, and burden of influenza and influenza-like illnessin urban and rural Kenya, 2007–2010. J Infect Dis 206 (Suppl 1): S53–S60.
47. Pebody RG, Andrews N, Fleming DM, McMenamin J, Cottrell S, et al. (2012)Age-specific vaccine effectiveness of seasonal 2010/2011 and pandemic
influenza A(H1N1) 2009 vaccines in preventing influenza in the United
Kingdom. Epidemiol Infect 13: 1–11.
48. Chowell G, Echevarrıa-Zuno S, Viboud C, Simonsen L, Grajales Muniz C,
et al. (2012) Recrudescent wave of pandemic A/H1N1 influenza in Mexico,
winter 2011–2012: age shift and severity. PLoS Curr 4: RRN1306. doi:10.1371/currents.RRN1306
49. Borja-Aburto VH, Chowell G, Viboud C, Simonsen L, Miller MA, et al. (2012)Epidemiological characterization of a fourth wave of pandemic A/H1N1
influenza in Mexico, winter 2011–2012: age shift and severity. Arch Med Res
43: 563–570.
50. Yang L, Chan KP, Cowling BJ, Chiu SS, Chan KH, et al. (2012) Excess
mortality associated with the 2009 pandemic of influenza A(H1N1) in HongKong. Epidemiol Infect 140: 1542–1550.
51. EuroMOMO (2013) European mortality bulletin, week 23, 2013. Copenhagen:
EuroMOMO.
52. Wu JT, Ma ES, Lee CK, Chu DK, Ho PL, et al. (2010) The infection attack rate
and severity of 2009 pandemic H1N1 influenza in Hong Kong. Clin Infect Dis
51: 1184–1191.
53. Schanzer DL, Schwartz B (2013) Impact of seasonal and pandemic influenza on
emergency department visits, 2003–2010, Ontario, Canada. Acad Emerg Med20: 388–397.
54. Shrestha SS, Swerdlow DL, Borse RH, Prabhu VS, Finelli L, et al. (2011)
Estimating the burden of 2009 pandemic influenza A (H1N1) in the UnitedStates (April 2009–April 2010). Clin Infect Dis 52 (Suppl 1): S75–S82.
55. Skowronski DM, De Serres G, Crowcroft NS, Janjua NZ, Boulianne N, et al.
(2010) Association between the 200809 seasonal influenza vaccine and pandemicH1N1 illness during springsummer 2009: four observational studies from
Canada. PLoS Med 7 (4): e1000258. doi:10.1371/journal.pmed.1000258.
2009 H1N1pdm Global Influenza Pandemic Mortality
PLOS Medicine | www.plosmedicine.org 16 November 2013 | Volume 10 | Issue 11 | e1001558
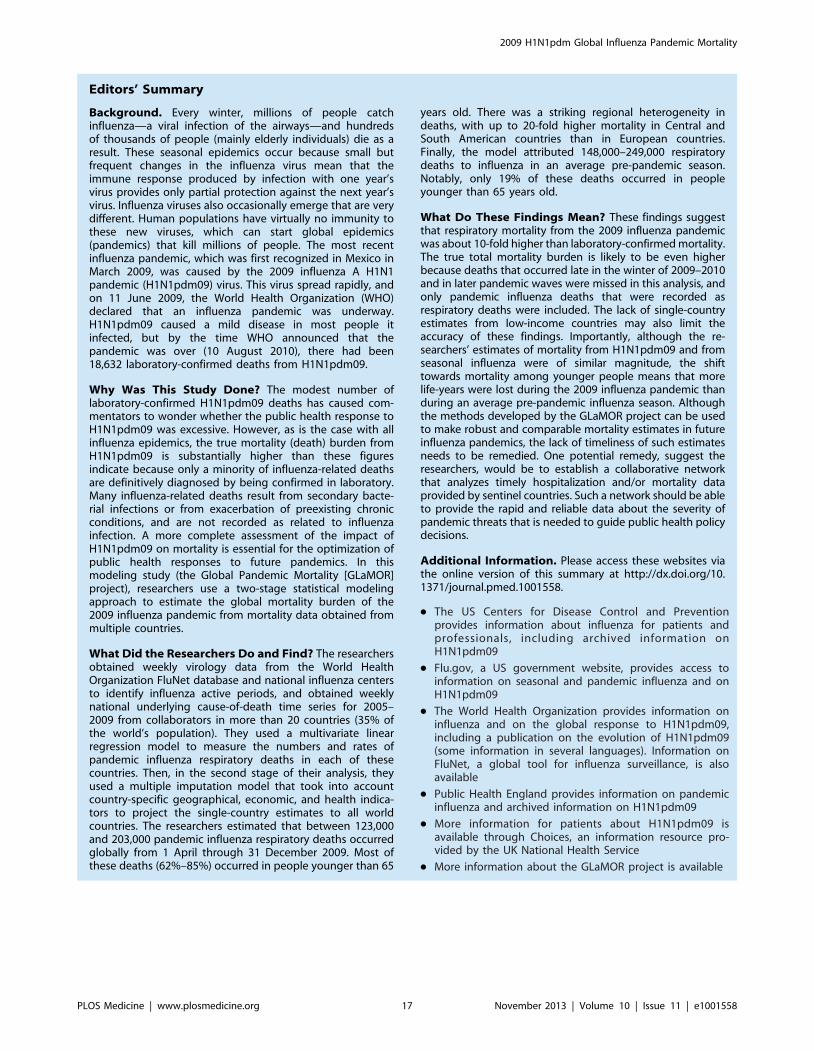
Editors’ Summary
Background. Every winter, millions of people catchinfluenza—a viral infection of the airways—and hundredsof thousands of people (mainly elderly individuals) die as aresult. These seasonal epidemics occur because small butfrequent changes in the influenza virus mean that theimmune response produced by infection with one year’svirus provides only partial protection against the next year’svirus. Influenza viruses also occasionally emerge that are verydifferent. Human populations have virtually no immunity tothese new viruses, which can start global epidemics(pandemics) that kill millions of people. The most recentinfluenza pandemic, which was first recognized in Mexico inMarch 2009, was caused by the 2009 influenza A H1N1pandemic (H1N1pdm09) virus. This virus spread rapidly, andon 11 June 2009, the World Health Organization (WHO)declared that an influenza pandemic was underway.H1N1pdm09 caused a mild disease in most people itinfected, but by the time WHO announced that thepandemic was over (10 August 2010), there had been18,632 laboratory-confirmed deaths from H1N1pdm09.
Why Was This Study Done? The modest number oflaboratory-confirmed H1N1pdm09 deaths has caused com-mentators to wonder whether the public health response toH1N1pdm09 was excessive. However, as is the case with allinfluenza epidemics, the true mortality (death) burden fromH1N1pdm09 is substantially higher than these figuresindicate because only a minority of influenza-related deathsare definitively diagnosed by being confirmed in laboratory.Many influenza-related deaths result from secondary bacte-rial infections or from exacerbation of preexisting chronicconditions, and are not recorded as related to influenzainfection. A more complete assessment of the impact ofH1N1pdm09 on mortality is essential for the optimization ofpublic health responses to future pandemics. In thismodeling study (the Global Pandemic Mortality [GLaMOR]project), researchers use a two-stage statistical modelingapproach to estimate the global mortality burden of the2009 influenza pandemic from mortality data obtained frommultiple countries.
What Did the Researchers Do and Find? The researchersobtained weekly virology data from the World HealthOrganization FluNet database and national influenza centersto identify influenza active periods, and obtained weeklynational underlying cause-of-death time series for 2005–2009 from collaborators in more than 20 countries (35% ofthe world’s population). They used a multivariate linearregression model to measure the numbers and rates ofpandemic influenza respiratory deaths in each of thesecountries. Then, in the second stage of their analysis, theyused a multiple imputation model that took into accountcountry-specific geographical, economic, and health indica-tors to project the single-country estimates to all worldcountries. The researchers estimated that between 123,000and 203,000 pandemic influenza respiratory deaths occurredglobally from 1 April through 31 December 2009. Most ofthese deaths (62%–85%) occurred in people younger than 65
years old. There was a striking regional heterogeneity indeaths, with up to 20-fold higher mortality in Central andSouth American countries than in European countries.Finally, the model attributed 148,000–249,000 respiratorydeaths to influenza in an average pre-pandemic season.Notably, only 19% of these deaths occurred in peopleyounger than 65 years old.
What Do These Findings Mean? These findings suggestthat respiratory mortality from the 2009 influenza pandemicwas about 10-fold higher than laboratory-confirmed mortality.The true total mortality burden is likely to be even higherbecause deaths that occurred late in the winter of 2009–2010and in later pandemic waves were missed in this analysis, andonly pandemic influenza deaths that were recorded asrespiratory deaths were included. The lack of single-countryestimates from low-income countries may also limit theaccuracy of these findings. Importantly, although the re-searchers’ estimates of mortality from H1N1pdm09 and fromseasonal influenza were of similar magnitude, the shifttowards mortality among younger people means that morelife-years were lost during the 2009 influenza pandemic thanduring an average pre-pandemic influenza season. Althoughthe methods developed by the GLaMOR project can be usedto make robust and comparable mortality estimates in futureinfluenza pandemics, the lack of timeliness of such estimatesneeds to be remedied. One potential remedy, suggest theresearchers, would be to establish a collaborative networkthat analyzes timely hospitalization and/or mortality dataprovided by sentinel countries. Such a network should be ableto provide the rapid and reliable data about the severity ofpandemic threats that is needed to guide public health policydecisions.
Additional Information. Please access these websites viathe online version of this summary at http://dx.doi.org/10.1371/journal.pmed.1001558.
N The US Centers for Disease Control and Preventionprovides information about influenza for patients andprofessionals, including archived information onH1N1pdm09
N Flu.gov, a US government website, provides access toinformation on seasonal and pandemic influenza and onH1N1pdm09
N The World Health Organization provides information oninfluenza and on the global response to H1N1pdm09,including a publication on the evolution of H1N1pdm09(some information in several languages). Information onFluNet, a global tool for influenza surveillance, is alsoavailable
N Public Health England provides information on pandemicinfluenza and archived information on H1N1pdm09
N More information for patients about H1N1pdm09 isavailable through Choices, an information resource pro-vided by the UK National Health Service
N More information about the GLaMOR project is available
2009 H1N1pdm Global Influenza Pandemic Mortality
PLOS Medicine | www.plosmedicine.org 17 November 2013 | Volume 10 | Issue 11 | e1001558