Embed Size (px)
Citation preview

Global Megatrendsand the innovation imperative
By Stefan Hajkowicz, CSIRO

How’s Australia Doing at Maths?

613 China, Shanghai
573 Singapore
561 China, Hong Kong
560 Chinese Taipaei
554 Korea
504 Australia
473 Average of 65 Countries in Survey
481 United States
International Comparison of Mathematics SkillsOECD 2012 Program for International Student Assessment (PISA) Scores – Student Performance in Mathematics for 65 Countries

Qatar
Albania
Israe
l
Turkey
Italy
Chinese Taip
ei
Argentina
Russian
Federati
on
Estonia
Latvi
a
Jord
an
OECD averag
e 2003
Irelan
d
Urugu
ay
Belgium
Australi
a
Sweden
-4
-2
0
2
4
6
8
10
Mathematics SkillsAnnualised Percent Change in OECD PISA Maths Score (i.e. how good we are at doing maths)
Australia
350 400 450 500 550 600 6500
10
20
30
40
50
60
70
80
90
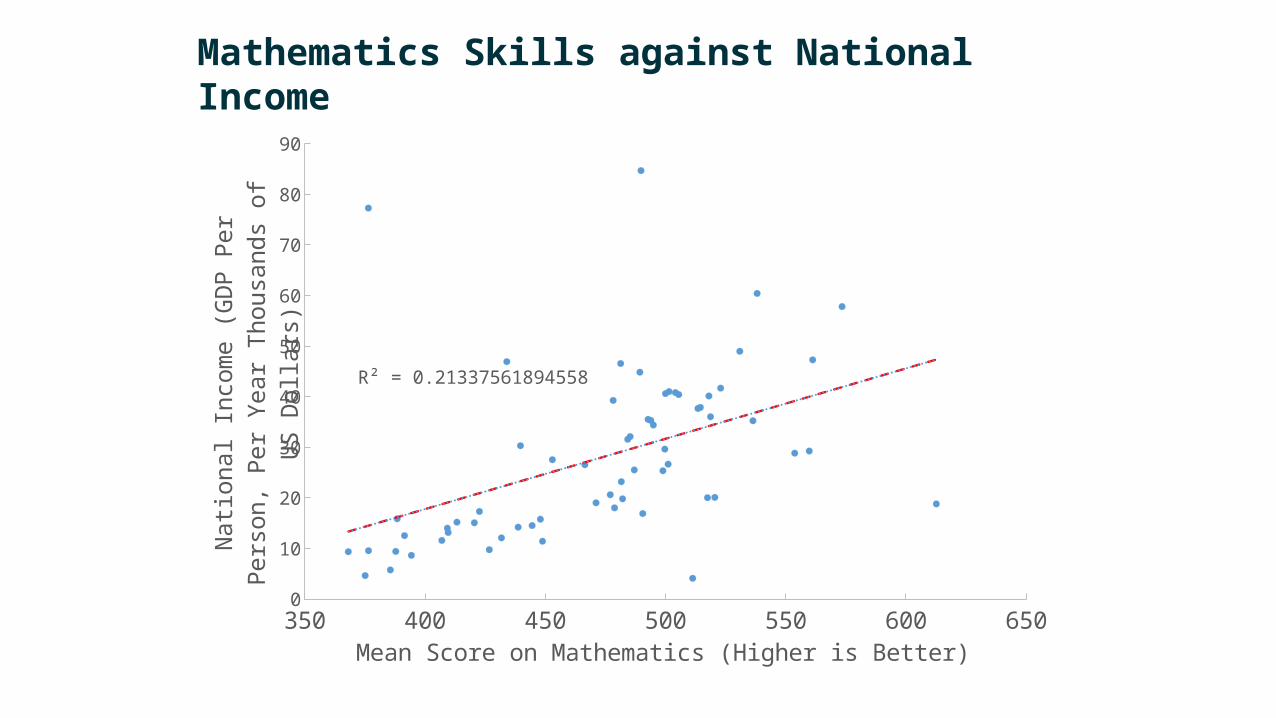
R² = 0.21337561894558
Mean Score on Mathematics (Higher is Better)
Nati
onal
Inco
me
(GD
P Pe
r Per
son,
Per
Yea
r Th
ousa
nds o
f US
Dol
lars
)
Mathematics Skills against National Income

Early Thinking The 2015 Megatrends and The
Innovation Imperative


Projections of the Number of 25-34 year olds with tertiary education, 2000 - 2020
“The strong demand for employees in “knowledge economy” fields suggests that the global labour market can continue to absorb the increased supply of highly-educated individuals”.
Worldwide Growth in Education & Skills
“China and India will account for 40% of all young people with a tertiary education in G20 and OECD countries by the year 2020”
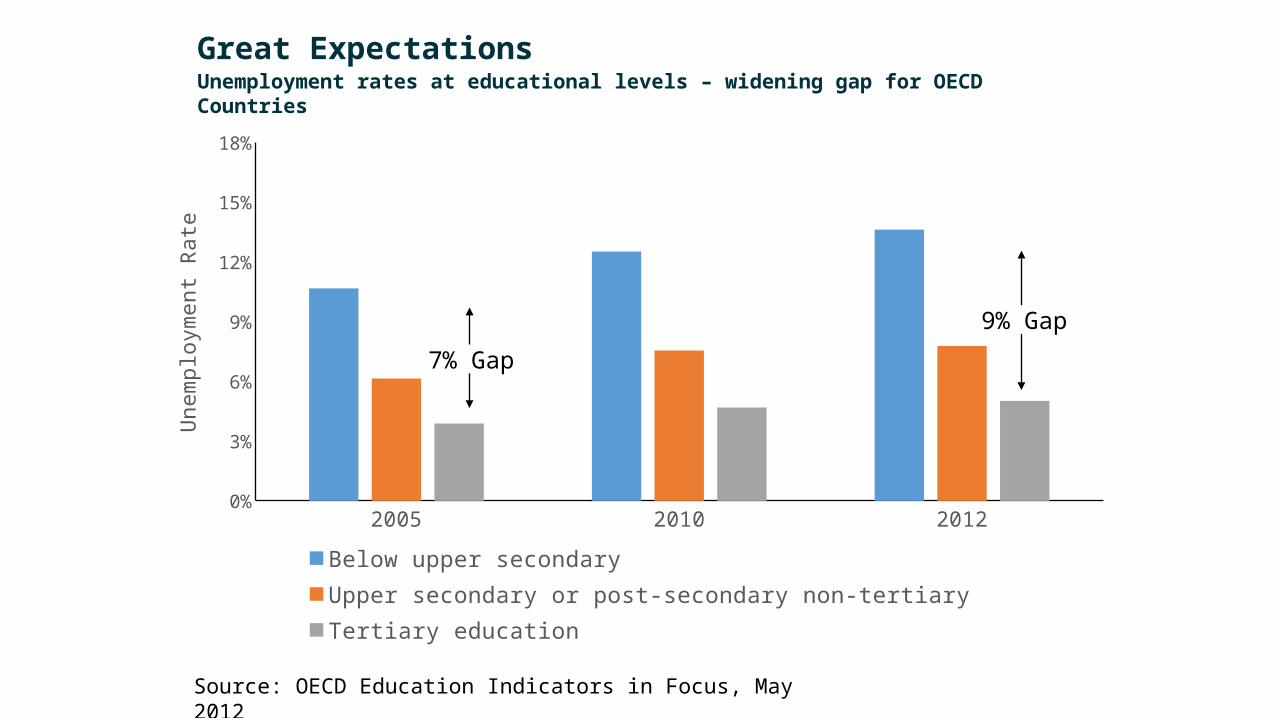
Source: OECD Education Indicators in Focus, May 2012
2005 2010 20120%
3%
6%
9%
12%
15%
18%
Below upper secondary Upper secondary or post-secondary non-tertiary Tertiary education
Unem
ploy
men
t Rat
e
Source: OECD Education Indicators in Focus, May 2012
7% Gap
9% Gap
Great ExpectationsUnemployment rates at educational levels – widening gap for OECD Countries

IBM’s Watson
Google’s Car
47% of Jobs in USA (University of Oxford) and 44% of jobs in Australia are at high risk of computerisation (Price Waterhouse Coopers).
Briggo Coffee Kiosk - 250 sensors and trained by (and meeting the standards of ) the worlds best human barista
But this one smiles
Artificial Intelligence and JobsTask automation and job replacement
What jobs for people?

The Power of the CrowdAnd the Rising Peer-to-Peer Economy

Data Source: The Australian Government Treasury
The Revised trend uses a different definition for income and is therefore not directly comparable. Source: Jonson and Wilkins (2006), Whiteford (2013) and ABS (2013). Note: Horizontal axis corresponds to survey release dates. The interval between surveys varies.
Data Source: The Australian Government Treasury
Income Inequality
Norway 0.25Sweden 0.27Finland 0.26
Chile 0.50Mexico 0.48
United States 0.40

1978 1982 1986 1990 1994 1998 2002 2006 2010 20140%
2%
4%
6%
8%
10%
12%Men Aged 25-54 Years Not in the Labour
Force
Perc
ent o
f Tot
al M
en A
ged
25-5
4 Ye
ars
ABS (2015). 6291.0.55.001 - Labour Force, Australia, Detailed. Canberra, Australian Bureau of Statistics.

Innovation, Productivity and ProsperityWe need new & bigger ideas to refuel the economy
19951997
19992001
20032005
20072009
20112013
80.0
85.0
90.0
95.0
100.0
105.0
Mul
tifac
tor P
rodu
ctivi
ty
We do need to head back in this direction soonish
Data source: Australian Bureau of Statistics, 5204.0 Australian System of National Accounts
Read “The Great Stagnation – How America Ate All the Low-Hanging Fruit of Modern History, Got Sick, and Will (Eventually) Feel Better“ by Tyler Cowen

The Innovation ImperativeAnd tomorrow’s knowledge economy
Image Source: Wikimedia Commons, "Night skyline of Brisbane, Queensland, Australia" by wirepic - Flickr

Connect with me …
Twitter@stefanhajkowicz
Buy the book …@ CSIRO Publishing
Thanks for Listening