Embed Size (px)
Citation preview

Global Maternal, Newborn and Child
Health: challenges and opportunities
Zulfiqar A BhuttaFounding Chair
Women & Child Health Division
The Aga Khan University
Pakistan

Outline
• Global burden of Maternal & Child Mortality
• What works & how good are we at delivering?
• Innovations for scaling up: what’s new?
• Has anyone done this at scale? • Has anyone done this at scale?
• Challenges ahead

Maternal mortality ratios 1990-2008
400
500
600
700
800
900M
MR
0
100
200
300
400
1990 1995 2000 2005 2008
year
MM
R
Africa Asia CIS Developed Latin America Oceania World

Maternal mortality ratios at country level(~ 358,000 deaths annually in 2008)
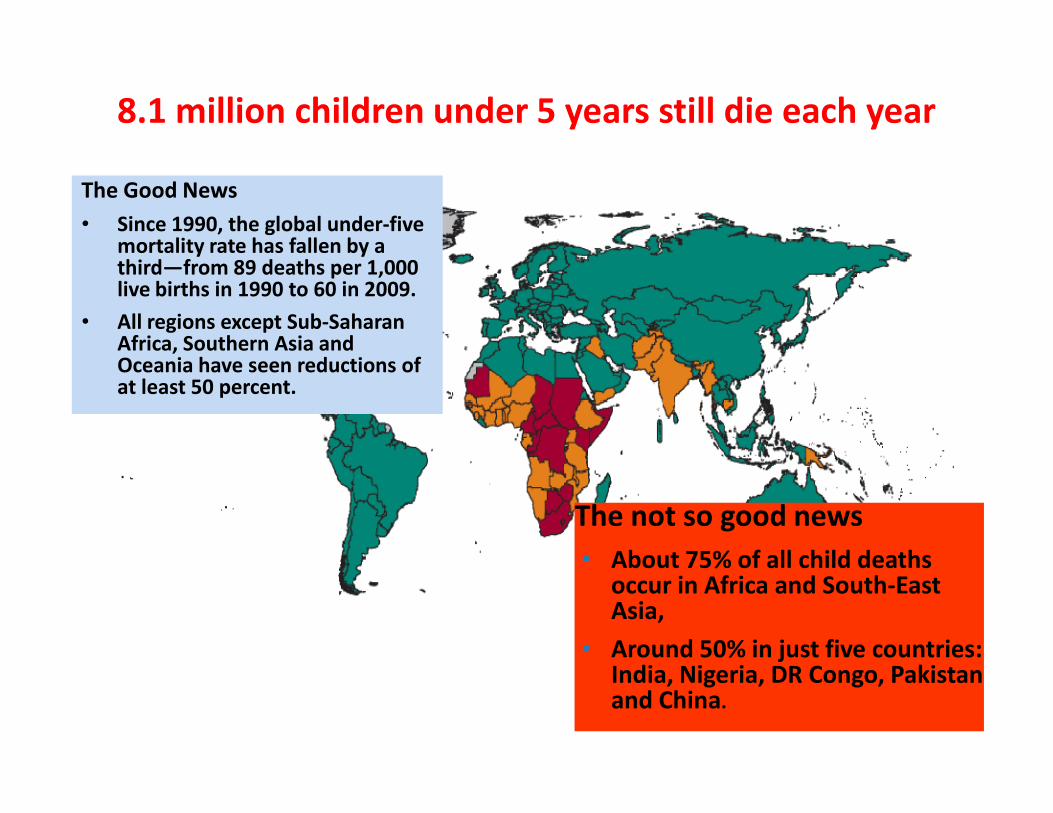
8.1 million children under 5 years still die each year
The Good News
• Since 1990, the global under-five mortality rate has fallen by a third—from 89 deaths per 1,000 live births in 1990 to 60 in 2009.
• All regions except Sub-Saharan Africa, Southern Asia and Oceania have seen reductions of at least 50 percent.
The not so good news
• About 75% of all child deaths occur in Africa and South-East Asia,
• Around 50% in just five countries: India, Nigeria, DR Congo, Pakistan and China.

Top 10 countries for numbers of
stillbirths, neonatal and maternal deaths
Ranking for neonatal deaths
Ranking for
maternal deaths
Ranking for
stillbirths
India 1 1 1
Nigeria 2 2 3
Pakistan 3 8 2
China 4 13 8
2.4 million
neonatal 340,000
maternal 1.77
million China 4 13 8
DR Congo 5 3 6
Ethiopia 6 5 5
Bangladesh 7 6 4
Indonesia 8 7 7
Afghanistan 9 4 12
Tanzania 10 9 11
neonatal
deaths
Approx
67%
of global
total
maternal
deaths
Approx
65%
of global
total
Ref: Lawn JE et al BJOG sept 2009. Data sources: Estimates of maternal (2005) and neonatal (2008) deaths from WHO. Stillbirths from Cousens et al 2010 Updated Aug 2010
million
stillbirths
Approx
63%
of global
total

A limited number of related conditions account for the majority of neonatal
and maternal mortality
Maternal mortality by cause*
Total deaths per year ~0.38 million
26%Hemorrhage
Hypertensive
Account for:
• ~0.2 million
deaths
• 59% of
Obstructed labor
Unsafe abortion
Anemia
Other direct
causes
Other indirect
causes***
Unclassified
15%
9%
9%
8%
6%
7%
11%
8%
Hypertensive
disorders
(e.g., preeclampsia)
Sepsis/infections
• 59% of
maternal
deaths

27%Preterm birth
A limited number of related conditions account for the majority of neonatal
and maternal mortality
Maternal mortality by cause*
Total deaths per year ~0.38 million
Neonatal mortality by cause*
Total deaths per year ~3.6 million
Account for:
• ~2.8 million
deaths
26%Hemorrhage
Hypertensive
Account for:
• ~0.2 million
deaths
• 59% of
26%
23%
7%
7%
7%
3%
Severe infections
(e.g., sepsis,
pneumonia)
“Birth asphyxia”
Congenital
abnormalities
Tetanus
Other
Diarrhea
deaths
• 76% of
neonatal
deaths
In addition,
there are over
2.5 million
stillbirths
per year**
Obstructed labor
Unsafe abortion
Anemia
Other direct
causes
Other indirect
causes***
Unclassified
15%
9%
9%
8%
6%
7%
11%
8%
Hypertensive
disorders
(e.g., preeclampsia)
Sepsis/infections
• 59% of
maternal
deaths
These
conditions
also
contribute to
the three
highest
burden
newborn
conditions
Adapted from Gary Darmstadt & WHO

Malaria8%
AIDS2%
Pertrussis2%
Meningitis2% Other
infections9%
NCDs4%
Injury3%
Preterm 12%
Asphyxia 9%Neonatal
Causes of child deaths in 2008almost all due to preventable conditions
These causes
account for
81% of all
Diarrhea15%
Pneumonia14%
8%Asphyxia 9%
Sepsis 6%
Pneumonia 4%Diarrhea 1%
Tetanus 1%Congenital 3%
Other 5%
Neonatal41%
81% of all
neonatal
deaths3.6 million
Source CHERG/WHO 2010. Estimates for 193 countries for 2008. Black R et al Lancet 2010

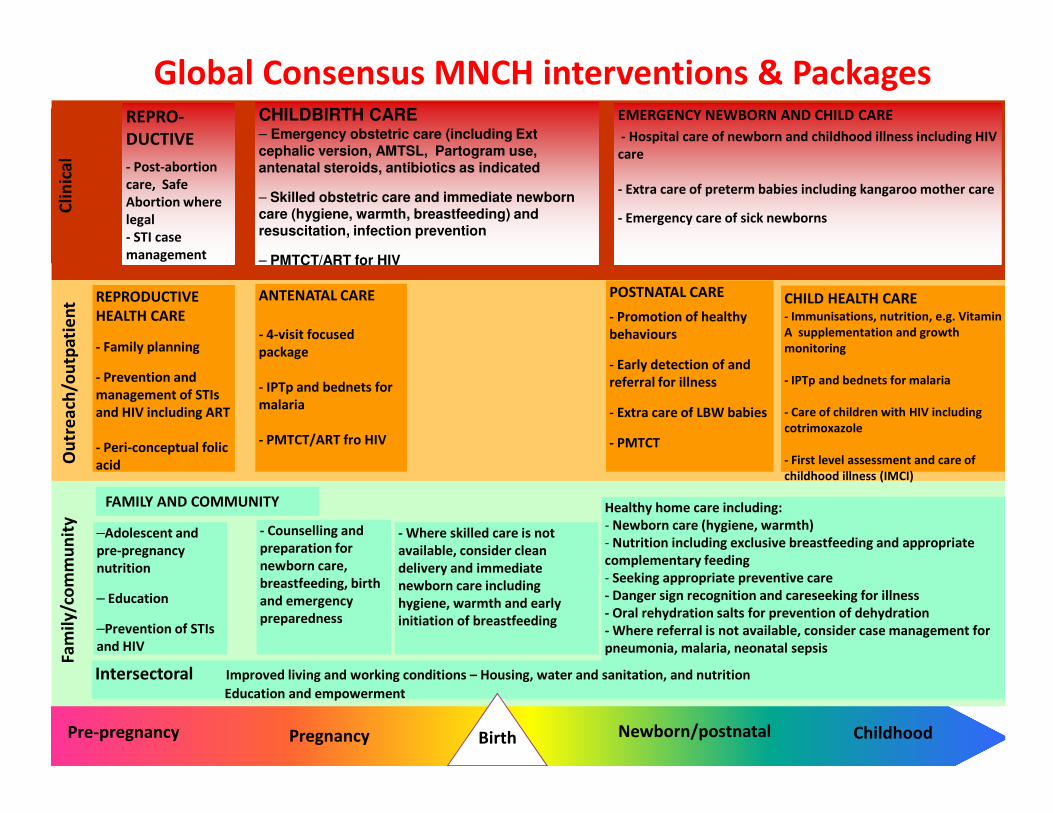
What can be done?

Ou
tre
ach
/ou
tpa
tie
nt
Cli
nic
al
ANTENATAL CARE
- 4-visit focused
package
- IPTp and bednets for
malaria
POSTNATAL CARE
- Promotion of healthy
behaviours
- Early detection of and
referral for illness
- Extra care of LBW babies
CHILD HEALTH CARE- Immunisations, nutrition, e.g. Vitamin
A supplementation and growth
monitoring
- IPTp and bednets for malaria
- Care of children with HIV including
CHILDBIRTH CARE– Emergency obstetric care (including Ext
cephalic version, AMTSL, Partogram use, antenatal steroids, antibiotics as indicated
– Skilled obstetric care and immediate newborn care (hygiene, warmth, breastfeeding) and resuscitation, infection prevention
– PMTCT/ART for HIV
EMERGENCY NEWBORN AND CHILD CARE
- Hospital care of newborn and childhood illness including HIV
care
- Extra care of preterm babies including kangaroo mother care
- Emergency care of sick newborns
REPRO-
DUCTIVE
- Post-abortion
care, Safe
Abortion where
legal
- STI case
management
REPRODUCTIVE
HEALTH CARE
- Family planning
- Prevention and
management of STIs
and HIV including ART
Global Consensus MNCH interventions & Packages
ChildhoodNewborn/postnatalPre-pregnancy Pregnancy
Fam
ily
/co
mm
un
ity
Ou
tre
ach
/ou
tpa
tie
nt
malaria
- PMTCT/ART fro HIV
- Extra care of LBW babies
- PMTCT
- Counselling and
preparation for
newborn care,
breastfeeding, birth
and emergency
preparedness
Healthy home care including:
- Newborn care (hygiene, warmth)
- Nutrition including exclusive breastfeeding and appropriate
complementary feeding
- Seeking appropriate preventive care
- Danger sign recognition and careseeking for illness
- Oral rehydration salts for prevention of dehydration
- Where referral is not available, consider case management for
pneumonia, malaria, neonatal sepsis
- Where skilled care is not
available, consider clean
delivery and immediate
newborn care including
hygiene, warmth and early
initiation of breastfeeding
–Adolescent and
pre-pregnancy
nutrition
– Education
–Prevention of STIs
and HIV
- Care of children with HIV including
cotrimoxazole
- First level assessment and care of
childhood illness (IMCI)
and HIV including ART
- Peri-conceptual folic
acid
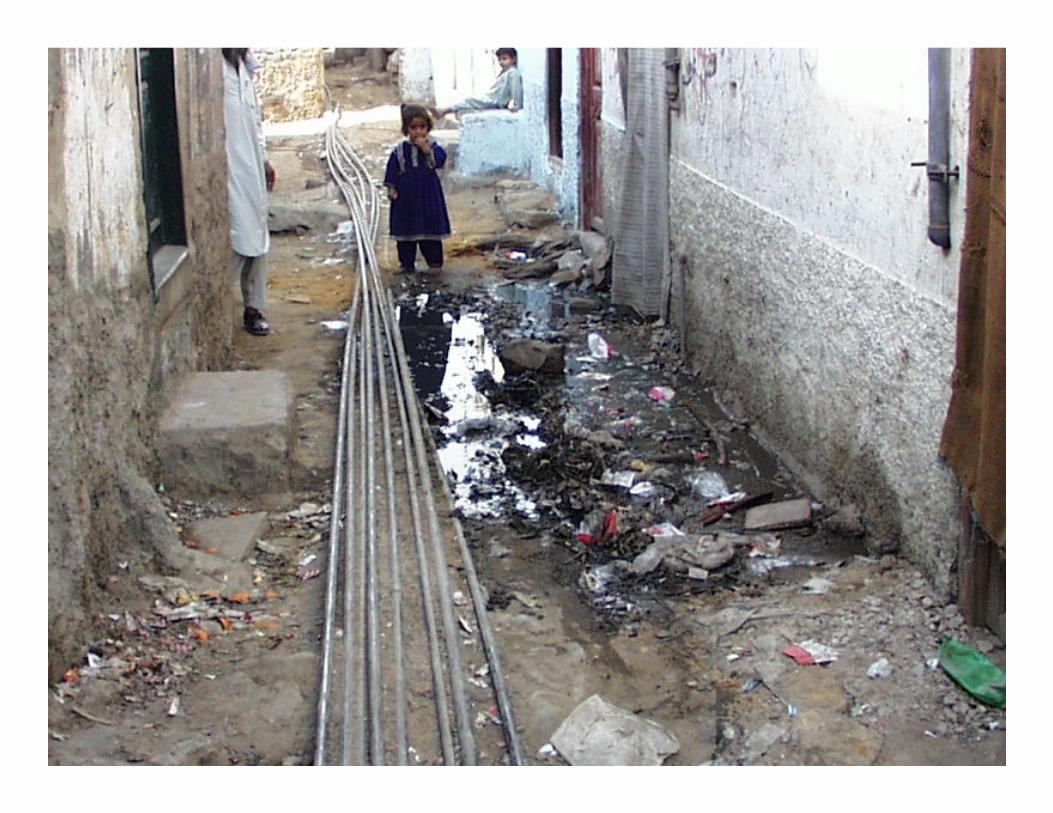
Intersectoral Improved living and working conditions – Housing, water and sanitation, and nutrition
Education and empowerment
Birth
FAMILY AND COMMUNITY
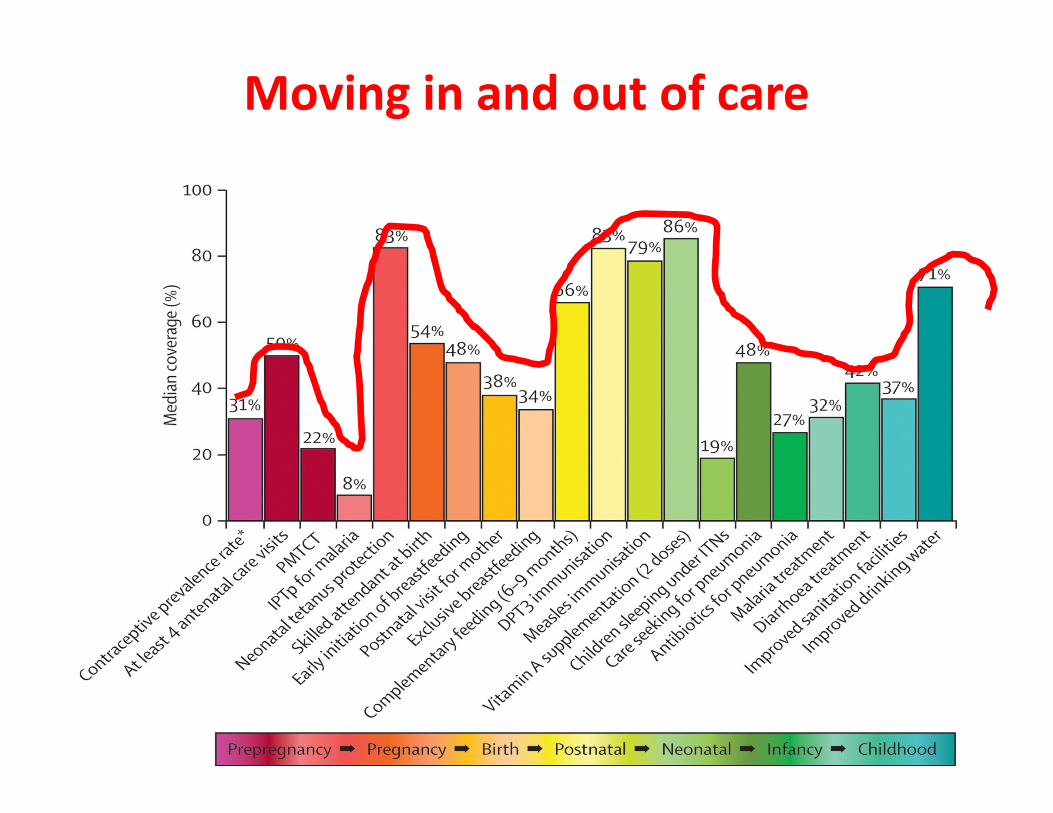
Moving in and out of care

Diarrhoea treatment
37
37
Sub-Saharan Africa
South Asia
Percentage of children under-five with diarrhoea receiving oral rehydration and continued feeding
39
55
39
Developing countries
East Asia and Pacific
Middle East and
North Africa
Source: UNICEF Global Databases, November 2010, based on Demographic and Health Surveys, Multiple
Indicator Cluster Surveys and other national surveys.
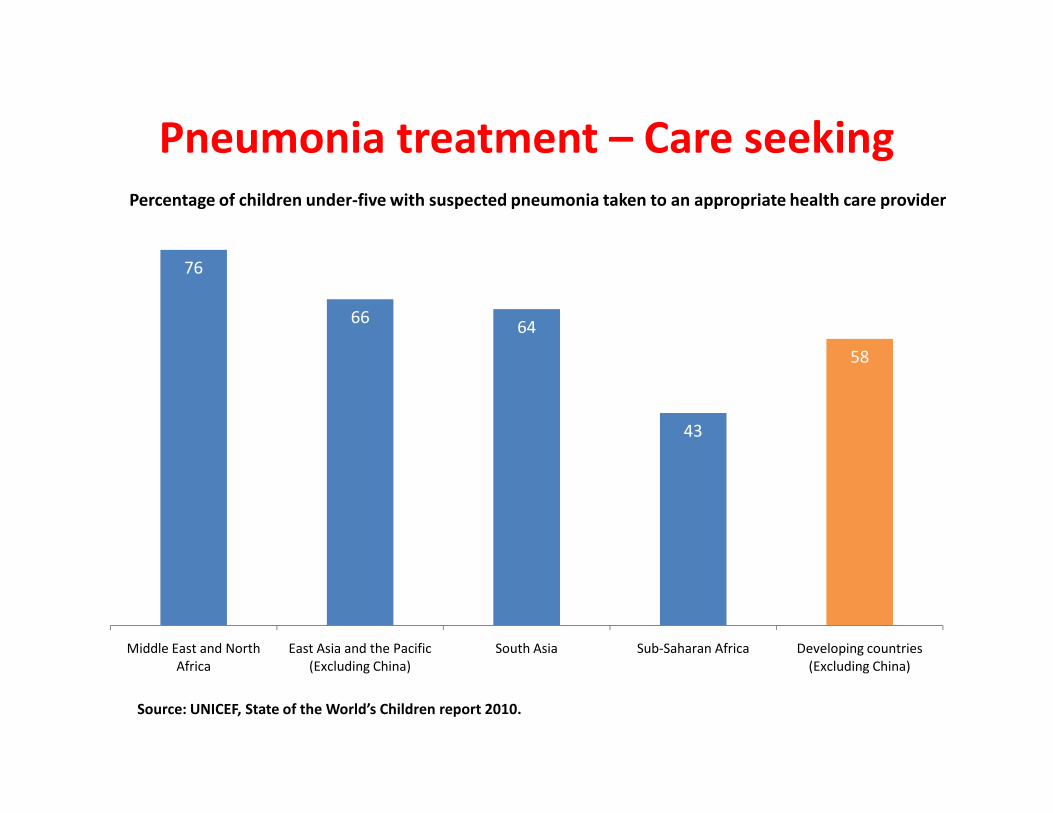
Pneumonia treatment – Care seeking
76
6664
58
Percentage of children under-five with suspected pneumonia taken to an appropriate health care provider
43
Middle East and North
Africa
East Asia and the Pacific
(Excluding China)
South Asia Sub-Saharan Africa Developing countries
(Excluding China)
Source: UNICEF, State of the World’s Children report 2010.

“The facts are always less than what really happened!”
Nadine Gordimer

50
60
70
Proportion of children aged 0-59 months with suspected pneumonia receiving antibiotics
Pneumonia treatment – antibiotics
0
10
20
30
40
DHS 2008 MICS 2008 DHS 2006-2007 DHS 2005-2006
Sierra Leone Mozambique Pakistan India
Poorest
Second
Middle
Fourth
Richest
Source: UNICEF Global Databases, November 2010, based on Demographic and Health Surveys, Multiple
Indicator Cluster Surveys and other national surveys.

Magnitude of inequities by intervention in 38 countries
Vitamin A administration (child)
Care seeking for pneumonia
ORT and continued feeding
Poorest Richest
0% 20% 40% 60% 80% 100%
Family planning needs satisfied
Antenatal care (4+ visits)
Skilled attendant at delivery
Postnatal visit
Insecticide-treated net use (child)
DPT3 vaccine
Measles vaccine
BCG vaccine
Coverage

Innovations
Community delivery platforms?Community delivery platforms?
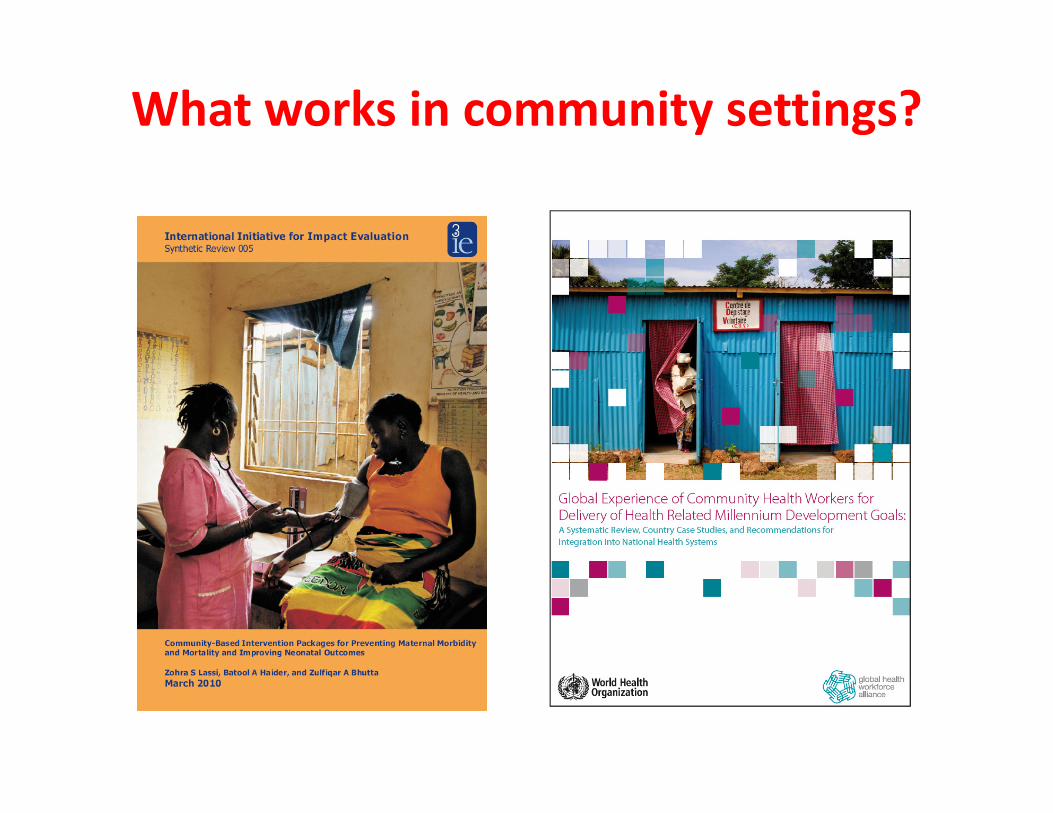
What works in community settings?
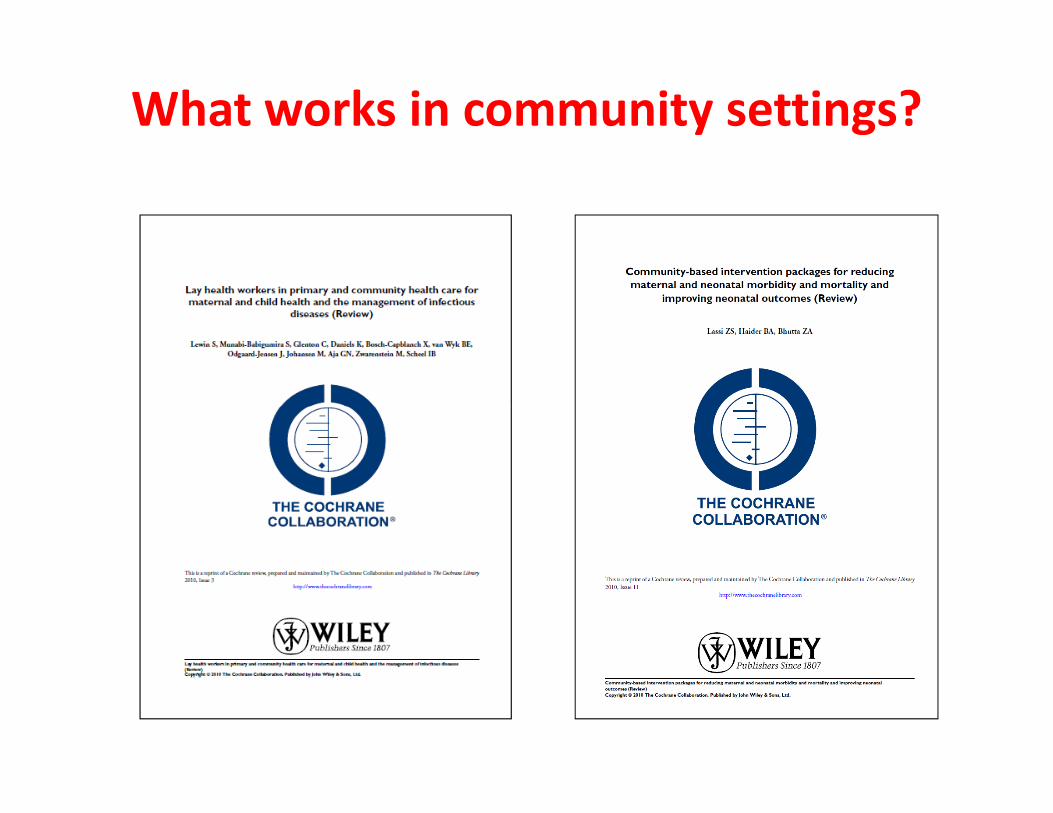
What works in community settings?
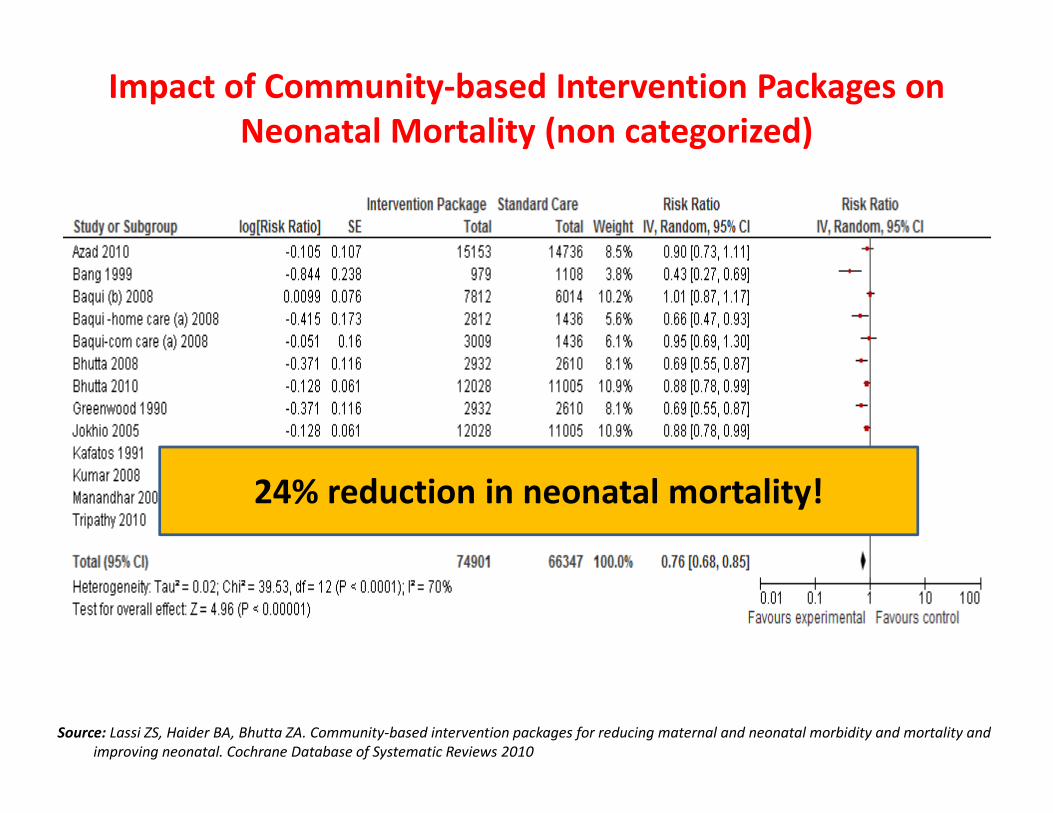
Impact of Community-based Intervention Packages on
Neonatal Mortality (non categorized)
Source: Lassi ZS, Haider BA, Bhutta ZA. Community-based intervention packages for reducing maternal and neonatal morbidity and mortality and
improving neonatal. Cochrane Database of Systematic Reviews 2010
24% reduction in neonatal mortality!
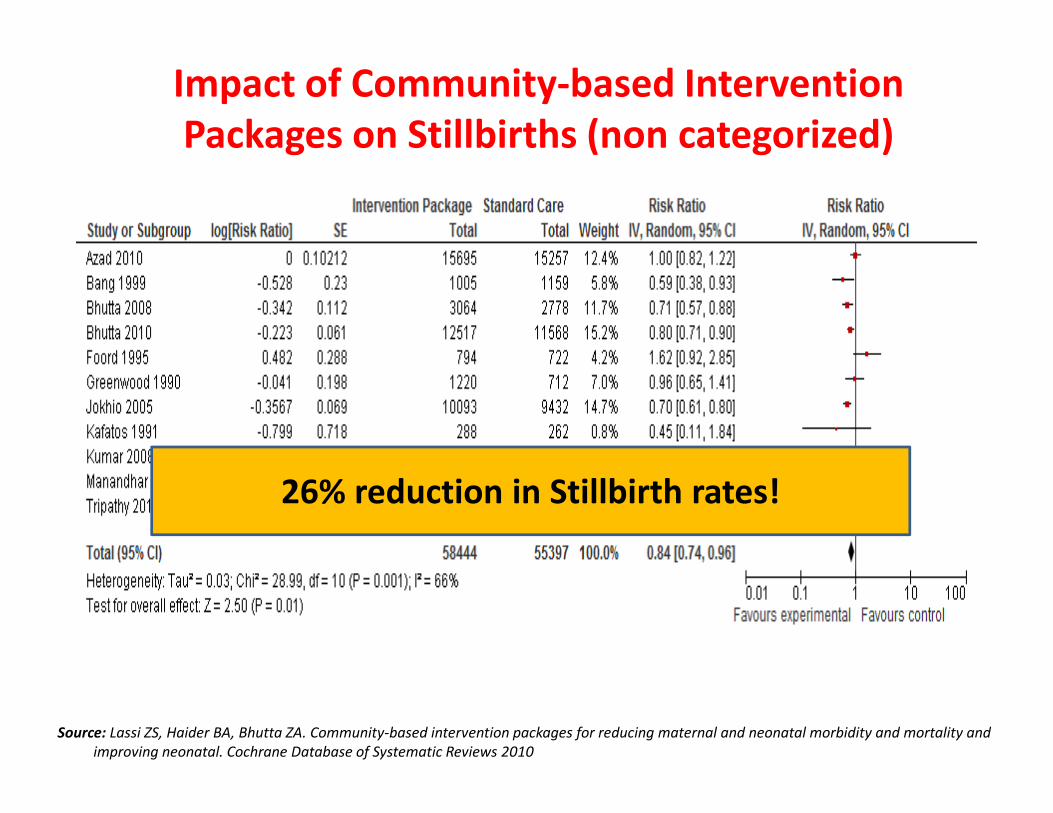
Impact of Community-based Intervention
Packages on Stillbirths (non categorized)
Source: Lassi ZS, Haider BA, Bhutta ZA. Community-based intervention packages for reducing maternal and neonatal morbidity and mortality and
improving neonatal. Cochrane Database of Systematic Reviews 2010
26% reduction in Stillbirth rates!
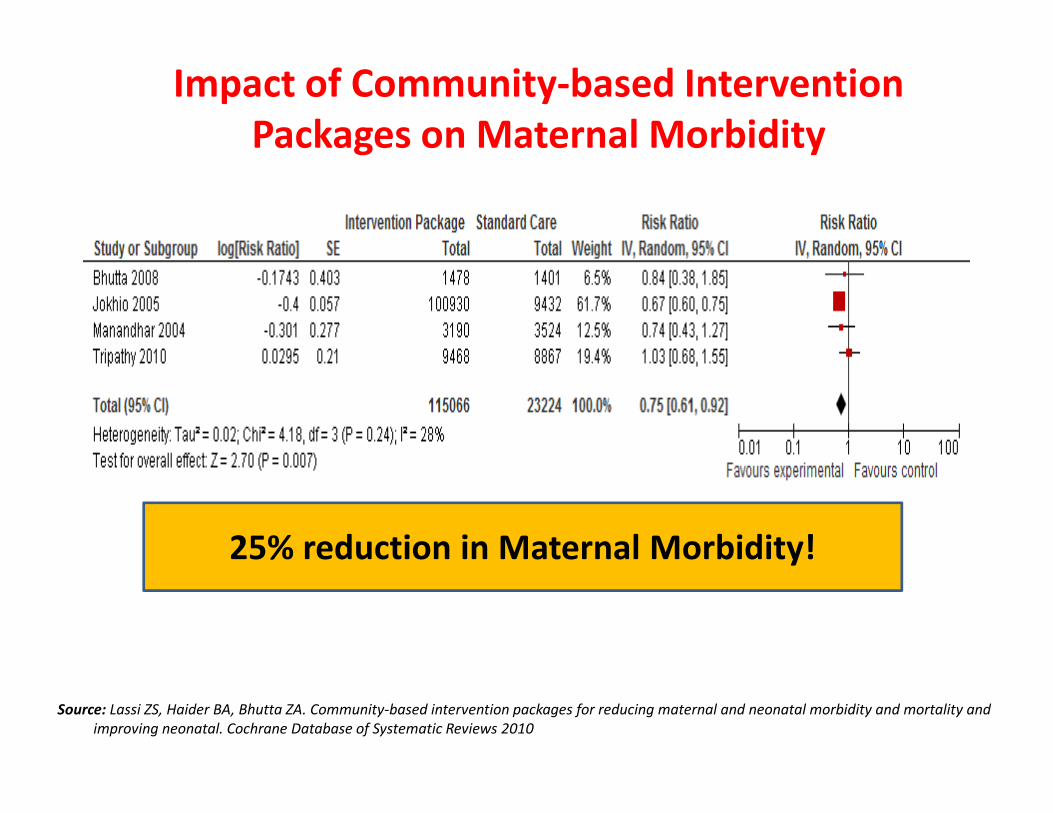
Impact of Community-based Intervention
Packages on Maternal Morbidity
Source: Lassi ZS, Haider BA, Bhutta ZA. Community-based intervention packages for reducing maternal and neonatal morbidity and mortality and
improving neonatal. Cochrane Database of Systematic Reviews 2010
25% reduction in Maternal Morbidity!

Impact of Community-based Intervention Packages on
Referrals to Health Facilities for Complications during
Pregnancy
Source: Lassi ZS, Haider BA, Bhutta ZA. Community-based intervention packages for reducing maternal and neonatal morbidity and mortality and
improving neonatal. Cochrane Database of Systematic Reviews 2010
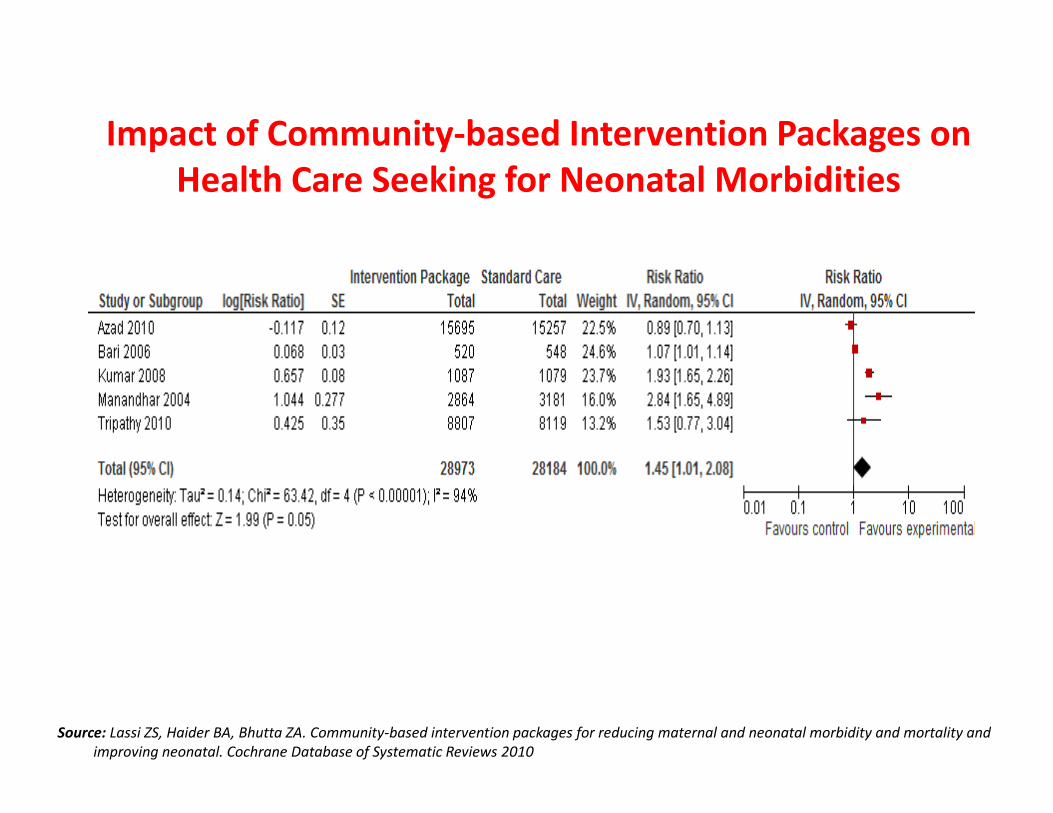
Impact of Community-based Intervention Packages on
Health Care Seeking for Neonatal Morbidities
Source: Lassi ZS, Haider BA, Bhutta ZA. Community-based intervention packages for reducing maternal and neonatal morbidity and mortality and
improving neonatal. Cochrane Database of Systematic Reviews 2010
Innovations
Using available human resources and
key technologies key technologies
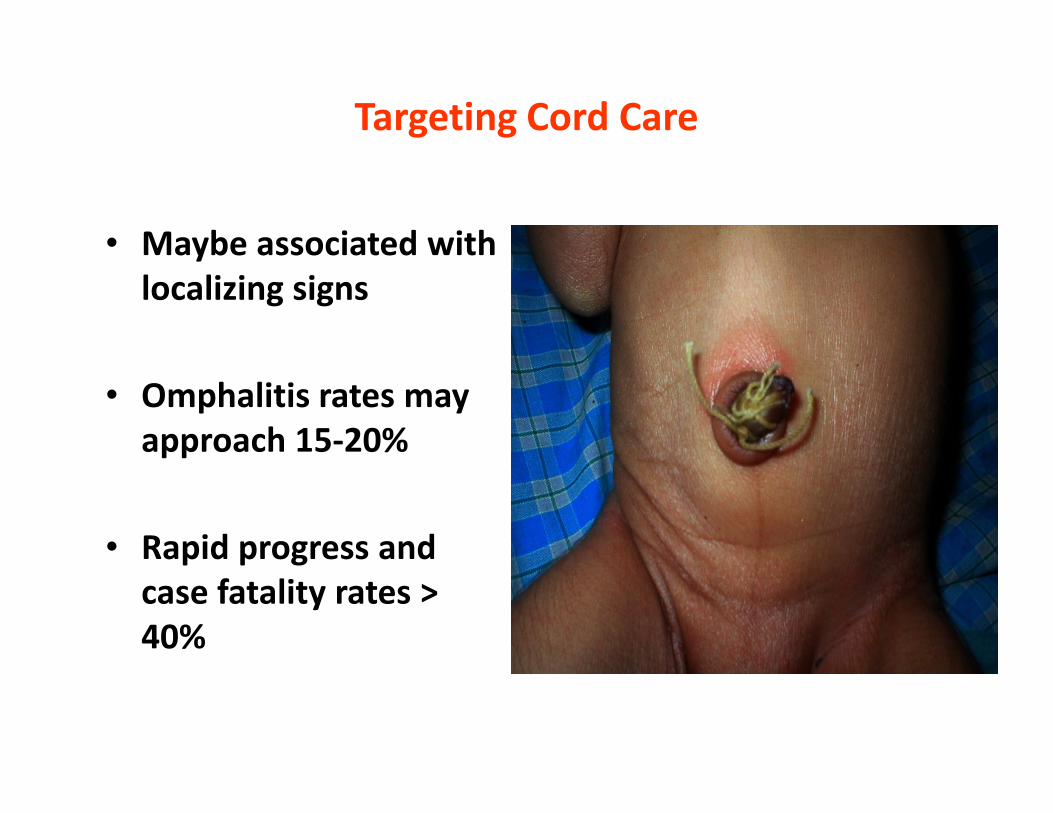
Targeting Cord Care
• Maybe associated with
localizing signs
• Omphalitis rates may • Omphalitis rates may
approach 15-20%
• Rapid progress and
case fatality rates >
40%
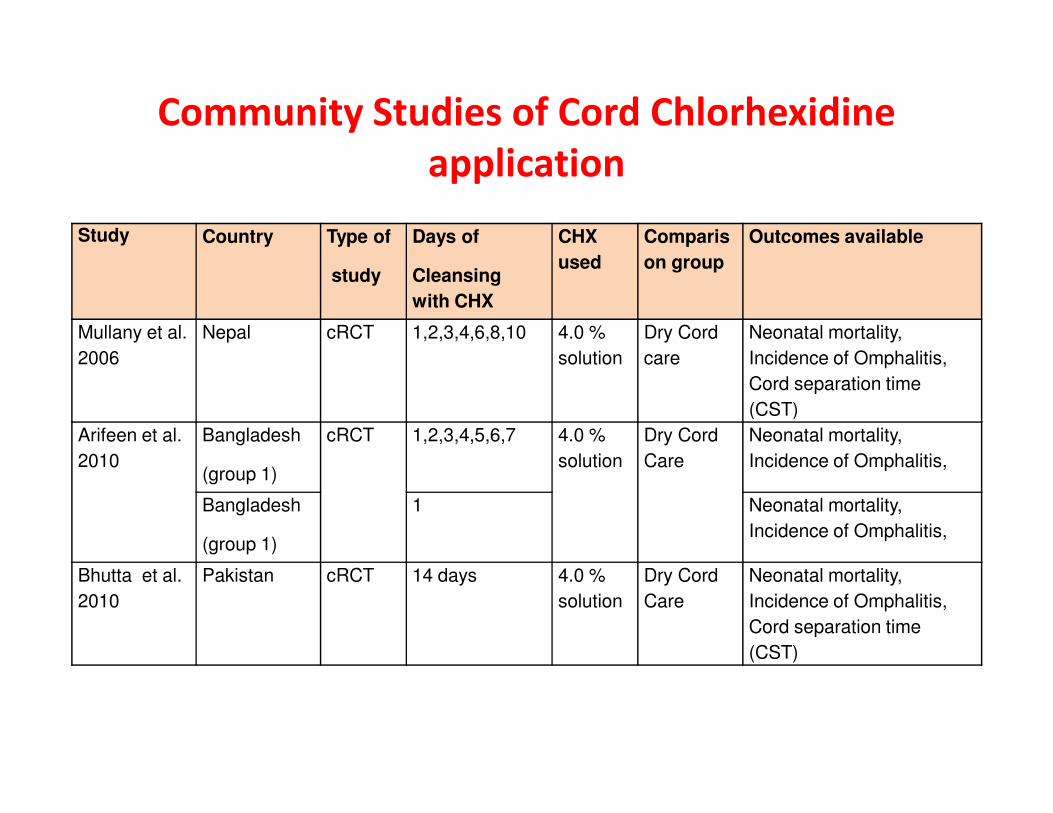
Community Studies of Cord Chlorhexidine
application
Study Country Type of
study
Days of
Cleansing
with CHX
CHX
used
Comparis
on group
Outcomes available
Mullany et al.
2006
Nepal cRCT 1,2,3,4,6,8,10 4.0 %
solution
Dry Cord
care
Neonatal mortality,
Incidence of Omphalitis,
Cord separation time
(CST)(CST)
Arifeen et al.
2010
Bangladesh
(group 1)
cRCT 1,2,3,4,5,6,7 4.0 %
solution
Dry Cord
Care
Neonatal mortality,
Incidence of Omphalitis,
Bangladesh
(group 1)
1 Neonatal mortality,
Incidence of Omphalitis,
Bhutta et al.
2010
Pakistan cRCT 14 days 4.0 %
solution
Dry Cord
Care
Neonatal mortality,
Incidence of Omphalitis,
Cord separation time
(CST)

Provision of Chlorhexidine in Clean Delivery
Kits for cord application
• Traditional Birth Attendants trained (2 day training program)
– To promote daily application of 4% CHX
for 14 days by family members. First
application after birth made by the TBA
– Promotion of practicing hand washing – Promotion of practicing hand washing
with antiseptic soap (esp; after toilet
use and before contact with naked
newborn) for at least two weeks in post
partum period.
• Provision & Replenishment of CDK (with or without 4 % CHX solution and / or soap) through TBAs in all clusters
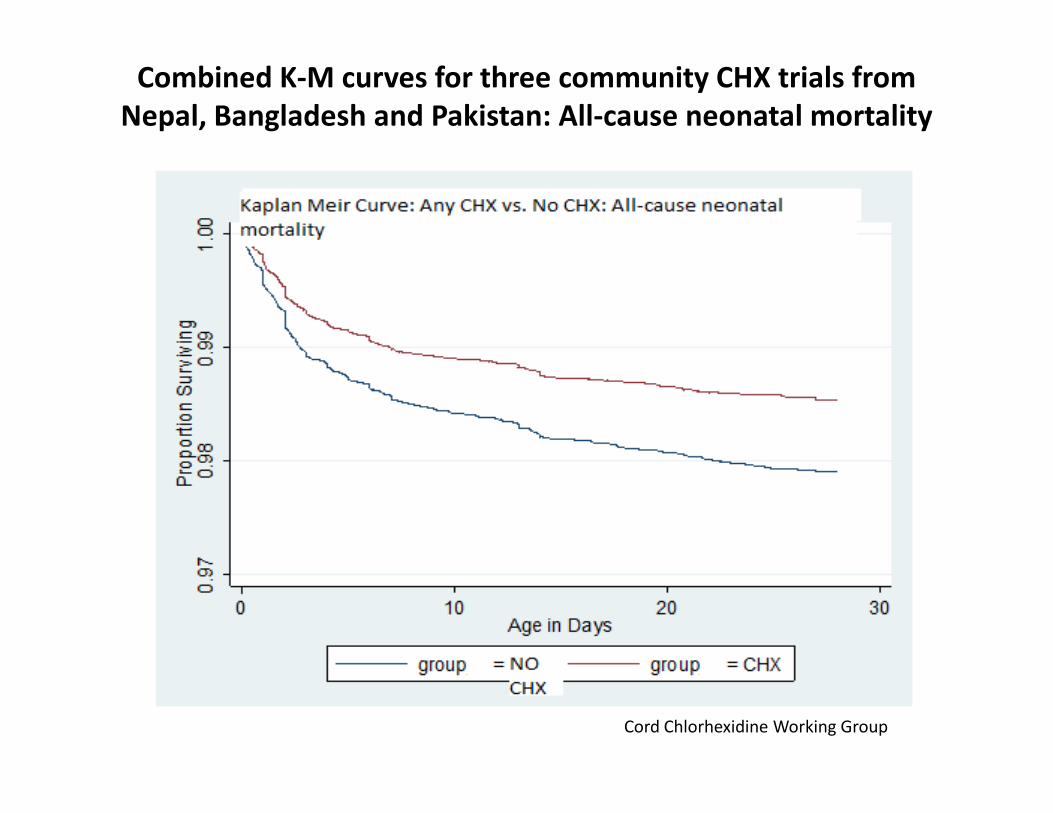
Combined K-M curves for three community CHX trials from
Nepal, Bangladesh and Pakistan: All-cause neonatal mortality
Cord Chlorhexidine Working Group
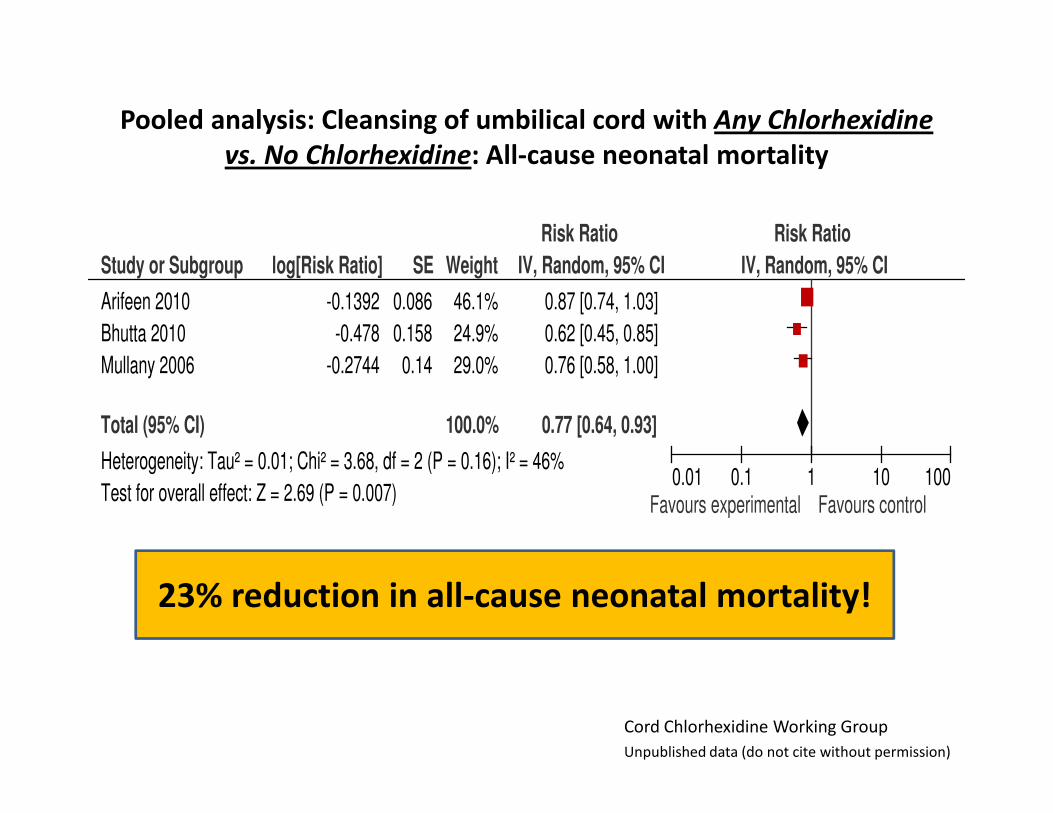
Pooled analysis: Cleansing of umbilical cord with Any Chlorhexidine
vs. No Chlorhexidine: All-cause neonatal mortality
Study or Subgroup
Arifeen 2010
Bhutta 2010
Mullany 2006
log[Risk Ratio]
-0.1392
-0.478
-0.2744
SE
0.086
0.158
0.14
Weight
46.1%
24.9%
29.0%
IV, Random, 95% CI
0.87 [0.74, 1.03]
0.62 [0.45, 0.85]
0.76 [0.58, 1.00]
Risk Ratio Risk Ratio
IV, Random, 95% CI
Total (95% CI)
Heterogeneity: Tau² = 0.01; Chi² = 3.68, df = 2 (P = 0.16); I² = 46%
Test for overall effect: Z = 2.69 (P = 0.007)
100.0% 0.77 [0.64, 0.93]
0.01 0.1 1 10 100Favours experimental Favours control
Cord Chlorhexidine Working Group
Unpublished data (do not cite without permission)
23% reduction in all-cause neonatal mortality!

Innovations
Removing financial barriers through
conditional cash transfers?conditional cash transfers?
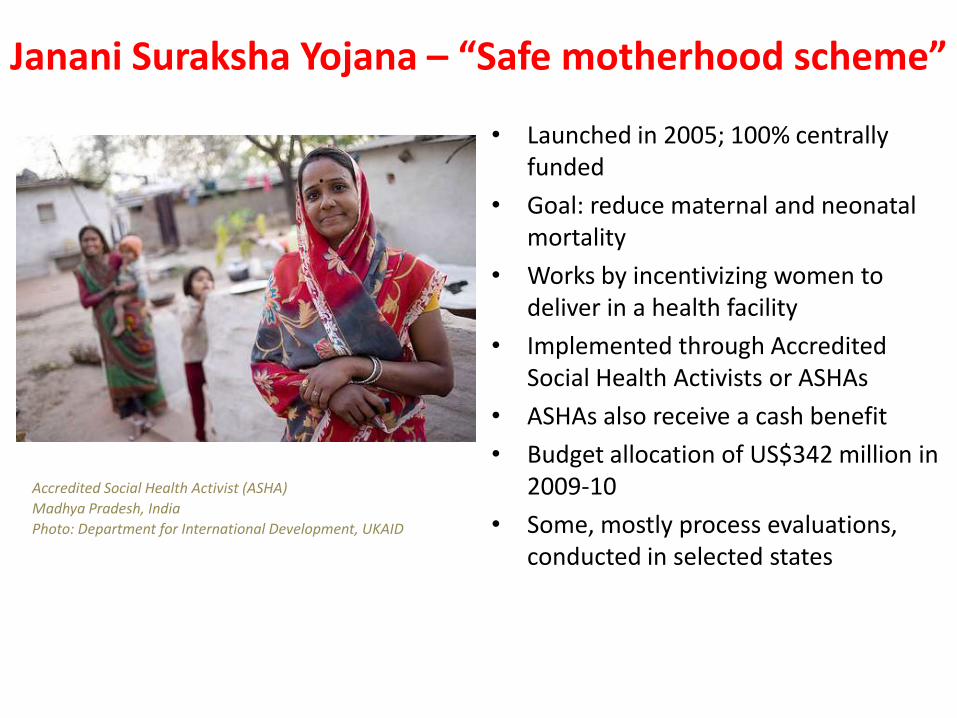
Janani Suraksha Yojana – “Safe motherhood scheme”
• Launched in 2005; 100% centrally funded
• Goal: reduce maternal and neonatal mortality
• Works by incentivizing women to deliver in a health facility
• Implemented through Accredited Social Health Activists or ASHAs
• ASHAs also receive a cash benefit
• Budget allocation of US$342 million in 2009-10
• Some, mostly process evaluations, conducted in selected states
Accredited Social Health Activist (ASHA)
Madhya Pradesh, India
Photo: Department for International Development, UKAID
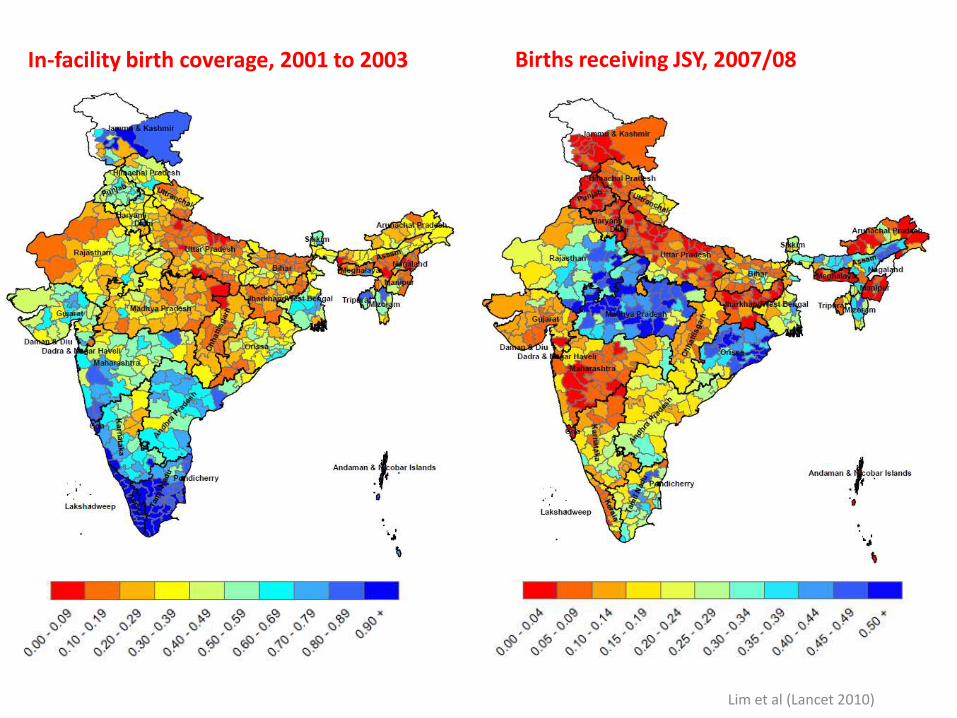
In-facility birth coverage, 2001 to 2003 Births receiving JSY, 2007/08
Lim et al (Lancet 2010)

State-level uptake by location of birth
Lim et al (2010)
0,00
0,05
0,10
0,15
0,20
0,25
0,30
0,35
0,40
0,45
0,50
% J
SY
JSY, out of facility
JSY, in-facility

Impact on mortality, national level
Perinatal mortality Stillbirth/neonatal mortality
OR P-value OR P-value
Matching 0.72 0.000 0.74 0.000
Before-after 0.70 0.000 0.75 0.000
Odds Ratios: JSY/no JSY

Whether or not knowledge is global, the use of knowledge is always local
Photo: UNICEF

… and innovations are not a substitute for national policies and implementation

Infant mortality by region, Brazil
Infant mortality rate, 2000
Cedeplar/UNDP, Brazil
Infant mortality is highest in the Northeast and North
Source: UNDP Brazil

Family health program, Brazil
Brazil MOH
Pro-poor dissemination strategy resulted in higher coverage in the most deprived areas of the country
Source: Ministry of Health, Brazil

43
0
10
20
30
40
50
60
70
80
1990
1991
1992
1993
1994
1995
1996
1997
1998
1999
2000
2001
2002
2003
2004
2005
2006
2007
Infa
nt m
ort
alit
y r
ate
x 1
00
0 liv
eb
irth
s
North Northeast Southeast South Central - West
Brazil: regional inequalities in infant mortality
Source: Barros et al, AJPH 2010 / MoH
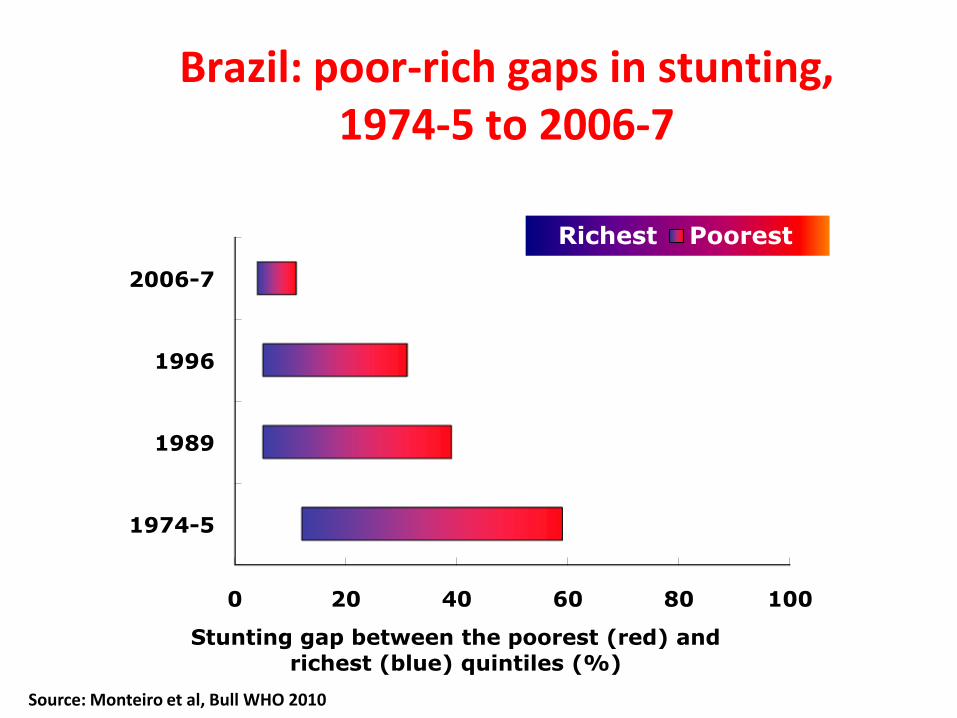
Source: Monteiro et al, Bull WHO 2010.
Brazil: poor-rich gaps in stunting,1974-5 to 2006-7
0 20 40 60 80 100
1974-5
1989
1996
2006-7
Stunting gap between the poorest (red) and
richest (blue) quintiles (%)
Richest Poorest
Source: Monteiro et al, Bull WHO 2010

Source: New analyses
0% 20% 40% 60% 80% 100%
Contraceptive use
Skilled birth attendant
Antenatal care (4+)
Safe water
Poorest Richest
2006
1996
2006
1996
2006
1996
2006
1996
Brazil: poor-rich gaps in coverage1996 and 2006-7
Source: Barros et al, AJPH 2010 / DHS

…. Yet challenges remain!

Poorest 2nd 3rd 4th Richest
1 30 2
99 95
0
20
40
60
80
100
1995 2008
6130
4
94
83
0
20
40
60
80
100
1995 2008
17
320
4
83
64
0
20
40
60
80
100
1995 2008
44
75
0
556
20
0
20
40
60
80
100
1995 2008
94 94
0 46 2
0
20
40
60
80
100
1995 2008
India
Low coverage – Progress is highly inequitablePoorest 40% made little progress; large inequities
Special tabulation UNICEF, 2010 based on India NFHS 1993, 1999, 2006
1995-2008 trend analysis of sanitation practices by wealth quintiles, India, national
Improved and shared sanitation facilities Unimproved sanitation facilities Open defecation

Global contraceptive use
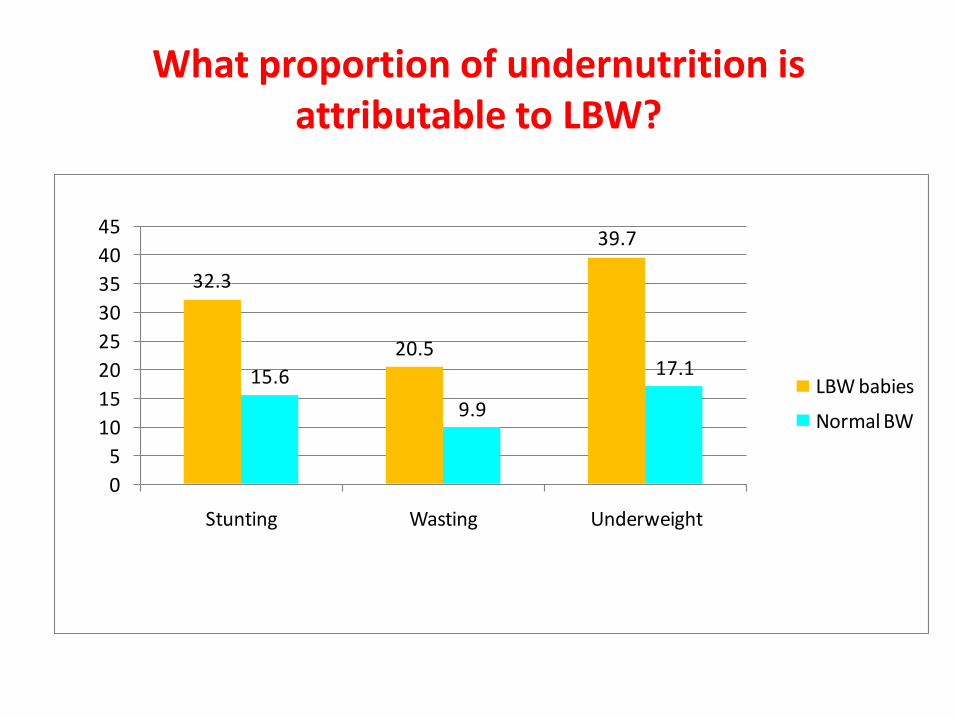
What proportion of undernutrition is attributable to LBW?
32.3
20.5
39.7
15.6
9.9
17.1
0
5
10
15
20
25
30
35
40
45
Stunting Wasting Underweight
LBW babies
Normal BW

32%
41%37%
69%
51%
58%
85%
73% 75%
49%53%
50%
0%
20%
40%
60%
80%
100%
Africa Asia Developing world
Exclusive breastfeeding (0-5 months)
Complementary feeding (6-9 months)
Continued breastfeeding (12-15 months)
Continued breastfeeding (20-23 months)
Infant and Young Child Feeding (IYCF) Practices in Africa, Asia and Developing World
Source: PFC 2010.

Disparities in Early Vocabulary Growth