Embed Size (px)
Citation preview
Global Market Trends & Traps
Produced by: Robert Parker, Senior Advisor, Credit Suisse March 2010
Slide 2
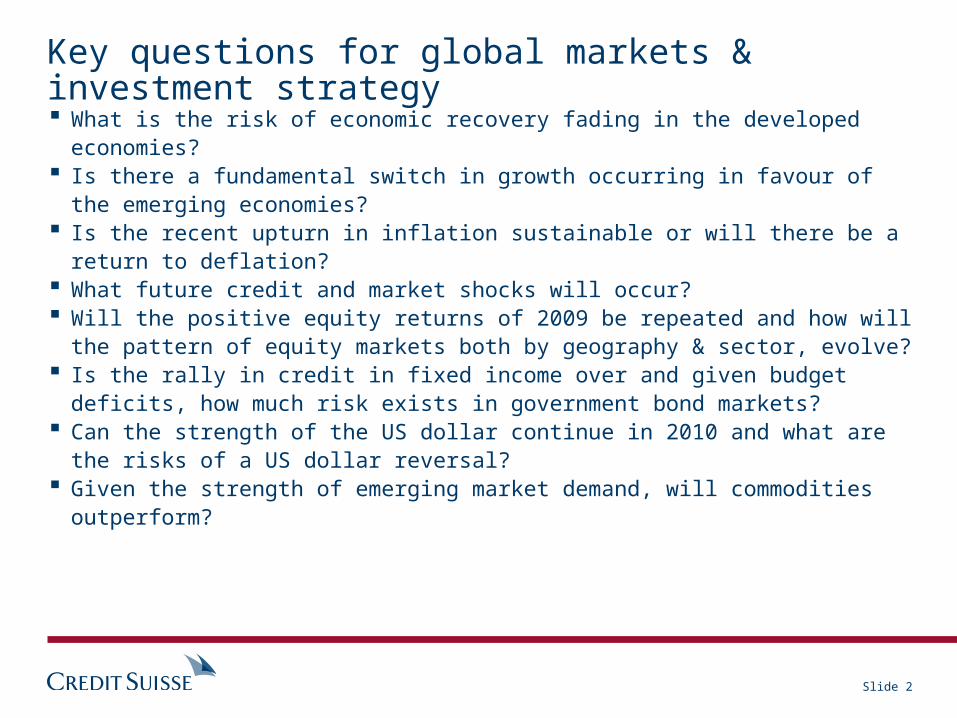
Key questions for global markets & investment strategy What is the risk of economic recovery fading in the developed
economies? Is there a fundamental switch in growth occurring in favour of the
emerging economies? Is the recent upturn in inflation sustainable or will there be a return to
deflation? What future credit and market shocks will occur? Will the positive equity returns of 2009 be repeated and how will the
pattern of equity markets both by geography & sector, evolve? Is the rally in credit in fixed income over and given budget deficits, how
much risk exists in government bond markets? Can the strength of the US dollar continue in 2010 and what are the
risks of a US dollar reversal? Given the strength of emerging market demand, will commodities
outperform?
Slide 3
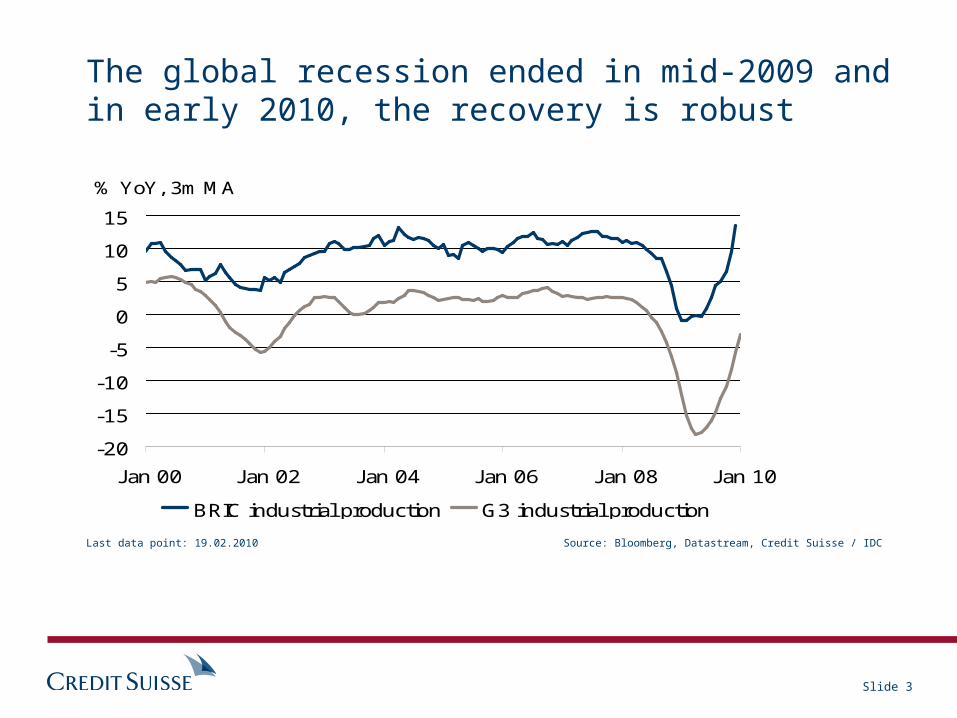
The global recession ended in mid-2009 and in early 2010, the recovery is robust
-20
-15
-10
-5
0
5
10
15
J an 00 J an 02 J an 04 J an 06 J an 08 J an 10
BRIC industrial production G3 industrial production
% YoY, 3m MA
Source: Bloomberg, Datastream, Credit Suisse / IDCLast data point: 19.02.2010
Slide 4
-4.0
-3.0
-2.0
-1.0
0
1.0
2.0
3.0
4.0
5.0
6.0
Feb 98 Feb 00 Feb 02 Feb 04 Feb 06 Feb 08
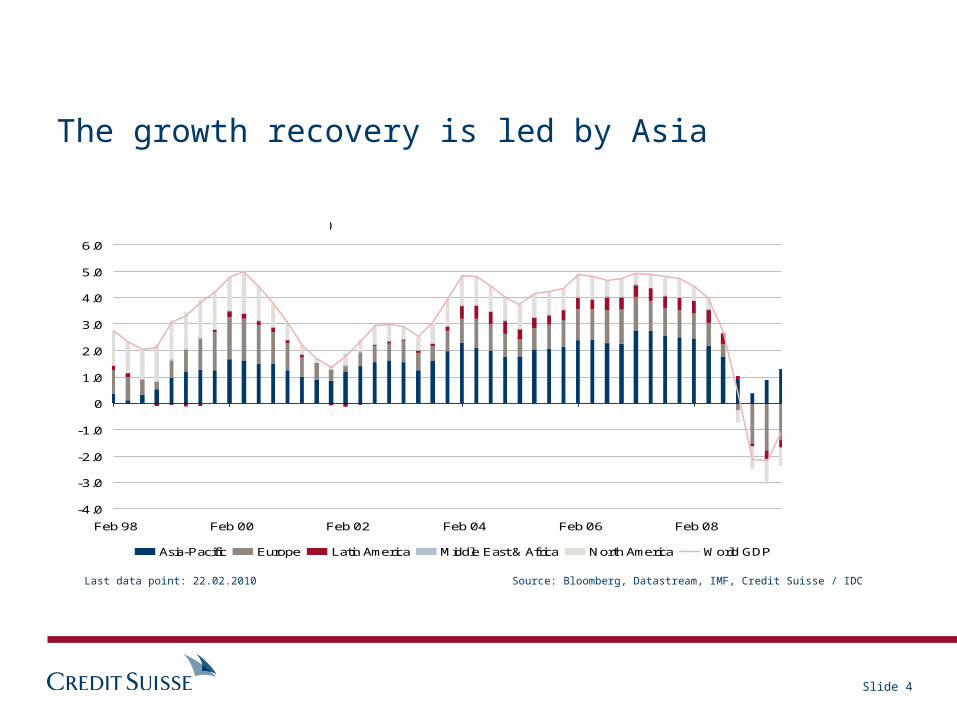
Asia-Pacific Europe Latin America Middle East & Africa North America World GDP
Contribution to YoY World GDP Growth (%)
The growth recovery is led by Asia
Last data point: 22.02.2010 Source: Bloomberg, Datastream, IMF, Credit Suisse / IDC
Slide 5
-3.0-2.0-1.0
01.02.03.04.05.06.0
J an 98 J an 01 J an 04 J an 07 J an 10
25
30
35
40
45
50
55
60
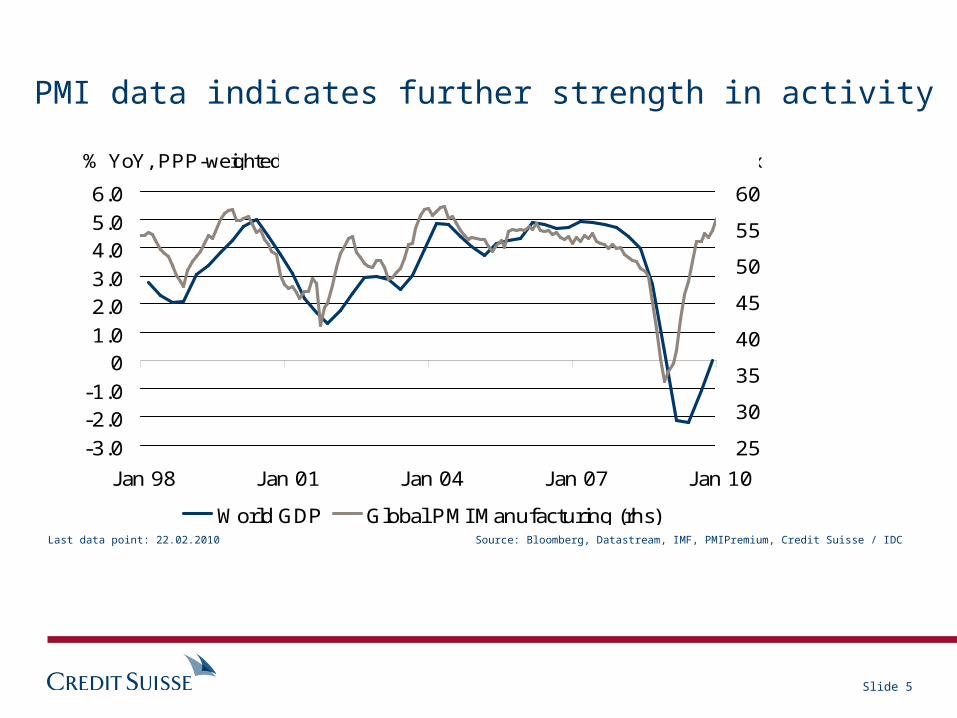
World GDP Global PMI Manufacturing (rhs)
% YoY, PPP-weighted Index
PMI data indicates further strength in activity
Last data point: 22.02.2010 Source: Bloomberg, Datastream, IMF, PMIPremium, Credit Suisse / IDC

Slide 6
25
30
35
40
45
50
55
60
J an 07 J ul 07 J an 08 J ul 08 J an 09 J ul 09 J an 10
China PMI Eurozone PMI UK PMI J apan PMI US PMI
In the next six months, the UK and the Eurozone PMI’s should lag the US & Asia
Last data point: 22.02.2010 Source: Bloomberg, Credit Suisse / IDC

Slide 7
-3-2-10123456
J an 00 J an 02 J an 04 J an 06 J an 08
EMU CPI J P CPI US CPI CH CPI
% YoY
Japan still has deflation, while inflation in the US & Europe is peaking
Source: Bloomberg, Credit Suisse / IDCLast data point: 31.01.2010

Slide 8
0
20
40
60
80
100
120
140
160
FED ECB BOJ BOE BOC RBA RBNZ SNB
Cumulative interest rate expectations over 12 months, current
in bp
Cumulative interest rate expectations over 12 months
Source: Bloomberg, Credit Suisse / IDCLast data point: 19.02.2010
In the US and Europe, interest rate tightening will be slow. Japan will not raise rates
Slide 9
50
100
150
200
250
300
350
J an 07 J ul 07 J an 08 J ul 08 J an 09 J ul 09 J an 10
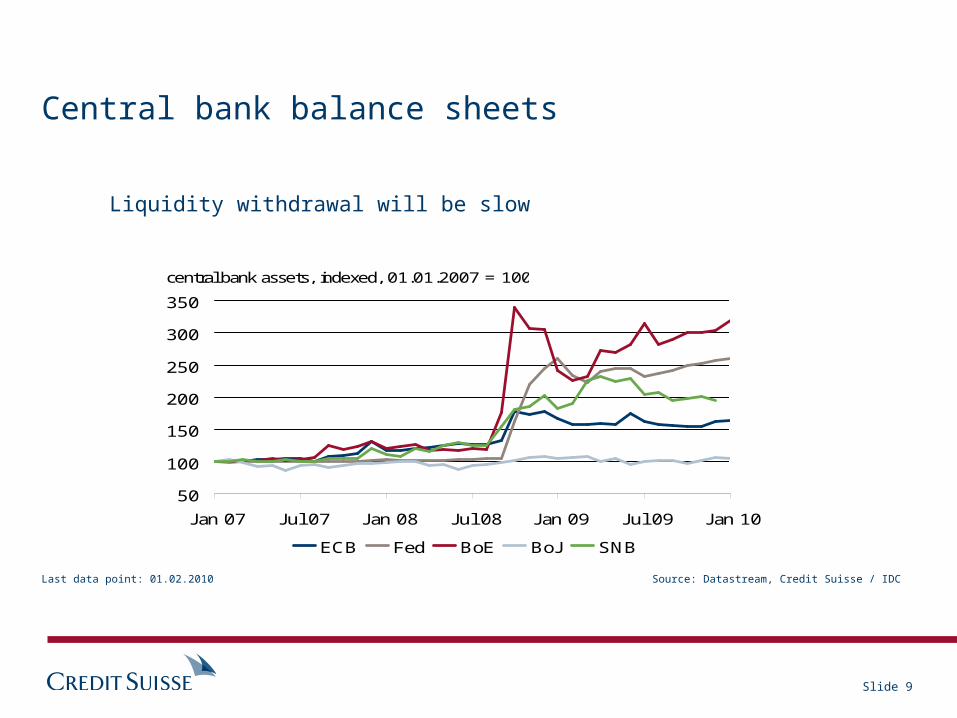
ECB Fed BoE BoJ SNB
central bank assets, indexed, 01.01.2007 = 100
Central bank balance sheets
Liquidity withdrawal will be slow
Source: Datastream, Credit Suisse / IDCLast data point: 01.02.2010
Slide 10
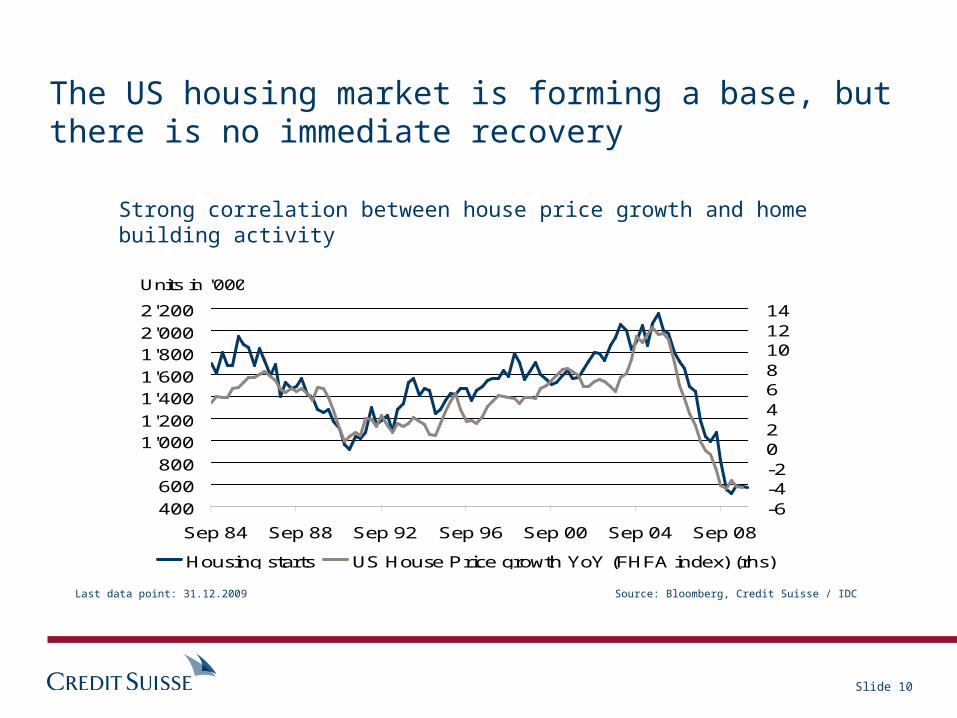
400600800
1'0001'2001'4001'6001'8002'0002'200
Sep 84 Sep 88 Sep 92 Sep 96 Sep 00 Sep 04 Sep 08
-6-4-202468101214
Housing starts US House Price growth YoY (FHFA index) (rhs)
Units in '000 % YoY
The US housing market is forming a base, but there is no immediate recovery
Strong correlation between house price growth and home building activity
Source: Bloomberg, Credit Suisse / IDCLast data point: 31.12.2009
Slide 11
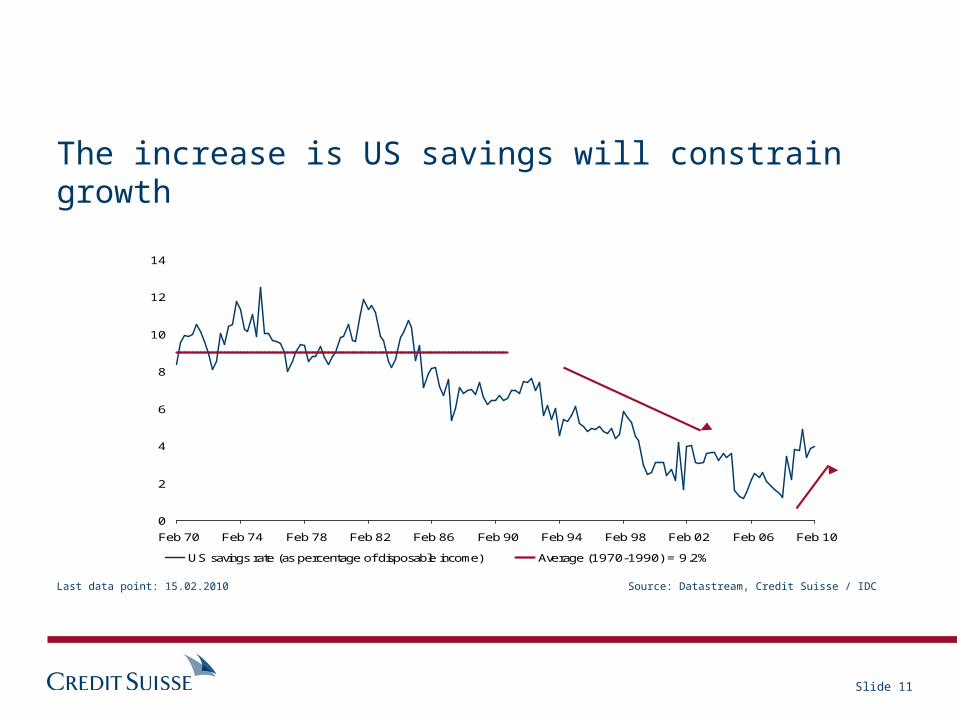
0
2
4
6
8
10
12
14
Feb 70 Feb 74 Feb 78 Feb 82 Feb 86 Feb 90 Feb 94 Feb 98 Feb 02 Feb 06 Feb 10
US savings rate (as percentage of disposable income) Average (1970-1990) = 9.2%
%
The increase is US savings will constrain growth
Source: Datastream, Credit Suisse / IDCLast data point: 15.02.2010
Slide 12
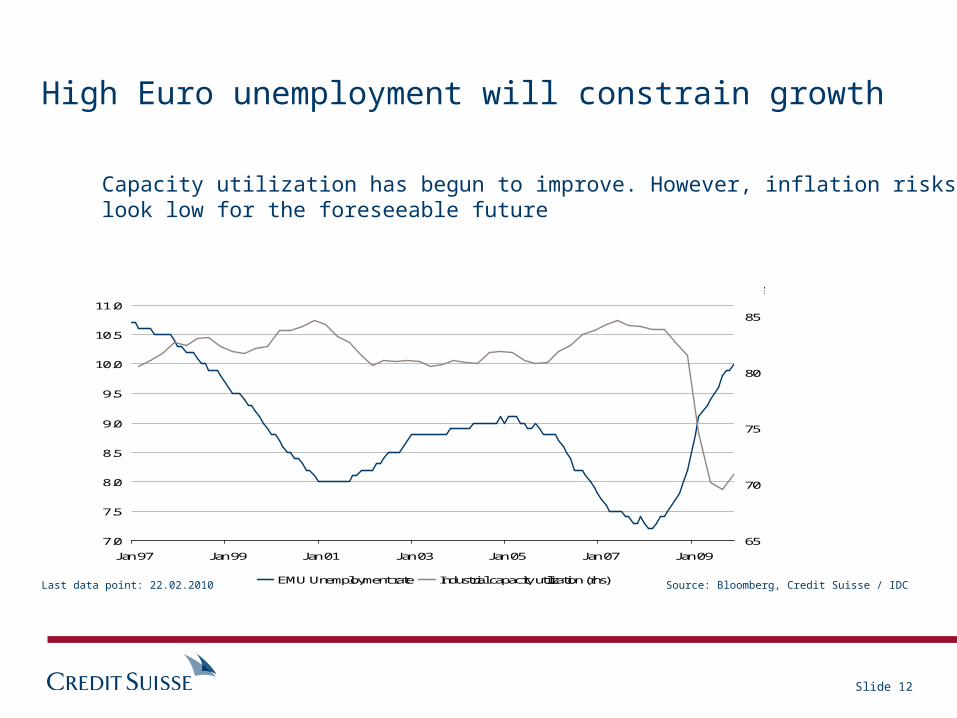
7.0
7.5
8.0
8.5
9.0
9.5
10.0
10.5
11.0
Jan 97 Jan 99 Jan 01 Jan 03 Jan 05 Jan 07 Jan 09
65
70
75
80
85
EMU Unemployment rate Industrial capacity utilization (rhs)
in % in %
High Euro unemployment will constrain growth
Capacity utilization has begun to improve. However, inflation risks look low for the foreseeable future
Source: Bloomberg, Credit Suisse / IDCLast data point: 22.02.2010
Slide 13
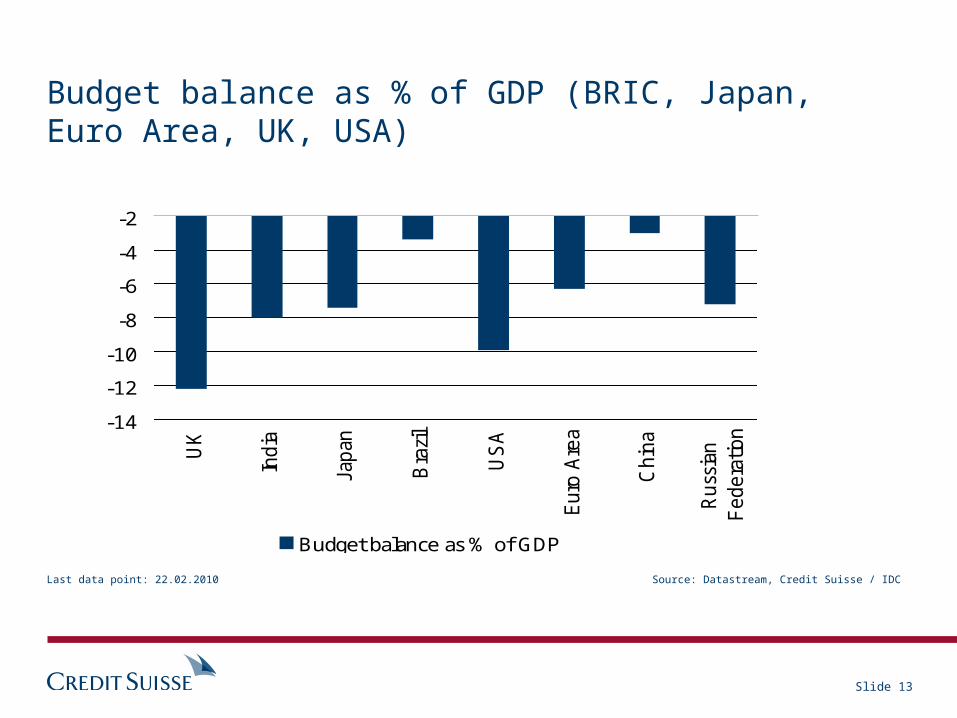
-14
-12
-10
-8
-6
-4
-2U
K
Indi
a
Japa
n
Bra
zil
USA
Eur
o Are
a
Chi
na
Rus
sian
Fed
erat
ion
Budget balance as % of GDP
Budget balance as % of GDP (BRIC, Japan, Euro Area, UK, USA)
Source: Datastream, Credit Suisse / IDCLast data point: 22.02.2010
Slide 14
0
200
400
600
800
1'000
1'200
1'400
1'600
Mar 98 Mar 00 Mar 02 Mar 04 Mar 06 Mar 08
to China to US
bn J PY
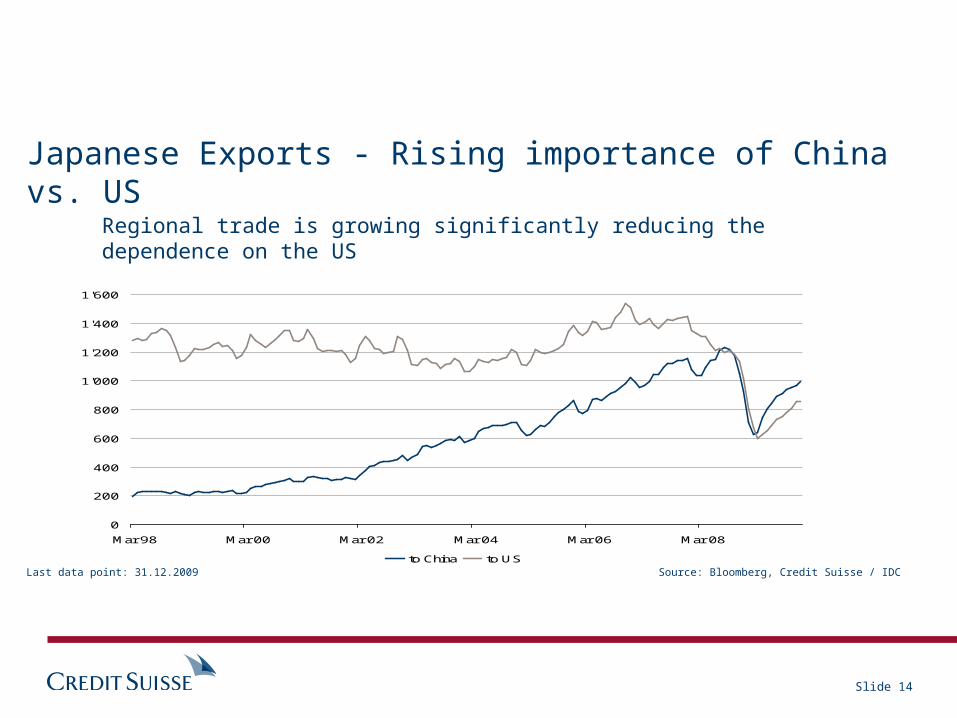
Japanese Exports - Rising importance of China vs. US
Regional trade is growing significantly reducing the dependence on the US
Source: Bloomberg, Credit Suisse / IDCLast data point: 31.12.2009
Slide 15
0
2
4
6
8
10
12
14
16
18
J an 97 J an 00 J an 03 J an 06 J an 09
lending rate, 1Y deposit rate, 1Y reserve requirement ratio
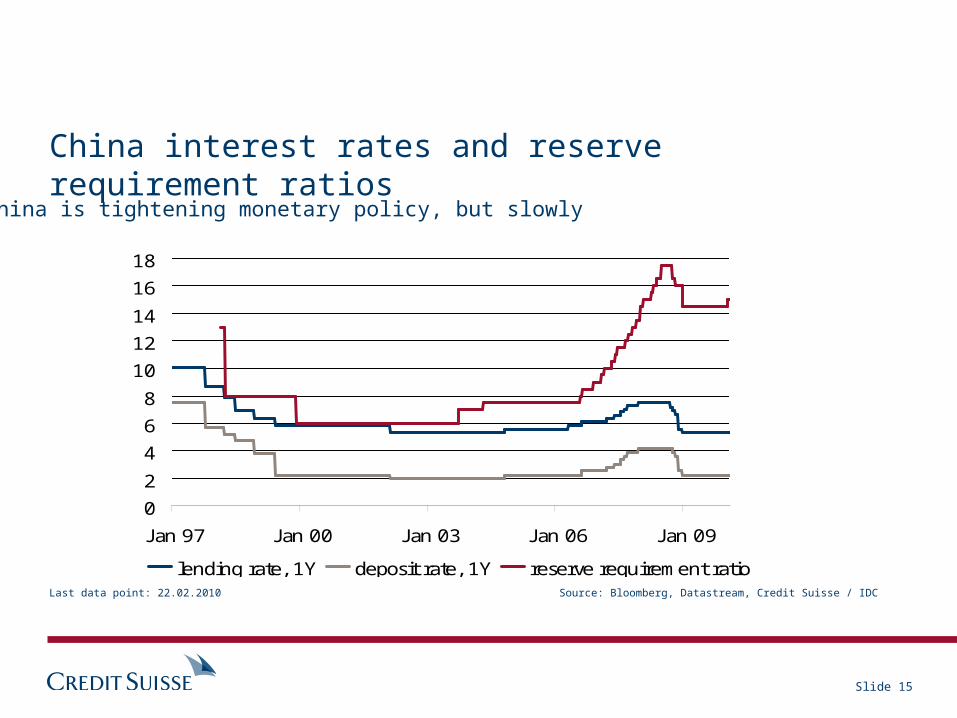
China interest rates and reserve requirement ratios
Source: Bloomberg, Datastream, Credit Suisse / IDCLast data point: 22.02.2010
China is tightening monetary policy, but slowly
Slide 16
500
600
700
800
900
1'000
1'100
1'200
1'300
Dec 99 Dec 01 Dec 03 Dec 05 Dec 07 Dec 09
MSCI World lc
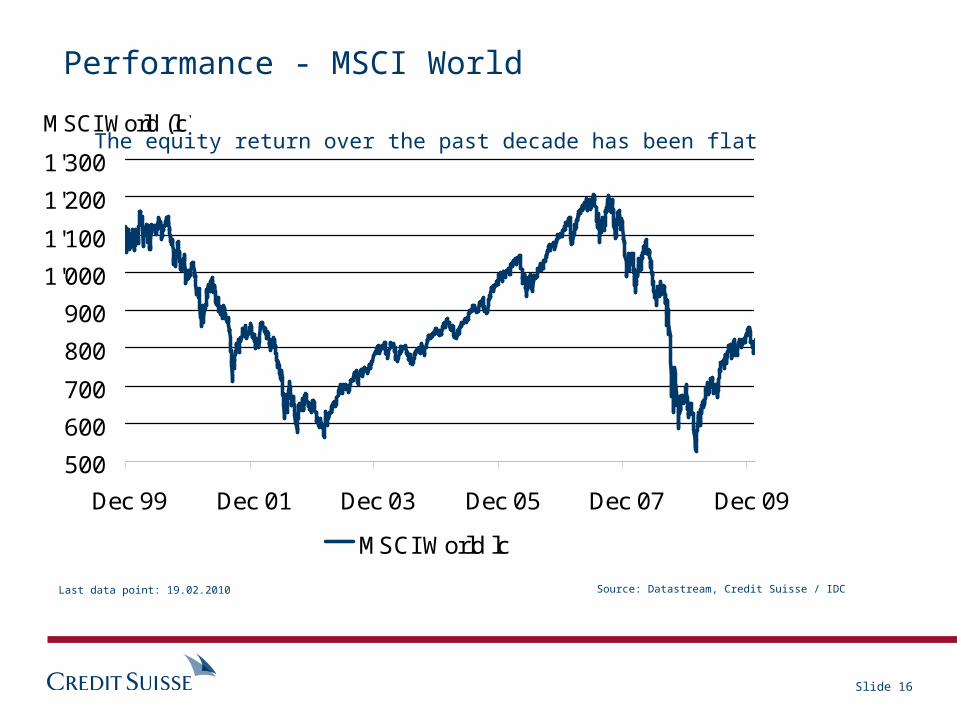
MSCI World (lc)
Performance - MSCI World
Source: Datastream, Credit Suisse / IDCLast data point: 19.02.2010
The equity return over the past decade has been flat
Slide 17
-6
-4
-2
0
2
4
6
8
J un 03 J un 04 J un 05 J un 06 J un 07 J un 08 J un 09
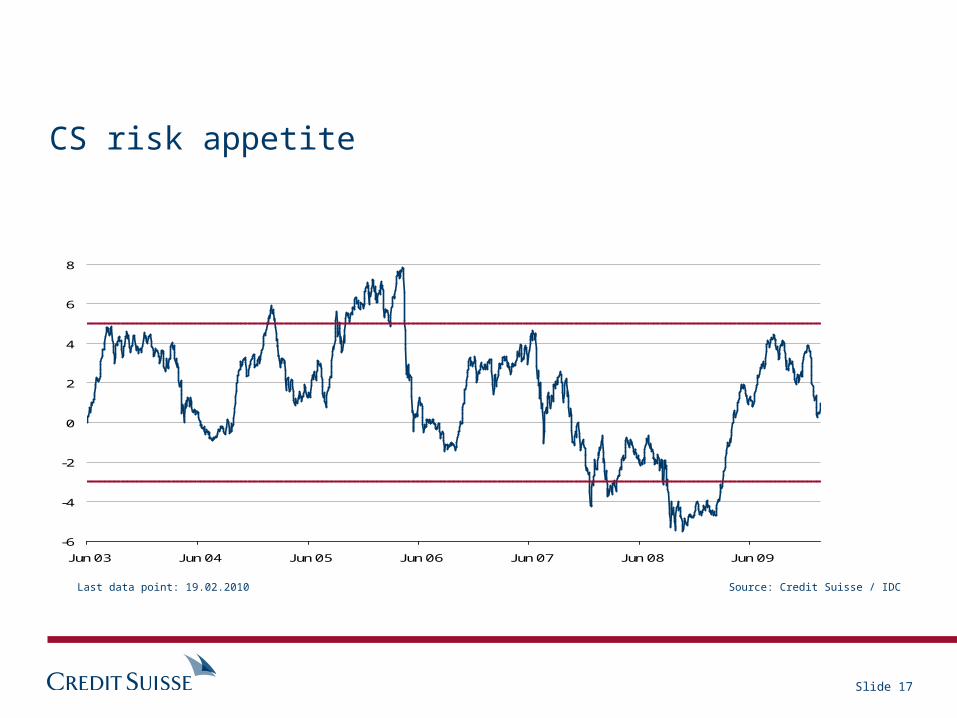
Euphoria
Panic
CS risk appetite
Last data point: 19.02.2010 Source: Credit Suisse / IDC

Slide 18
1.00
1.10
1.20
1.30
1.40
1.50
1.60
1.70
1.80
J an 97 J an 99 J an 01 J an 03 J an 05 J an 07 J an 09
Defensive to Cyclical ratio
Defensives Outperforming
Global defensives to cyclicals ratio
Increase equity exposure to high quality defensive sectors
Source: Datastream, Credit Suisse / IDCLast data point: 19.02.2010
Slide 19
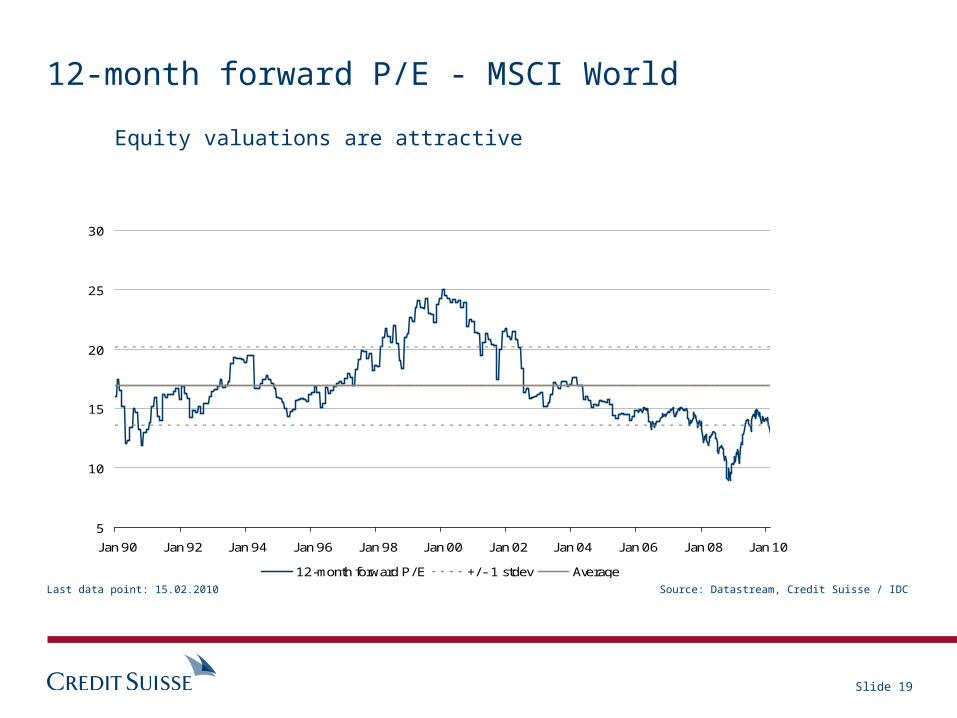
5
10
15
20
25
30
J an 90 J an 92 J an 94 J an 96 J an 98 J an 00 J an 02 J an 04 J an 06 J an 08 J an 10
12-month forward P/E +/ - 1 stdev Average
12-month forward P/E
12-month forward P/E - MSCI World
Equity valuations are attractive
Source: Datastream, Credit Suisse / IDCLast data point: 15.02.2010
Slide 20
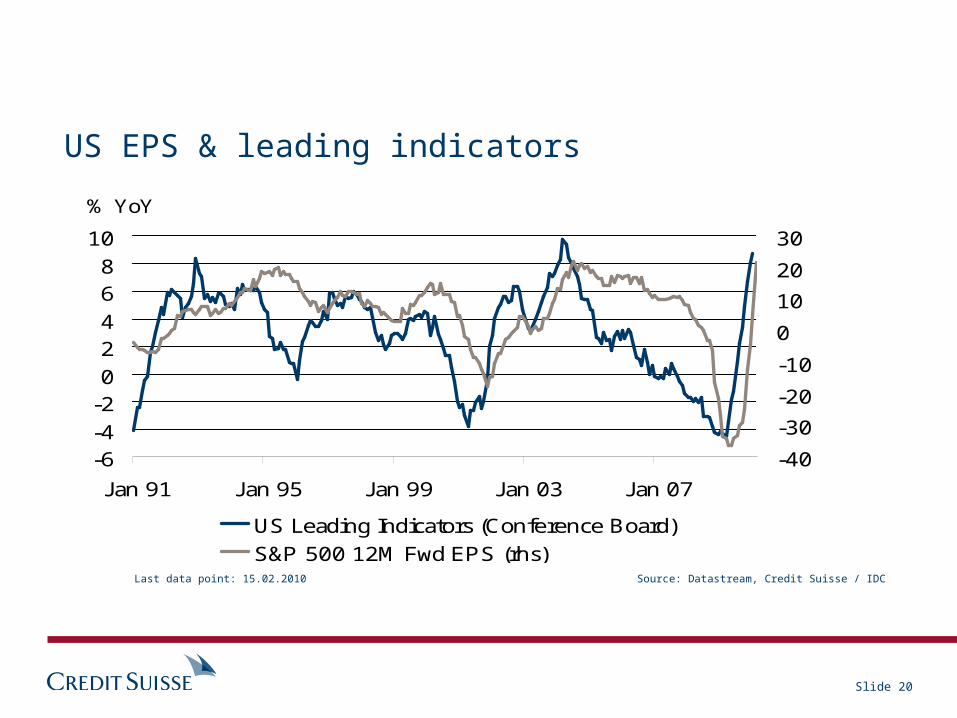
-6-4-202468
10
J an 91 J an 95 J an 99 J an 03 J an 07
-40
-30
-20
-10
0
10
20
30
US Leading Indicators (Conference Board) S&P 500 12M Fwd EPS (rhs)
% YoY % YoY
US EPS & leading indicators
Last data point: 15.02.2010 Source: Datastream, Credit Suisse / IDC
Slide 21
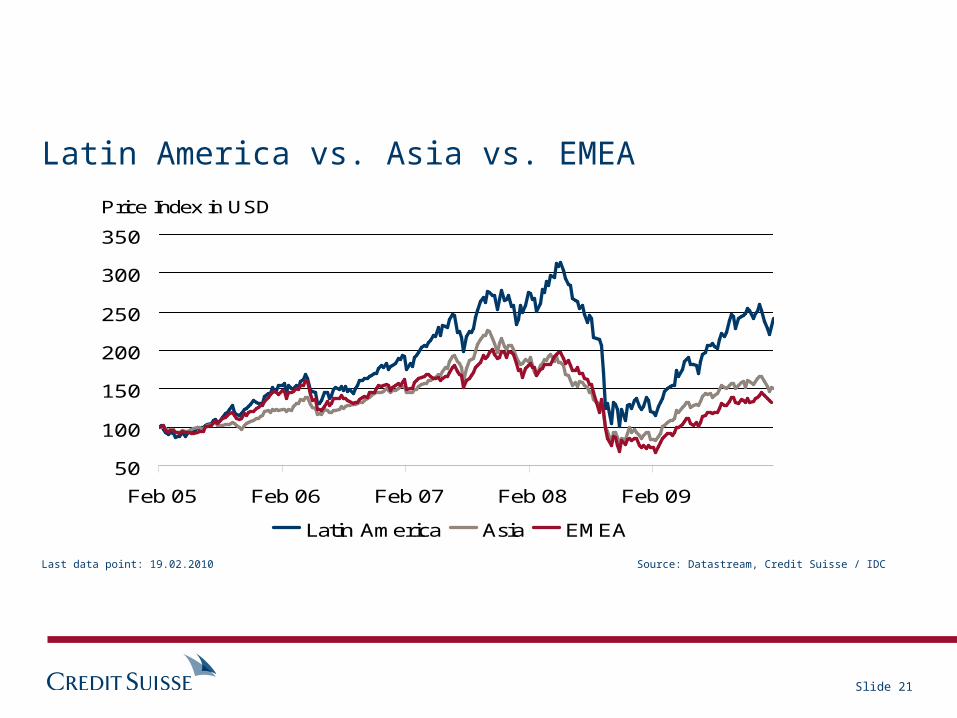
50
100
150
200
250
300
350
Feb 05 Feb 06 Feb 07 Feb 08 Feb 09
Latin America Asia EMEA
Price Index in USD
Latin America vs. Asia vs. EMEA
Source: Datastream, Credit Suisse / IDCLast data point: 19.02.2010
Slide 22
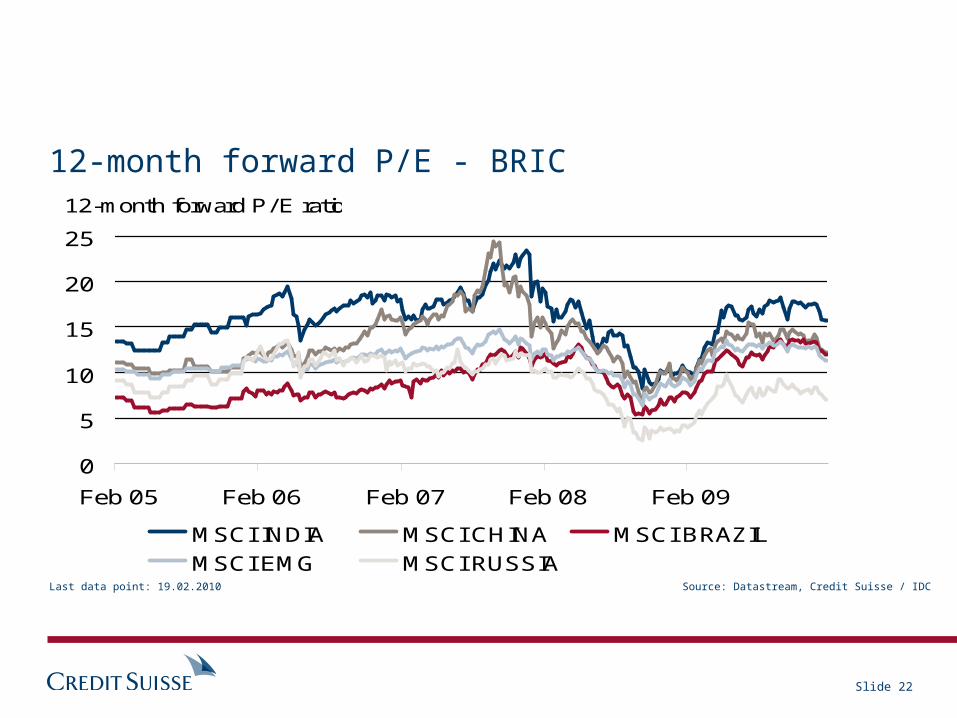
0
5
10
15
20
25
Feb 05 Feb 06 Feb 07 Feb 08 Feb 09
MSCI INDIA MSCI CHINA MSCI BRAZILMSCI EMG MSCI RUSSIA
12-month forward P/E ratio
12-month forward P/E - BRIC
Source: Datastream, Credit Suisse / IDCLast data point: 19.02.2010
Slide 23
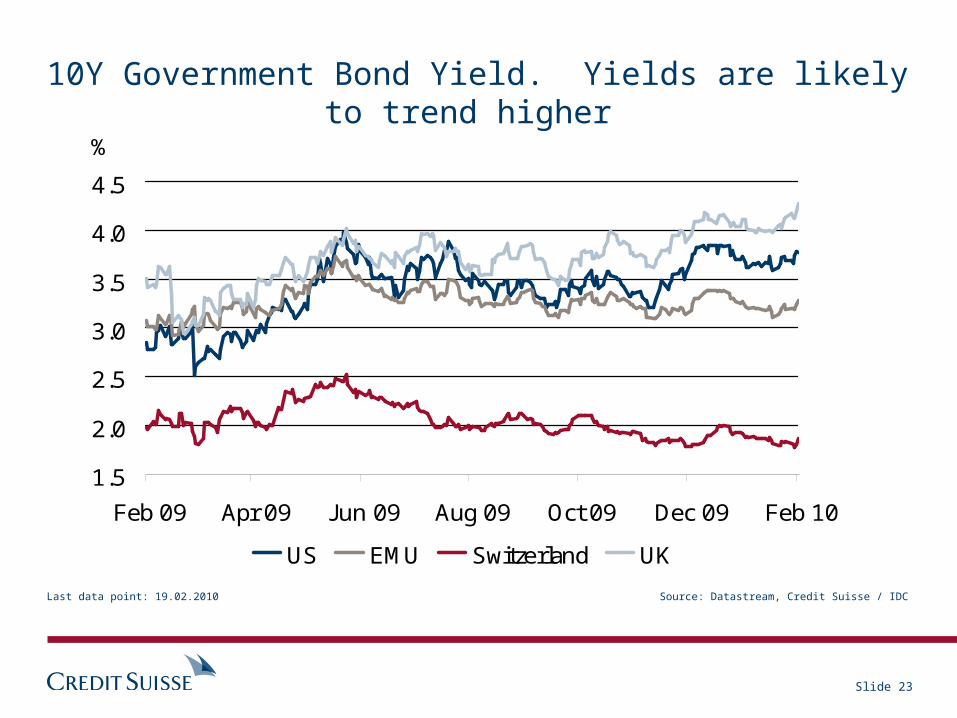
1.5
2.0
2.5
3.0
3.5
4.0
4.5
Feb 09 Apr 09 J un 09 Aug 09 Oct 09 Dec 09 Feb 10
US EMU Switzerland UK
%
10Y Government Bond Yield. Yields are likely to trend higher
Source: Datastream, Credit Suisse / IDCLast data point: 19.02.2010
Slide 24
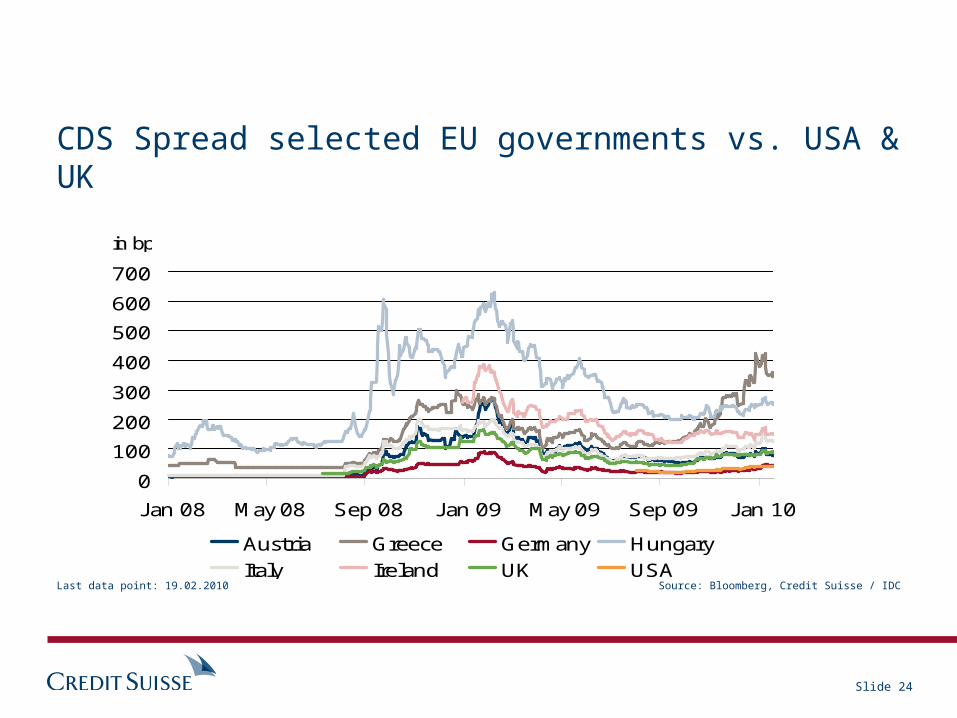
0
100
200
300
400
500
600
700
J an 08 May 08 Sep 08 J an 09 May 09 Sep 09 J an 10
Austria Greece Germany HungaryItaly Ireland UK USA
in bp
CDS Spread selected EU governments vs. USA & UK
Source: Bloomberg, Credit Suisse / IDCLast data point: 19.02.2010
Slide 25
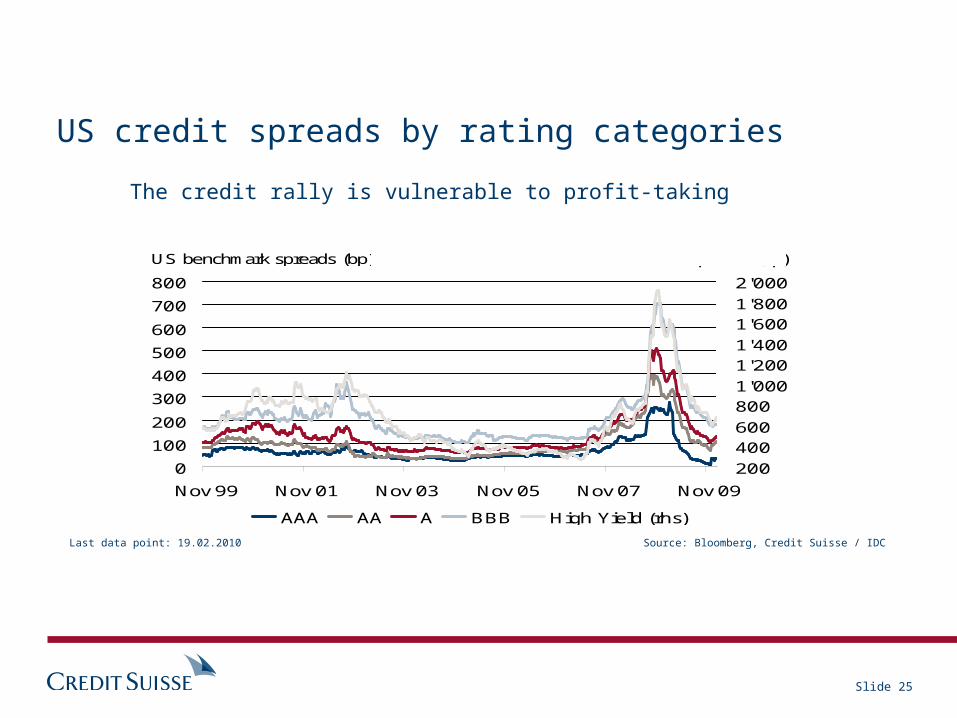
0
100
200
300
400
500
600
700
800
Nov 99 Nov 01 Nov 03 Nov 05 Nov 07 Nov 09
2004006008001'0001'2001'4001'6001'8002'000
AAA AA A BBB High Yield (rhs)
US benchmark spreads (bp) US benchmark spreads (bp)
US credit spreads by rating categories
Source: Bloomberg, Credit Suisse / IDCLast data point: 19.02.2010
The credit rally is vulnerable to profit-taking
Slide 26
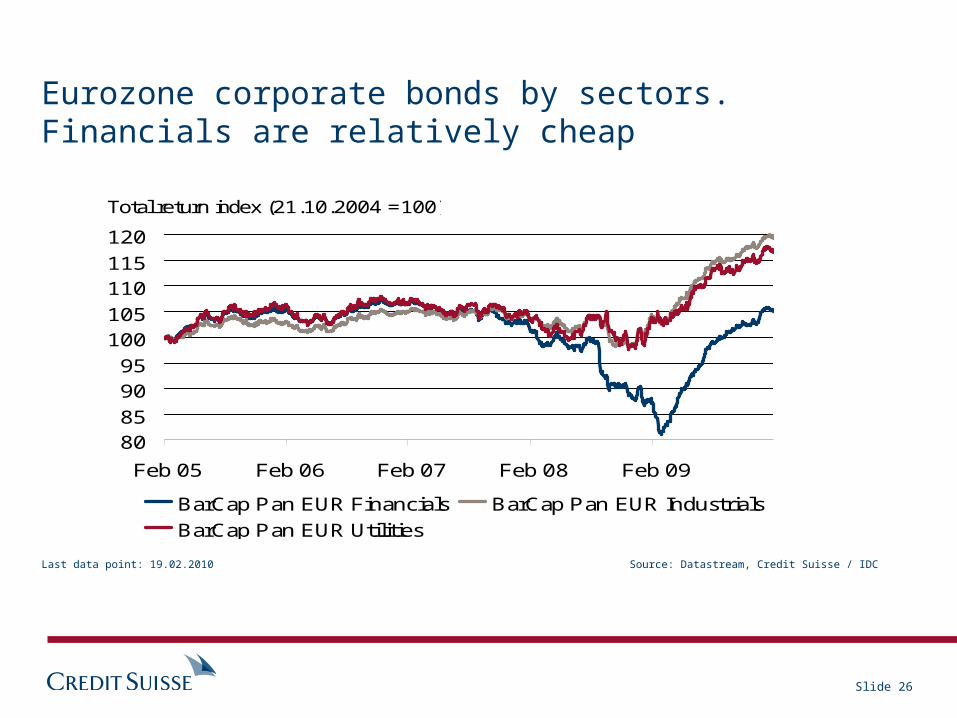
80859095
100105110115120
Feb 05 Feb 06 Feb 07 Feb 08 Feb 09
BarCap Pan EUR Financials BarCap Pan EUR IndustrialsBarCap Pan EUR Utilities
Total return index (21.10.2004 =100)
Eurozone corporate bonds by sectors. Financials are relatively cheap
Source: Datastream, Credit Suisse / IDCLast data point: 19.02.2010
Slide 27
-60
-40
-20
0
20
40
60
CN
Y
TW
D
KRW
SG
D
MXN
TH
B
SEK
JPY
GBP
ZAR
CH
F
PLN
EU
R
HU
F
NO
K
CAD
NZD
AU
D
CZK
19.02.2010
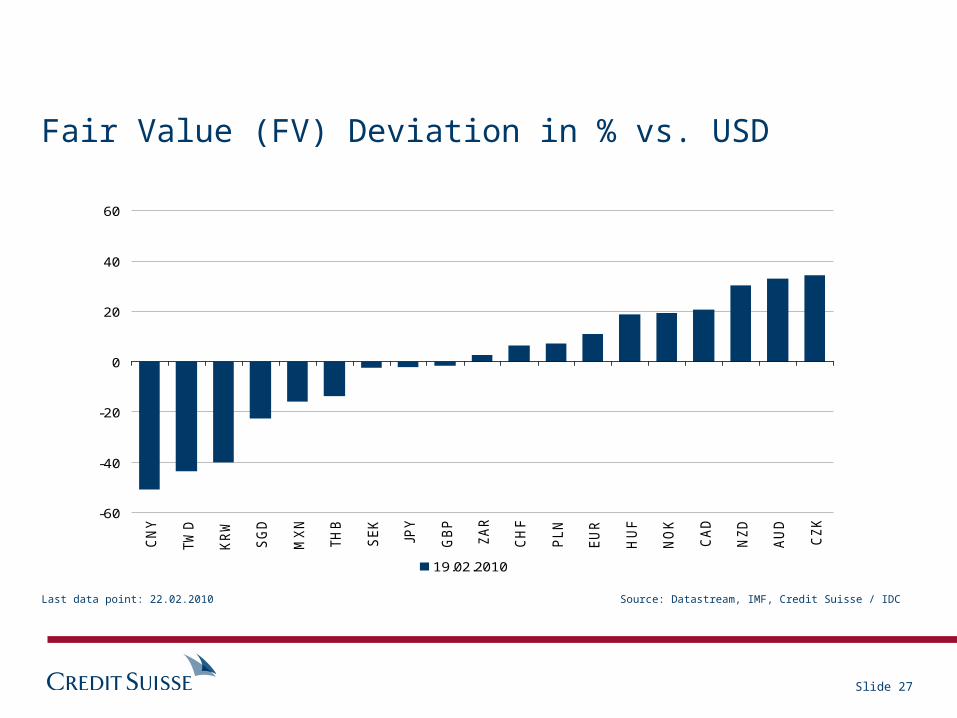
Overvaluation vs. USD
Undervaluation vs. USD
Deviation in %
Fair Value (FV) Deviation in % vs. USD
Source: Datastream, IMF, Credit Suisse / IDCLast data point: 22.02.2010
Slide 28
70
80
90
100
110
120
130
J an 99 J an 01 J an 03 J an 05 J an 07 J an 09
-2
-1
0
1
2
3
DXY Dollar Index2Y Swap Spread USD minus weighted G6 yields (r.h.s)
Index in %
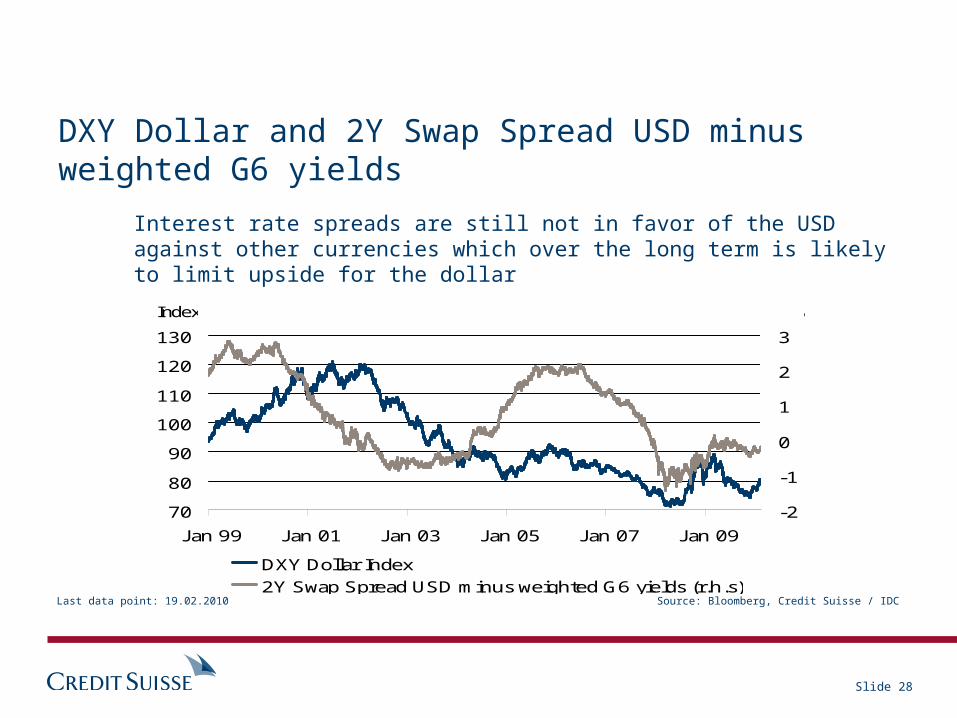
DXY Dollar and 2Y Swap Spread USD minus weighted G6 yields
Interest rate spreads are still not in favor of the USD against other currencies which over the long term is likely to limit upside for the dollar
Source: Bloomberg, Credit Suisse / IDCLast data point: 19.02.2010
Slide 29
1.301.401.501.601.701.801.902.002.102.20
J an 04 J an 05 J an 06 J an 07 J an 08 J an 09 J an 10
-1.0
-0.5
0
0.5
1.0
1.5
2.0
2.5
3.0
GBP/USD exchange rate 2-Year Swap GBP minus USD (r.h.s)
GBP/USD in %
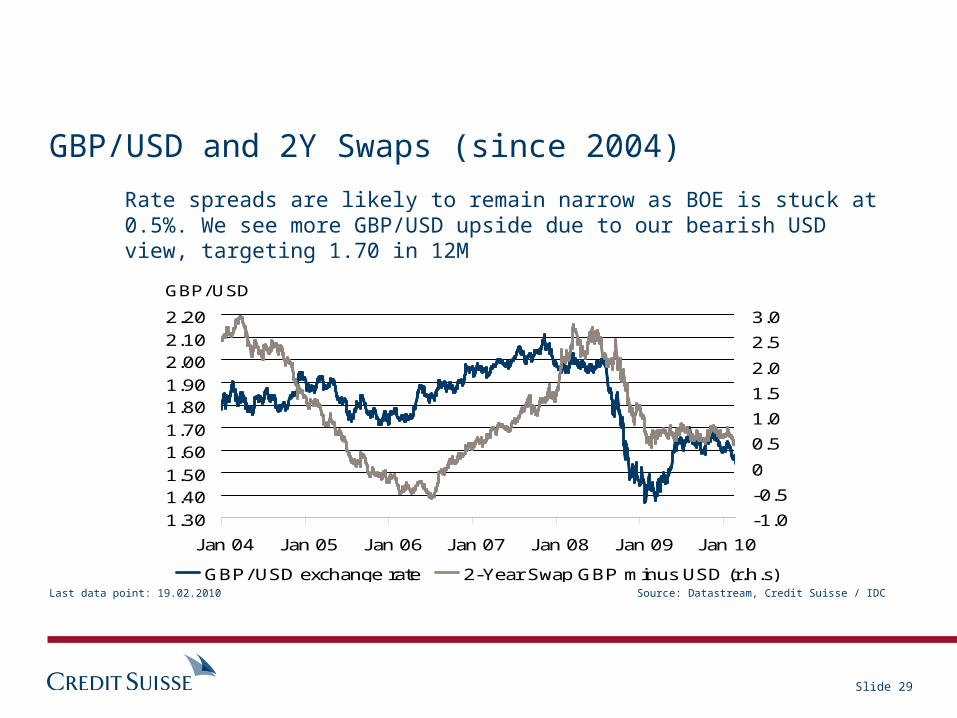
GBP/USD and 2Y Swaps (since 2004)
Rate spreads are likely to remain narrow as BOE is stuck at 0.5%. We see more GBP/USD upside due to our bearish USD view, targeting 1.70 in 12M
Source: Datastream, Credit Suisse / IDCLast data point: 19.02.2010
Slide 30
85
90
95
100
105
110
115
120
125
J an 04 J an 05 J an 06 J an 07 J an 08 J an 09 J an 10
00.51.01.52.02.53.03.54.04.55.0
USD/ J PY exchange rate 2 Year Swap USD minus J PY (r.h.s)
USD/J PY in %
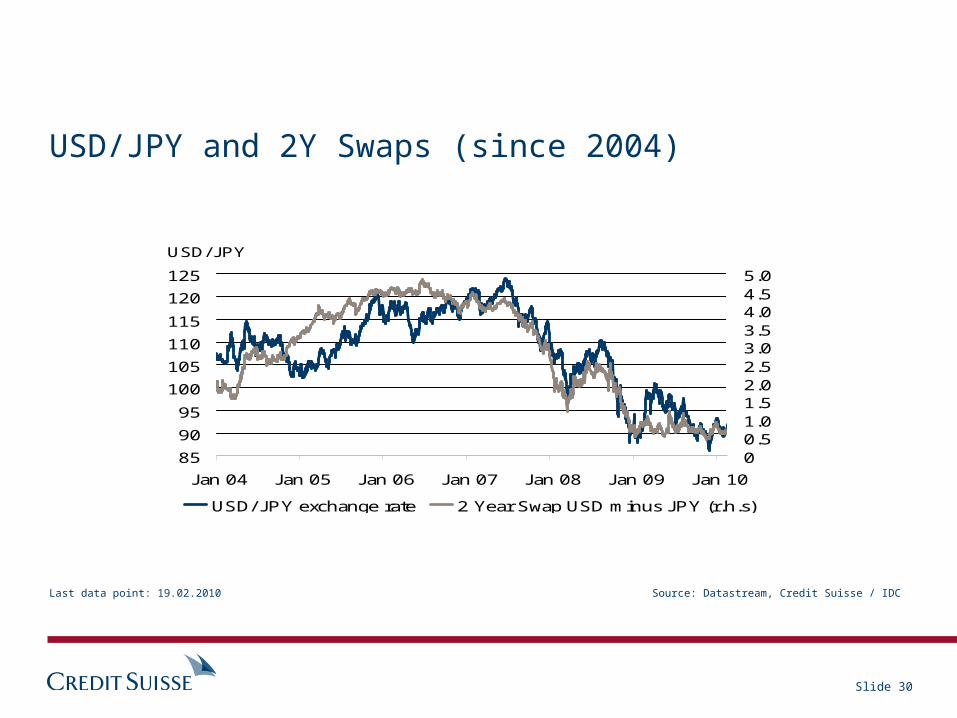
USD/JPY and 2Y Swaps (since 2004)
Source: Datastream, Credit Suisse / IDCLast data point: 19.02.2010
Slide 31
0.60
0.65
0.70
0.75
0.80
0.85
0.90
0.95
1.00
J an 06 J an 07 J an 08 J an 09 J an 10
0
1
2
3
4
5
6
AUD/USD 2-Year Swap AUD minus USD (r.h.s)
AUD/USD in %
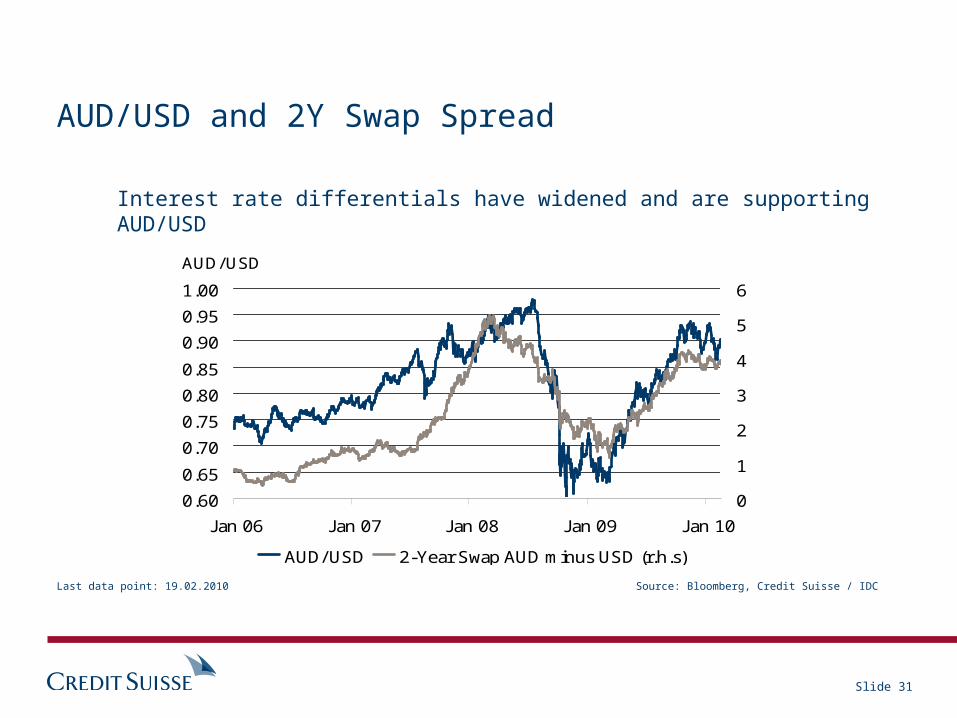
AUD/USD and 2Y Swap Spread
Interest rate differentials have widened and are supporting AUD/USD
Source: Bloomberg, Credit Suisse / IDCLast data point: 19.02.2010

Slide 32
20
40
60
80
100
120
140
160
J an 08 May 08 Sep 08 J an 09 May 09 Sep 09 J an 10
CSCB Energy Index CSCB Precious Metals IndexCSCB Agriculture Index CSCB Industrial Metals Index
Index, J anuary 2008 = 100
Credit Suisse commodity indices
Source: Bloomberg, Credit Suisse / IDCLast data point: 19.02.2010
Slide 33
4.0
4.5
5.0
5.5
6.0
6.5
56 64 72 80 88 96 04
CRB Index in logs Time trend and standard deviation band
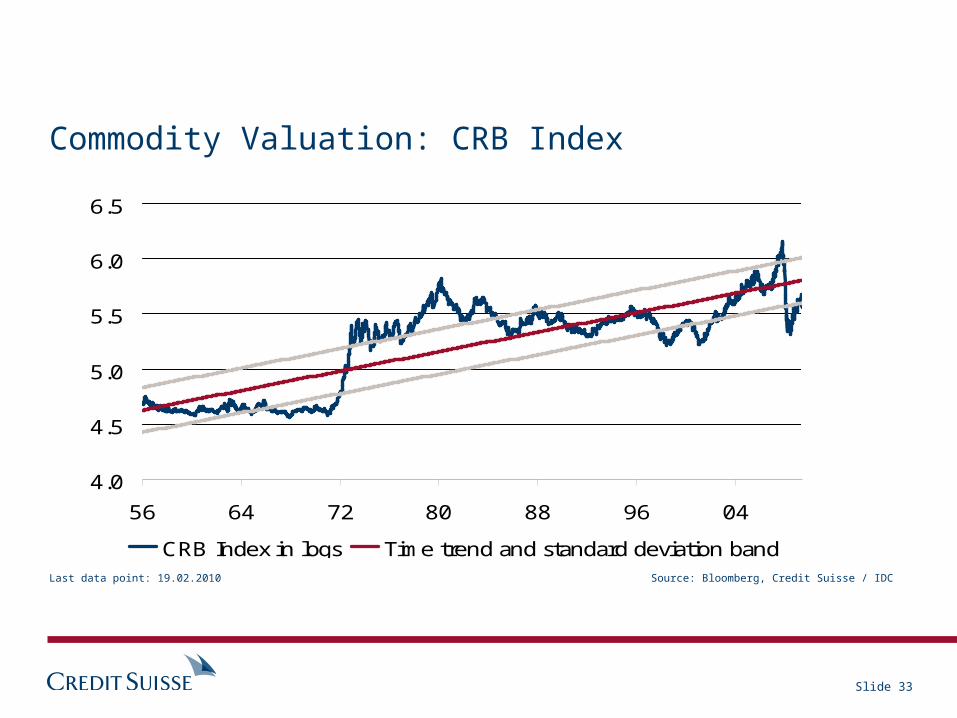
Commodity Valuation: CRB Index
Source: Bloomberg, Credit Suisse / IDCLast data point: 19.02.2010

Slide 34
-5-4-3-2-101234
Mar 05 Mar 06 Mar 07 Mar 08 Mar 09
Global oil demand growth Global oil supply growth
% YoY (3M rolling average)
Source: EIA, Credit Suisse / IDCLast data point: 22.02.2010
Global crude oil demand and supply growth
Global oil demand continues to recover and supply has started to grow as well. We think the oil market has started a new cycle and expect moderately higher prices in 2010
Slide 35
0
100
200
300
400
500
600
Feb 08 J un 08 Oct 08 Feb 09 J un 09 Oct 09 Feb 10
2'000
3'000
4'000
5'000
6'000
7'000
8'000
9'000
LME copper inventories LME 3M copper forward price (rhs)
in kt USD/t
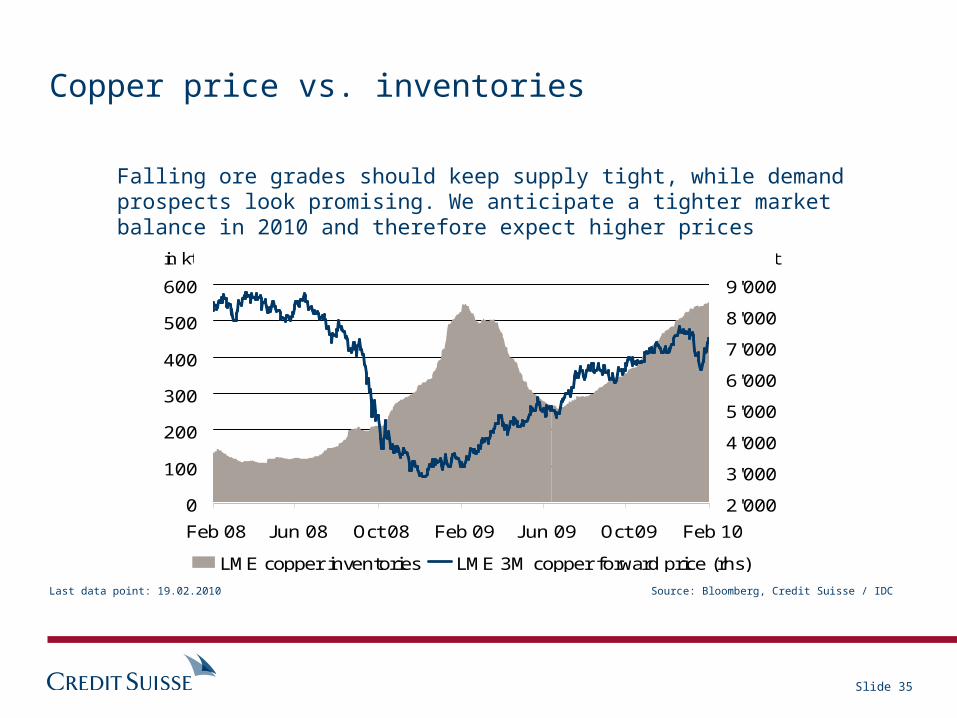
Copper price vs. inventories
Falling ore grades should keep supply tight, while demand prospects look promising. We anticipate a tighter market balance in 2010 and therefore expect higher prices
Source: Bloomberg, Credit Suisse / IDCLast data point: 19.02.2010
Slide 36
850
900
950
1'000
1'050
1'100
1'150
1'200
1'250
Feb 09 Apr 09 J un 09 Aug 09 Oct 09 Dec 09 Feb 10
120
140
160
180
200
220
240
260
280
Net speculative positions (rhs) Gold price
in USD / oz. in ,000 contracts
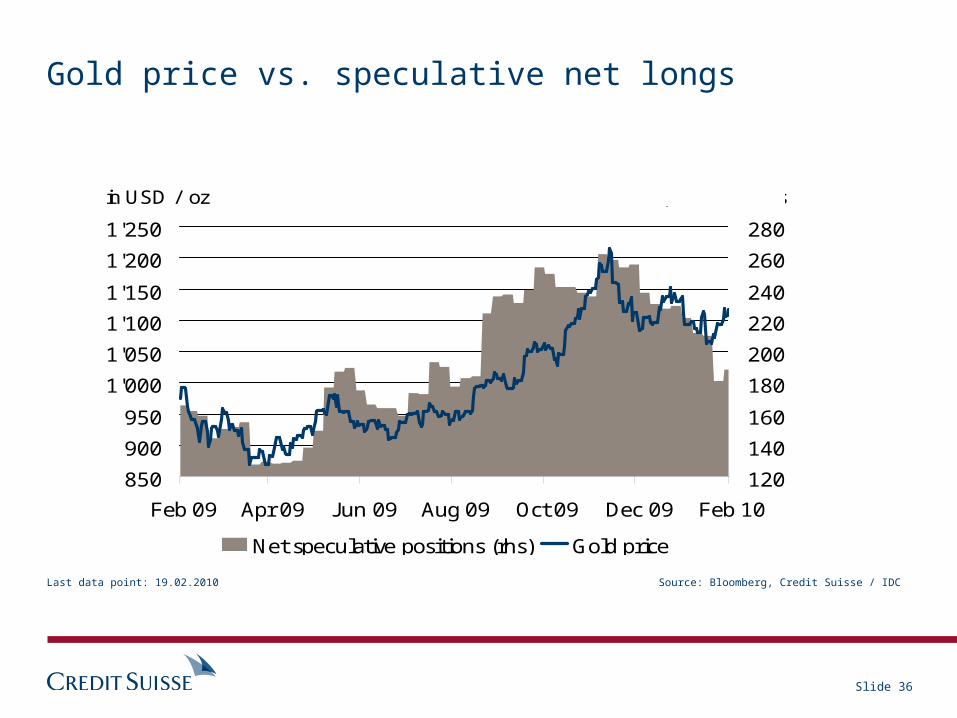
Gold price vs. speculative net longs
Source: Bloomberg, Credit Suisse / IDCLast data point: 19.02.2010
Slide 37
600800
1'0001'2001'4001'6001'8002'0002'2002'400
Feb 08 J un 08 Oct 08 Feb 09 J un 09 Oct 09 Feb 10
0
5
10
15
20
25
Net speculative long positions (rhs) Platinum price
in USD / oz. In '000 contracts
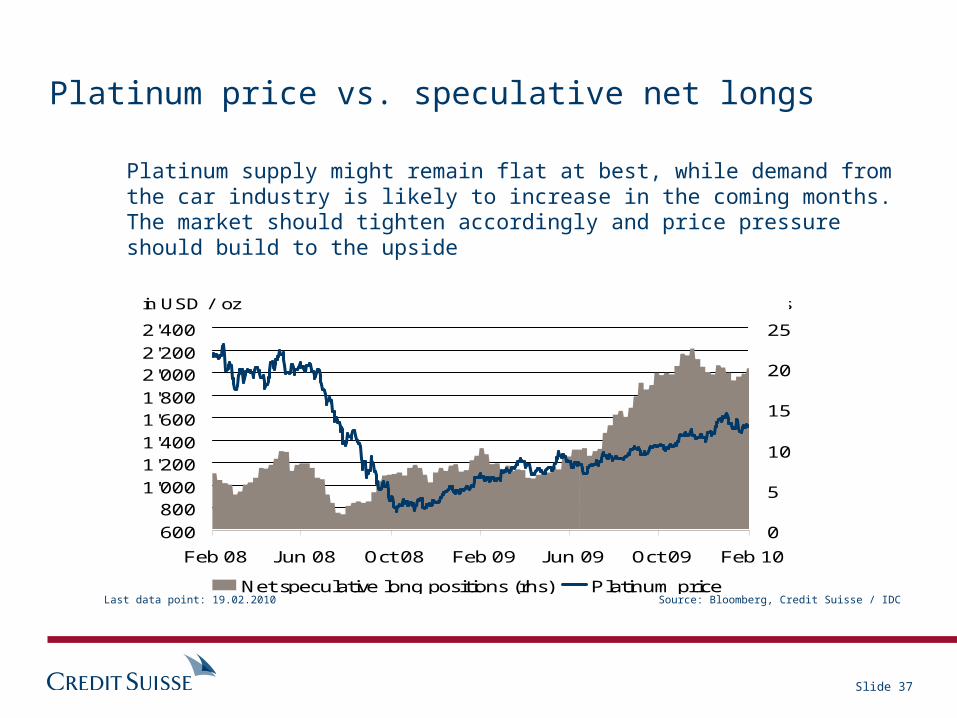
Platinum price vs. speculative net longs
Platinum supply might remain flat at best, while demand from the car industry is likely to increase in the coming months. The market should tighten accordingly and price pressure should build to the upside
Source: Bloomberg, Credit Suisse / IDCLast data point: 19.02.2010
Slide 38
200
400
600
800
1'000
1'200
1'400
J an 06 J an 07 J an 08 J an 09 J an 10
-80
-60
-40
-20
0
20
40
Net speculative long positions (rhs) CBOT wheat price
US cents / bushel in '000 contracts
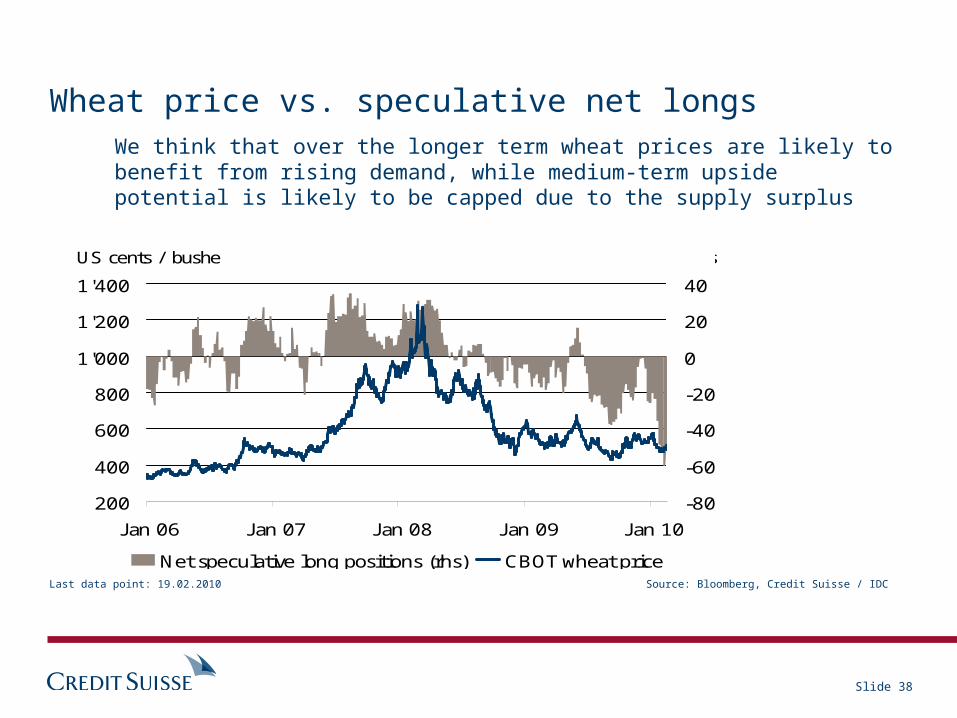
Wheat price vs. speculative net longsWe think that over the longer term wheat prices are likely to benefit from rising demand, while medium-term upside potential is likely to be capped due to the supply surplus
Source: Bloomberg, Credit Suisse / IDCLast data point: 19.02.2010
Slide 39
Conclusions and strategy
US and Japanese growth should surprise positively in 1H10, but fade thereafter
UK and European growth will be mediocre with the weaker Euroland economies and Eastern Europe struggling to emerge from recession
Growth leadership will come from Asia and Latin America Japan remains in deflation, inflation in Europe is slowing and
the upturn in inflation in the US and the UK will reverse The upturn in inflation in emerging markets is being met by
tighter monetary policies After the set-back in equity markets in early 2010, equity
markets should now advance for the rest of the year Defensive high quality sectors will outperform
Slide 40
Conclusions and strategy
During 2H10, emerging markets should start to outperform again
Dollar strength against the Euro and the pound should reverse during 2H10 as the US economy fades
Asian and Latin American currencies will continue to be subject to upward pressure
The credit rally will now consolidate, bank debt and emerging debt are attractive
Government bonds will see moderate selling pressure
Slide 41
General disclaimer / Important information
This document was produced by and the opinions expressed are those of Credit Suisse as of the date of writing and are subject to change. It has been prepared solely for information purposes and for the use of the recipient. It does not constitute an offer or an invitation by or on behalf of Credit Suisse to any person to buy or sell any security. Nothing in this material constitutes investment, legal, accounting or tax advice, or a representation that any investment or strategy is suitable or appropriate to your individual circumstances, or otherwise constitutes a personal recommendation to you. The price and value of investments mentioned and any income that might accrue may fluctuate and may fall or rise. Any reference to past performance is not a guide to the future.
The information and analysis contained in this publication have been compiled or arrived at from sources believed to be reliable but Credit Suisse does not make any representation as to their accuracy or completeness and does not accept liability for any loss arising from the use hereof. Credit Suisse may have acted upon the information and analysis contained in this publication before being made available to clients of Credit Suisse. Investments in emerging markets are speculative and considerably more volatile than investments in established markets. Some of the main risks are political risks, economic risks, credit risks, currency risks and market risks. Furthermore, investments in foreign currencies are subject to exchange rate fluctuations. Before entering into any transaction, you should consider the suitability of the transaction to your particular circumstances and independently review (with your professional advisers as necessary) the specific financial risks as well as legal, regulatory, credit, tax and accounting consequences.
Neither this document nor any copy thereof may be sent to or taken into the United States or distributed in the United States or to a US person, in certain other jurisdictions the distribution may be restricted by local law or regulation. Neither this report nor any copy thereof may be sent, taken or distributed in Japan.
Credit Suisse, a Swiss bank, is authorized and regulated by the Swiss Financial Market Supervisory Authority. Credit Suisse disseminates research to its clients, which has been prepared by either itself or any of its affiliates.
This document has been issued in Hong Kong by Credit Suisse Hong Kong branch, which is an Authorized Institution licensed by the Hong Kong Monetary Authority and a Registered Institution under the Securities and Futures Ordinance (Chapter 571 of the Laws of Hong Kong).
Credit Suisse (Deutschland) AG, authorized and regulated by the Bundesanstalt für Finanzdienstleistungsaufsicht, disseminates research to its clients that has been prepared by one of its affiliates.
This document has been issued in the UK by Credit Suisse (UK) Limited and Credit Suisse Securities (Europe) Limited, London. Credit Suisse Securities (Europe) Limited and Credit Suisse (UK) Limited are associated but independent legal and regulated entities within the Credit Suisse Group. Both are authorized and regulated by the Financial Services Authority. The protections made available by the UK’s Financial Services Authority for private customers do not apply to investments or services provided by a person outside the UK, nor will the Financial Services Compensation Scheme be available if the issuer of the investment fails to meet its obligations.
This report may not be reproduced either in whole or in part, without the written permission of Credit Suisse.
Copyright © 2010 Credit Suisse Group AG and/or its affiliates. All rights reserved.