Embed Size (px)
Citation preview

Global Market Trends and Challenges
Gary Millar, International Business Development Manager (Asia)
Northern Ireland Poultry Industry Conference2nd November 2017

Global Market Trends & Challenges:
Global Market Production & Consumption Trends
Evolution of Global Farm Structure
Global Market Trade
Global Market Developments & Challenges

EU 28 Egg Consumption 2000-2016
11
11
12
12
13
13
14
14
2,000
3,000
4,000
5,000
6,000
7,000
8,000
2000 2001 2002 2003 2004 2005 2006 2007 2008 2009 2010 2011 2012 2013 2014e 2015f 2016f
KG
's
00
0's
MT
Production Consumption Per Capita Consumption
EU Egg consumption
recovery since 2012
Global Production
rising by 2-2.5% per year from 2013 - 2015
EU Consumption
13kg per capita 2015
Source: Watt Global Media 2016

Global Meat Consumption Projections by type 2014-2026
33.9
34.0
34.1
34.2
34.3
34.4
34.5
34.6
34.7
0
20 000
40 000
60 000
80 000
100 000
120 000
140 000
2014-16 2018 2020 2022 2024 2026
Kgs
/per
son
Kt'
s
Beef &Veal Pigmeat Poultry Meat Sheep Meat Per Capita Consumption
Source: OECD 2017
+11.5% by 2026
Poultry Most
Consumed 2017

USA21%
Brasil15%
China12%
EU13%
Other 39%
PRODUCTION
USA18%
China13%
EU12%
Brasil9%
Other48%
CONSUMPTION
Source: AVEC Annual Report 2017; USDA 2017
Total 91,278 (1000 mt’s)
Total 88,135 (1000 mt’s)
Annual % Production Growth
2014 2015 2016 2017 2018
2.7 2.6 0.0 1.2 1.2
Annual % Consumption Growth
2014 2015 2016 2017 2018
2.7 2.5 0.0 0.9 1.1
World Broiler Meat Production & Consumption 2017

Chicken Meat Consumption in Select Countries 2010 to 2016
Source: AVEC 2017; ABARES 2017
0102030405060
Au
stria
France
Germ
any
Italy
Neth
erland
s
Po
rtugal
Un
ited K
ingd
om
Arge
ntin
a
Au
stralia
Brasil
Ch
ina
Ind
ia
Iran
Japan
Mexico
Sou
th A
frica
UA
E
USA
Kg'
s/ca
pit
a/ye
ar
UK23.2KG’s
Ireland30.4KG’s*
Australia46.0KG’s
* 2014 AVEC

Source: ENSIA 2015, https://ensia.carto.com/viz/23cd092c-83ce-11e5-8841-0ecd1babdde5/public_map
Projected Change in Poultry Consumption 2014 - 2024
China -11.4kg +23.8%
Indonesia -6.3kg +15.8%
India – 1.8kgs +20.1%
Tanzania –1.0kg +21.2%
Vietnam –12.7kg +36.9%
Ukraine – 23.4kg +28.7%
USA -44.5kg +10.8%
Colombia -22kgs +23.8%
Brasil – 38.7kgs+9.3%
EU – 21.6kg+7.1%

Countries with the greatest share of additional poultry production
2025 vs. 2013-15
0 0.5 1 1.5 2 2.5 3 3.5 4 4.5
Vietnam
Pakistan
Argentina
Indonesia
Russia
India
Mexico
European Union
China
United States
Brazil
Poultry (x 1 million metric tons, rtc or cwe)Source: Watt Global Media 2016
Brasil, USA and China continue
to dominate

Poultry Numbers in UK and N. Ireland 1971-2016 (millions)
0.0
20.0
40.0
60.0
80.0
100.0
120.0
140.0
160.0
180.0
200.0
5.0
7.0
9.0
11.0
13.0
15.0
17.0
19.0
21.0
23.0
19
71
19
72
19
73
19
74
19
75
19
76
19
77
19
78
19
79
19
80
19
81
19
82
19
83
19
84
19
85
19
86
19
87
19
88
19
89
19
90
19
91
19
92
19
93
19
94
19
95
19
96
19
97
19
98
19
99
20
00
20
01
20
02
20
03
20
04
20
05
20
06
20
07
20
08
2
00
9(a
)
20
10
20
11
20
12
20
13
20
14
20
15
20
16
UK
Po
ult
ry N
um
ber
s
N.I
Po
ult
ry N
um
ber
s
Northern Ireland United KingdomSource: DEFRA 2016
UK 1.7% since
2000
NI 41.7% since
2000
UK Chicken Meat 30% since 2000

0
500
1000
1500
2000
2500
3000
00
0’S
To
nes
Car
cass
Wei
ght
Axis Title
2011 2012 2013 2014 2015 2016
Top 10 EU Poultry Producing Countries 2011 -2016
Source: AVEC Annual Report 2017

Global Market Trends & Challenges:
Global Market Production & Consumption Trends
Evolution of Global Farm Structure
Global Market Trade
Global Market Developments & Challenges

1-100001%
10-9999934%
100000+65%
2014
<100040%
1-500011%
5-1000013%
10-2000014%
20-5000013%
50000+9%
1971
Source: Richardson 1976 - "UK Poultry Industry 1960-1975" Source: DEFRA 2015
Broiler Farms in England and Wales by Size 1971 & 2014
Clear trend for fewer but larger farms
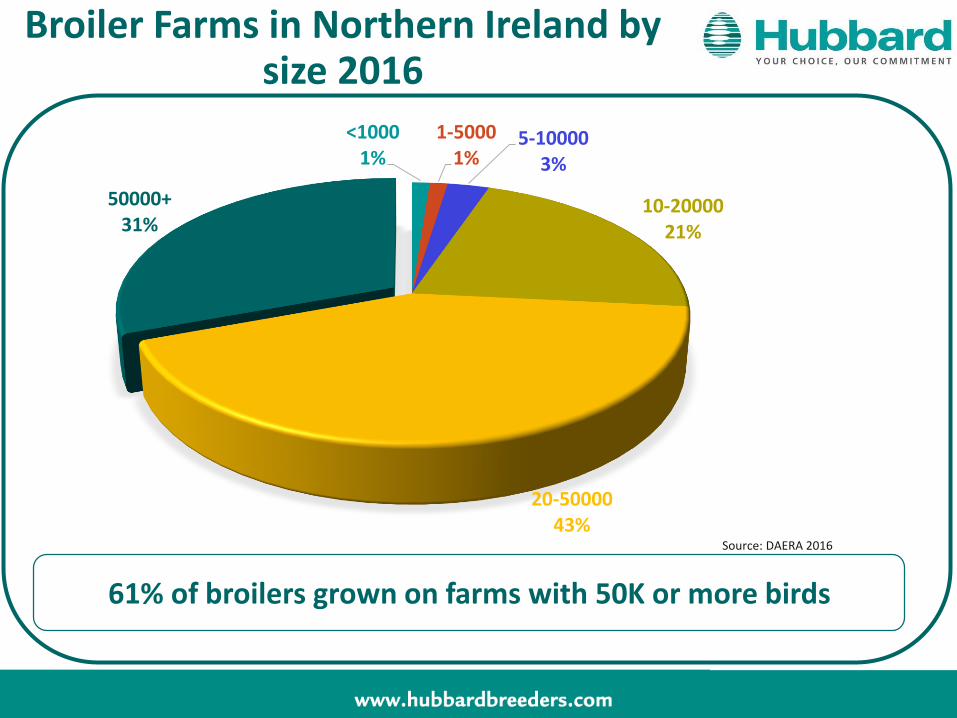
<10001%
1-50001%
5-100003%
10-2000021%
20-5000043%
50000+31%
61% of broilers grown on farms with 50K or more birds
Source: DAERA 2016
Broiler Farms in Northern Ireland by size 2016

House Design Evolution in AsiaIndonesia

House Design Evolution in AsiaIndonesia

House Design Evolution in AsiaIndonesia

House Design Evolution in AsiaChina: Slat system

18
House Design Evolution in AsiaChina: Floor System

19
House Design Evolution in AsiaChina: small family slatted
Small family farms: trend for closure due to
environmental pressures and air pollution from
coal fire heating

Global Market Trends & Challenges:
Global Market Production & Consumption Trends
Evolution of Global Farm Structure
Global Market Trade
Global Market Developments & Challenges

Broiler Imports in Top 10 Countries 2013-2018
100
200
300
400
500
600
700
800
900
1000
2013 2014 2015 2016 2017 2018
00
0’S
TO
NN
ES
Japan Mexico Saudi Arabia EU
Iraq South Africa China Hong Kong
UAE Cuba
11%
6%
7%
8%
9%8%
5%
4%
4%3%
Strong Japanese
Import Growth
S. Africa imports
reduced by embargo
China Imports
increasing from Latin America
Source: USDA 2017

0
500
1000
1500
2000
2500
3000
3500
4000
4500
2013 2014 2015 2016 2017 2018
00
0 ‘S
TO
NN
ES
Brazil USA EU Thailand China Turkey
Ukraine Argentina Belarus Canada Russia Others
Broiler Exports from Top 10 Countries 2013-2018
Source: USDA 2017
Brasil, US and
Thailand increasing
China HPAI embargoes continue to impact US
EU UtilisingDomestic
Production
36%
28%
11%
7%
18%

Global Market Trends & Challenges:
Global Market Production & Consumption Trends
Evolution of Global Farm Structure
Global Market Trade
Global Market Developments & Challenges

Quality of the product in all respects
Fresh meat produced at an acceptable price
Food Safety and Traceability
Basic consumer requirements for standard chicken meat products
Meeting Basic Consumer Expectations

Evolving welfare standards and diversification
Minimal use of Anti-microbial treatments
Sustainable production
The expectations of the modern consumer, particularly in mature markets, have evolved from the basic expectations of the past, bringing opportunities and challenges to industry.
Modern Consumer Expectations

Antimicrobial Stewardship examples of developments in Asia Pacific
China: Announced it will join the EU and ban use of antimicrobial growth
promoters
Vietnam: April 17 announced it
will ban the use of AGP’s for food safety reasons.
By 2020 Prophylactic use will be stopped
Australia: Late 2016 published First
National Antimicrobial Resistance Strategy 2015-19. Will ensure evidence
based best practice in antimicrobial stewardship.
New Zealand: Launched National
Antimicrobial Resistance Action Plan
in August 2017.
Thailand: Banned the use of
antimicrobial growth promoters in 2015. 2016 started a 5 year plan to
reduce use by a further 30%
South Korea:Only Asia Pacific country
to completely ban antibiotics as growth
promoters in feed in 2012
Indonesia:Animal drugs commission
recommends to limit use of AGP’s. Authorities passed a law prohibiting use of feed
with AGP’s, one exception plus anti-coccidials
Source: Daniel Ramirez & Tim Goossens, July 2017

A Global Broiler Market….Which develops and differentiates continuously
Alternatives(“Quality/Welfare”)• Differentiation• Robustness,
Reliability• Tradition & Quality
• Welfare
Possible solutions to developments in the broiler market
• Optimization of costs
• Maximization of Quality, Welfare, Health ,
Environment
Conventional(“Technology”)
• High Technical level• Maximum investments

Conventional Systems: Less Room for Errors in Technical Management at any stage
Hatchery
-Incubation=40% of chicks life by 2020.
-No room for deviation from ideal incubation parameters
Breeder
-Growth and uniformity in Rear and increasing challenge
-No room for error with separate sex feeding
Broiler
-achieving 7 day weights critical!
-7 hrs equipment failure = 1% life
- Little room for compensatory growth
-
Skilled, Professional & Motivated Staff essential in ensuring success!

UK Egg Supplies by Layer Housing Type –An indicator of future meat trends?
0.00
10.00
20.00
30.00
40.00
50.00
60.00
70.00
80.00
20
00
20
01
20
02
20
03
20
04
20
05
20
06
20
07
20
08
20
09
20
10
20
11
20
12
20
13
20
14
20
15
% o
f To
tal
Enriched cage Barn Free range Organic Source: Watt Global Media 2016
Small Niche
Organic Market
Egg market
may give indication of future
Trend toward
‘Welfare’ Systems

• EU Directive 2000/13/EC
• 81days: Traditional Free Range/Total Freedom FR
• 56 days : Free Range & Extensive Indoor
• Organic
• Standard
EU Concepts
• Label Rouge-80days+
• Certified
• Regional –Poulet de Bresse
• Organic
• Standard
France
• 2007 BeterLeven 3 star system
• 2013 Chicken of Tomorrow
Netherlands
• Global Animal Partnership
• Commitments to move to slow grow by 2024
USA
• UK – RSPCA Assured
• Germany –Tierschutzlabel(2 step “Stufe”)
• Australia -RSPCA Farm Assurance Scheme
• Global roll-out of fast food strategies e.g. McDonalds
Others
Alternatives: A quickly evolving diverse approach to chicken production

USA Perspective
2012-2017:+35%/year

Thank you very much for your attention !
• Illustrate the success and potential for further growth
1. Global Industry Trends
• Remains a major global bio-security threat with associated trade risks
2. HPAI
• Advances have facilitated much improved growth and FCR
3. Genetics and Management
• Improved ADG and reduction of antimicrobials leaves little room for management errors
4. Conventional Performance
• Leading to increased diversification on the basis of taste and welfare
5. Customer expectations

The performance data contained in this document was obtained from results and experience from our own research flocks and flocks of our customers. In no way does the data
contained in this document constitute a warranty or guarantee of the same performance under different conditions of
nutrition, density or physical or biological environment. In particular (but without limitation of the foregoing) we do not
grant any warranties regarding the fitness for purpose, performance, use, nature or quality of the flocks. HUBBARD
makes no representation as to the accuracy or completeness of the information contained in this document.
Disclaimer