Embed Size (px)
Citation preview
International Journal of
Environmental Research
and Public Health
Article
Global Lifetime and 12-Month Prevalence of SuicidalBehavior, Deliberate Self-Harm and Non-SuicidalSelf-Injury in Children and Adolescents between1989 and 2018: A Meta-Analysis
Kim-San Lim 1, Celine H. Wong 2, Roger S. McIntyre 3,4, Jiayun Wang 5,*, Zhisong Zhang 5 ,Bach X. Tran 6,7,8 , Wanqiu Tan 9, Cyrus S. Ho 10 and Roger C. Ho 1,5,11,12
1 Department of Psychological Medicine, Yong Loo Lin School of Medicine, National University of Singapore,Singapore 119228, Singapore; [email protected] (K.-S.L.); [email protected] (R.C.H.)
2 Division of Child and Adolescent Psychiatry, Department of Psychological Medicine, National UniversityHealth System, Singapore 119228, Singapore; [email protected]
3 Mood Disorders Psychopharmacology Unit, University Health Network, University of Toronto,Toronto, ON M5T 1R8, Canada; [email protected]
4 Department of Psychiatry, University of Toronto, Toronto, ON M5T 1R8, Canada5 Institute of Cognitive Neuroscience, Huaibei Normal University, Huaibei 235000, China; [email protected] Institute for Preventive Medicine and Public Health, Hanoi Medical University, Hanoi 100000, Vietnam;
[email protected] Johns Hopkins Bloomberg School of Public Health, Johns Hopkins University, Baltimore, MD 21205, USA8 Vietnam Young Physicians’ Association, Hanoi 100000, Vietnam9 The China-Singapore (Chongqing) Demonstration Initiative on Strategic Connectivity Think Tank,
Chongqing 400043, China; [email protected] Department of Psychological Medicine, National University Health System, Singapore 119228, Singapore;
[email protected] Health Innovation and Technology (iHealthtech), National University of Singapore,
Singapore 119228, Singapore12 Center of Excellence in Behavioral Medicine, Nguyen Tat Thanh University,
Ho Chi Minh City 70000, Vietnam* Correspondence: [email protected]
Received: 4 October 2019; Accepted: 7 November 2019; Published: 19 November 2019�����������������
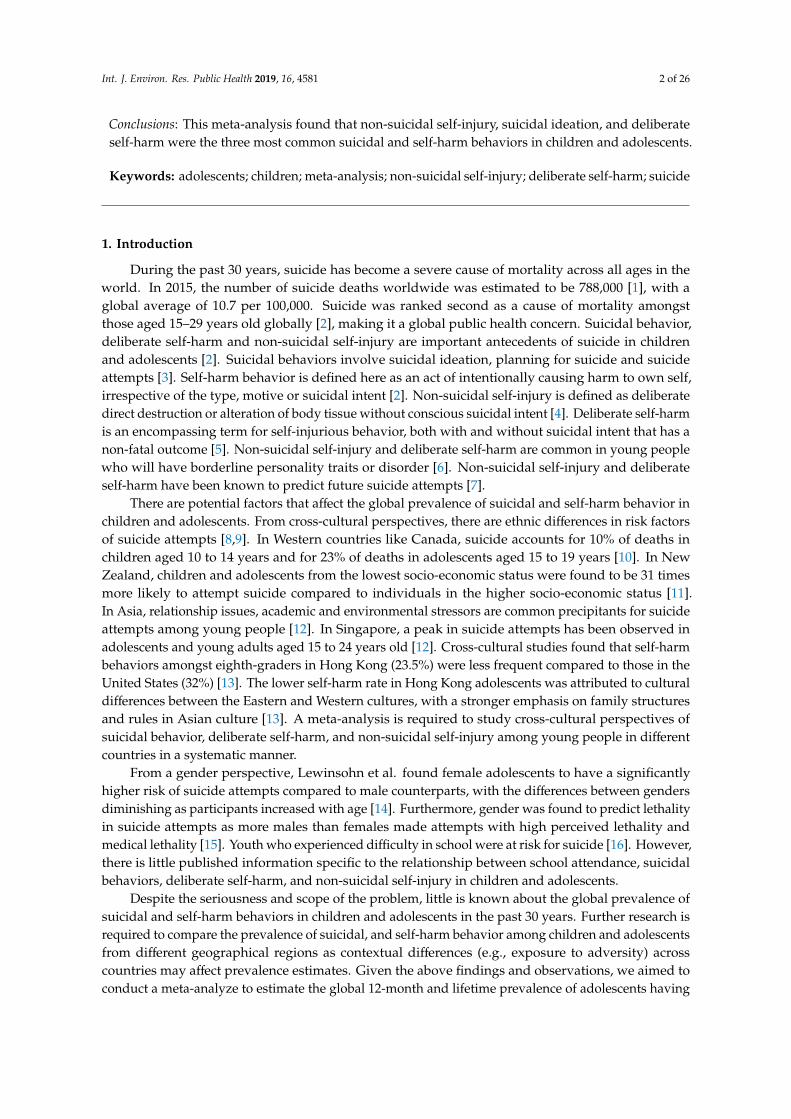
Abstract: Objective: This meta-analysis aimed to estimate the global lifetime and 12-month prevalenceof suicidal behavior, deliberate self-harm and non-suicidal self-injury in children and adolescents.Methods: A systematic search for relevant articles published between 1989 to 2018 was performed inmultiple electronic databases. The aggregate 12-month and lifetime prevalence of suicidal behavior,deliberate self-harm, and non-suicidal self-injury were calculated based on the random-effects model.Subgroup analyses were performed to compare the prevalence according to school attendanceand geographical regions. Results: A total of 686,672 children and adolescents were included.The aggregate lifetime and 12-month prevalence of suicide attempts was 6% (95% CI: 4.7–7.7%) and4.5% (95% CI: 3.4–5.9%) respectively. The aggregate lifetime and 12-month prevalence of suicidalplan was 9.9% (95% CI: 5.5–17%) and 7.5% (95% CI: 4.5–12.1%) respectively. The aggregate lifetimeand 12-month prevalence of suicidal ideation was 18% (95% CI: 14.2–22.7%) and 14.2% (95% CI:11.6–17.3%) respectively. The aggregate lifetime and 12-month prevalence of non-suicidal self-injurywas 22.1% (95% CI: 16.9–28.4%) and 19.5% (95% CI: 13.3–27.6%) respectively. The aggregate lifetimeand 12-month prevalence of deliberate self-harm was 13.7% (95% CI: 11.0–17.0%) and 14.2% (95% CI:10.1–19.5%) respectively. Subgroup analyses showed that full-time school attendance, non-Westerncountries, low and middle-income countries, and geographical locations might contribute to thehigher aggregate prevalence of suicidal behaviors, deliberate self-harm, and non-suicidal self-injury.
Int. J. Environ. Res. Public Health 2019, 16, 4581; doi:10.3390/ijerph16224581 www.mdpi.com/journal/ijerph
Int. J. Environ. Res. Public Health 2019, 16, 4581 2 of 26
Conclusions: This meta-analysis found that non-suicidal self-injury, suicidal ideation, and deliberateself-harm were the three most common suicidal and self-harm behaviors in children and adolescents.
Keywords: adolescents; children; meta-analysis; non-suicidal self-injury; deliberate self-harm; suicide
1. Introduction
During the past 30 years, suicide has become a severe cause of mortality across all ages in theworld. In 2015, the number of suicide deaths worldwide was estimated to be 788,000 [1], with aglobal average of 10.7 per 100,000. Suicide was ranked second as a cause of mortality amongstthose aged 15–29 years old globally [2], making it a global public health concern. Suicidal behavior,deliberate self-harm and non-suicidal self-injury are important antecedents of suicide in childrenand adolescents [2]. Suicidal behaviors involve suicidal ideation, planning for suicide and suicideattempts [3]. Self-harm behavior is defined here as an act of intentionally causing harm to own self,irrespective of the type, motive or suicidal intent [2]. Non-suicidal self-injury is defined as deliberatedirect destruction or alteration of body tissue without conscious suicidal intent [4]. Deliberate self-harmis an encompassing term for self-injurious behavior, both with and without suicidal intent that has anon-fatal outcome [5]. Non-suicidal self-injury and deliberate self-harm are common in young peoplewho will have borderline personality traits or disorder [6]. Non-suicidal self-injury and deliberateself-harm have been known to predict future suicide attempts [7].
There are potential factors that affect the global prevalence of suicidal and self-harm behavior inchildren and adolescents. From cross-cultural perspectives, there are ethnic differences in risk factorsof suicide attempts [8,9]. In Western countries like Canada, suicide accounts for 10% of deaths inchildren aged 10 to 14 years and for 23% of deaths in adolescents aged 15 to 19 years [10]. In NewZealand, children and adolescents from the lowest socio-economic status were found to be 31 timesmore likely to attempt suicide compared to individuals in the higher socio-economic status [11].In Asia, relationship issues, academic and environmental stressors are common precipitants for suicideattempts among young people [12]. In Singapore, a peak in suicide attempts has been observed inadolescents and young adults aged 15 to 24 years old [12]. Cross-cultural studies found that self-harmbehaviors amongst eighth-graders in Hong Kong (23.5%) were less frequent compared to those in theUnited States (32%) [13]. The lower self-harm rate in Hong Kong adolescents was attributed to culturaldifferences between the Eastern and Western cultures, with a stronger emphasis on family structuresand rules in Asian culture [13]. A meta-analysis is required to study cross-cultural perspectives ofsuicidal behavior, deliberate self-harm, and non-suicidal self-injury among young people in differentcountries in a systematic manner.
From a gender perspective, Lewinsohn et al. found female adolescents to have a significantlyhigher risk of suicide attempts compared to male counterparts, with the differences between gendersdiminishing as participants increased with age [14]. Furthermore, gender was found to predict lethalityin suicide attempts as more males than females made attempts with high perceived lethality andmedical lethality [15]. Youth who experienced difficulty in school were at risk for suicide [16]. However,there is little published information specific to the relationship between school attendance, suicidalbehaviors, deliberate self-harm, and non-suicidal self-injury in children and adolescents.
Despite the seriousness and scope of the problem, little is known about the global prevalence ofsuicidal and self-harm behaviors in children and adolescents in the past 30 years. Further research isrequired to compare the prevalence of suicidal, and self-harm behavior among children and adolescentsfrom different geographical regions as contextual differences (e.g., exposure to adversity) acrosscountries may affect prevalence estimates. Given the above findings and observations, we aimed toconduct a meta-analyze to estimate the global 12-month and lifetime prevalence of adolescents having
Int. J. Environ. Res. Public Health 2019, 16, 4581 3 of 26
a history of suicide attempts, suicide plans, suicidal ideation, non-suicidal self-injury, and deliberateself-harm between 1989 to 2018.
2. Methods
2.1. Search Strategy
During the past thirty years, the advent of computer technology, the Internet, and the widespreaduse of social media have affected suicidal behaviors, deliberate self-harm and non-suicidal self-injury inyoung people. Many young people report that computers and the Internet facilitate their communicationwith peers [17]. The effect of social media on suicidal behaviors, deliberate self-harm and non-suicidalself-injury is still under evaluation. Some studies suggested that social media use has led to the growthof suicide clusters [18], while others showed that it had a positive impact on the prevention of suicidegiven the myriad of support platforms for the children and adolescents at risk [19]. Given the abovefindings and observations, this meta-analysis focused from 1989 to 2018.
This study was conducted following the Preferred Reporting Items for Systematic Reviews andMeta-Analyses PRISMA) guidelines. A systematic search was performed with dates covered from 1January 1989 to 31 December 2018, using a combination of search terms (* indicates truncation): ‘suicid*/suicide attempt *’, ‘self harm’ or ’self-harm’,’self injury’ or ’self-injury’, ‘adolescent’, ’youth’, ’young’,’child *’,’teen *’,’student *’,’school *’ and ‘prevalence’. Electronic databases such as PubMed, Webof Science, PsycINFO, and Embase were utilized. The reference lists of reviews, reports, and otherrelevant articles were also examined to identify additional studies.
2.2. Eligibility Criteria
Two authors (K.-S.L. and R.C.H.) independently identified the eligibility of studies. The studiesincluded in this review must fulfil the following inclusion criteria: (1) the study provided cross-sectionaldata on the lifetime and 12-month prevalence of suicidal behavior, deliberate self-harm or non-suicidalself-injury; (2) the study population was children or adolescents and (3) a clear definition of suicidalbehavior, deliberate self-harm or non-suicidal self-injury were reported. Any study that did not meetthe aforementioned inclusion criteria were excluded. Any discrepancies between the two authors werereviewed by another author (C.S.H.) and resolved with consensus.
2.3. Data Extraction
Two authors (K.-S.L. and R.C.H.) independently extracted the following data from each eligiblestudy: first author, year of publication, the country where the study was conducted, number ofparticipants with suicidal behavior, deliberate self-harm or non-suicidal self-injury, total sample size,mean age of participants, proportion of female gender and school attendance. Any disagreementsbetween the two authors were resolved via discussion with a third author (C.S.H.). The three authorsinvolved in this process were trained in medicine and psychiatry.
2.4. Study Outcomes
A suicide attempt is defined as an act in which an adolescent tries to end his or her life butsurvives [20]. A suicide plan is a proposed plan of carrying out a suicidal act that may lead to potentialdeath [21]. Suicidal ideation is defined as any self-reported thoughts of engaging in suicide-relatedbehavior [22]. Non-suicidal self-injury is defined as the deliberate, self-inflicted destruction of bodytissue without suicidal intent and for purposes not socially sanctioned, such as cutting, burning, andbiting [23]. Deliberate self-harm is defined as self-injurious behaviors with and without suicidal intentand that have non-fatal outcomes. The 12-month and lifetime prevalence of suicide attempts, suicideplans, suicide ideation, non-suicidal self-injury, and deliberate self-harm were extracted from eachstudy, which met inclusion criteria.
Int. J. Environ. Res. Public Health 2019, 16, 4581 4 of 26
2.5. Statistical Analysis
All statistical analyses were conducted in Comprehensive Meta-analysis statistical softwareversion 3.0 (BioStat Solutions, Inc, Frederick, MD, USA). The aggregate prevalence was calculatedbased on the random-effects model. The random-effects model was used as it assumes varying effectsizes between studies, because of differing study design and study population [24,25]. A forest plot wasthen constructed and reported the aggregate prevalence, 95% confidence interval (CI) and p-value basedon the method adopted by previous meta-analysis on prevalence [26,27]. The statistical significancelevel was set at p < 0.05. The I2 statistic was used to assess the between-study heterogeneity [28], whichdescribes the percentage of variance on the basis of real differences in study effects. I2 value of 25%was considered low, 50% moderate and 75% substantial [29].
Publication bias was assessed with the utilization of Egger’s regression [25]. A p-values of 0.05 orless was used as the cut off for the presence of statistically significant publication bias [30]. The presenceof publication bias was then further investigated using both the standard and Orwin’s fail-safe Ntests to provide an estimated number of additional studies required to make the eventual effect sizeinsignificant [31]. Meta-regression analyses with a mixed-effect model were performed to identifythe effects of potential moderators on the overall heterogeneity. Potential moderators include meanage of sample and proportion of female gender. Subgroup analyses were performed to compare theaggregate prevalence of each study outcome with regards to school attendance and study location.The definitions of developing and developed countries were based on Standard Country or Area Codesfor Statistical Use developed by the United Nations [32].
3. Results
3.1. Selection Results and Study Characteristics
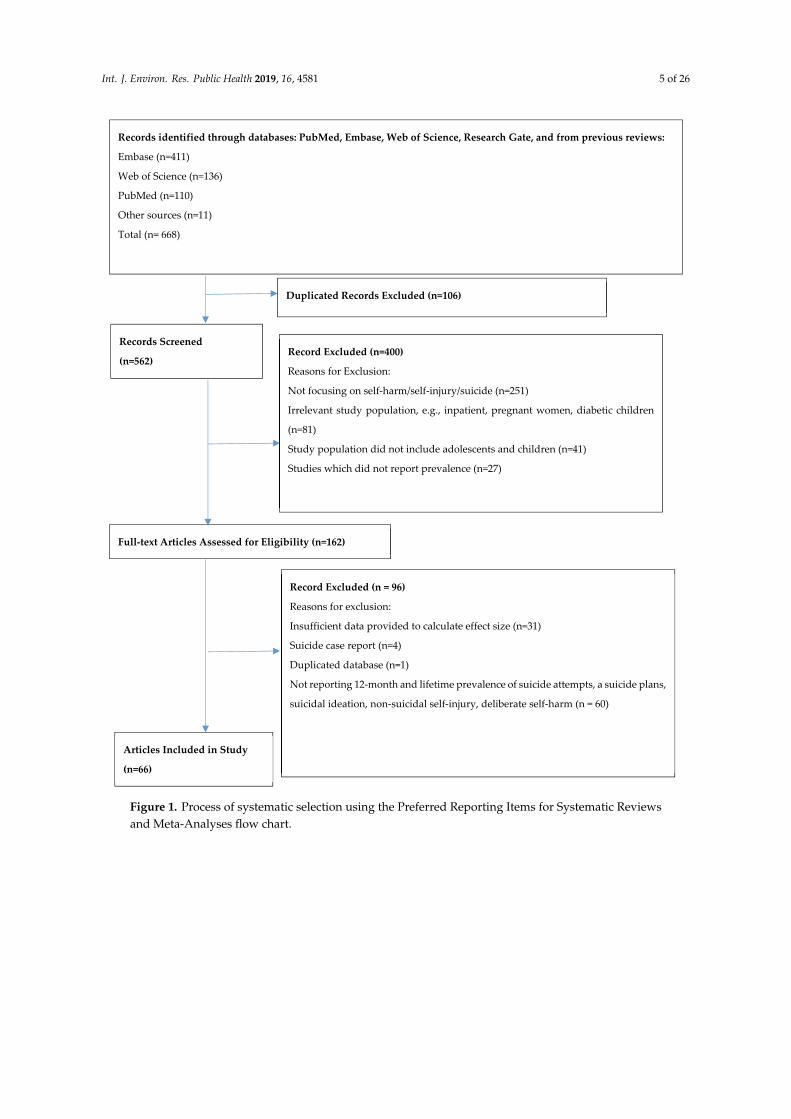
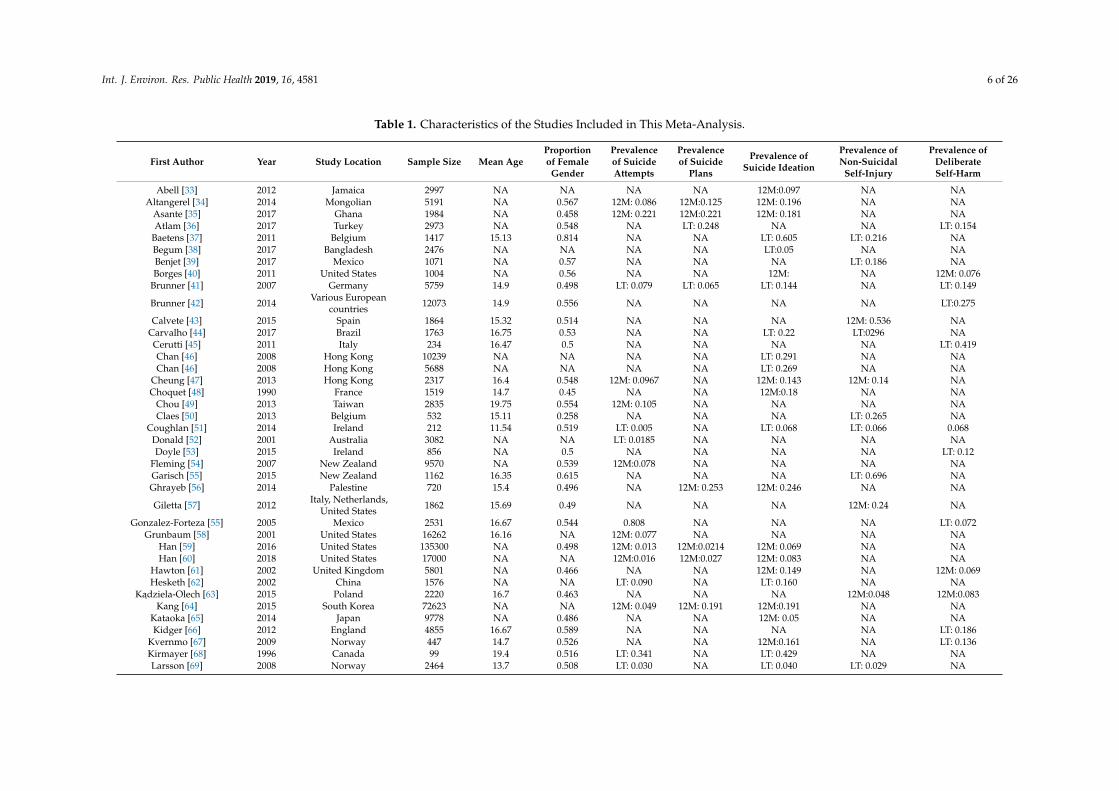
A total of 668 potentially relevant citations were gathered after an extensive literature search wasperformed on the databases listed in Figure 1. A total of 106 studies were found to be duplicated. Of theremaining 562 studies for which titles and abstracts were screened, 400 were excluded. The final 162studies were then reviewed in full, of which 96 were excluded, leaving 66 studies that met the inclusioncriteria to be used in this meta-analysis. The Preferred Reporting Items for Systematic Reviews andMeta-Analyses—chart depicting the detailed process of paper selection can be seen in Figure 1. The 66studies included in the meta-analysis yields a total population of 686,672 study participants. Table 1shows the characteristics of the included studies.
Int. J. Environ. Res. Public Health 2019, 16, 4581 5 of 26
Int. J. Environ. Res. Public Health 2019, 16, x FOR PEER REVIEW 5 of 27
Figure 1. Process of systematic selection using the Preferred Reporting Items for Systematic Reviews and Meta-Analyses flow chart.
Records identified through databases: PubMed, Embase, Web of Science, Research Gate, and from previous reviews:
Embase (n=411)
Web of Science (n=136)
PubMed (n=110)
Other sources (n=11)
Total (n= 668)
Duplicated Records Excluded (n=106)
Records Screened
(n=562) Record Excluded (n=400)
Reasons for Exclusion:
Not focusing on self-harm/self-injury/suicide (n=251)
Irrelevant study population, e.g., inpatient, pregnant women, diabetic children
(n=81)
Study population did not include adolescents and children (n=41)
Studies which did not report prevalence (n=27)
Full-text Articles Assessed for Eligibility (n=162)
Record Excluded (n = 96)
Reasons for exclusion:
Insufficient data provided to calculate effect size (n=31)
Suicide case report (n=4)
Duplicated database (n=1)
Not reporting 12-month and lifetime prevalence of suicide attempts, a suicide plans,
suicidal ideation, non-suicidal self-injury, deliberate self-harm (n = 60)
Articles Included in Study
(n=66)
Figure 1. Process of systematic selection using the Preferred Reporting Items for Systematic Reviewsand Meta-Analyses flow chart.
Int. J. Environ. Res. Public Health 2019, 16, 4581 6 of 26
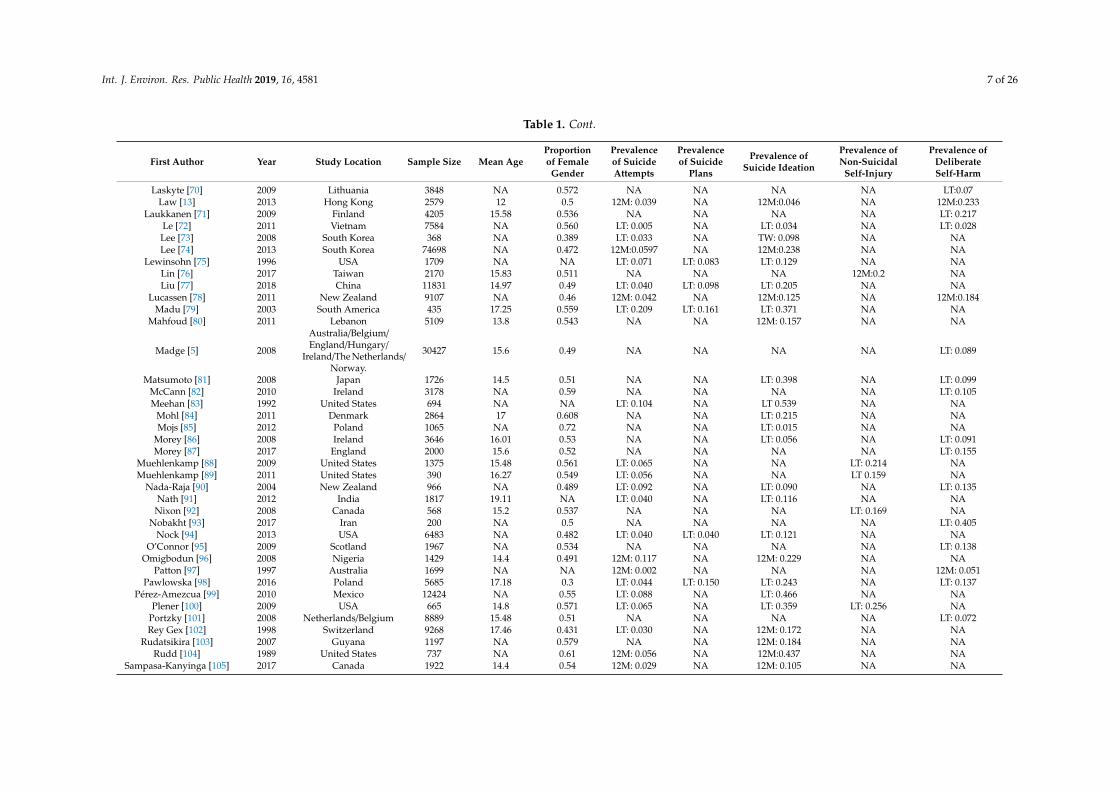
Table 1. Characteristics of the Studies Included in This Meta-Analysis.
First Author Year Study Location Sample Size Mean AgeProportionof Female
Gender
Prevalenceof SuicideAttempts
Prevalenceof Suicide
Plans
Prevalence ofSuicide Ideation
Prevalence ofNon-Suicidal
Self-Injury
Prevalence ofDeliberateSelf-Harm
Abell [33] 2012 Jamaica 2997 NA NA NA NA 12M:0.097 NA NAAltangerel [34] 2014 Mongolian 5191 NA 0.567 12M: 0.086 12M:0.125 12M: 0.196 NA NA
Asante [35] 2017 Ghana 1984 NA 0.458 12M: 0.221 12M:0.221 12M: 0.181 NA NAAtlam [36] 2017 Turkey 2973 NA 0.548 NA LT: 0.248 NA NA LT: 0.154
Baetens [37] 2011 Belgium 1417 15.13 0.814 NA NA LT: 0.605 LT: 0.216 NABegum [38] 2017 Bangladesh 2476 NA NA NA NA LT:0.05 NA NABenjet [39] 2017 Mexico 1071 NA 0.57 NA NA NA LT: 0.186 NABorges [40] 2011 United States 1004 NA 0.56 NA NA 12M: NA 12M: 0.076
Brunner [41] 2007 Germany 5759 14.9 0.498 LT: 0.079 LT: 0.065 LT: 0.144 NA LT: 0.149
Brunner [42] 2014 Various Europeancountries 12073 14.9 0.556 NA NA NA NA LT:0.275
Calvete [43] 2015 Spain 1864 15.32 0.514 NA NA NA 12M: 0.536 NACarvalho [44] 2017 Brazil 1763 16.75 0.53 NA NA LT: 0.22 LT:0296 NACerutti [45] 2011 Italy 234 16.47 0.5 NA NA NA NA LT: 0.419Chan [46] 2008 Hong Kong 10239 NA NA NA NA LT: 0.291 NA NAChan [46] 2008 Hong Kong 5688 NA NA NA NA LT: 0.269 NA NA
Cheung [47] 2013 Hong Kong 2317 16.4 0.548 12M: 0.0967 NA 12M: 0.143 12M: 0.14 NAChoquet [48] 1990 France 1519 14.7 0.45 NA NA 12M:0.18 NA NA
Chou [49] 2013 Taiwan 2835 19.75 0.554 12M: 0.105 NA NA NA NAClaes [50] 2013 Belgium 532 15.11 0.258 NA NA NA LT: 0.265 NA
Coughlan [51] 2014 Ireland 212 11.54 0.519 LT: 0.005 NA LT: 0.068 LT: 0.066 0.068Donald [52] 2001 Australia 3082 NA NA LT: 0.0185 NA NA NA NADoyle [53] 2015 Ireland 856 NA 0.5 NA NA NA NA LT: 0.12
Fleming [54] 2007 New Zealand 9570 NA 0.539 12M:0.078 NA NA NA NAGarisch [55] 2015 New Zealand 1162 16.35 0.615 NA NA NA LT: 0.696 NAGhrayeb [56] 2014 Palestine 720 15.4 0.496 NA 12M: 0.253 12M: 0.246 NA NA
Giletta [57] 2012 Italy, Netherlands,United States 1862 15.69 0.49 NA NA NA 12M: 0.24 NA
Gonzalez-Forteza [55] 2005 Mexico 2531 16.67 0.544 0.808 NA NA NA LT: 0.072Grunbaum [58] 2001 United States 16262 16.16 NA 12M: 0.077 NA NA NA NA
Han [59] 2016 United States 135300 NA 0.498 12M: 0.013 12M:0.0214 12M: 0.069 NA NAHan [60] 2018 United States 17000 NA NA 12M:0.016 12M:0.027 12M: 0.083 NA NA
Hawton [61] 2002 United Kingdom 5801 NA 0.466 NA NA 12M: 0.149 NA 12M: 0.069Hesketh [62] 2002 China 1576 NA NA LT: 0.090 NA LT: 0.160 NA NA
Kadziela-Olech [63] 2015 Poland 2220 16.7 0.463 NA NA NA 12M:0.048 12M:0.083Kang [64] 2015 South Korea 72623 NA NA 12M: 0.049 12M: 0.191 12M:0.191 NA NA
Kataoka [65] 2014 Japan 9778 NA 0.486 NA NA 12M: 0.05 NA NAKidger [66] 2012 England 4855 16.67 0.589 NA NA NA NA LT: 0.186
Kvernmo [67] 2009 Norway 447 14.7 0.526 NA NA 12M:0.161 NA LT: 0.136Kirmayer [68] 1996 Canada 99 19.4 0.516 LT: 0.341 NA LT: 0.429 NA NALarsson [69] 2008 Norway 2464 13.7 0.508 LT: 0.030 NA LT: 0.040 LT: 0.029 NA
Int. J. Environ. Res. Public Health 2019, 16, 4581 7 of 26
Table 1. Cont.
First Author Year Study Location Sample Size Mean AgeProportionof Female
Gender
Prevalenceof SuicideAttempts
Prevalenceof Suicide
Plans
Prevalence ofSuicide Ideation
Prevalence ofNon-Suicidal
Self-Injury
Prevalence ofDeliberateSelf-Harm
Laskyte [70] 2009 Lithuania 3848 NA 0.572 NA NA NA NA LT:0.07Law [13] 2013 Hong Kong 2579 12 0.5 12M: 0.039 NA 12M:0.046 NA 12M:0.233
Laukkanen [71] 2009 Finland 4205 15.58 0.536 NA NA NA NA LT: 0.217Le [72] 2011 Vietnam 7584 NA 0.560 LT: 0.005 NA LT: 0.034 NA LT: 0.028Lee [73] 2008 South Korea 368 NA 0.389 LT: 0.033 NA TW: 0.098 NA NALee [74] 2013 South Korea 74698 NA 0.472 12M:0.0597 NA 12M:0.238 NA NA
Lewinsohn [75] 1996 USA 1709 NA NA LT: 0.071 LT: 0.083 LT: 0.129 NA NALin [76] 2017 Taiwan 2170 15.83 0.511 NA NA NA 12M:0.2 NALiu [77] 2018 China 11831 14.97 0.49 LT: 0.040 LT: 0.098 LT: 0.205 NA NA
Lucassen [78] 2011 New Zealand 9107 NA 0.46 12M: 0.042 NA 12M:0.125 NA 12M:0.184Madu [79] 2003 South America 435 17.25 0.559 LT: 0.209 LT: 0.161 LT: 0.371 NA NA
Mahfoud [80] 2011 Lebanon 5109 13.8 0.543 NA NA 12M: 0.157 NA NA
Madge [5] 2008
Australia/Belgium/England/Hungary/
Ireland/The Netherlands/Norway.
30427 15.6 0.49 NA NA NA NA LT: 0.089
Matsumoto [81] 2008 Japan 1726 14.5 0.51 NA NA LT: 0.398 NA LT: 0.099McCann [82] 2010 Ireland 3178 NA 0.59 NA NA NA NA LT: 0.105Meehan [83] 1992 United States 694 NA NA LT: 0.104 NA LT 0.539 NA NA
Mohl [84] 2011 Denmark 2864 17 0.608 NA NA LT: 0.215 NA NAMojs [85] 2012 Poland 1065 NA 0.72 NA NA LT: 0.015 NA NA
Morey [86] 2008 Ireland 3646 16.01 0.53 NA NA LT: 0.056 NA LT: 0.091Morey [87] 2017 England 2000 15.6 0.52 NA NA NA NA LT: 0.155
Muehlenkamp [88] 2009 United States 1375 15.48 0.561 LT: 0.065 NA NA LT: 0.214 NAMuehlenkamp [89] 2011 United States 390 16.27 0.549 LT: 0.056 NA NA LT 0.159 NA
Nada-Raja [90] 2004 New Zealand 966 NA 0.489 LT: 0.092 NA LT: 0.090 NA LT: 0.135Nath [91] 2012 India 1817 19.11 NA LT: 0.040 NA LT: 0.116 NA NA
Nixon [92] 2008 Canada 568 15.2 0.537 NA NA NA LT: 0.169 NANobakht [93] 2017 Iran 200 NA 0.5 NA NA NA NA LT: 0.405
Nock [94] 2013 USA 6483 NA 0.482 LT: 0.040 LT: 0.040 LT: 0.121 NA NAO’Connor [95] 2009 Scotland 1967 NA 0.534 NA NA NA NA LT: 0.138
Omigbodun [96] 2008 Nigeria 1429 14.4 0.491 12M: 0.117 NA 12M: 0.229 NA NAPatton [97] 1997 Australia 1699 NA NA 12M: 0.002 NA NA NA 12M: 0.051
Pawlowska [98] 2016 Poland 5685 17.18 0.3 LT: 0.044 LT: 0.150 LT: 0.243 NA LT: 0.137Pérez-Amezcua [99] 2010 Mexico 12424 NA 0.55 LT: 0.088 NA LT: 0.466 NA NA
Plener [100] 2009 USA 665 14.8 0.571 LT: 0.065 NA LT: 0.359 LT: 0.256 NAPortzky [101] 2008 Netherlands/Belgium 8889 15.48 0.51 NA NA NA NA LT: 0.072Rey Gex [102] 1998 Switzerland 9268 17.46 0.431 LT: 0.030 NA 12M: 0.172 NA NA
Rudatsikira [103] 2007 Guyana 1197 NA 0.579 NA NA 12M: 0.184 NA NARudd [104] 1989 United States 737 NA 0.61 12M: 0.056 NA 12M:0.437 NA NA
Sampasa-Kanyinga [105] 2017 Canada 1922 14.4 0.54 12M: 0.029 NA 12M: 0.105 NA NA
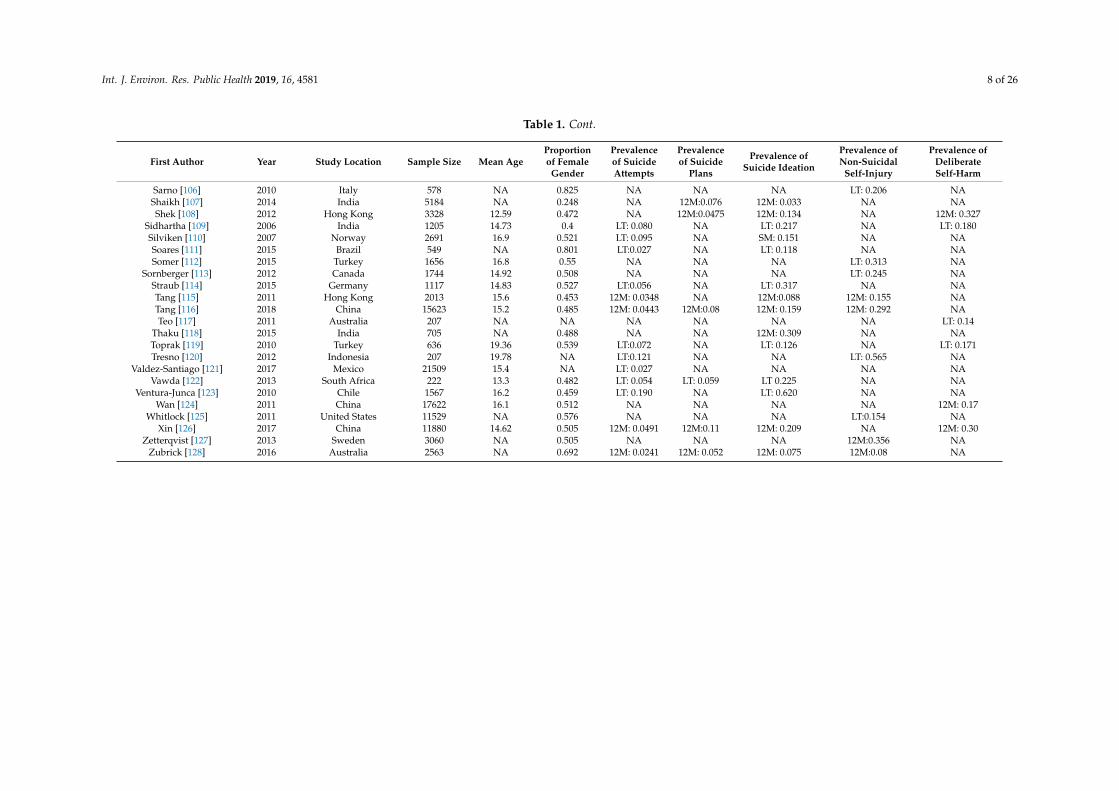
Int. J. Environ. Res. Public Health 2019, 16, 4581 8 of 26
Table 1. Cont.
First Author Year Study Location Sample Size Mean AgeProportionof Female
Gender
Prevalenceof SuicideAttempts
Prevalenceof Suicide
Plans
Prevalence ofSuicide Ideation
Prevalence ofNon-Suicidal
Self-Injury
Prevalence ofDeliberateSelf-Harm
Sarno [106] 2010 Italy 578 NA 0.825 NA NA NA LT: 0.206 NAShaikh [107] 2014 India 5184 NA 0.248 NA 12M:0.076 12M: 0.033 NA NAShek [108] 2012 Hong Kong 3328 12.59 0.472 NA 12M:0.0475 12M: 0.134 NA 12M: 0.327
Sidhartha [109] 2006 India 1205 14.73 0.4 LT: 0.080 NA LT: 0.217 NA LT: 0.180Silviken [110] 2007 Norway 2691 16.9 0.521 LT: 0.095 NA SM: 0.151 NA NASoares [111] 2015 Brazil 549 NA 0.801 LT:0.027 NA LT: 0.118 NA NASomer [112] 2015 Turkey 1656 16.8 0.55 NA NA NA LT: 0.313 NA
Sornberger [113] 2012 Canada 1744 14.92 0.508 NA NA NA LT: 0.245 NAStraub [114] 2015 Germany 1117 14.83 0.527 LT:0.056 NA LT: 0.317 NA NATang [115] 2011 Hong Kong 2013 15.6 0.453 12M: 0.0348 NA 12M:0.088 12M: 0.155 NATang [116] 2018 China 15623 15.2 0.485 12M: 0.0443 12M:0.08 12M: 0.159 12M: 0.292 NATeo [117] 2011 Australia 207 NA NA NA NA NA NA LT: 0.14
Thaku [118] 2015 India 705 NA 0.488 NA NA 12M: 0.309 NA NAToprak [119] 2010 Turkey 636 19.36 0.539 LT:0.072 NA LT: 0.126 NA LT: 0.171Tresno [120] 2012 Indonesia 207 19.78 NA LT:0.121 NA NA LT: 0.565 NA
Valdez-Santiago [121] 2017 Mexico 21509 15.4 NA LT: 0.027 NA NA NA NAVawda [122] 2013 South Africa 222 13.3 0.482 LT: 0.054 LT: 0.059 LT 0.225 NA NA
Ventura-Junca [123] 2010 Chile 1567 16.2 0.459 LT: 0.190 NA LT: 0.620 NA NAWan [124] 2011 China 17622 16.1 0.512 NA NA NA NA 12M: 0.17
Whitlock [125] 2011 United States 11529 NA 0.576 NA NA NA LT:0.154 NAXin [126] 2017 China 11880 14.62 0.505 12M: 0.0491 12M:0.11 12M: 0.209 NA 12M: 0.30
Zetterqvist [127] 2013 Sweden 3060 NA 0.505 NA NA NA 12M:0.356 NAZubrick [128] 2016 Australia 2563 NA 0.692 12M: 0.0241 12M: 0.052 12M: 0.075 12M:0.08 NA
Int. J. Environ. Res. Public Health 2019, 16, 4581 9 of 26
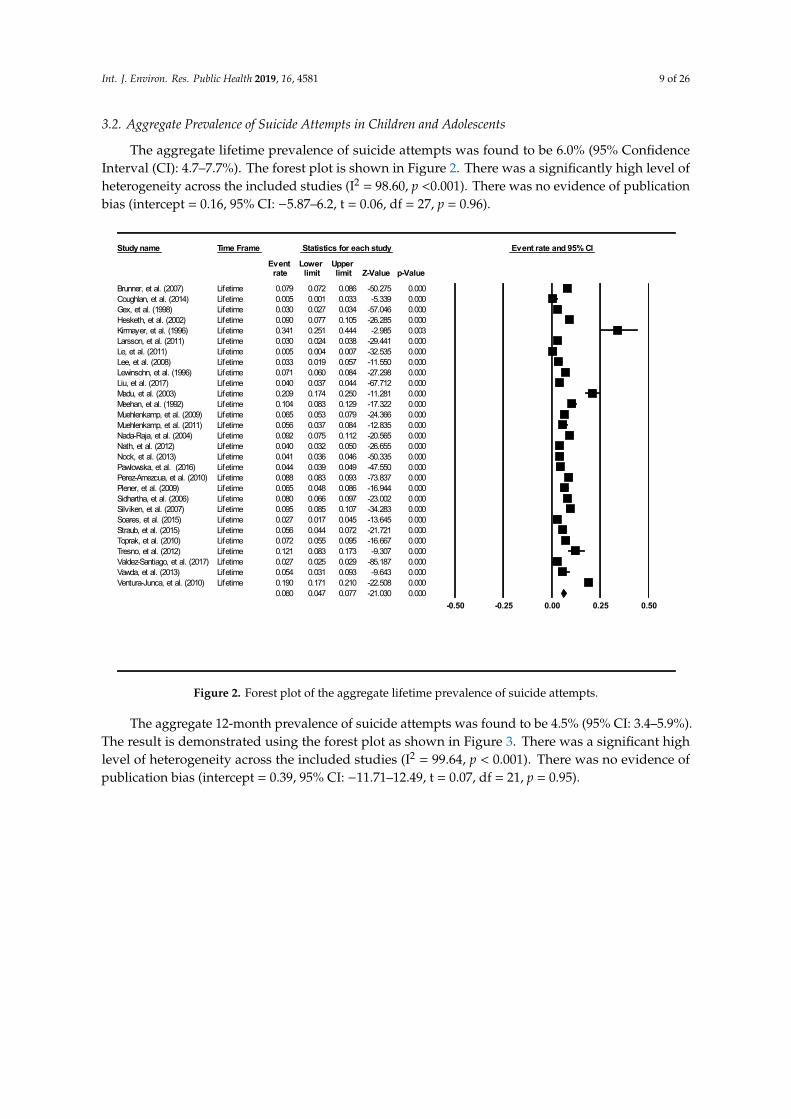
3.2. Aggregate Prevalence of Suicide Attempts in Children and Adolescents
The aggregate lifetime prevalence of suicide attempts was found to be 6.0% (95% ConfidenceInterval (CI): 4.7–7.7%). The forest plot is shown in Figure 2. There was a significantly high level ofheterogeneity across the included studies (I2 = 98.60, p <0.001). There was no evidence of publicationbias (intercept = 0.16, 95% CI: −5.87–6.2, t = 0.06, df = 27, p = 0.96).
Int. J. Environ. Res. Public Health 2019, 16, x FOR PEER REVIEW 10 of 27
3.2. Aggregate Prevalence of Suicide Attempts in Children and Adolescents
The aggregate lifetime prevalence of suicide attempts was found to be 6.0% (95% Confidence Interval (CI): 4.7–7.7%). The forest plot is shown in Figure 2. There was a significantly high level of heterogeneity across the included studies (I2 = 98.60, p <0.001). There was no evidence of publication bias (intercept = 0.16, 95% CI: −5.87–6.2, t = 0.06, df = 27, p = 0.96).
Figure 2. Forest plot of the aggregate lifetime prevalence of suicide attempts.
The aggregate 12-month prevalence of suicide attempts was found to be 4.5% (95% CI: 3.4–5.9%). The result is demonstrated using the forest plot as shown in Figure 3. There was a significant high level of heterogeneity across the included studies (I2 = 99.64, p < 0.001). There was no evidence of publication bias (intercept = 0.39, 95% CI: −11.71–12.49, t = 0.07, df = 21, p = 0.95).
Study name Time Frame Statistics for each study Event rate and 95% CI
Event Lower Upper rate limit limit Z-Value p-Value
Brunner, et al. (2007) Lifetime 0.079 0.072 0.086 -50.275 0.000Coughlan, et al. (2014) Lifetime 0.005 0.001 0.033 -5.339 0.000Gex, et al. (1998) Lifetime 0.030 0.027 0.034 -57.046 0.000Hesketh, et al. (2002) Lifetime 0.090 0.077 0.105 -26.285 0.000Kirmayer, et al. (1996) Lifetime 0.341 0.251 0.444 -2.985 0.003Larsson, et al. (2011) Lifetime 0.030 0.024 0.038 -29.441 0.000Le, et al. (2011) Lifetime 0.005 0.004 0.007 -32.535 0.000Lee, et al. (2008) Lifetime 0.033 0.019 0.057 -11.550 0.000Lewinsohn, et al. (1996) Lifetime 0.071 0.060 0.084 -27.298 0.000Liu, et al. (2017) Lifetime 0.040 0.037 0.044 -67.712 0.000Madu, et al. (2003) Lifetime 0.209 0.174 0.250 -11.281 0.000Meehan, et al. (1992) Lifetime 0.104 0.083 0.129 -17.322 0.000Muehlenkamp, et al. (2009) Lifetime 0.065 0.053 0.079 -24.366 0.000Muehlenkamp, et al. (2011) Lifetime 0.056 0.037 0.084 -12.835 0.000Nada-Raja, et al. (2004) Lifetime 0.092 0.075 0.112 -20.565 0.000Nath, et al. (2012) Lifetime 0.040 0.032 0.050 -26.655 0.000Nock, et al. (2013) Lifetime 0.041 0.036 0.046 -50.335 0.000Pawlowska, et al. (2016) Lifetime 0.044 0.039 0.049 -47.550 0.000Perez-Amezcua, et al. (2010) Lifetime 0.088 0.083 0.093 -73.837 0.000Plener, et al. (2009) Lifetime 0.065 0.048 0.086 -16.944 0.000Sidhartha, et al. (2006) Lifetime 0.080 0.066 0.097 -23.002 0.000Silviken, et al. (2007) Lifetime 0.095 0.085 0.107 -34.283 0.000Soares, et al. (2015) Lifetime 0.027 0.017 0.045 -13.645 0.000Straub, et al. (2015) Lifetime 0.056 0.044 0.072 -21.721 0.000Toprak, et al. (2010) Lifetime 0.072 0.055 0.095 -16.667 0.000Tresno, et al. (2012) Lifetime 0.121 0.083 0.173 -9.307 0.000Valdez-Santiago, et al. (2017) Lifetime 0.027 0.025 0.029 -85.187 0.000Vawda, et al. (2013) Lifetime 0.054 0.031 0.093 -9.643 0.000Ventura-Junca, et al. (2010) Lifetime 0.190 0.171 0.210 -22.508 0.000
0.060 0.047 0.077 -21.030 0.000-0.50 -0.25 0.00 0.25 0.50
Figure 2. Forest plot of the aggregate lifetime prevalence of suicide attempts.
The aggregate 12-month prevalence of suicide attempts was found to be 4.5% (95% CI: 3.4–5.9%).The result is demonstrated using the forest plot as shown in Figure 3. There was a significant highlevel of heterogeneity across the included studies (I2 = 99.64, p < 0.001). There was no evidence ofpublication bias (intercept = 0.39, 95% CI: −11.71–12.49, t = 0.07, df = 21, p = 0.95).
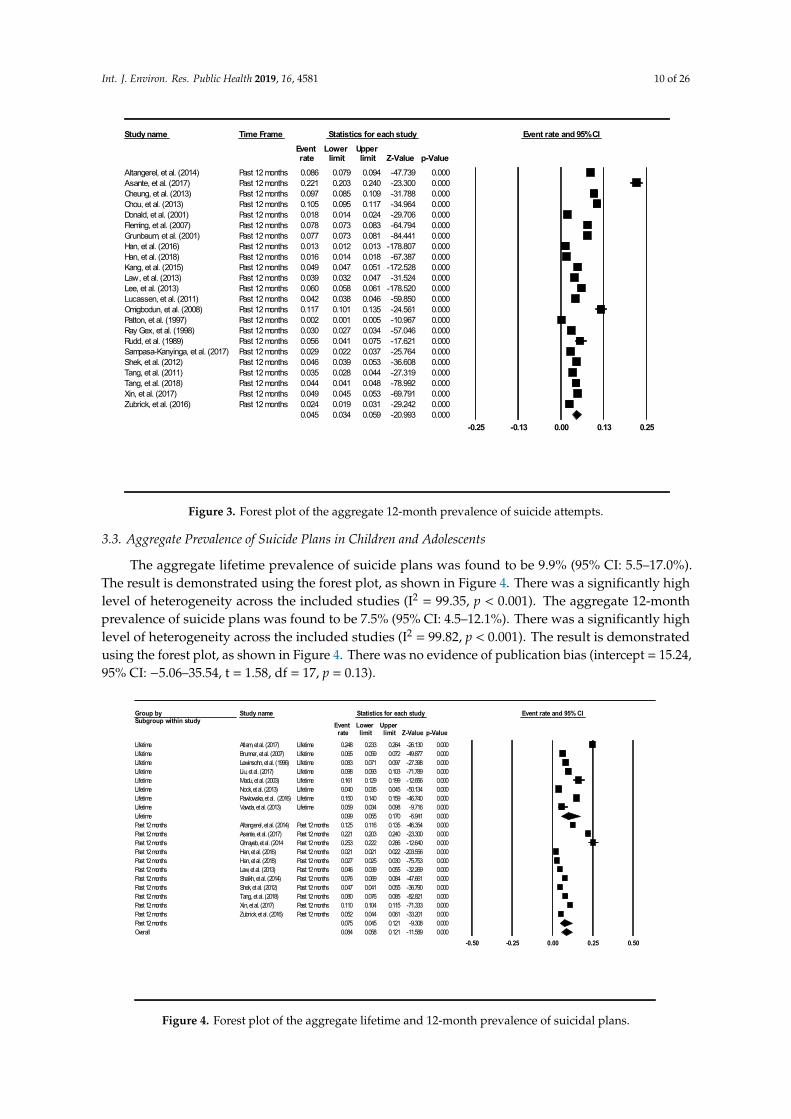
Int. J. Environ. Res. Public Health 2019, 16, 4581 10 of 26Int. J. Environ. Res. Public Health 2019, 16, x FOR PEER REVIEW 11 of 27
Figure 3. Forest plot of the aggregate 12-month prevalence of suicide attempts.
3.3. Aggregate Prevalence of Suicide Plans in Children and Adolescents
The aggregate lifetime prevalence of suicide plans was found to be 9.9% (95% CI: 5.5–17.0%). The result is demonstrated using the forest plot, as shown in Figure 4. There was a significantly high level of heterogeneity across the included studies (I2 = 99.35, p < 0.001). The aggregate 12-month prevalence of suicide plans was found to be 7.5% (95% CI: 4.5–12.1%). There was a significantly high level of heterogeneity across the included studies (I2 = 99.82, p < 0.001). The result is demonstrated using the forest plot, as shown in Figure 4. There was no evidence of publication bias (intercept = 15.24, 95% CI: −5.06–35.54, t = 1.58, df = 17, p = 0.13).
Figure 4. Forest plot of the aggregate lifetime and 12-month prevalence of suicidal plans.
Study name Time Frame Statistics for each study Event rate and 95% CIEvent Lower Upper rate limit limit Z-Value p-Value
Altangerel, et al. (2014) Past 12 months 0.086 0.079 0.094 -47.739 0.000Asante, et al. (2017) Past 12 months 0.221 0.203 0.240 -23.300 0.000Cheung, et al. (2013) Past 12 months 0.097 0.085 0.109 -31.788 0.000Chou, et al. (2013) Past 12 months 0.105 0.095 0.117 -34.964 0.000Donald, et al. (2001) Past 12 months 0.018 0.014 0.024 -29.706 0.000Fleming, et al. (2007) Past 12 months 0.078 0.073 0.083 -64.794 0.000Grunbaum, et al. (2001) Past 12 months 0.077 0.073 0.081 -84.441 0.000Han, et al. (2016) Past 12 months 0.013 0.012 0.013 -178.807 0.000Han, et al. (2018) Past 12 months 0.016 0.014 0.018 -67.387 0.000Kang, et al. (2015) Past 12 months 0.049 0.047 0.051 -172.528 0.000Law, et al. (2013) Past 12 months 0.039 0.032 0.047 -31.524 0.000Lee, et al. (2013) Past 12 months 0.060 0.058 0.061 -178.520 0.000Lucassen, et al. (2011) Past 12 months 0.042 0.038 0.046 -59.850 0.000Omigbodun, et al. (2008) Past 12 months 0.117 0.101 0.135 -24.561 0.000Patton, et al. (1997) Past 12 months 0.002 0.001 0.005 -10.967 0.000Ray Gex, et al. (1998) Past 12 months 0.030 0.027 0.034 -57.046 0.000Rudd, et al. (1989) Past 12 months 0.056 0.041 0.075 -17.621 0.000Sampasa-Kanyinga, et al. (2017) Past 12 months 0.029 0.022 0.037 -25.764 0.000Shek, et al. (2012) Past 12 months 0.046 0.039 0.053 -36.608 0.000Tang, et al. (2011) Past 12 months 0.035 0.028 0.044 -27.319 0.000Tang, et al. (2018) Past 12 months 0.044 0.041 0.048 -78.992 0.000Xin, et al. (2017) Past 12 months 0.049 0.045 0.053 -69.791 0.000Zubrick, et al. (2016) Past 12 months 0.024 0.019 0.031 -29.242 0.000
0.045 0.034 0.059 -20.993 0.000-0.25 -0.13 0.00 0.13 0.25
Group bySubgroup within study
Study name Statistics for each study Event rate and 95% CIEvent Lower Upper rate limit limit Z-Value p-Value
Lifetime Atlam, et al. (2017) Lifetime 0.248 0.233 0.264 -26.130 0.000Lifetime Brunner, et al. (2007) Lifetime 0.065 0.059 0.072 -49.877 0.000Lifetime Lewinsohn, et al. (1996) Lifetime 0.083 0.071 0.097 -27.398 0.000Lifetime Liu, et al. (2017) Lifetime 0.098 0.093 0.103 -71.789 0.000Lifetime Madu, et al. (2003) Lifetime 0.161 0.129 0.199 -12.656 0.000Lifetime Nock, et al. (2013) Lifetime 0.040 0.035 0.045 -50.134 0.000Lifetime Pawlowska, et al. (2016) Lifetime 0.150 0.140 0.159 -46.740 0.000Lifetime Vawda, et al. (2013) Lifetime 0.059 0.034 0.098 -9.716 0.000Lifetime 0.099 0.055 0.170 -6.941 0.000Past 12 months Altangerel, et al. (2014) Past 12 months 0.125 0.116 0.135 -46.354 0.000Past 12 months Asante, et al. (2017) Past 12 months 0.221 0.203 0.240 -23.300 0.000Past 12 months Ghrayeb, et al. (2014 Past 12 months 0.253 0.222 0.286 -12.640 0.000Past 12 months Han, et al. (2016) Past 12 months 0.021 0.021 0.022 -203.556 0.000Past 12 months Han, et al. (2018) Past 12 months 0.027 0.025 0.030 -75.753 0.000Past 12 months Law, et al. (2013) Past 12 months 0.046 0.039 0.055 -32.269 0.000Past 12 months Shaikh, et al. (2014) Past 12 months 0.076 0.069 0.084 -47.661 0.000Past 12 months Shek, et al. (2012) Past 12 months 0.047 0.041 0.055 -36.790 0.000Past 12 months Tang, et al. (2018) Past 12 months 0.080 0.076 0.085 -82.821 0.000Past 12 months Xin, et al. (2017) Past 12 months 0.110 0.104 0.115 -71.333 0.000Past 12 months Zubrick, et al. (2016) Past 12 months 0.052 0.044 0.061 -33.201 0.000Past 12 months 0.075 0.045 0.121 -9.308 0.000Overall 0.084 0.058 0.121 -11.589 0.000
-0.50 -0.25 0.00 0.25 0.50
Figure 3. Forest plot of the aggregate 12-month prevalence of suicide attempts.
3.3. Aggregate Prevalence of Suicide Plans in Children and Adolescents
The aggregate lifetime prevalence of suicide plans was found to be 9.9% (95% CI: 5.5–17.0%).The result is demonstrated using the forest plot, as shown in Figure 4. There was a significantly highlevel of heterogeneity across the included studies (I2 = 99.35, p < 0.001). The aggregate 12-monthprevalence of suicide plans was found to be 7.5% (95% CI: 4.5–12.1%). There was a significantly highlevel of heterogeneity across the included studies (I2 = 99.82, p < 0.001). The result is demonstratedusing the forest plot, as shown in Figure 4. There was no evidence of publication bias (intercept = 15.24,95% CI: −5.06–35.54, t = 1.58, df = 17, p = 0.13).
Int. J. Environ. Res. Public Health 2019, 16, x FOR PEER REVIEW 11 of 27
Figure 3. Forest plot of the aggregate 12-month prevalence of suicide attempts.
3.3. Aggregate Prevalence of Suicide Plans in Children and Adolescents
The aggregate lifetime prevalence of suicide plans was found to be 9.9% (95% CI: 5.5–17.0%). The result is demonstrated using the forest plot, as shown in Figure 4. There was a significantly high level of heterogeneity across the included studies (I2 = 99.35, p < 0.001). The aggregate 12-month prevalence of suicide plans was found to be 7.5% (95% CI: 4.5–12.1%). There was a significantly high level of heterogeneity across the included studies (I2 = 99.82, p < 0.001). The result is demonstrated using the forest plot, as shown in Figure 4. There was no evidence of publication bias (intercept = 15.24, 95% CI: −5.06–35.54, t = 1.58, df = 17, p = 0.13).
Figure 4. Forest plot of the aggregate lifetime and 12-month prevalence of suicidal plans.
Study name Time Frame Statistics for each study Event rate and 95% CIEvent Lower Upper rate limit limit Z-Value p-Value
Altangerel, et al. (2014) Past 12 months 0.086 0.079 0.094 -47.739 0.000Asante, et al. (2017) Past 12 months 0.221 0.203 0.240 -23.300 0.000Cheung, et al. (2013) Past 12 months 0.097 0.085 0.109 -31.788 0.000Chou, et al. (2013) Past 12 months 0.105 0.095 0.117 -34.964 0.000Donald, et al. (2001) Past 12 months 0.018 0.014 0.024 -29.706 0.000Fleming, et al. (2007) Past 12 months 0.078 0.073 0.083 -64.794 0.000Grunbaum, et al. (2001) Past 12 months 0.077 0.073 0.081 -84.441 0.000Han, et al. (2016) Past 12 months 0.013 0.012 0.013 -178.807 0.000Han, et al. (2018) Past 12 months 0.016 0.014 0.018 -67.387 0.000Kang, et al. (2015) Past 12 months 0.049 0.047 0.051 -172.528 0.000Law, et al. (2013) Past 12 months 0.039 0.032 0.047 -31.524 0.000Lee, et al. (2013) Past 12 months 0.060 0.058 0.061 -178.520 0.000Lucassen, et al. (2011) Past 12 months 0.042 0.038 0.046 -59.850 0.000Omigbodun, et al. (2008) Past 12 months 0.117 0.101 0.135 -24.561 0.000Patton, et al. (1997) Past 12 months 0.002 0.001 0.005 -10.967 0.000Ray Gex, et al. (1998) Past 12 months 0.030 0.027 0.034 -57.046 0.000Rudd, et al. (1989) Past 12 months 0.056 0.041 0.075 -17.621 0.000Sampasa-Kanyinga, et al. (2017) Past 12 months 0.029 0.022 0.037 -25.764 0.000Shek, et al. (2012) Past 12 months 0.046 0.039 0.053 -36.608 0.000Tang, et al. (2011) Past 12 months 0.035 0.028 0.044 -27.319 0.000Tang, et al. (2018) Past 12 months 0.044 0.041 0.048 -78.992 0.000Xin, et al. (2017) Past 12 months 0.049 0.045 0.053 -69.791 0.000Zubrick, et al. (2016) Past 12 months 0.024 0.019 0.031 -29.242 0.000
0.045 0.034 0.059 -20.993 0.000-0.25 -0.13 0.00 0.13 0.25
Group bySubgroup within study
Study name Statistics for each study Event rate and 95% CIEvent Lower Upper rate limit limit Z-Value p-Value
Lifetime Atlam, et al. (2017) Lifetime 0.248 0.233 0.264 -26.130 0.000Lifetime Brunner, et al. (2007) Lifetime 0.065 0.059 0.072 -49.877 0.000Lifetime Lewinsohn, et al. (1996) Lifetime 0.083 0.071 0.097 -27.398 0.000Lifetime Liu, et al. (2017) Lifetime 0.098 0.093 0.103 -71.789 0.000Lifetime Madu, et al. (2003) Lifetime 0.161 0.129 0.199 -12.656 0.000Lifetime Nock, et al. (2013) Lifetime 0.040 0.035 0.045 -50.134 0.000Lifetime Pawlowska, et al. (2016) Lifetime 0.150 0.140 0.159 -46.740 0.000Lifetime Vawda, et al. (2013) Lifetime 0.059 0.034 0.098 -9.716 0.000Lifetime 0.099 0.055 0.170 -6.941 0.000Past 12 months Altangerel, et al. (2014) Past 12 months 0.125 0.116 0.135 -46.354 0.000Past 12 months Asante, et al. (2017) Past 12 months 0.221 0.203 0.240 -23.300 0.000Past 12 months Ghrayeb, et al. (2014 Past 12 months 0.253 0.222 0.286 -12.640 0.000Past 12 months Han, et al. (2016) Past 12 months 0.021 0.021 0.022 -203.556 0.000Past 12 months Han, et al. (2018) Past 12 months 0.027 0.025 0.030 -75.753 0.000Past 12 months Law, et al. (2013) Past 12 months 0.046 0.039 0.055 -32.269 0.000Past 12 months Shaikh, et al. (2014) Past 12 months 0.076 0.069 0.084 -47.661 0.000Past 12 months Shek, et al. (2012) Past 12 months 0.047 0.041 0.055 -36.790 0.000Past 12 months Tang, et al. (2018) Past 12 months 0.080 0.076 0.085 -82.821 0.000Past 12 months Xin, et al. (2017) Past 12 months 0.110 0.104 0.115 -71.333 0.000Past 12 months Zubrick, et al. (2016) Past 12 months 0.052 0.044 0.061 -33.201 0.000Past 12 months 0.075 0.045 0.121 -9.308 0.000Overall 0.084 0.058 0.121 -11.589 0.000
-0.50 -0.25 0.00 0.25 0.50
Figure 4. Forest plot of the aggregate lifetime and 12-month prevalence of suicidal plans.
Int. J. Environ. Res. Public Health 2019, 16, 4581 11 of 26
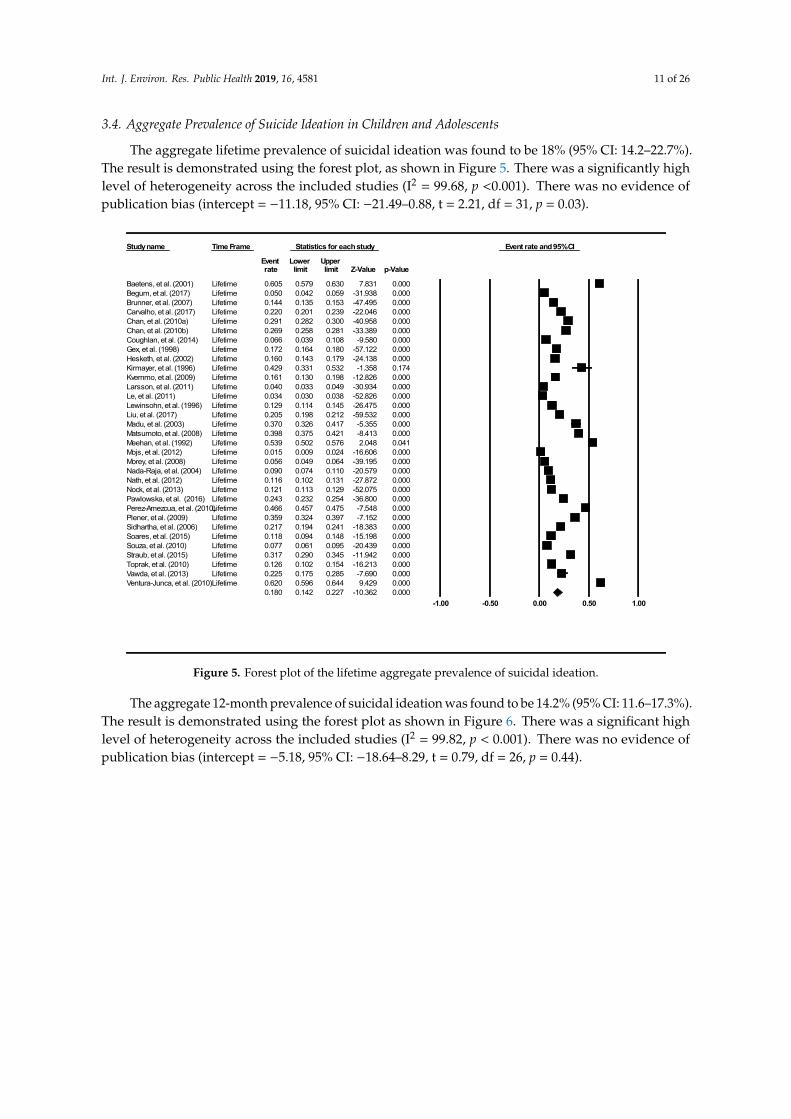
3.4. Aggregate Prevalence of Suicide Ideation in Children and Adolescents
The aggregate lifetime prevalence of suicidal ideation was found to be 18% (95% CI: 14.2–22.7%).The result is demonstrated using the forest plot, as shown in Figure 5. There was a significantly highlevel of heterogeneity across the included studies (I2 = 99.68, p <0.001). There was no evidence ofpublication bias (intercept = −11.18, 95% CI: −21.49–0.88, t = 2.21, df = 31, p = 0.03).
Int. J. Environ. Res. Public Health 2019, 16, x FOR PEER REVIEW 12 of 27
3.4. Aggregate Prevalence of Suicide Ideation in Children and Adolescents
The aggregate lifetime prevalence of suicidal ideation was found to be 18% (95% CI: 14.2–22.7%). The result is demonstrated using the forest plot, as shown in Figure 5. There was a significantly high level of heterogeneity across the included studies (I2 = 99.68, p <0.001). There was no evidence of publication bias (intercept = −11.18, 95% CI: −21.49–0.88, t = 2.21, df = 31, p = 0.03).
Figure 5. Forest plot of the lifetime aggregate prevalence of suicidal ideation.
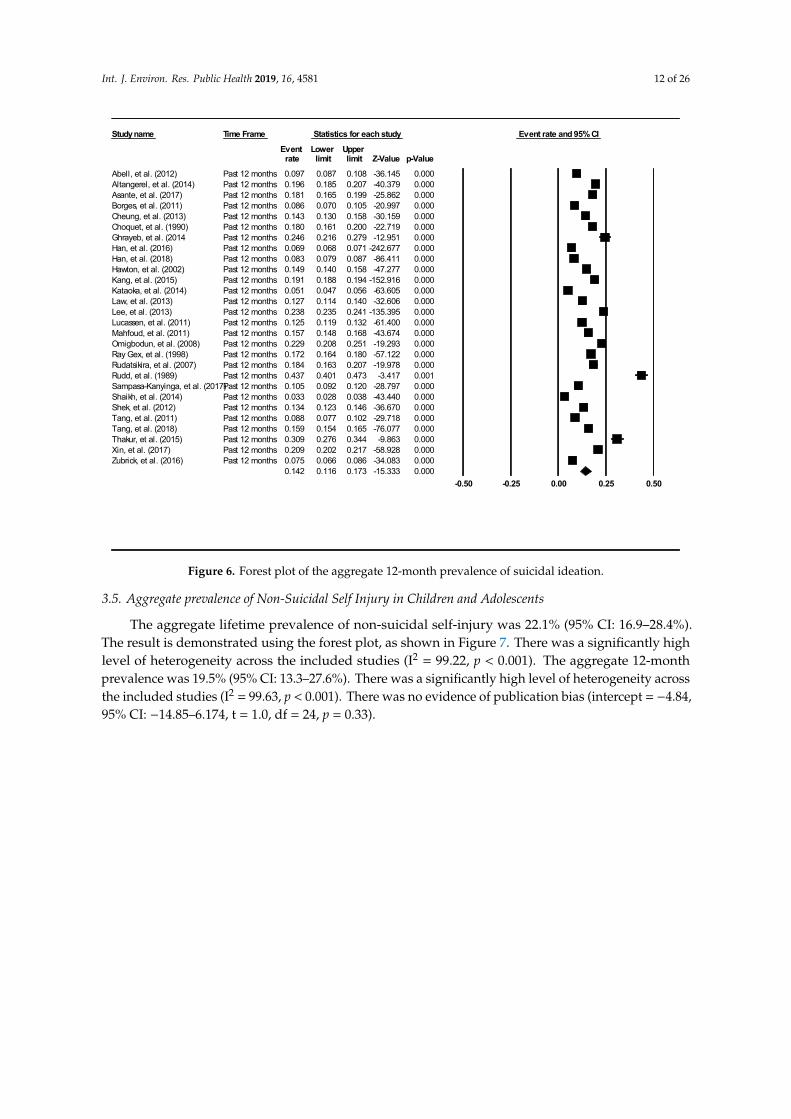
The aggregate 12-month prevalence of suicidal ideation was found to be 14.2% (95% CI: 11.6–17.3%). The result is demonstrated using the forest plot as shown in Figure 6. There was a significant high level of heterogeneity across the included studies (I2 = 99.82, p < 0.001). There was no evidence of publication bias (intercept = −5.18, 95% CI: −18.64–8.29, t = 0.79, df = 26, p = 0.44).
Study name Time Frame Statistics for each study Event rate and 95% CI
Event Lower Upper rate limit limit Z-Value p-Value
Baetens, et al. (2001) Lifetime 0.605 0.579 0.630 7.831 0.000Begum, et al. (2017) Lifetime 0.050 0.042 0.059 -31.938 0.000Brunner, et al. (2007) Lifetime 0.144 0.135 0.153 -47.495 0.000Carvalho, et al. (2017) Lifetime 0.220 0.201 0.239 -22.046 0.000Chan, et al. (2010a) Lifetime 0.291 0.282 0.300 -40.958 0.000Chan, et al. (2010b) Lifetime 0.269 0.258 0.281 -33.389 0.000Coughlan, et al. (2014) Lifetime 0.066 0.039 0.108 -9.580 0.000Gex, et al. (1998) Lifetime 0.172 0.164 0.180 -57.122 0.000Hesketh, et al. (2002) Lifetime 0.160 0.143 0.179 -24.138 0.000Kirmayer, et al. (1996) Lifetime 0.429 0.331 0.532 -1.358 0.174Kvernmo, et al. (2009) Lifetime 0.161 0.130 0.198 -12.826 0.000Larsson, et al. (2011) Lifetime 0.040 0.033 0.049 -30.934 0.000Le, et al. (2011) Lifetime 0.034 0.030 0.038 -52.826 0.000Lewinsohn, et al. (1996) Lifetime 0.129 0.114 0.145 -26.475 0.000Liu, et al. (2017) Lifetime 0.205 0.198 0.212 -59.532 0.000Madu, et al. (2003) Lifetime 0.370 0.326 0.417 -5.355 0.000Matsumoto, et al. (2008) Lifetime 0.398 0.375 0.421 -8.413 0.000Meehan, et al. (1992) Lifetime 0.539 0.502 0.576 2.048 0.041Mojs, et al. (2012) Lifetime 0.015 0.009 0.024 -16.606 0.000Morey, et al. (2008) Lifetime 0.056 0.049 0.064 -39.195 0.000Nada-Raja, et al. (2004) Lifetime 0.090 0.074 0.110 -20.579 0.000Nath, et al. (2012) Lifetime 0.116 0.102 0.131 -27.872 0.000Nock, et al. (2013) Lifetime 0.121 0.113 0.129 -52.075 0.000Pawlowska, et al. (2016) Lifetime 0.243 0.232 0.254 -36.800 0.000Perez-Amezcua, et al. (2010)Lifetime 0.466 0.457 0.475 -7.548 0.000Plener, et al. (2009) Lifetime 0.359 0.324 0.397 -7.152 0.000Sidhartha, et al. (2006) Lifetime 0.217 0.194 0.241 -18.383 0.000Soares, et al. (2015) Lifetime 0.118 0.094 0.148 -15.198 0.000Souza, et al. (2010) Lifetime 0.077 0.061 0.095 -20.439 0.000Straub, et al. (2015) Lifetime 0.317 0.290 0.345 -11.942 0.000Toprak, et al. (2010) Lifetime 0.126 0.102 0.154 -16.213 0.000Vawda, et al. (2013) Lifetime 0.225 0.175 0.285 -7.690 0.000Ventura-Junca, et al. (2010)Lifetime 0.620 0.596 0.644 9.429 0.000
0.180 0.142 0.227 -10.362 0.000-1.00 -0.50 0.00 0.50 1.00
Figure 5. Forest plot of the lifetime aggregate prevalence of suicidal ideation.
The aggregate 12-month prevalence of suicidal ideation was found to be 14.2% (95% CI: 11.6–17.3%).The result is demonstrated using the forest plot as shown in Figure 6. There was a significant highlevel of heterogeneity across the included studies (I2 = 99.82, p < 0.001). There was no evidence ofpublication bias (intercept = −5.18, 95% CI: −18.64–8.29, t = 0.79, df = 26, p = 0.44).
Int. J. Environ. Res. Public Health 2019, 16, 4581 12 of 26Int. J. Environ. Res. Public Health 2019, 16, x FOR PEER REVIEW 13 of 27
Figure 6. Forest plot of the aggregate 12-month prevalence of suicidal ideation.
3.5. Aggregate prevalence of Non-Suicidal Self Injury in Children and Adolescents
The aggregate lifetime prevalence of non-suicidal self-injury was 22.1% (95% CI: 16.9–28.4%). The result is demonstrated using the forest plot, as shown in Figure 7. There was a significantly high level of heterogeneity across the included studies (I2 = 99.22, p < 0.001). The aggregate 12-month prevalence was 19.5% (95% CI: 13.3–27.6%). There was a significantly high level of heterogeneity across the included studies (I2 = 99.63, p < 0.001). There was no evidence of publication bias (intercept = −4.84, 95% CI: −14.85–6.174, t = 1.0, df = 24, p = 0.33).
Study name Time Frame Statistics for each study Event rate and 95% CI
Event Lower Upper rate limit limit Z-Value p-Value
Abell, et al. (2012) Past 12 months 0.097 0.087 0.108 -36.145 0.000Altangerel, et al. (2014) Past 12 months 0.196 0.185 0.207 -40.379 0.000Asante, et al. (2017) Past 12 months 0.181 0.165 0.199 -25.862 0.000Borges, et al. (2011) Past 12 months 0.086 0.070 0.105 -20.997 0.000Cheung, et al. (2013) Past 12 months 0.143 0.130 0.158 -30.159 0.000Choquet, et al. (1990) Past 12 months 0.180 0.161 0.200 -22.719 0.000Ghrayeb, et al. (2014 Past 12 months 0.246 0.216 0.279 -12.951 0.000Han, et al. (2016) Past 12 months 0.069 0.068 0.071 -242.677 0.000Han, et al. (2018) Past 12 months 0.083 0.079 0.087 -86.411 0.000Hawton, et al. (2002) Past 12 months 0.149 0.140 0.158 -47.277 0.000Kang, et al. (2015) Past 12 months 0.191 0.188 0.194 -152.916 0.000Kataoka, et al. (2014) Past 12 months 0.051 0.047 0.056 -63.605 0.000Law, et al. (2013) Past 12 months 0.127 0.114 0.140 -32.606 0.000Lee, et al. (2013) Past 12 months 0.238 0.235 0.241 -135.395 0.000Lucassen, et al. (2011) Past 12 months 0.125 0.119 0.132 -61.400 0.000Mahfoud, et al. (2011) Past 12 months 0.157 0.148 0.168 -43.674 0.000Omigbodun, et al. (2008) Past 12 months 0.229 0.208 0.251 -19.293 0.000Ray Gex, et al. (1998) Past 12 months 0.172 0.164 0.180 -57.122 0.000Rudatsikira, et al. (2007) Past 12 months 0.184 0.163 0.207 -19.978 0.000Rudd, et al. (1989) Past 12 months 0.437 0.401 0.473 -3.417 0.001Sampasa-Kanyinga, et al. (2017)Past 12 months 0.105 0.092 0.120 -28.797 0.000Shaikh, et al. (2014) Past 12 months 0.033 0.028 0.038 -43.440 0.000Shek, et al. (2012) Past 12 months 0.134 0.123 0.146 -36.670 0.000Tang, et al. (2011) Past 12 months 0.088 0.077 0.102 -29.718 0.000Tang, et al. (2018) Past 12 months 0.159 0.154 0.165 -76.077 0.000Thakur, et al. (2015) Past 12 months 0.309 0.276 0.344 -9.863 0.000Xin, et al. (2017) Past 12 months 0.209 0.202 0.217 -58.928 0.000Zubrick, et al. (2016) Past 12 months 0.075 0.066 0.086 -34.083 0.000
0.142 0.116 0.173 -15.333 0.000-0.50 -0.25 0.00 0.25 0.50
Figure 6. Forest plot of the aggregate 12-month prevalence of suicidal ideation.
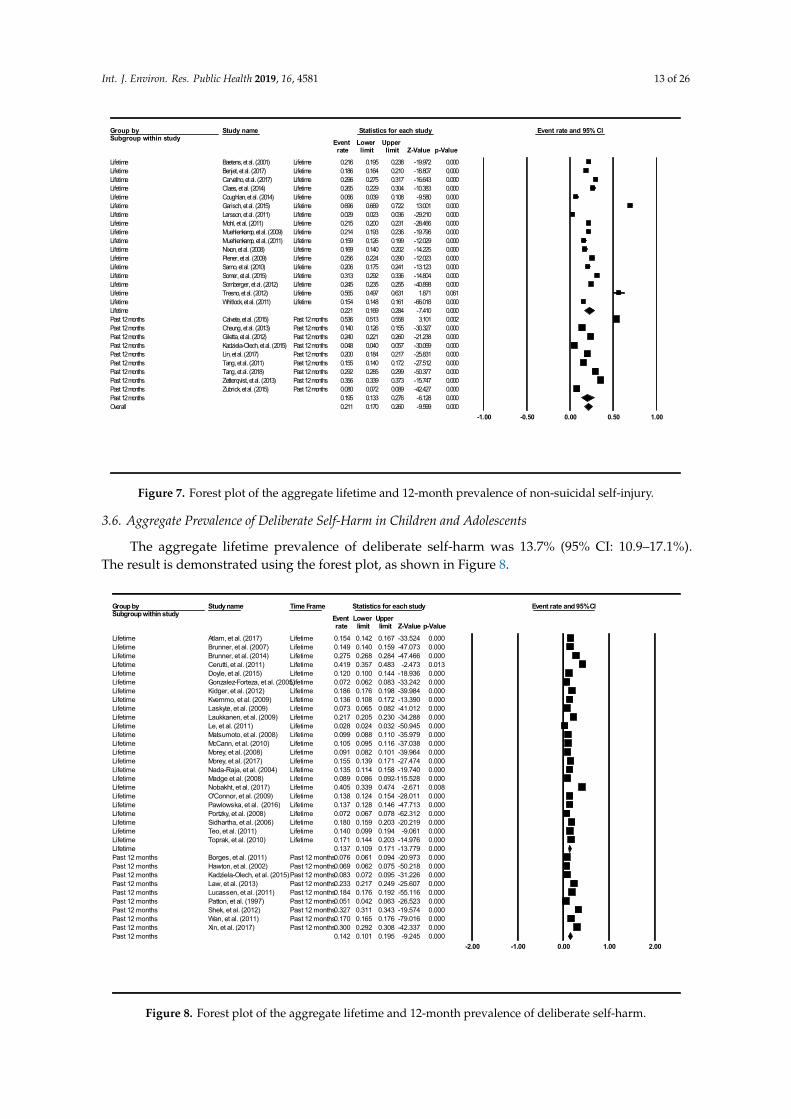
3.5. Aggregate prevalence of Non-Suicidal Self Injury in Children and Adolescents
The aggregate lifetime prevalence of non-suicidal self-injury was 22.1% (95% CI: 16.9–28.4%).The result is demonstrated using the forest plot, as shown in Figure 7. There was a significantly highlevel of heterogeneity across the included studies (I2 = 99.22, p < 0.001). The aggregate 12-monthprevalence was 19.5% (95% CI: 13.3–27.6%). There was a significantly high level of heterogeneity acrossthe included studies (I2 = 99.63, p < 0.001). There was no evidence of publication bias (intercept = −4.84,95% CI: −14.85–6.174, t = 1.0, df = 24, p = 0.33).
Int. J. Environ. Res. Public Health 2019, 16, 4581 13 of 26Int. J. Environ. Res. Public Health 2019, 16, x FOR PEER REVIEW 14 of 27
Figure 7. Forest plot of the aggregate lifetime and 12-month prevalence of non-suicidal self-injury.
3.6. Aggregate Prevalence of Deliberate Self-Harm in Children and Adolescents
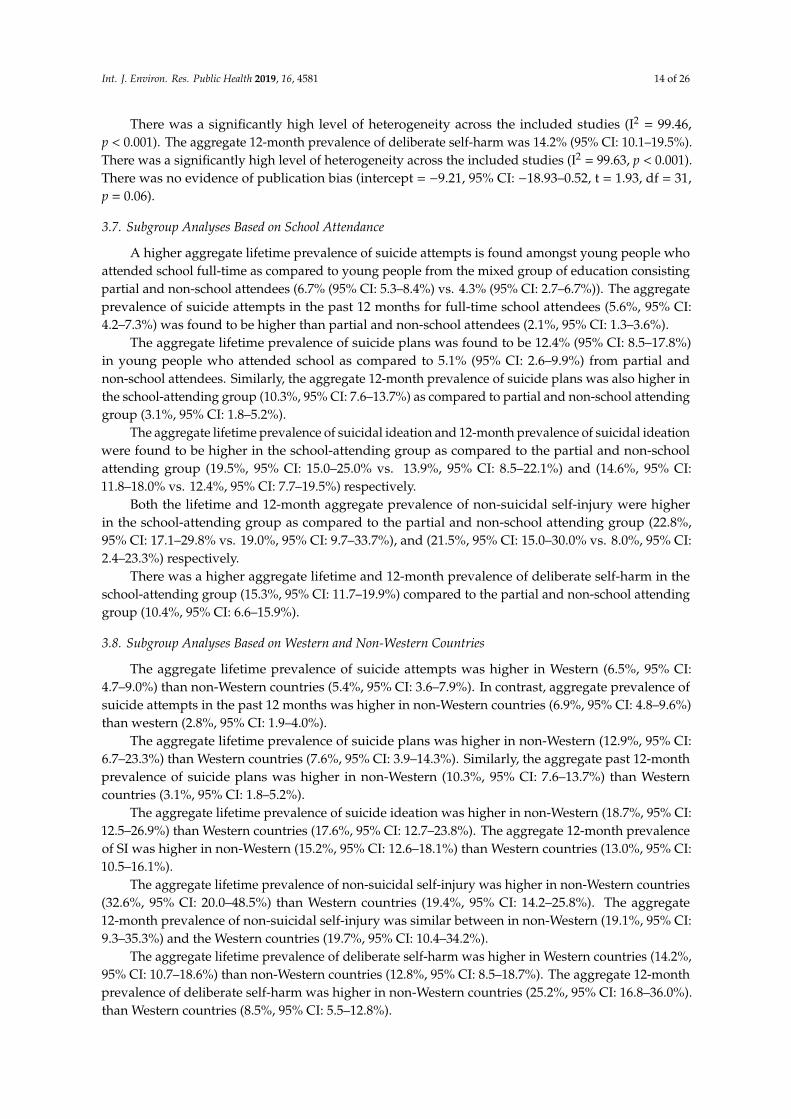
The aggregate lifetime prevalence of deliberate self-harm was 13.7% (95% CI: 10.9–17.1%). The result is demonstrated using the forest plot, as shown in Figure 8.
Figure 8. Forest plot of the aggregate lifetime and 12-month prevalence of deliberate self-harm.
Group bySubgroup within study
Study name Statistics for each study Event rate and 95% CIEvent Lower Upper rate limit limit Z-Value p-Value
Lifetime Baetens, et al. (2001) Lifetime 0.216 0.195 0.238 -19.972 0.000Lifetime Benjet, et al. (2017) Lifetime 0.186 0.164 0.210 -18.807 0.000Lifetime Carvalho, et al. (2017) Lifetime 0.296 0.275 0.317 -16.643 0.000Lifetime Claes, et al. (2014) Lifetime 0.265 0.229 0.304 -10.383 0.000Lifetime Coughlan, et al. (2014) Lifetime 0.066 0.039 0.108 -9.580 0.000Lifetime Garisch, et al. (2015) Lifetime 0.696 0.669 0.722 13.001 0.000Lifetime Larsson, et al. (2011) Lifetime 0.029 0.023 0.036 -29.210 0.000Lifetime Mohl, et al. (2011) Lifetime 0.215 0.200 0.231 -28.466 0.000Lifetime Muehlenkamp, et al. (2009) Lifetime 0.214 0.193 0.236 -19.796 0.000Lifetime Muehlenkamp, et al. (2011) Lifetime 0.159 0.126 0.199 -12.029 0.000Lifetime Nixon, et al. (2008) Lifetime 0.169 0.140 0.202 -14.225 0.000Lifetime Plener, et al. (2009) Lifetime 0.256 0.224 0.290 -12.023 0.000Lifetime Sarno, et al. (2010) Lifetime 0.206 0.175 0.241 -13.123 0.000Lifetime Somer, et al. (2015) Lifetime 0.313 0.292 0.336 -14.804 0.000Lifetime Sornberger, et al. (2012) Lifetime 0.245 0.235 0.255 -40.898 0.000Lifetime Tresno, et al. (2012) Lifetime 0.565 0.497 0.631 1.871 0.061Lifetime Whitlock, et al. (2011) Lifetime 0.154 0.148 0.161 -66.018 0.000Lifetime 0.221 0.169 0.284 -7.410 0.000Past 12 months Calvete, et al. (2015) Past 12 months 0.536 0.513 0.558 3.101 0.002Past 12 months Cheung, et al. (2013) Past 12 months 0.140 0.126 0.155 -30.327 0.000Past 12 months Giletta, et al. (2012) Past 12 months 0.240 0.221 0.260 -21.238 0.000Past 12 months Kadziela-Olech, et al. (2015) Past 12 months 0.048 0.040 0.057 -30.069 0.000Past 12 months Lin, et al. (2017) Past 12 months 0.200 0.184 0.217 -25.831 0.000Past 12 months Tang, et al. (2011) Past 12 months 0.155 0.140 0.172 -27.512 0.000Past 12 months Tang, et al. (2018) Past 12 months 0.292 0.285 0.299 -50.377 0.000Past 12 months Zetterqvist, et al. (2013) Past 12 months 0.356 0.339 0.373 -15.747 0.000Past 12 months Zubrick, et al. (2015) Past 12 months 0.080 0.072 0.089 -42.427 0.000Past 12 months 0.195 0.133 0.276 -6.128 0.000Overall 0.211 0.170 0.260 -9.599 0.000
-1.00 -0.50 0.00 0.50 1.00
Group bySubgroup within study
Study name Time Frame Statistics for each study Event rate and 95% CIEvent Lower Upper rate limit limit Z-Value p-Value
Lifetime Atlam, et al. (2017) Lifetime 0.154 0.142 0.167 -33.524 0.000Lifetime Brunner, et al. (2007) Lifetime 0.149 0.140 0.159 -47.073 0.000Lifetime Brunner, et al. (2014) Lifetime 0.275 0.268 0.284 -47.466 0.000Lifetime Cerutti, et al. (2011) Lifetime 0.419 0.357 0.483 -2.473 0.013Lifetime Doyle, et al. (2015) Lifetime 0.120 0.100 0.144 -18.936 0.000Lifetime Gonzalez-Forteza, et al. (2005)Lifetime 0.072 0.062 0.083 -33.242 0.000Lifetime Kidger, et al. (2012) Lifetime 0.186 0.176 0.198 -39.984 0.000Lifetime Kvernmo, et al. (2009) Lifetime 0.136 0.108 0.172 -13.390 0.000Lifetime Laskyte, et al. (2009) Lifetime 0.073 0.065 0.082 -41.012 0.000Lifetime Laukkanen, et al. (2009) Lifetime 0.217 0.205 0.230 -34.288 0.000Lifetime Le, et al. (2011) Lifetime 0.028 0.024 0.032 -50.945 0.000Lifetime Matsumoto, et al. (2008) Lifetime 0.099 0.088 0.110 -35.979 0.000Lifetime McCann, et al. (2010) Lifetime 0.105 0.095 0.116 -37.038 0.000Lifetime Morey, et al. (2008) Lifetime 0.091 0.082 0.101 -39.964 0.000Lifetime Morey, et al. (2017) Lifetime 0.155 0.139 0.171 -27.474 0.000Lifetime Nada-Raja, et al. (2004) Lifetime 0.135 0.114 0.158 -19.740 0.000Lifetime Madge et al. (2008) Lifetime 0.089 0.086 0.092-115.528 0.000Lifetime Nobakht, et al. (2017) Lifetime 0.405 0.339 0.474 -2.671 0.008Lifetime O'Connor, et al. (2009) Lifetime 0.138 0.124 0.154 -28.011 0.000Lifetime Pawlowska, et al. (2016) Lifetime 0.137 0.128 0.146 -47.713 0.000Lifetime Portzky, et al. (2008) Lifetime 0.072 0.067 0.078 -62.312 0.000Lifetime Sidhartha, et al. (2006) Lifetime 0.180 0.159 0.203 -20.219 0.000Lifetime Teo, et al. (2011) Lifetime 0.140 0.099 0.194 -9.061 0.000Lifetime Toprak, et al. (2010) Lifetime 0.171 0.144 0.203 -14.976 0.000Lifetime 0.137 0.109 0.171 -13.779 0.000Past 12 months Borges, et al. (2011) Past 12 months0.076 0.061 0.094 -20.973 0.000Past 12 months Hawton, et al. (2002) Past 12 months0.069 0.062 0.075 -50.218 0.000Past 12 months Kadziela-Olech, et al. (2015)Past 12 months0.083 0.072 0.095 -31.226 0.000Past 12 months Law, et al. (2013) Past 12 months0.233 0.217 0.249 -25.607 0.000Past 12 months Lucassen, et al. (2011) Past 12 months0.184 0.176 0.192 -55.116 0.000Past 12 months Patton, et al. (1997) Past 12 months0.051 0.042 0.063 -26.523 0.000Past 12 months Shek, et al. (2012) Past 12 months0.327 0.311 0.343 -19.574 0.000Past 12 months Wan, et al. (2011) Past 12 months0.170 0.165 0.176 -79.016 0.000Past 12 months Xin, et al. (2017) Past 12 months0.300 0.292 0.308 -42.337 0.000Past 12 months 0.142 0.101 0.195 -9.245 0.000
-2.00 -1.00 0.00 1.00 2.00
Figure 7. Forest plot of the aggregate lifetime and 12-month prevalence of non-suicidal self-injury.
3.6. Aggregate Prevalence of Deliberate Self-Harm in Children and Adolescents
The aggregate lifetime prevalence of deliberate self-harm was 13.7% (95% CI: 10.9–17.1%).The result is demonstrated using the forest plot, as shown in Figure 8.
Int. J. Environ. Res. Public Health 2019, 16, x FOR PEER REVIEW 14 of 27
Figure 7. Forest plot of the aggregate lifetime and 12-month prevalence of non-suicidal self-injury.
3.6. Aggregate Prevalence of Deliberate Self-Harm in Children and Adolescents
The aggregate lifetime prevalence of deliberate self-harm was 13.7% (95% CI: 10.9–17.1%). The result is demonstrated using the forest plot, as shown in Figure 8.
Figure 8. Forest plot of the aggregate lifetime and 12-month prevalence of deliberate self-harm.
Group bySubgroup within study
Study name Statistics for each study Event rate and 95% CIEvent Lower Upper rate limit limit Z-Value p-Value
Lifetime Baetens, et al. (2001) Lifetime 0.216 0.195 0.238 -19.972 0.000Lifetime Benjet, et al. (2017) Lifetime 0.186 0.164 0.210 -18.807 0.000Lifetime Carvalho, et al. (2017) Lifetime 0.296 0.275 0.317 -16.643 0.000Lifetime Claes, et al. (2014) Lifetime 0.265 0.229 0.304 -10.383 0.000Lifetime Coughlan, et al. (2014) Lifetime 0.066 0.039 0.108 -9.580 0.000Lifetime Garisch, et al. (2015) Lifetime 0.696 0.669 0.722 13.001 0.000Lifetime Larsson, et al. (2011) Lifetime 0.029 0.023 0.036 -29.210 0.000Lifetime Mohl, et al. (2011) Lifetime 0.215 0.200 0.231 -28.466 0.000Lifetime Muehlenkamp, et al. (2009) Lifetime 0.214 0.193 0.236 -19.796 0.000Lifetime Muehlenkamp, et al. (2011) Lifetime 0.159 0.126 0.199 -12.029 0.000Lifetime Nixon, et al. (2008) Lifetime 0.169 0.140 0.202 -14.225 0.000Lifetime Plener, et al. (2009) Lifetime 0.256 0.224 0.290 -12.023 0.000Lifetime Sarno, et al. (2010) Lifetime 0.206 0.175 0.241 -13.123 0.000Lifetime Somer, et al. (2015) Lifetime 0.313 0.292 0.336 -14.804 0.000Lifetime Sornberger, et al. (2012) Lifetime 0.245 0.235 0.255 -40.898 0.000Lifetime Tresno, et al. (2012) Lifetime 0.565 0.497 0.631 1.871 0.061Lifetime Whitlock, et al. (2011) Lifetime 0.154 0.148 0.161 -66.018 0.000Lifetime 0.221 0.169 0.284 -7.410 0.000Past 12 months Calvete, et al. (2015) Past 12 months 0.536 0.513 0.558 3.101 0.002Past 12 months Cheung, et al. (2013) Past 12 months 0.140 0.126 0.155 -30.327 0.000Past 12 months Giletta, et al. (2012) Past 12 months 0.240 0.221 0.260 -21.238 0.000Past 12 months Kadziela-Olech, et al. (2015) Past 12 months 0.048 0.040 0.057 -30.069 0.000Past 12 months Lin, et al. (2017) Past 12 months 0.200 0.184 0.217 -25.831 0.000Past 12 months Tang, et al. (2011) Past 12 months 0.155 0.140 0.172 -27.512 0.000Past 12 months Tang, et al. (2018) Past 12 months 0.292 0.285 0.299 -50.377 0.000Past 12 months Zetterqvist, et al. (2013) Past 12 months 0.356 0.339 0.373 -15.747 0.000Past 12 months Zubrick, et al. (2015) Past 12 months 0.080 0.072 0.089 -42.427 0.000Past 12 months 0.195 0.133 0.276 -6.128 0.000Overall 0.211 0.170 0.260 -9.599 0.000
-1.00 -0.50 0.00 0.50 1.00
Group bySubgroup within study
Study name Time Frame Statistics for each study Event rate and 95% CIEvent Lower Upper rate limit limit Z-Value p-Value
Lifetime Atlam, et al. (2017) Lifetime 0.154 0.142 0.167 -33.524 0.000Lifetime Brunner, et al. (2007) Lifetime 0.149 0.140 0.159 -47.073 0.000Lifetime Brunner, et al. (2014) Lifetime 0.275 0.268 0.284 -47.466 0.000Lifetime Cerutti, et al. (2011) Lifetime 0.419 0.357 0.483 -2.473 0.013Lifetime Doyle, et al. (2015) Lifetime 0.120 0.100 0.144 -18.936 0.000Lifetime Gonzalez-Forteza, et al. (2005)Lifetime 0.072 0.062 0.083 -33.242 0.000Lifetime Kidger, et al. (2012) Lifetime 0.186 0.176 0.198 -39.984 0.000Lifetime Kvernmo, et al. (2009) Lifetime 0.136 0.108 0.172 -13.390 0.000Lifetime Laskyte, et al. (2009) Lifetime 0.073 0.065 0.082 -41.012 0.000Lifetime Laukkanen, et al. (2009) Lifetime 0.217 0.205 0.230 -34.288 0.000Lifetime Le, et al. (2011) Lifetime 0.028 0.024 0.032 -50.945 0.000Lifetime Matsumoto, et al. (2008) Lifetime 0.099 0.088 0.110 -35.979 0.000Lifetime McCann, et al. (2010) Lifetime 0.105 0.095 0.116 -37.038 0.000Lifetime Morey, et al. (2008) Lifetime 0.091 0.082 0.101 -39.964 0.000Lifetime Morey, et al. (2017) Lifetime 0.155 0.139 0.171 -27.474 0.000Lifetime Nada-Raja, et al. (2004) Lifetime 0.135 0.114 0.158 -19.740 0.000Lifetime Madge et al. (2008) Lifetime 0.089 0.086 0.092-115.528 0.000Lifetime Nobakht, et al. (2017) Lifetime 0.405 0.339 0.474 -2.671 0.008Lifetime O'Connor, et al. (2009) Lifetime 0.138 0.124 0.154 -28.011 0.000Lifetime Pawlowska, et al. (2016) Lifetime 0.137 0.128 0.146 -47.713 0.000Lifetime Portzky, et al. (2008) Lifetime 0.072 0.067 0.078 -62.312 0.000Lifetime Sidhartha, et al. (2006) Lifetime 0.180 0.159 0.203 -20.219 0.000Lifetime Teo, et al. (2011) Lifetime 0.140 0.099 0.194 -9.061 0.000Lifetime Toprak, et al. (2010) Lifetime 0.171 0.144 0.203 -14.976 0.000Lifetime 0.137 0.109 0.171 -13.779 0.000Past 12 months Borges, et al. (2011) Past 12 months0.076 0.061 0.094 -20.973 0.000Past 12 months Hawton, et al. (2002) Past 12 months0.069 0.062 0.075 -50.218 0.000Past 12 months Kadziela-Olech, et al. (2015)Past 12 months0.083 0.072 0.095 -31.226 0.000Past 12 months Law, et al. (2013) Past 12 months0.233 0.217 0.249 -25.607 0.000Past 12 months Lucassen, et al. (2011) Past 12 months0.184 0.176 0.192 -55.116 0.000Past 12 months Patton, et al. (1997) Past 12 months0.051 0.042 0.063 -26.523 0.000Past 12 months Shek, et al. (2012) Past 12 months0.327 0.311 0.343 -19.574 0.000Past 12 months Wan, et al. (2011) Past 12 months0.170 0.165 0.176 -79.016 0.000Past 12 months Xin, et al. (2017) Past 12 months0.300 0.292 0.308 -42.337 0.000Past 12 months 0.142 0.101 0.195 -9.245 0.000
-2.00 -1.00 0.00 1.00 2.00
Figure 8. Forest plot of the aggregate lifetime and 12-month prevalence of deliberate self-harm.
Int. J. Environ. Res. Public Health 2019, 16, 4581 14 of 26
There was a significantly high level of heterogeneity across the included studies (I2 = 99.46,p < 0.001). The aggregate 12-month prevalence of deliberate self-harm was 14.2% (95% CI: 10.1–19.5%).There was a significantly high level of heterogeneity across the included studies (I2 = 99.63, p < 0.001).There was no evidence of publication bias (intercept = −9.21, 95% CI: −18.93–0.52, t = 1.93, df = 31,p = 0.06).
3.7. Subgroup Analyses Based on School Attendance
A higher aggregate lifetime prevalence of suicide attempts is found amongst young people whoattended school full-time as compared to young people from the mixed group of education consistingpartial and non-school attendees (6.7% (95% CI: 5.3–8.4%) vs. 4.3% (95% CI: 2.7–6.7%)). The aggregateprevalence of suicide attempts in the past 12 months for full-time school attendees (5.6%, 95% CI:4.2–7.3%) was found to be higher than partial and non-school attendees (2.1%, 95% CI: 1.3–3.6%).
The aggregate lifetime prevalence of suicide plans was found to be 12.4% (95% CI: 8.5–17.8%)in young people who attended school as compared to 5.1% (95% CI: 2.6–9.9%) from partial andnon-school attendees. Similarly, the aggregate 12-month prevalence of suicide plans was also higher inthe school-attending group (10.3%, 95% CI: 7.6–13.7%) as compared to partial and non-school attendinggroup (3.1%, 95% CI: 1.8–5.2%).
The aggregate lifetime prevalence of suicidal ideation and 12-month prevalence of suicidal ideationwere found to be higher in the school-attending group as compared to the partial and non-schoolattending group (19.5%, 95% CI: 15.0–25.0% vs. 13.9%, 95% CI: 8.5–22.1%) and (14.6%, 95% CI:11.8–18.0% vs. 12.4%, 95% CI: 7.7–19.5%) respectively.
Both the lifetime and 12-month aggregate prevalence of non-suicidal self-injury were higherin the school-attending group as compared to the partial and non-school attending group (22.8%,95% CI: 17.1–29.8% vs. 19.0%, 95% CI: 9.7–33.7%), and (21.5%, 95% CI: 15.0–30.0% vs. 8.0%, 95% CI:2.4–23.3%) respectively.
There was a higher aggregate lifetime and 12-month prevalence of deliberate self-harm in theschool-attending group (15.3%, 95% CI: 11.7–19.9%) compared to the partial and non-school attendinggroup (10.4%, 95% CI: 6.6–15.9%).
3.8. Subgroup Analyses Based on Western and Non-Western Countries
The aggregate lifetime prevalence of suicide attempts was higher in Western (6.5%, 95% CI:4.7–9.0%) than non-Western countries (5.4%, 95% CI: 3.6–7.9%). In contrast, aggregate prevalence ofsuicide attempts in the past 12 months was higher in non-Western countries (6.9%, 95% CI: 4.8–9.6%)than western (2.8%, 95% CI: 1.9–4.0%).
The aggregate lifetime prevalence of suicide plans was higher in non-Western (12.9%, 95% CI:6.7–23.3%) than Western countries (7.6%, 95% CI: 3.9–14.3%). Similarly, the aggregate past 12-monthprevalence of suicide plans was higher in non-Western (10.3%, 95% CI: 7.6–13.7%) than Westerncountries (3.1%, 95% CI: 1.8–5.2%).
The aggregate lifetime prevalence of suicide ideation was higher in non-Western (18.7%, 95% CI:12.5–26.9%) than Western countries (17.6%, 95% CI: 12.7–23.8%). The aggregate 12-month prevalenceof SI was higher in non-Western (15.2%, 95% CI: 12.6–18.1%) than Western countries (13.0%, 95% CI:10.5–16.1%).
The aggregate lifetime prevalence of non-suicidal self-injury was higher in non-Western countries(32.6%, 95% CI: 20.0–48.5%) than Western countries (19.4%, 95% CI: 14.2–25.8%). The aggregate12-month prevalence of non-suicidal self-injury was similar between in non-Western (19.1%, 95% CI:9.3–35.3%) and the Western countries (19.7%, 95% CI: 10.4–34.2%).
The aggregate lifetime prevalence of deliberate self-harm was higher in Western countries (14.2%,95% CI: 10.7–18.6%) than non-Western countries (12.8%, 95% CI: 8.5–18.7%). The aggregate 12-monthprevalence of deliberate self-harm was higher in non-Western countries (25.2%, 95% CI: 16.8–36.0%).than Western countries (8.5%, 95% CI: 5.5–12.8%).
Int. J. Environ. Res. Public Health 2019, 16, 4581 15 of 26
3.9. Subgroup Analyses Based on Developing and Developed Countries
The lifetime prevalence of suicide attempts in developed (6.1% 95% CI: 4.3–8.5%) and low andmiddle-income countries (6.0% 95% CI: 4.1–7.7%) were similar. However, the past 12-month prevalenceof suicide attempts was higher in low and middle-income countries (6.9% 95% CI: 4.8–9.6%) thandeveloped countries (2.8% 95% CI: 1.9–4.0%).
The lifetime prevalence of suicide plans was higher in developing (12.9% 95% CI: 6.7–23.3%) thandeveloped countries (7.6% 95% CI: 3.9–14.3%). Similarly, the 12-month prevalence of suicide plans washigher in low and middle-income countries (10.3% 95% CI: 7.6–13.7%) than developed countries (3.1%95% CI: 1.8–5.2%).
The lifetime prevalence of suicide ideation was higher in developing (17.7% 95% CI: 11.1–27.0%)than developed countries (17.3% 95% CI: 12.0–24.4%). The 12-month prevalence of suicide ideationwas higher in low and middle-income countries (15.9% 95% CI: 13.5–18.6%) than developed countries(11.9% 95% CI: 9.6–14.7%).
The lifetime prevalence of non-suicidal self-injury was significantly higher in low- andmiddle-income countries (33.7% 95% CI: 19.0–52.5%) as compared to developed countries (20.0%95% CI: 14.9–26.4%). However, the 12-month prevalence of non-suicidal self-injury was found tobe similar between developed countries (19.7% 95% CI: 10.4–34.2%) and low- and middle-incomecountries (19.1% 95% CI: 9.3–35.3%).
The lifetime prevalence of deliberate self-harm was similar between low- and middle-incomecountries (13.9% 95% CI: 10.6–18.1%) and developed countries (13.2% 95% CI: 8.5–19.9%). The past12-month prevalence of deliberate self-harm was found to be higher in low- and middle-incomecountries (25.2% 95% CI: 16.8–36.0%) than developed countries (8.5 % 95% CI: 5.5–12.8%).
3.10. Subgroup Analyses Based on Continents
The lifetime prevalence of suicide attempts was found to be highest in South America (19.0%95% CI: 17.1–21.0%). The lifetime prevalence of suicide attempts in Africa was 11.2% (95% CI:2.7%–36.1%). The lifetime prevalence of suicide attempts in Australia was 9.2% (95% CI: 7.5%–11.2%).The lifetime prevalence of suicide attempts in North America was 8.6% (95% CI: 5.4–13.6%). The lifetimeprevalence of suicide attempts was lowest in Asia 4.6% (95% CI: 2.7–7.6%) and Europe 4.6% (95% CI:3.2–6.6%).
The past 12-month prevalence of suicide attempts was found to be highest in Africa at (16.3%95% CI: 8.4–29%). The past 12-month prevalence of suicide attempts in Asia was 5.8% (95% CI:4.9–6.7%). The past 12-month prevalence of suicide attempts in Europe was 3% (95% CI: 2.7–3.4%).The past 12-month prevalence of suicide attempts in North America was 3% (95% CI: 1.1–8%). The past12-month prevalence of suicide attempts was lowest in Australia (2.4%, 95% CI: 1.4–4.4%).
For the lifetime and 12-month prevalence for suicide plans, Asia had the highest prevalence(10.4% 95% CI: 7.7–13.9%). The lifetime and 12-month prevalence of suicide plans in Africa was 13.9%(95% CI: 8.1–22.8%). The lifetime and 12-month prevalence of suicide plans in Europe was 10% (95% CI:4.3%–21.6%). The lifetime and 12-month prevalence of suicide plans in Australia was 5.2% (95% CI:4.4–6.1%). The lifetime and 12-month prevalence of suicide plans were lowest in North America (3.7%,95% CI: 2.3–5.9%).
The lifetime prevalence of suicide ideation was found to be highest in Africa (37.0%, 95% CI:32.6–41.7%). The lifetime prevalence of suicide ideation in North America was 30.2% (95% CI:13.4–54.8%). The lifetime prevalence of suicide ideation in South America was 28.5% (95% CI:8.8–62.3%). The lifetime prevalence of suicide ideation in Asia was 14.2% (95% CI: 8.5–22.7%).The lifetime prevalence of suicide ideation was lowest in Europe (13.7% 95% CI: 9–20.2%).
The past 12-month prevalence of suicide ideation was found to be highest in Africa months (20.6%,95% CI: 13.7–29.7%). The past 12-month prevalence of suicide ideation in South America was 18.4%(95% CI: 16.3–20.7%). The past 12-month prevalence of suicide ideation in Europe was 16.3% (95% CI:
Int. J. Environ. Res. Public Health 2019, 16, 4581 16 of 26
15.3–17.5%). The past 12-month prevalence of suicide ideation in North America was 12.8% (95% CI:6.4–24.1%). The lifetime prevalence of suicide ideation was lowest in Asia (13.3%, 95% CI: 10.9–16.3%).
The lifetime and past 12-month prevalence of non-suicidal self-injury were found to be highestin Australia (30.9%, 95% CI: 1.8–91.7%). The lifetime and past 12-month prevalence of non-suicidalself-injury in Asia was 25.7% (95% CI: 18.9–33.8%). The lifetime and past 12-month prevalence ofnon-suicidal self-injury in North America was 18.7% (95% CI: 14.3–24%). The lifetime and past12-month prevalence of non-suicidal self-injury were lowest in Europe (18.4%, 95% CI: 12.1–27.2%).
The lifetime and past 12-month prevalence of deliberate self-harm was found to be highest inAsia (17.4%, 95% CI: 12.5–23.7%). The lifetime and past 12-month prevalence of deliberate self-harmin Europe was 12.9% (95% CI: 10.3–16.0%). The lifetime and past 12-month prevalence of deliberateself-harm in Australia was 11.1% (95% CI: 5.4–21.3%). The lifetime and past 12-month prevalence ofdeliberate self-harm was lowest in North America (7.3%, 95% CI: 6.5–8.2%).
3.11. Meta-Regression Analyses
For suicide attempts, mean age (B = 0.0812, z = 2.12, p = 0.034) was identified as significantmoderator that contributed to heterogeneity between studies. For suicidal plan, mean age (B = 0.20,z = 5.63, p < 0.001) was identified as significant moderator that contributed to heterogeneity betweenstudies. For SI, mean age (B = −0.0087, z = −0.28, p = 0.78) was a non-significant moderator.For non-suicidal self-injury, mean age (B = 0.11, z = 1.77, p = 0.08). was a non-significant moderator.Fordeliberate self-harm, mean age (B = 0.01, z = 0.33, p = 0.74) was a non-significant moderator.
For suicide attempts, the proportion of females (B = 1.86, z = 1.05, p = 0.29) was a non-significantmoderator. For suicidal plan, the proportion of females (B = −0.36, z = −0.14, p = 0.89) was anon-significant moderator. For suicidal ideation, the proportion of females (B = 0.77, z = 0.63 p = 0.53)was a non-significant moderator. For non-suicidal self-injury, the proportion of females (B = −0.29,z = −0.25, p = 0.81) was a non-significant moderator. For deliberate self-harm, the proportion of females(B = −1.79, z = −0.85, p = 0.4) was a non-significant moderator.
4. Discussion
To the best of our knowledge, this is the first meta-analysis that analyzed suicidal and self-harmphenomena based on 686,672 young people worldwide. The key findings are summarized as follows.non-suicidal self-injury was most frequent with aggregate lifetime and 12-month prevalence of 22.1%and 19.5% respectively. Suicidal ideation was second most frequent with aggregate lifetime and12-month prevalence of 18% and 14.2% respectively. Deliberate self-harm was third most frequent withaggregate lifetime and 12-montnh prevalence of 13.7% and 14.2% respectively. Suicidal plan rankedfourth with aggregate lifetime and 12-month prevalence 9.9% and 7.5% respectively. Suicide attemptwas least frequent with aggregate lifetime and 12-month prevalence of 6.0% and 4.5% respectively.
This meta-analysis found that the aggregate lifetime prevalence of suicide attempts was higher inWestern (6.5%, 95% CI: 4.7–9.0%) than non-Western countries. There are several reasons to explainhigher prevalence of suicide attempts among young people in western countries. First, substanceabuse appeared to have affected suicide rates of young males in Western countries [129]. Second,high suicide rates among young indigenous people in Western countries have been attributed tointernalised anger and despair related to social disruption and disempowerment [130]. Third, youngpeople in Western countries could have more access to suicide means, including firearms. In contrast,the aggregate lifetime prevalence of suicide plans, suicide ideation and non-suicidal self-injury werehigher in non-Western countries than Western countries. This finding suggests that young peoplein non-Western countries could have thought about suicide but did not attempt suicide. Attemptedsuicide is illegal in some of the non-Western countries including Bangladesh, Hungary, India andJapan, though in Japan it is not punishable [129]. The legal implication could deter suicide attempts insome of the non-Western countries.
Int. J. Environ. Res. Public Health 2019, 16, 4581 17 of 26
This meta-analysis found that non-suicidal self-injury had the highest aggregate lifetime and12-month prevalence worldwide. Non-suicidal self-injury is defined as the intentional destruction ofone’s own body tissue without suicidal intent [27]. Examples of non-suicidal self-injury, includingself-laceration, skin scratching, burning and hitting. Klonsky et al. proposed functional theories thatexplain the reasons for non-suicidal self-injury in young people [131]. The reasons include alleviationof negative emotion, self-punishment, self-directed anger, and expression of distress. Klonsky etal. highlighted the misconception that non-suicidal self-injury is always a symptom of borderlinepersonality disorder [132]. For young people with engaging non-suicidal self-injury, a psychologicalintervention which aims at building positive emotion, reducing self-directed anger and promotingmore adaptive way to express distress may reduce the prevalence of non-suicidal self-injury.
A recent study found that the 12-month prevalence rates of youth self-harm in low and middle-income countries were comparable to high-income countries. This meta-analysis with a larger samplesize showed that children and adolescents from low- and middle-income countries with lower incomehad a higher aggregate 12-month prevalence of deliberate self-harm than children and adolescentsfrom developed countries with higher income. Previous research reported that non-suicidal self-injuryappeared to be more common among Caucasians than non-Caucasians [133]. Our meta-analysis foundthat the 12-month prevalence of non-suicidal self-injury was highest in Australia which has 74.3% ofthe population who are Caucasians [134].
The subgroup analysis yielded several interesting findings. The aggregate lifetime and 12-monthprevalence of suicidal and self-harm behavior were higher in full-time school attendees as comparedwith partial and non-attendees. School attendees are more likely to be exposed to risk factors, includingacademic stress and school bullying. Academic stress leads to anger, anxiety, helplessness, shame, andboredom [135]. A previous study found that skin picking, which causes skin damage was positivelycorrelated with academic stress and trait anxiety was a predisposing factor [136]. The other riskfactors faced by school attendees are peer victimization, which reflects the experience of overt (e.g.,hitting, pushing), reputational (e.g., spreading rumors), or relational aggression from peers (e.g., beingexcluded, gossiped about) [137,138]. Vergara et al. (2019) found that peer victimization was associatedwith the frequency of past month non-suicidal self-injury thoughts and past month non-suicidalself-injury behaviors [139]. The aggregate lifetime and 12-month prevalence of suicidal and self-harmbehavior were higher in developing and non-western countries.
We found that the lifetime prevalence of suicide ideation, the 12-month prevalence of suicideattempts and suicide ideation were highest in Africa. This could be due to the fact that large numbers ofAfrican children and adolescents were exposed to adverse childhood experiences [140]. Young people indeveloping and non-western countries are more likely to be exposed to adverse childhood experiencesincluding alcohol abuse [141], lack of access to care for mental health problems, orphanage, andearly parental death [142], human immunodeficiency virus (HIV) infection [142] and violence againstchildren and adolescents [143]. Interventions to reduce African children and adolescent suicidalityinclude those improving family functioning, reducing poverty, mitigating the impacts of HIV andthe provision of effective mental health services for adversity-exposed children and adolescent [140].As the infrastructure for mental health service is still developing, the main challenge is to reach out tochildren and adolescents in low and middle-income countries and educate them to handle suicidaland self-harm behaviors. Electronic health (E-health) was found to provide a cost-effective solutionin mental health [144]. As the use of smartphones becomes increasingly prevalent and affordable,more children and adolescents in low and middle-income countries can own a smartphone device anddownload health-related applications [17]. Proof of concept feasibility studies and randomized trialsshould be conducted in low and middle-income countries to determine that smartphone applicationsare efficacious to reduce suicidal and self-harm behavior in children and adolescents before their actualimplementation [145].
The lifetime and 12-month prevalence of suicide plans and DSH were found to be highest inAsia. Asian children and adolescents face more academic-related stress due to the competitiveness
Int. J. Environ. Res. Public Health 2019, 16, 4581 18 of 26
in the education system, and getting poor grades in the examination have been found to bear twomajor significant sources of anxiety and depression amongst Asian children and adolescents [146].Willingness to seek help was found to be a protective factor against suicidal and self-harm behavior forAsian children and adolescents [15]. Nevertheless, help-seeking from peers may not be beneficial [147].Children and adolescents may not receive the help that they require, as peers often might be poorlyequipped to provide appropriate advice.
Meta-regression found that age was a critical moderator that explains for heterogeneity fora lifetime and 12-month prevalence of suicide attempts and suicide plans. Children and youngadolescents were less exposed to suicide risk factors as compared with older adolescents [148]. Olderadolescents are predisposed to specific risk factors associated with suicidal behaviors, includingbaseline interpersonal problems in one’s social circle [149], psychiatric disorders [148], and STD-relatedrisk [150]. Meta-regression also found that gender was not a vital moderator that explains forheterogeneity of the prevalence of suicidal and self-harm behavior. This finding may challenge thegender paradox, which suggests significant epidemiological differences in suicidal and self-harmbehaviors between adolescent females and males [151]. A previous study found that there wereno gender differences in family problems and school problems which are well-known risk factorsassociated with suicidal and self-harm behavior in young people [152].
The strengths of this meta-analysis include an extensive search in identifying a large number ofarticles on suicidal and self-harm behaviour in 686,672 children and adolescents, adherence to theguidelines, the inclusion of meta-regression and subgroup analysis as well as lack of publication bias [28].Nevertheless, this meta-analysis has several limitations. First, this meta-analysis classified suicidal andself-harm phenomena into five sub-categories and not able to study their inter-relationship. Klonsky etal. proposed that non-suicidal self-injury may be an essential risk factor for suicidal behaviour [132].Future study is required to study the inter-relationship between suicidal behaviour, deliberate self-harm,and non-suicidal self-injury in young people. Second, we could not classify dliberate self-harm assuicidal and non-suicidal deliberate self-harm. Future research is required to understand the differencesbetween young people who attempt suicidal and non-suicidal deliberate self-harm.
5. Conclusions
In conclusion, this meta-analysis found that the three most common suicidal and self-harmbehaviors were non-suicidal self-injury (aggregate lifetime and 12-month prevalence of 22.1% and19.5% respectively), suicidal ideation (aggregate lifetime and 12-month prevalence of 18% and 14.2%respectively) and deliberate self-harm (aggregate lifetime and 12-month prevalence of 13.7% and14.2% respectively). The aggregate lifetime prevalence of suicide attempts was higher in Western thannon-Western countries, in contrast, the aggregate lifetime prevalence of suicide plans, suicide ideationand non-suicidal self-injury were higher in non-Western countries than Western countries. Suicidaland self-harm behavior was higher in children and adolescents who were full-time school attendeesand those who live in developing countries. Meta-regression analyses showed that the mean age ofparticipants was a significant moderator that contributed to heterogeneity for a lifetime and 12-monthprevalence of suicide attempts and suicidal plans. Psychological interventions targeting self-harmand suicidal behavior, social interventions targeting adversities in low- and middle-income countries,and electronic—health interventions to reach out to children and adolescents may reduce the globalprevalence of suicidal and self-harm behavior in children and adolescents.
Author Contributions: K.-S.L., C.H.W., C.S.H., and R.C.H. contributed to the concept and design of this study.K.-S.L., R.C.H., and C.S.H. contributed to the data acquisition, analysis, and interpretation. K.-S.L., C.H.W., J.W.,W.T., Z.Z. and R.C.H. drafted the manuscript. B.X.T. and R.S.M. critically revised the manuscript for importantintellectual content. All authors approved the final version of publication.
Funding: J.W. and Z.Z. declared the receipt of the following financial support for the research, authorship and/orpublication of this article. This study was supported in part by National Science Education Planning Project,China (BIA180193).
Int. J. Environ. Res. Public Health 2019, 16, 4581 19 of 26
Acknowledgments: We are grateful to all authors of the full-text articles.
Conflicts of Interest: The author(s) declared no potential conflicts of interest with respect to the research,authorship, and/or publication of this article.
References
1. World Health Organization. Suicide Rates 2017. Available online: http://www.who.int/gho/mental_health/
suicide_rates/en/ (accessed on 26 April 2019).2. Aggarwal, S.; Patton, G.; Reavley, N.; Sreenivasan, S.A.; Berk, M. Youth self-harm in low-and middle-income
countries: Systematic review of the risk and protective factors. Int. J. Soc. Psychiatry 2017, 63, 359–375.[CrossRef]
3. Ho, C.S.; Ong, Y.L.; Tan, G.H.; Yeo, S.N.; Ho, R.C. Profile differences between overdose and non-overdosesuicide attempts in a multi-ethnic Asian society. BMC Psychiatry 2016, 16, 379. [CrossRef]
4. Whitlock, J.; Muehlenkamp, J.; Eckenrode, J.; Purington, A.; Baral Abrams, G.; Barreira, P.; Kress, V.Nonsuicidal self-injury as a gateway to suicide in young adults. J. Adolesc. Health Off. Publ. Soc. Adolesc. Med.2013, 52, 486–492. [CrossRef]
5. Madge, N.; Hewitt, A.; Hawton, K.; de Wilde, E.J.; Corcoran, P.; Fekete, S.; van Heeringen, K.; De Leo, D.;Ystgaard, M. Deliberate self-harm within an international community sample of young people: Comparativefindings from the Child & Adolescent Self-harm in Europe (CASE) Study. J. Child Psychol. PsychiatryAllied Discip. 2008, 49, 667–677. [CrossRef]
6. Choo, C.; Diederich, J.; Song, I.; Ho, R. Cluster analysis reveals risk factors for repeated suicide attempts in amulti-ethnic Asian population. Asian J. Psychiatry 2014, 8, 38–42. [CrossRef] [PubMed]
7. Wilkinson, P.; Kelvin, R.; Roberts, C.; Dubicka, B.; Goodyer, I. Clinical and psychosocial predictors of suicideattempts and nonsuicidal self-injury in the Adolescent Depression Antidepressants and Psychotherapy Trial(ADAPT). Am. J. Psychiatry 2011, 168, 495–501. [CrossRef] [PubMed]
8. Mak, K.K.; Ho, C.S.; Chua, V.; Ho, R.C. Ethnic differences in suicide behavior in Singapore. Transcult. Psychiatry2015, 52, 3–17. [CrossRef]
9. Choo, C.C.; Ho, R.C.; Burton, A.A.D. Thematic Analysis of Medical Notes Offers Preliminary Insight intoPrecipitants for Asian Suicide Attempters: An Exploratory Study. Int. J. Environ. Res. Public Health 2018, 15,809. [CrossRef]
10. Skinner, R.; McFaull, S. Suicide among children and adolescents in Canada: Trends and sex differences,1980-2008. CMAJ 2012, 184, 1029–1034. [CrossRef]
11. Beautrais, A.L.; Joyce, P.R.; Mulder, R.T. Youth suicide attempts: A social and demographic profile. Aust. N.Z. J. Psychiatry 1998, 32, 349–357. [CrossRef]
12. Choo, C.C.; Chew, P.K.H.; Ho, R.C. Suicide Precipitants Differ Across the Lifespan but Are Not Significant inPredicting Medically Severe Attempts. Int. J. Environ. Res. Public Health 2018, 15, 691. [CrossRef] [PubMed]
13. Law, B.M.; Shek, D.T. Self-harm and suicide attempts among young Chinese adolescents in Hong Kong:Prevalence, correlates, and changes. J. Pediatric Adolesc. Gynecol. 2013, 26, S26–S32. [CrossRef] [PubMed]
14. Lewinsohn, P.M.; Rohde, P.; Seeley, J.R.; Baldwin, C.L. Gender differences in suicide attempts from adolescenceto young adulthood. J. Am. Acad. Child Adolesc. Psychiatry 2001, 40, 427–434. [CrossRef] [PubMed]
15. Choo, C.C.; Harris, K.M.; Ho, R.C. Prediction of Lethality in Suicide Attempts: Gender Matters. OMEGA2017. [CrossRef] [PubMed]
16. Walsh, E.; Eggert, L.L. Suicide risk and protective factors among youth experiencing school difficulties. Int. J.Ment. Health Nurs. 2007, 16, 349–359. [CrossRef] [PubMed]
17. Do, T.T.T.; Le, M.D.; Van Nguyen, T.; Tran, B.X.; Le, H.T.; Nguyen, H.D.; Nguyen, L.H.; Nguyen, C.T.;Tran, T.D.; Latkin, C.A.; et al. Receptiveness and preferences of health-related smartphone applicationsamong Vietnamese youth and young adults. BMC Public Health 2018, 18, 764. [CrossRef]
18. Robertson, L.; Skegg, K.; Poore, M.; Williams, S.; Taylor, B. An adolescent suicide cluster and the possiblerole of electronic communication technology. Crisis 2012, 33, 239–245. [CrossRef]
19. Luxton, D.D.; June, J.D.; Fairall, J.M. Social media and suicide: A public health perspective. Am. J.Public Health 2012, 102 (Suppl. 2), S195–S200. [CrossRef]
20. Puri, B.; Hall, A.; Ho, R. Revision Notes in Psychiatry, 3rd ed.; CRC Press: New York, NY, USA, 2013.
Int. J. Environ. Res. Public Health 2019, 16, 4581 20 of 26
21. Silverman, M.M.; Berman, A.L.; Sanddal, N.D.; O’Carroll, P.W.; Joiner, T.E. Rebuilding the tower of Babel:A revised nomenclature for the study of suicide and suicidal behaviors. Part 2: Suicide-related ideations,communications, and behaviors. Suicide Life Threat. Behav. 2007, 37, 264–277. [CrossRef]
22. O’Carroll, P.W.; Berman, A.L.; Maris, R.W.; Moscicki, E.K.; Tanney, B.L.; Silverman, M.M. Beyond the Towerof Babel: A nomenclature for suicidology. Suicide Life Threat. Behav. 1996, 26, 237–252.
23. International Soceity for the Study of Self-Injury. Available online: http://www.itriples.org/isss-aboutself-i.html (accessed on 29 April 2019).
24. Cheung, M.W.; Ho, R.C.; Lim, Y.; Mak, A. Conducting a meta-analysis: Basics and good practices. Int. J.Rheum. Dis. 2012, 15, 129–135. [CrossRef] [PubMed]
25. Ho, R.C.; Ong, H.S.; Kudva, K.G.; Cheung, M.W.; Mak, A. How to critically appraise and apply meta-analysesin clinical practice. Int. J. Rheum. Dis. 2010, 13, 294–299. [CrossRef] [PubMed]
26. Lim, G.Y.; Tam, W.W.; Lu, Y.; Ho, C.S.; Zhang, M.W.; Ho, R.C. Prevalence of Depression in the Communityfrom 30 Countries between 1994 and 2014. Sci. Rep. 2018, 8, 2861. [CrossRef] [PubMed]
27. Abraham, N.; Buvanaswari, P.; Rathakrishnan, R.; Tran, B.X.; Thu, G.V.; Nguyen, L.H.; Ho, C.S.; Ho, R.C. AMeta-Analysis of the Rates of Suicide Ideation, Attempts and Deaths in People with Epilepsy. Int. J. Environ.Res. Public Health 2019, 16, 1451. [CrossRef]
28. Foo, S.Q.; Tam, W.W.; Ho, C.S.; Tran, B.X.; Nguyen, L.H.; McIntyre, R.S.; Ho, R.C. Prevalence of Depressionamong Migrants: A Systematic Review and Meta-Analysis. Int. J. Environ. Res. Public Health 2018, 15, 1986.[CrossRef]
29. Lim, R.B.C.; Zhang, M.W.B.; Ho, R.C.M. Prevalence of All-Cause Mortality and Suicide among BariatricSurgery Cohorts: A Meta-Analysis. Int. J. Environ. Res. Public Health 2018, 15, 1519. [CrossRef]
30. Ng, A.; Tam, W.W.; Zhang, M.W.; Ho, C.S.; Husain, S.F.; McIntyre, R.S.; Ho, R.C. IL-1beta, IL-6, TNF-alphaand CRP in Elderly Patients with Depression or Alzheimer’s disease: Systematic Review and Meta-Analysis.Sci. Rep. 2018, 8, 12050. [CrossRef]
31. Liang, E.F.; Lim, S.Z.; Tam, W.W.; Ho, C.S.; Zhang, M.W.; McIntyre, R.S.; Ho, R.C. The Effect of Methylphenidateand Atomoxetine on Heart Rate and Systolic Blood Pressure in Young People and Adults with Attention-DeficitHyperactivity Disorder (ADHD): Systematic Review, Meta-Analysis, and Meta-Regression. Int. J. Environ.Res. Public Health 2018, 15, 1789. [CrossRef]
32. United Nation. Available online: https://unstats.un.org/unsd/methodology/m49/overview/ (accessed on26 April 2019).
33. Abell, W.D.; Sewell, C.; Martin, J.S.; Bailey-Davidson, Y.; Fox, K. Suicide ideation in Jamaican youth:Sociodemographic prevalence, protective and risk factors. West Indian Med. J. 2012, 61, 521–525. [CrossRef]
34. Altangerel, U.; Liou, J.C.; Yeh, P.M. Prevalence and predictors of suicidal behavior among Mongolian highschool students. Community Ment. Health J. 2014, 50, 362–372. [CrossRef]
35. Oppong Asante, K.; Meyer-Weitz, A. Prevalence and predictors of suicidal ideations and attempts amonghomeless children and adolescents in Ghana. J. Child Adolesc. Ment. Health 2017, 29, 27–37. [CrossRef]
36. Atlam, D.H.; Altinoprak, A.E.; Adam, D. Prevalence of risky behaviors and relationship of risky behaviorswith substance use among university students. J. Psychiatry Neurol. Sci. 2017, 30, 287–298.
37. Baetens, I.; Claes, L.; Muehlenkamp, J.; Grietens, H.; Onghena, P. Non-suicidal and suicidal self-injuriousbehavior among Flemish adolescents: A web-survey. Arch. Suicide Res. Off. J. Int. Acad. Suicide Res. 2011, 15,56–67. [CrossRef] [PubMed]
38. Begum, A.; Rahman, A.K.M.F.; Rahman, A.; Soares, J.; Reza Khankeh, H.; Macassa, G. Prevalence of suicideideation among adolescents and young adults in rural Bangladesh. Int. J. Ment. Health 2017, 46, 177–187.[CrossRef]
39. Benjet, C.; Gonzalez-Herrera, I.; Castro-Silva, E.; Mendez, E.; Borges, G.; Casanova, L.; Medina-Mora, M.E.Non-suicidal self-injury in Mexican young adults: Prevalence, associations with suicidal behavior andpsychiatric disorders, and DSM-5 proposed diagnostic criteria. J. Affect. Disord. 2017, 215, 1–8. [CrossRef]
40. Borges, G.; Azrael, D.; Almeida, J.; Johnson, R.M.; Molnar, B.E.; Hemenway, D.; Miller, M. Immigration,suicidal ideation and deliberate self-injury in the Boston youth survey 2006. Suicide Life Threat. Behav. 2011,41, 193–202. [CrossRef]
41. Brunner, R.; Parzer, P.; Haffner, J.; Steen, R.; Roos, J.; Klett, M.; Resch, F. Prevalence and psychologicalcorrelates of occasional and repetitive deliberate self-harm in adolescents. Arch. Pediatrics Adolesc. Med. 2007,161, 641–649. [CrossRef]
Int. J. Environ. Res. Public Health 2019, 16, 4581 21 of 26
42. Brunner, R.; Kaess, M.; Parzer, P.; Fischer, G.; Carli, V.; Hoven, C.W.; Wasserman, C.; Sarchiapone, M.;Resch, F.; Apter, A.; et al. Life-time prevalence and psychosocial correlates of adolescent direct self-injuriousbehavior: A comparative study of findings in 11 European countries. J. Child Psychol. Psychiatry Allied Discip.2014, 55, 337–348. [CrossRef]
43. Calvete, E.; Orue, I.; Aizpuru, L.; Brotherton, H. Prevalence and functions of non-suicidal self-injury inSpanish adolescents. Psicothema 2015, 27, 223–228. [CrossRef]
44. Barreto Carvalho, C.; da Motta, C.; Sousa, M.; Cabral, J. Biting myself so I don’t bite the dust: Prevalence andpredictors of deliberate self-harm and suicide ideation in Azorean youths. Rev. Bras. Psiquiatr. (Sao PauloBraz. 1999) 2017, 39, 252–262. [CrossRef]
45. Cerutti, R.; Manca, M.; Presaghi, F.; Gratz, K.L. Prevalence and clinical correlates of deliberate self-harmamong a community sample of Italian adolescents. J. Adolesc. 2011, 34, 337–347. [CrossRef] [PubMed]
46. Chan, K.L.; Straus, M.A.; Brownridge, D.A.; Tiwari, A.; Leung, W.C. Prevalence of dating partner violenceand suicidal ideation among male and female university students worldwide. J. Midwifery Women’s Health2008, 53, 529–537. [CrossRef] [PubMed]
47. Cheung, Y.T.; Wong, P.W.; Lee, A.M.; Lam, T.H.; Fan, Y.S.; Yip, P.S. Non-suicidal self-injury andsuicidal behavior: Prevalence, co-occurrence, and correlates of suicide among adolescents in Hong Kong.Soc. Psychiatry Psychiatr. Epidemiol. 2013, 48, 1133–1144. [CrossRef]
48. Choquet, M.; Menke, H. Suicidal thoughts during early adolescence: Prevalence, associated troubles andhelp-seeking behavior. Acta Psychiatr. Scand. 1990, 81, 170–177. [CrossRef] [PubMed]
49. Chou, C.H.; Ko, H.C.; Wu, J.Y.; Cheng, C.P. The prevalence of and psychosocial risks for suicide attempts inmale and female college students in Taiwan. Suicide Life Threat. Behav. 2013, 43, 185–197. [CrossRef]
50. Claes, L.; Muehlenkamp, J. The Relationship between the UPPS-P Impulsivity Dimensions and NonsuicidalSelf-Injury Characteristics in Male and Female High-School Students. Psychiatry J. 2013, 2013, 654847.[CrossRef]
51. Coughlan, H.; Tiedt, L.; Clarke, M.; Kelleher, I.; Tabish, J.; Molloy, C.; Harley, M.; Cannon, M. Prevalenceof DSM-IV mental disorders, deliberate self-harm and suicidal ideation in early adolescence: An Irishpopulation-based study. J. Adolesc. 2014, 37, 1–9. [CrossRef]
52. Donald, M.; Dower, J.; Lucke, J.; Raphael, B. Prevalence of adverse life events, depression and suicidalthoughts and behaviour among a community sample of young people aged 15-24 years. Aust. N. Z. J.Public Health 2001, 25, 426–432.
53. Doyle, L.; Treacy, M.P.; Sheridan, A. Self-harm in young people: Prevalence, associated factors, andhelp-seeking in school-going adolescents. Int. J. Ment. Health Nurs. 2015, 24, 485–494. [CrossRef]
54. Fleming, T.M.; Merry, S.N.; Robinson, E.M.; Denny, S.J.; Watson, P.D. Self-reported suicide attempts andassociated risk and protective factors among secondary school students in New Zealand. Aust. N. Z.J. Psychiatry 2007, 41, 213–221. [CrossRef]
55. Garisch, J.A.; Wilson, M.S. Prevalence, correlates, and prospective predictors of non-suicidal self-injuryamong New Zealand adolescents: Cross-sectional and longitudinal survey data. Child Adolesc. PsychiatryMent. Health 2015, 9, 261–266. [CrossRef] [PubMed]
56. Ghrayeb, F.A.; Mohamed, R.A.; Ismail, I.M.; Raifai, A.A. Prevalence of Suicide Ideation and Attempt amongPalestinian Adolescents: Across-Sectional Study. World J. Med. Sci. 2014, 10, 261–266.
57. Giletta, M.; Scholte, R.H.; Engels, R.C.; Ciairano, S.; Prinstein, M.J. Adolescent non-suicidal self-injury:A cross-national study of community samples from Italy, the Netherlands and the United States. PsychiatryRes. 2012, 197, 66–72. [CrossRef] [PubMed]
58. Grunbaum, J.A.; Kann, L.; Kinchen, S.A.; Williams, B.; Ross, J.G.; Lowry, R.; Kolbe, L. Youth risk behaviorsurveillance—United States, 2001. Morb. Mortal. Wkly. Rep. Surveill. Summ. (Wash. DC 2002) 2002, 51, 1–62.[CrossRef] [PubMed]
59. Han, B.; Compton, W.M.; Eisenberg, D.; Milazzo-Sayre, L.; McKeon, R.; Hughes, A. Prevalence and MentalHealth Treatment of Suicidal Ideation and Behavior Among College Students Aged 18-25 Years and TheirNon-College-Attending Peers in the United States. J. Clin. Psychiatry 2016, 77, 815–824. [CrossRef] [PubMed]
60. Han, H.; Park, B.; Park, B.; Park, N.; Park, J.O.; Ahn, K.O.; Tak, Y.J.; Lee, H.A.; Park, H. The Pyramid ofInjury: Estimation of the Scale of Adolescent Injuries According to Severity. J. Prev. Med. Public Health YebangUihakhoe Chi 2018, 51, 163–168. [CrossRef] [PubMed]
Int. J. Environ. Res. Public Health 2019, 16, 4581 22 of 26
61. Hawton, K.; Rodham, K.; Evans, E.; Weatherall, R. Deliberate self harm in adolescents: Self report survey inschools in England. BMJ (Clin. Res. Ed.) 2002, 325, 1207–1211. [CrossRef]
62. Hesketh, T.; Ding, Q.J.; Jenkins, R. Suicide ideation in Chinese adolescents. Soc. Psychiatry Psychiatr. Epidemiol.2002, 37, 230–235. [CrossRef]
63. Kadziela-Olech, H.; Zak, G.; Kalinowska, B.; Wagrocka, A.; Perestret, G.; Bielawski, M. The prevalence ofNon-suicidal Self-Injury (NSSI) among high school students in relation to age and sex. Psychiatr. Pol. 2015,49, 765–778. [CrossRef]
64. Kang, E.H.; Hyun, M.K.; Choi, S.M.; Kim, J.M.; Kim, G.M.; Woo, J.M. Twelve-month prevalence and predictorsof self-reported suicidal ideation and suicide attempt among Korean adolescents in a web-based nationwidesurvey. Aust. N. Z. J. Psychiatry 2015, 49, 47–53. [CrossRef]
65. Kataoka, C.; Nozu, Y.; Kudo, M.; Sato, Y.; Kubo, M.; Nakayama, N.; Iwata, H.; Watanabe, M. Relationshipsbetween prevalence of youth risk behaviors and sleep duration among Japanese high school students.[Nihon Koshu Eisei Zasshi] Jpn. J. Public Health 2014, 61, 535–544.
66. Kidger, J.; Heron, J.; Lewis, G.; Evans, J.; Gunnell, D. Adolescent self-harm and suicidal thoughts in theALSPAC cohort: A self-report survey in England. BMC Psychiatry 2012, 12, 69. [CrossRef] [PubMed]
67. Kvernmo, S.; Rosenvinge, J.H. Self-mutilation and suicidal behaviour in Sami and Norwegian adolescents:Prevalence and correlates. Int. J. Circumpolar Health 2009, 68, 235–248. [CrossRef] [PubMed]
68. Kirmayer, L.J.; Malus, M.; Boothroyd, L.J. Suicide attempts among Inuit youth: A community survey ofprevalence and risk factors. Acta Psychiatr. Scand. 1996, 94, 8–17. [CrossRef] [PubMed]
69. Larsson, B.; Sund, A.M. Prevalence, course, incidence, and 1-year prediction of deliberate self-harm andsuicide attempts in early Norwegian school adolescents. Suicide Life Threat. Behav. 2008, 38, 152–165.[CrossRef] [PubMed]
70. Laskyte, A.; Zemaitiene, N. The types of deliberate self-harm and its prevalence among Lithuanian teenagers.Medicina 2009, 45, 132–139. [CrossRef] [PubMed]
71. Laukkanen, E.; Rissanen, M.L.; Honkalampi, K.; Kylma, J.; Tolmunen, T.; Hintikka, J. The prevalence ofself-cutting and other self-harm among 13-to 18-year-old Finnish adolescents. Soc. Psychiatry Psychiatr.Epidemiol. 2009, 44, 23–28. [CrossRef]
72. Le, L.C.; Blum, R.W. Intentional injury in young people in Vietnam: Prevalence and social correlates.MEDICC Rev. 2011, 13, 23–28.
73. Lee, H.S.; Kim, S.; Choi, I.; Lee, K.U. Prevalence and risk factors associated with suicide ideation and attemptsin korean college students. Psychiatry Investig. 2008, 5, 86–93. [CrossRef]
74. Lee, C.G.; Cho, Y.; Yoo, S. The relations of suicidal ideation and attempts with physical activity amongKorean adolescents. J. Phys. Act. Health 2013, 10, 716–726. [CrossRef]
75. Lewinsohn, P.M.; Rohde, P.; Seeley, J.R. Adolescent Suicidal Ideation and Attempts: Prevalence, Risk Factors,and Clinical Implications. Clin. Psychol. Sci. Pract. 1996, 3, 25–46. [CrossRef]
76. Lin, M.P.; You, J.; Wu, Y.W.; Jiang, Y. Depression Mediates the Relationship between Distress Toleranceand Nonsuicidal Self-Injury among Adolescents: One-Year Follow-Up. Suicide Life Threat. Behav. 2018, 48,589–600. [CrossRef] [PubMed]
77. Liu, Z.Z.; Chen, H.; Bo, Q.G.; Chen, R.H.; Li, F.W.; Lv, L.; Jia, C.X.; Liu, X. Psychological and behavioralcharacteristics of suicide attempts and non-suicidal self-injury in Chinese adolescents. J. Affect. Disord. 2018,226, 287–293. [CrossRef] [PubMed]
78. Lucassen, M.F.; Merry, S.N.; Robinson, E.M.; Denny, S.; Clark, T.; Ameratunga, S.; Crengle, S.; Rossen, F.V.Sexual attraction, depression, self-harm, suicidality and help-seeking behaviour in New Zealand secondaryschool students. Aust. N. Z. J. Psychiatry 2011, 45, 376–383. [CrossRef] [PubMed]
79. Madu, S.N.; Matla, M.P. Correlations for perceived family environmental factors with substance use amongadolescents in South Africa. Psychol. Rep. 2003, 92, 403–415. [CrossRef] [PubMed]
80. Mahfoud, Z.R.; Afifi, R.A.; Haddad, P.H.; Dejong, J. Prevalence and determinants of suicide ideation amongLebanese adolescents: Results of the GSHS Lebanon 2005. J. Adolesc. 2011, 34, 379–384. [CrossRef]
81. Matsumoto, T.; Imamura, F.; Chiba, Y.; Katsumata, Y.; Kitani, M.; Takeshima, T. Prevalences of lifetimehistories of self-cutting and suicidal ideation in Japanese adolescents: Differences by age. Psychiatry Clin.Neurosci. 2008, 62, 362–364. [CrossRef]
82. McCann, M.; Schubotz, D.; McCartan, C.; McCrystall, P. 023 Prevalence of self-harm and help-seekingbehaviours among young people in Northern Ireland. J. Epidemiol. Community Health 2010, 64, A9. [CrossRef]
Int. J. Environ. Res. Public Health 2019, 16, 4581 23 of 26
83. Meehan, P.J.; Lamb, J.A.; Saltzman, L.E.; O’Carroll, P.W. Attempted suicide among young adults: Progresstoward a meaningful estimate of prevalence. Am. J. Psychiatry 1992, 149, 41–44. [CrossRef]
84. Bo, M.; Peter, C.; Annika, S. Non-Suicidal Self-Injury and Indirect Self-Harm Among Danish High SchoolStudents. Scand. J. Child Adolesc. Psychiatry Psychol. 2014, 2, 11–18.
85. Mojs, E.; Warchol-Biedermann, K.; Glowacka, M.D.; Strzelecki, W.; Ziemska, B.; Marcinkowski, J.T. Arestudents prone to depression and suicidal thoughts? Assessment of the risk of depression in universitystudents from rural and urban areas. Ann. Agric. Environ. Med. AAEM 2012, 19, 770–774. [PubMed]
86. Morey, C.; Corcoran, P.; Arensman, E.; Perry, I.J. The prevalence of self-reported deliberate self harm in Irishadolescents. BMC Public Health 2008, 8, 79. [CrossRef] [PubMed]
87. Morey, Y.; Mellon, D.; Dailami, N.; Verne, J.; Tapp, A. Adolescent self-harm in the community: An update onprevalence using a self-report survey of adolescents aged 13-18 in England. J. Public Health (Oxf. Engl.) 2017,39, 58–64. [CrossRef] [PubMed]
88. Muehlenkamp, J.J.; Williams, K.L.; Gutierrez, P.M.; Claes, L. Rates of non-suicidal self-injury in high schoolstudents across five years. Arch. Suicide Res. Off. J. Int. Acad. Suicide Res. 2009, 13, 317–329. [CrossRef][PubMed]
89. Muehlenkamp, J.J.; Ertelt, T.W.; Miller, A.L.; Claes, L. Borderline personality symptoms differentiatenon-suicidal and suicidal self-injury in ethnically diverse adolescent outpatients. J. Child Psychol. PsychiatryAllied Discip. 2011, 52, 148–155. [CrossRef]
90. Nada-Raja, S.; Skegg, K.; Langley, J.; Morrison, D.; Sowerby, P. Self-harmful behaviors in a population-basedsample of young adults. Suicide Life Threat. Behav. 2004, 34, 177–186. [CrossRef] [PubMed]
91. Nath, Y.; Paris, J.; Thombs, B.; Kirmayer, L. Prevalence and social determinants of suicidal behaviours amongcollege youth in India. Int. J. Soc. Psychiatry 2012, 58, 393–399. [CrossRef]
92. Nixon, M.K.; Cloutier, P.; Jansson, S.M. Nonsuicidal self-harm in youth: A population-based survey. CMAJ2008, 178, 306–312. [CrossRef]
93. Nobakht, H.N.; Dale, K.Y. The prevalence of deliberate self-harm and its relationships to trauma anddissociation among Iranian young adults. J. Trauma Dissociation Off. J. Int. Soc. Study Dissociation (ISSD)2017, 18, 610–623. [CrossRef]
94. Nock, M.K.; Green, J.G.; Hwang, I.; McLaughlin, K.A.; Sampson, N.A.; Zaslavsky, A.M.; Kessler, R.C.Prevalence, correlates, and treatment of lifetime suicidal behavior among adolescents: Results from theNational Comorbidity Survey Replication Adolescent Supplement. JAMA Psychiatry 2013, 70, 300–310.[CrossRef]
95. O’Connor, R.C.; Rasmussen, S.; Miles, J.; Hawton, K. Self-harm in adolescents: Self-report survey in schoolsin Scotland. Br. J. Psychiatry J. Ment. Sci. 2009, 194, 68–72. [CrossRef] [PubMed]
96. Omigbodun, O.; Dogra, N.; Esan, O.; Adedokun, B. Prevalence and correlates of suicidal behaviour amongadolescents in southwest Nigeria. Int. J. Soc. Psychiatry 2008, 54, 34–46. [CrossRef] [PubMed]
97. Patton, G.C.; Harris, R.; Carlin, J.B.; Hibbert, M.E.; Coffey, C.; Schwartz, M.; Bowes, G. Adolescent suicidalbehaviours: A population-based study of risk. Psychol. Med. 1997, 27, 715–724. [CrossRef] [PubMed]
98. Pawlowska, B.; Potembska, E.; Zygo, M.; Olajossy, M.; Dziurzynska, E. Prevalence of self-injury performedby adolescents aged 16-19 years. Psychiatr. Pol. 2016, 50, 29–42. [CrossRef] [PubMed]
99. Perez-Amezcua, B.; Rivera-Rivera, L.; Atienzo, E.E.; Castro, F.; Leyva-Lopez, A.; Chavez-Ayala, R. Prevalenceand factors associated with suicidal behavior among Mexican students. Salud Publica Mex. 2010, 52, 324–333.
100. Plener, P.L.; Libal, G.; Keller, F.; Fegert, J.M.; Muehlenkamp, J.J. An international comparison of adolescentnon-suicidal self-injury (NSSI) and suicide attempts: Germany and the USA. Psychol. Med. 2009, 39,1549–1558. [CrossRef]
101. Portzky, G.; De Wilde, E.J.; van Heeringen, K. Deliberate self-harm in young people: Differences in prevalenceand risk factors between the Netherlands and Belgium. Eur. Child Adolesc. Psychiatry 2008, 17, 179–186.[CrossRef]
102. Rey Gex, C.; Narring, F.; Ferron, C.; Michaud, P.A. Suicide attempts among adolescents in Switzerland:Prevalence, associated factors and comorbidity. Acta Psychiatr. Scand. 1998, 98, 28–33. [CrossRef]
103. Rudatsikira, E.; Muula, A.S.; Siziya, S. Prevalence and associated factors of suicidal ideation amongschool-going adolescents in Guyana: Results from a cross sectional study. Clin. Pract. Epidemiol. Ment.Health CP EMH 2007, 3, 13. [CrossRef]
Int. J. Environ. Res. Public Health 2019, 16, 4581 24 of 26
104. Rudd, M.D. The prevalence of suicidal ideation among college students. Suicide Life Threat. Behav. 1989, 19,173–183. [CrossRef]
105. Sampasa-Kanyinga, H.; Dupuis, L.C.; Ray, R. Prevalence and correlates of suicidal ideation and attemptsamong children and adolescents. Int. J. Adolesc. Med. Health 2017, 29. [CrossRef] [PubMed]
106. Sarno, I.; Madeddu, F.; Gratz, K.L. Self-injury, psychiatric symptoms, and defense mechanisms: Findings inan Italian nonclinical sample. Eur. Psychiatry J. Assoc. Eur. Psychiatr. 2010, 25, 136–145. [CrossRef] [PubMed]
107. Shaikh, M.A. Prevalence and correlates of suicidal expression among school attending adolescents in Pakistan.JPMA J. Pak. Med. Assoc. 2014, 64, 99–100. [PubMed]
108. Shek, D.T.; Yu, L. Self-harm and suicidal behaviors in Hong Kong adolescents: Prevalence and psychosocialcorrelates. Sci. World J. 2012, 2012, 932540. [CrossRef] [PubMed]
109. Sidhartha, T.; Jena, S. Suicidal behaviors in adolescents. Indian J. Pediatrics 2006, 73, 783–788. [CrossRef]110. Silviken, A.; Kvernmo, S. Suicide attempts among indigenous Sami adolescents and majority peers in Arctic
Norway: Prevalence and associated risk factors. J. Adolesc. 2007, 30, 613–626. [CrossRef]111. Soares, M.J.; Amaral, A.; Pereira, A.T.; Madeira, N.; Bos, S.; Valente, J.; Nogueira, V.; Oliveira, L.A.; Roque, C.;
Macedo, A. Prevalence of Suicidal Ideation Among Students. Eur. Psychiatry 2015, 30, 1802. [CrossRef]112. Somer, O.; Bildik, T.; Kabukcu-Basay, B.; Gungor, D.; Basay, O.; Farmer, R.F. Prevalence of non-suicidal
self-injury and distinct groups of self-injurers in a community sample of adolescents. Soc. PsychiatryPsychiatr. Epidemiol. 2015, 50, 1163–1171. [CrossRef]
113. Sornberger, M.J.; Heath, N.L.; Toste, J.R.; McLouth, R. Nonsuicidal self-injury and gender: Patterns ofprevalence, methods, and locations among adolescents. Suicide Life Threat. Behav. 2012, 42, 266–278.[CrossRef]
114. Straub, J.; Keller, F.; Sproeber, N.; Koelch, M.G.; Plener, P.L. Suicidal behavior in german adolescents.Prevalence and association with depressive and manic symptoms. Z. Kinder Jugendpsychiatrie Psychother.2015, 43, 39–45. [CrossRef]
115. Tang, J.; Yu, Y.; Wu, Y.; Du, Y.; Ma, Y.; Zhu, H.; Zhang, P.; Liu, Z. Association between non-suicidal self-injuriesand suicide attempts in Chinese adolescents and college students: A cross-section study. PLoS ONE 2011, 6,e17977. [CrossRef] [PubMed]
116. Tang, J.; Li, G.; Chen, B.; Huang, Z.; Zhang, Y.; Chang, H.; Wu, C.; Ma, X.; Wang, J.; Yu, Y. Prevalence of andrisk factors for non-suicidal self-injury in rural China: Results from a nationwide survey in China. J. Affect.Disord. 2018, 226, 188–195. [CrossRef] [PubMed]
117. YW, T. Non-Suicidal Self-injury in a Singaporean Community Adolescent Population: Prevalence and RiskFactors. Asian J. Psychiatry 2011, 4, S49–S50.
118. Thakur, D.; Gupta, A.; Thakur, A.; Mazta, S.R.; Sharma, D. Prevalence and predictors of suicidal ideationsamong school going adolescents in a hilly state of India. Ind. Psychiatry J. 2015, 24, 140–143. [CrossRef]
119. Toprak, S.; Cetin, I.; Guven, T.; Can, G.; Demircan, C. Self-harm, suicidal ideation and suicide attemptsamong college students. Psychiatry Res. 2011, 187, 140–144. [CrossRef]
120. Tresno, F.; Ito, Y.; Mearns, J. Self-injurious behavior and suicide attempts among Indonesian college students.Death Stud. 2012, 36, 627–639. [CrossRef]
121. Valdez-Santiago, R.; Solorzano, E.H.; Iniguez, M.M.; Burgos, L.A.; Gomez Hernandez, H.; MartinezGonzalez, A. Attempted suicide among adolescents in Mexico: Prevalence and associated factors at thenational level. Inj. Prev. J. Int. Soc. Child Adolesc. Inj. Prev. 2018, 24, 256–261. [CrossRef]
122. Vawda, N. The prevalence of suicidal behaviour and associated risk factors in grade 8 learners in Durban. S.Afr. Fam. Pract. 2014, 56, 37–42. [CrossRef]
123. Ventura-Junca, D.R.; Carvajal, C.; Undurraga, S.; Vicuna, P.; Egana, J.; Garib, M.J. Prevalence of suicidalideations and suicidal attempts among adolescents living in Metropolitan Santiago. Rev. Med. Chile 2010,138, 309–315.
124. Wan, Y.H.; Hu, C.L.; Hao, J.H.; Sun, Y.; Tao, F.B. Deliberate self-harm behaviors in Chinese adolescents andyoung adults. Eur. Child Adolesc. Psychiatry 2011, 20, 517–525. [CrossRef]
125. Whitlock, J.; Muehlenkamp, J.; Purington, A.; Eckenrode, J.; Barreira, P.; Baral Abrams, G.; Marchell, T.;Kress, V.; Girard, K.; Chin, C.; et al. Nonsuicidal self-injury in a college population: General trends and sexdifferences. J. Am. Coll. Health 2011, 59, 691–698. [CrossRef] [PubMed]
Int. J. Environ. Res. Public Health 2019, 16, 4581 25 of 26
126. Xin, X.; Wang, Y.; Fang, J.; Ming, Q.; Yao, S. Prevalence and Correlates of Direct Self-Injurious Behavioramong Chinese Adolescents: Findings from a Multicenter and Multistage Survey. J. Abnorm. Child Psychol.2017, 45, 815–826. [CrossRef] [PubMed]
127. Zetterqvist, M.; Lundh, L.G.; Dahlstrom, O.; Svedin, C.G. Prevalence and function of non-suicidal self-injury(NSSI) in a community sample of adolescents, using suggested DSM-5 criteria for a potential NSSI disorder.J. Abnorm. Child Psychol. 2013, 41, 759–773. [CrossRef] [PubMed]
128. Zubrick, S.R.; Hafekost, J.; Johnson, S.E.; Lawrence, D.; Saw, S.; Sawyer, M.; Ainley, J.; Buckingham, W.J.Self-harm: Prevalence estimates from the second Australian Child and Adolescent Survey of Mental Healthand Wellbeing. Aust. N. Z. J. Psychiatry 2016, 50, 911–921. [CrossRef] [PubMed]
129. Snowdon, J. Differences between patterns of suicide in East Asia and the West. The importance of socioculturalfactors. Asian J. Psychiatry 2018, 37, 106–111. [CrossRef] [PubMed]
130. Hunter, E.; Milroy, H. Aboriginal and Torres Strait Islander suicide in context. Arch. Suicide Res. Off. J. Int.Acad. Suicide Res. 2006, 10, 141–157. [CrossRef]
131. Klonsky, E.D.; May, A.M.; Glenn, C.R. The relationship between nonsuicidal self-injury and attemptedsuicide: Converging evidence from four samples. J. Abnorm. Psychol. 2013, 122, 231–237. [CrossRef]
132. Klonsky, E.D.; Victor, S.E.; Saffer, B.Y. Nonsuicidal self-injury: What we know, and what we need to know.Can. J. Psychiatry 2014, 59, 565–568. [CrossRef]
133. Klonsky, E.D.; Muehlenkamp, J.J. Self-injury: A research review for the practitioner. J. Clin. Psychol. 2007, 63,1045–1056. [CrossRef]
134. Statista. Ethnic Group in Australia. Available online: https://www.statista.com/statistics/260502/ethnic-groups-in-australia/ (accessed on 26 April 2019).
135. Pekrun, R.; Goetz, T.; Titz, W.; Perry, R.P. Academic Emotions in Students’ Self-Regulated Learning andAchievement: A Program of Qualitative and Quantitative Research. Educ. Psychol. 2002, 37, 91–105.[CrossRef]
136. Yeo, S.K.; Lee, W.K. The relationship between adolescents’ academic stress, impulsivity, anxiety, and skinpicking behavior. Asian J. Psychiatry 2017, 28, 111–114. [CrossRef] [PubMed]
137. Olweus, D. School bullying: Development and some important challenges. Annu. Rev. Clin. Psychol. 2013, 9,751–780. [CrossRef] [PubMed]
138. Prinstein, M.J.; Boergers, J.; Vernberg, E.M. Overt and relational aggression in adolescents:Social-psychological adjustment of aggressors and victims. J. Clin. Child Psychol. 2001, 30, 479–491.[CrossRef] [PubMed]
139. Vergara, G.A.; Stewart, J.G.; Cosby, E.A.; Lincoln, S.H.; Auerbach, R.P. Non-Suicidal self-injury and suicidein depressed Adolescents: Impact of peer victimization and bullying. J. Affect. Disord. 2019, 245, 744–749.[CrossRef] [PubMed]
140. Cluver, L.; Orkin, M.; Boyes, M.E.; Sherr, L. Child and Adolescent Suicide Attempts, Suicidal Behavior, andAdverse Childhood Experiences in South Africa: A Prospective Study. J. Adolesc. Health Off. Publ. Soc.Adolesc. Med. 2015, 57, 52–59. [CrossRef]
141. Shaikh, M.A.; Lloyd, J.; Acquah, E.; Celedonia, K.L.; Wilson, M.L. Suicide attempts and behavioral correlatesamong a nationally representative sample of school-attending adolescents in the Republic of Malawi.BMC Public Health 2016, 16, 843. [CrossRef]
142. Thupayagale-Tshweneagae, G.; Benedict, S. The burden of secrecy among South African adolescents orphanedBy HIV and AIDS. Issues Ment. Health Nurs. 2011, 32, 355–358. [CrossRef]
143. Forjuoh, S.N.; Zwi, A.B. Violence against children and adolescents. International perspectives. Pediatric Clin.North Am. 1998, 45, 415–426. [CrossRef]
144. Zhang, M.W.; Ho, R.C. Enabling Psychiatrists to Explore the Full Potential of E-Health. Front. Psychiatry2015, 6, 177. [CrossRef]
145. Zhang, M.W.; Ho, R.C. Smartphone application for multi-phasic interventional trials in psychiatry: Technicaldesign of a smart server. Technol. Health Care Off. J. Eur. Soc. Eng. Med. 2017, 25, 373–375. [CrossRef]
146. Kim, Y.J.; Moon, S.S.; Lee, J.H.; Kim, J.K. Risk Factors and Mediators of Suicidal Ideation Among KoreanAdolescents. Crisis 2018, 39, 4–12. [CrossRef]
147. Offer, D.; Howard, K.I.; Schonert, K.A.; Ostrov, E. To whom do adolescents turn for help? Differences betweendisturbed and nondisturbed adolescents. J. Am. Acad. Child Adolesc. Psychiatry 1991, 30, 623–630. [CrossRef][PubMed]
Int. J. Environ. Res. Public Health 2019, 16, 4581 26 of 26
148. Groholt, B.; Ekeberg, O.; Wichstrom, L.; Haldorsen, T. Suicide among children and younger and olderadolescents in Norway: A comparative study. J. Am. Acad. Child Adolesc. Psychiatry 1998, 37, 473–481.[CrossRef] [PubMed]
149. Vrshek-Schallhorn, S.; Czarlinski, J.; Mineka, S.; Zinbarg, R.E.; Craske, M. Prospective Predictors of SuicidalIdeation during Depressive Episodes among Older Adolescents and Young Adults. Personal. Individ. Differ.2011, 50, 1202–1207. [CrossRef] [PubMed]
150. Rohde, P.; Noell, J.; Ochs, L.; Seeley, J.R. Depression, suicidal ideation and STD-related risk in homeless olderadolescents. J. Adolesc. 2001, 24, 447–460. [CrossRef]
151. Ang, R.P.; Ooi, Y.P. Impact of gender and parents’ marital status on adolescents’ suicidal ideation. Int. J.Soc. Psychiatry 2004, 50, 351–360. [CrossRef]
152. Ang, R.P.; Chia, B.H.; Fung, D.S. Gender differences in life stressors associated with child and adolescentsuicides in Singapore from 1995 to 2003. Int. J. Soc. Psychiatry 2006, 52, 561–570. [CrossRef]
© 2019 by the authors. Licensee MDPI, Basel, Switzerland. This article is an open accessarticle distributed under the terms and conditions of the Creative Commons Attribution(CC BY) license (http://creativecommons.org/licenses/by/4.0/).