Embed Size (px)
Citation preview
HEPO|lT SAMSO-TIf-79.43
Global J.ightning Distribution at Dawn and DuskW for August-December 1977 as Observed by the
DMSP Lightning Detector
B. C. EDGAR /Space Sciences Laboratory
Laboratory Operations , *"
The Aerospace Corporation. ... -.
El Segundo, Calif. 90245 b.!. t.
, JUL 2 7 '
15 Junc 1979 , .
Interim Report
-w- APPROVED FOR PUBLIC RELEASE;
DISTRIBUTION UNLIMITED
Prepared for
AIR FORCE TECHNICAL APPLICATIONS CENTERPatrick Air Force Base, Fla. 32935
SPACE AND MISSILE SYSTEMS ORGANIZATIONAIR FORCE SYSTEMS C;/OMMAND
Los Angeles Air Force StationP.O. Box 92960, Worldway Postal Center
Los Angeles, Calif. 90009
79 07 97
N/
This interim report was submitted by The Aerospace Corporation,
El Segundo, CA 90245, under Contract No. F04701-78-C-0079 with the Space
and Missile Systems Organization, Deputy for Advanced Space Programs,
P.O. Box 92960, Worldway Postal Center, Los Angeles, CA 90009. It was
reviewed and approved for The Aerospace Corporation by G. A. Paulikas,
Director, Space Sciences Laboratory. Lieutenant A. G. Fernandez, SAMSO/
YCPT, was the project officer for Advanced Space Programs.
This report has been reviewed by the Information Office (01) and is
releasabie to the National Technical Information Service (NTIS). At NTIS,
it will be available to the general public, including foreign nations.
This technical report has been reviewed and is approved for publication.
Publication of this report does not constitute Air Force approval of the
report's findings or conclusions. It is published only for the exchange and
stimulation of ideas.
Xrturo G. Fernandez, Lt, USAF George EU Kuck, Maj, USAF, ChiefProject Officer Technology Plans Division
FOR THE COMMANDER
YR. STUART, Colonel, USAFAsst. Deputy for Technology

UN CLASSIFIEDSECURITY C .&IFICATION OF THIS PAGE (When Date EnIeted)
READ INSTRUCTIONSL,. EPORT DOCUMENTATIO N PAGE BEFORE COMPLETING FORMRE ll 2. GOVT ACCESSION NO. 3. RECIPIENT'S CATALOG HUMBEIR
(J SAMSOqTR- 79-4 /<-T* -.- ~ k._PY'OF REPORT_& PERIOD COVERED
_.,.LQBALI GHTNING.PSTRIBUTION AT-DAWN_* K; AND DUSK FOR 4UGUST-WECEMBE:R 197-7 AS/ lInterim.
* , ru~eC/ Edgar
9. PERFORMING ORGANIZATION NAME AND ADDRESS t0. 1.R LEENT. PRO ECT. TASKThe Aerospace Corporation
M1EA Segundo , Calif. 90245
Ii. CONTROLLING OFFICE NAME AND ADDRESS
Air Force Technical Applications Center ' 5J Jun 7 9
Patrick Air Force Base, Fla. 32935 1.NUMBER OF PAGES
IS mONITORING AGENCY NAME & ADDRESS(If dlifoent from Cont rolling Office) 15. SECURITY CLASS. (of this report)
Space and Missiles Systems Command UnclassifiedAir Force Systemns CommandLos Angeles, Calif. 90009 ISs. DCLSSIIC ATI ON/ DOWN GRADING
16. DISY RIRUTION STATEMENT (of this Report)
Approved for public release; distribution unlimited.
17. DISTRIBUTION STATEMENT (of the abstract enteted In Block 20, it different from Report)
IS. SUPPLEMENTARY NOTES
Submitted for pruscntation at International Union of Radio Science,Helsinki, Finland, ! August 1978.
IS. KEY WIORDS (Continue on favor&@ aide ft naceaveri' ad identify by block n~iuher)
sampled lightning activity worldwide during August-December 1977. At dawnthe distribution of events is somewhat evenly spread over both hemisphereswith a slight bias towards land areas in the summer hemisphere. There issignificant activity over the oceans in both hemispheres at dawn, presumablydue to radiative cooling of the atmoncsphere, However, at dusk lightning occursprimarily over the warmer land arEas in the summer hemisphere with very
DO FORM1473IPACSIMILE' UNCLASSIFIED -
69 SCURITY CLASSIFICATION OF THIS PAOIE (111hen Data Bnte,.d
UNCLASSIFIEDSECURITY CLASSIFICATION OF THIS PAOEO(Whi Data Sne-94)19. KEY WOROS (Cenflnuod)
Z0. ABSTRACT (tonttnuod)
-~few events in the winter hemisphere. Also there is a marked increase oflightning events about the tropical convergence zone. These distributionplots give for the first time a global snapshot of lightning activity whichcould lead to a better understanding of the global atmospheric noisedistribution.
13 15 \
UNCLASSIFIEDSECU!RITY CL ASSIFICATION OF THIS PAOEfWCef Data Ente,.d)
CONTENTS
INTRODUCTION............................................. 5
DESCRIPTION OF EXPERIMENT....................7
GENERAL WAVEFORM STATISTICS...................it
GEOGRAPHICAL DISTRIBUTION OF LIGHTING ACTIVITY..........17
DISCUSSION................................................ 18
APPLICATIONS.............................................30
CONCLUSIONS.............................32
REFERENCES...............................................33
TABLES
1. Sensor Sampling and Trigger Modes.................o
2. Total Lightning Counts......................14
3. Global Occurrence Rates................................. 29
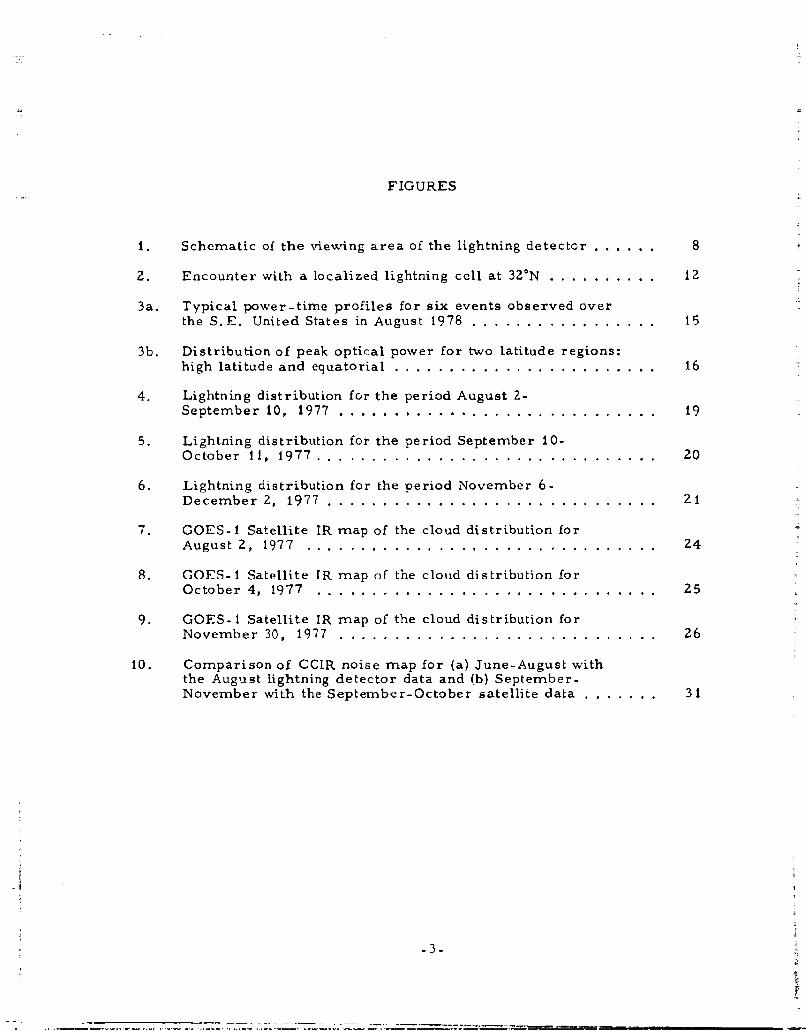
FIGURES
I. Schematic of the viewing area of the lightning detector ......... 8
2. Encounter with a localized lightning cell at 32°N .............. 12
3a. Typical power-time profiles for six events observed overthe S. E. United States in August 1978 ...... ................. 15
3b. Distribution of peak optical power for two latitude regions:high latitude and equatorial ........ ........................ 16
4. Lightning distribution for the period August 2-September 10, 1977 .......... ............................. 19
5. Lightning distribution for the period September 10-October 11, 1977 .......... ............................... 20
6. Lightning distribution for the period November 6-December 2, 1977 .......... .............................. 21
7. GOES-I Satellite IR map of the cloud distribution forAugust 2, 1977 4................................24
8. GOES-I Satellite IR map of the cloud distribution forOctober 4, 1977 5...............................25
9. GOES-1 Satellite IR map of the cloud distribution forNovember 30, 1977 ............................. 26
10. Comparison of CCIR noise map for (a) June-August withthe August lightning detector data and (b) September-November with the September-October satellite data .......... 31
-3-
INTRODUCTION
L - Previous lightning measurements and analyses have been seriously
restricted by the limited perspective inherent in ground-based observations.
A truly global, continuously available perspective of lightning activity can
be obtained most readily from satellite platforms. Such satellite data are
now available as a result of a special lightning experiment now flying on
Defense Meteorological Satellite Program (DMSP) Flight 2. This experi-
ment was designed to detect and record optical pulse profiles from lightning
flashes occurring below the spacecraft within a circle of 780 Km radius.
The main objectives were to develop peak power and waveform statistics,
and to map global distributions of lightning activity. A previous American
Geophysical Union paper (Edgar and Turman, 1977) presented waveforr
statistics collected over the Southeast United States during the summer of
1977. The present paper will amplify these results and show worldwide
distribution of lightning activity over the period August - December 1977.
-5-
DESCRIPTION OF EXPERIMENT
In June 1977, the Defense Meteorological Satellite Program (DMSP)
Flight 2 weather satellite was launched into an 830 Km altitude, sun-
synchronous (dawn-dusk) polar orbit. The primary sensors on the satellite
provide visible and infrared (IR) pictures of the world's weather system.
The PBE secondary sensor was designed and built by Sandia Laboratories,
Albuquerque, to provide additional information concerning optical charac-
teristics of lightning. The main optical sensor in the PBE is a silicon
photodiode, with peak sensitivity at 0. 9 micrometer. The conical field of
view is directed vertically downward; the unvignetted half angle is 350,
and limited response, as a result of vignetting of the photodiode, is obtained
out to 39. 50 half angle. The angular response of the sensor is plotted in
Figure 1. The projection of the vignetted field of view on the earth is a
circle of 780 Km radius, centered at the satellite subpoint.
The data processing electronics include a feedback circuit to compen-
sate for the DC component due to the earth'a albedo, a threshold trigger
circuit, and a lightning verification gate. DC compensation allows lightning
detection at threshold even under full earth illumination. A number of
false triggers, however, are sometimes generated by a sudden change in
-7-
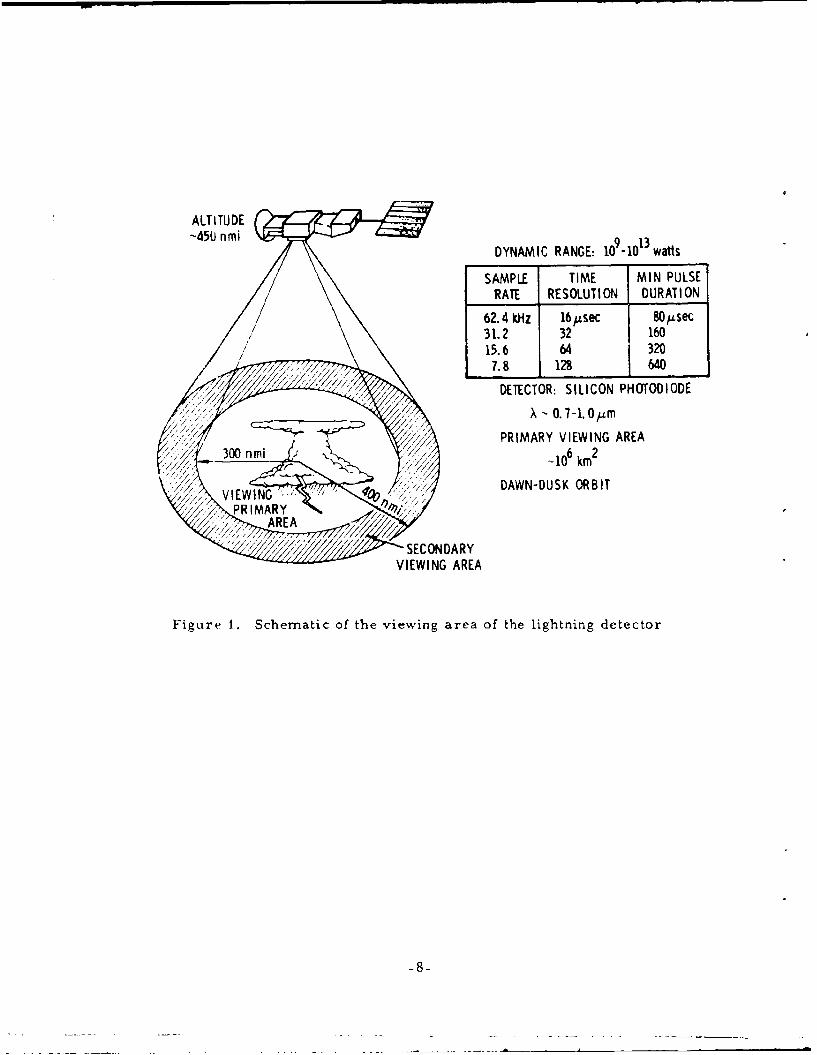
-450 nmi 91DYNAMIC RANGE: 10-10"watts
SAMPLE TIME MIN PULSERATE RESOLUTION DURATION
62.4 kHz 16 sec 80p±sec31.2 32 16015.6 64 320
7.8 1128 j640~ / // ///,/~////DETECTOR: SILICON PH OTOD IlODE
PRIMARY VIEWING AREA300 n62 -10 km'
DAWN-DUSK ORBIT
SECONDARYVIEWING AREA
Figure 1. Schematic of the viewing area of the lightning detector
the background illumination level, a situation which can arise as the
sensor field of view moves over a wide band of high clouds being illumi-
nated by the sun. These "compensation triggers" are easily recognized
and have been eliminated from the lightning data base. When a lightning
flash occurs within the sensor's field and the rapidly rising optical signal
exceeds a predetermined amplitude threshold, digital sampling of the
signal is begun. Any of the four sampling rates listed in Table I may be
selected. The instantaneous optical power is sampled and digitized into
63 logarithmically spaced intervals between 4 x 10⁹ and 1013 watts. A
data frame of 30 samples is stored in a 32 event memory if the signal
passes a lightning verification gate- -basically a test of the pulse width.
The verification requires that at least 5 of the first 8 samples have a
digital amplitude greater than threshold, and was included in the trigger
logics to eliminate triggers due to high energy particles.
Because of telemetry limitations, only one event frame is read from
the event memory to the primar system tape recorder every four seconds.
Event time is not registered until the event frame is placed on the primary
tape recorder; event time can thus be measured with precision no greater
than 4 seconds. Since event frame readout occurs at a rate much slower
than the potential event triggering rate, it is possible that an event frame
will be logged and timed as long as 128 seconds after its occurrence. An
event trigger counter is provided to resolve this possible timing uncertainty.
To illustrate the lightning data obtained from this sensor, a typical
example will be discussed. Figure 2 displays the visible cloud image taken
with the DMSP prime sensors on 2Z July 1977. The Great Lakes region is
-9-
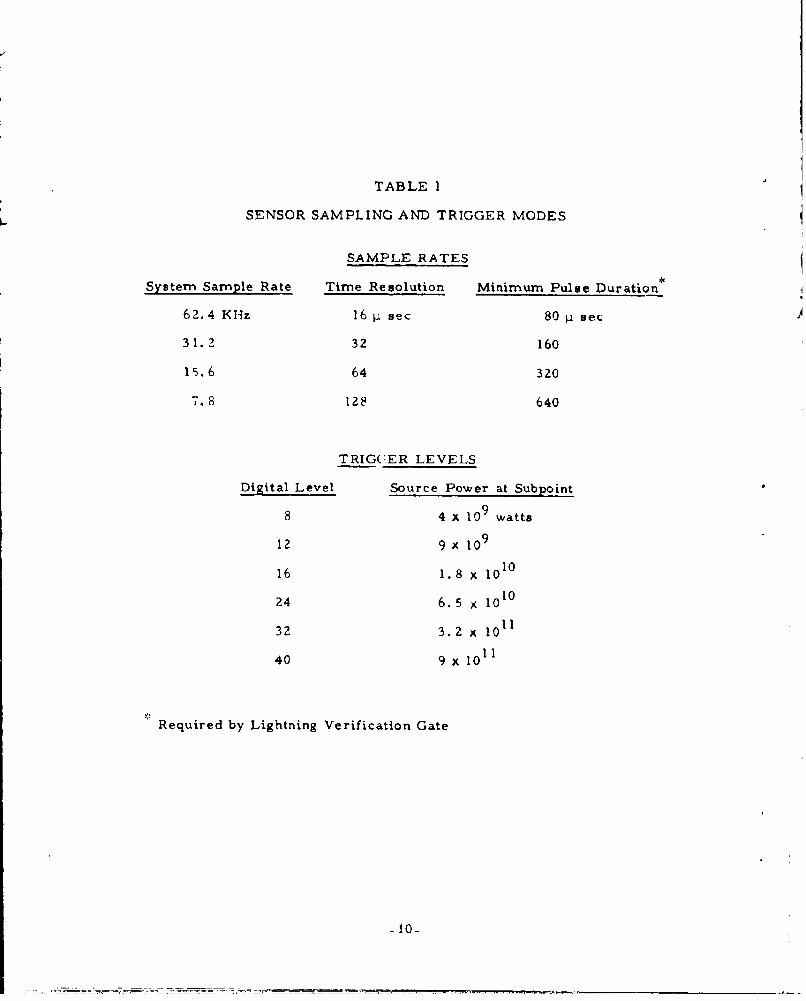
TABLE I
SENSOR SAMPLING AND TRIGGER MODES
SAMPLE RATES
System Sample Rate Time Resolution Minimum Pulse Duration
62.4 KHz 16 p sec 80 p sec
31.2 32 160
15.6 64 320
7.8 128 640
TRIG(ER LEVELS
Digital Level Source Power at Subpoint
8 4 x 10⁹ watts
12 9 x 10⁹
16 1.8 x 10¹⁰
24 6.5 X 10o
32 3.2 x 10¹¹
40 9x 10
Required by Lightning Verification Gate
-10-
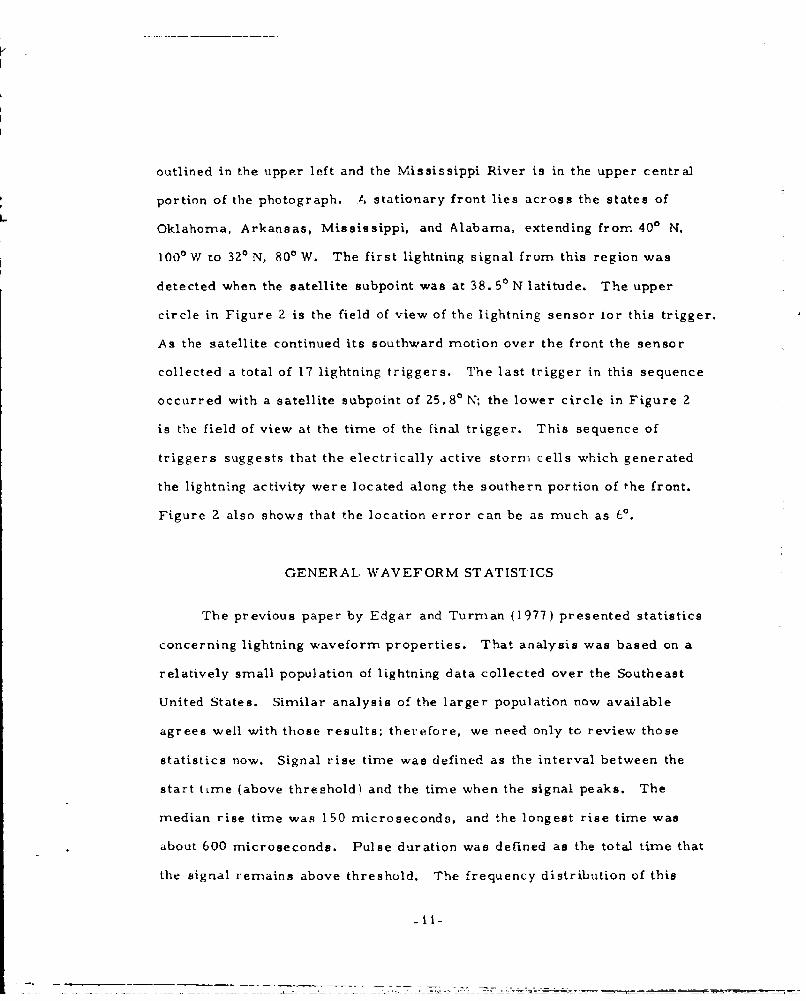
outlined in the upper left and the Mississippi River is in the upper central
portion of the photograph. t, stationary front lies across the states of
Oklahoma, Arkansas, Mississippi, and Alabama, extending from 400 N.
1000 W to 320N, 80 0 W. The first lightning signal from this region was
detected when the satellite subpoint was at 38. 50 N latitude. The upper
circle in Figure 2 is the field of view of the lightning sensor tor this trigger.
As the satellite continued its southward motion over the front the sensor
collected a total of 17 lightning triggers. The last trigger in this sequence
occurred with a satellite subpoint of Z5.8 0 N; the lower circle in Figure 2
is the field of view at the time of the final trigger. This sequence of
triggers suggests that the electrically active storm cells which generated
the lightning activity were located along the southern portion of the front.
Figure 2 also shows that the location error can be as much as 60.
GENERAL WAVEFORM STATIS'IICS
The previous paper by Edgar and Turrnan (1977) presented statistics
concerning lightning waveform properties. That analysis was based on a
relatively small population oi lightning data collected over the Southeast
United States. Similar analysis of the larger population now available
agrees well with those results; therefore, we need only to review those
statistics now. Signal rise time was defined as the interval between the
start tLme (above threshold) and the time when the signal peaks. The
median rise time was 150 microseconds, and the longest rise time was
about 600 microseconds. Pulse duration was defined as the total time that
the signal remains above threshold. The frequency distribution of this
_11-
0U
I.- 4)
rv J= r
Fn
LZ4
Hd
rq i)
Od
-W >i,4
2-m
parameter is particularly important to understand, because of the minimum
pulse duration requirement for triggering the sensor. As shown in Table 1,
the slower system sampling rates imposed longer minimum pulse duration
requirements, and thus short duration pulses would not be detected at the
slower sampling rates. The median pulse duration was 400 microseconds,
and the longest recorded pulses were less than 2 milliseconds in duration.
Although it wan not possible to detect lightning pulses shorter than 80
microseconds duration (sensor design limitation), this minimum duration
requirement did not seem to induly bias the pulse duration frequency statis-
tics. Table 2 gives the fraction of lightning strokes detected, for each of
the sampling rates.
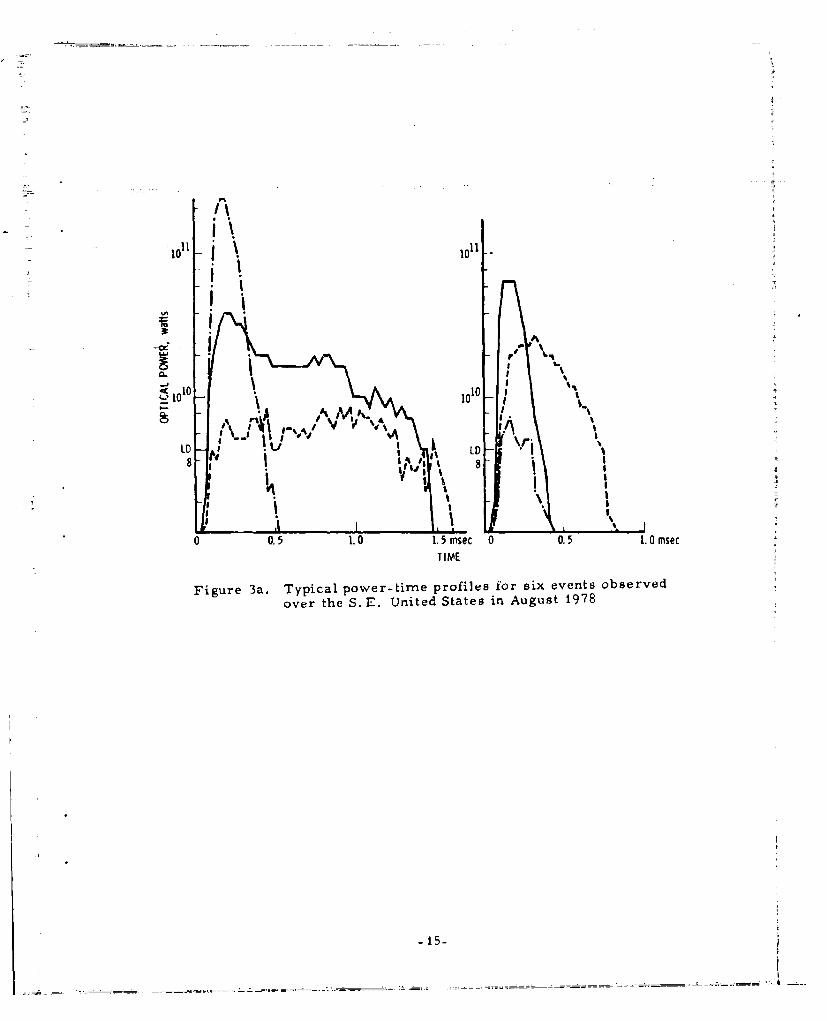
Figure 3 shows the power-time profiles for 6 typical events. The
rise times range from 100 to 150 microseconds, but the duration times
show a wide variation. The events with < 0. 5 millisecond duration times
agree with the typical duration times of negative return strokes as photo-
graphed by Berger (1967) at Mt. San Salvatore. However the longer events
(>1.0 millisecond) may be due to positive upward strokes or cloud flashes
since Berger (1967) shows examples of these events lasting up to 3 milli-
seconds. Only 7% of the satellite ob ,-ved events had duration times
greater than 1 millisecond which agrees with the percentage of positive
strnkes observed on the ground (Uman, 1969).
-13-
____________
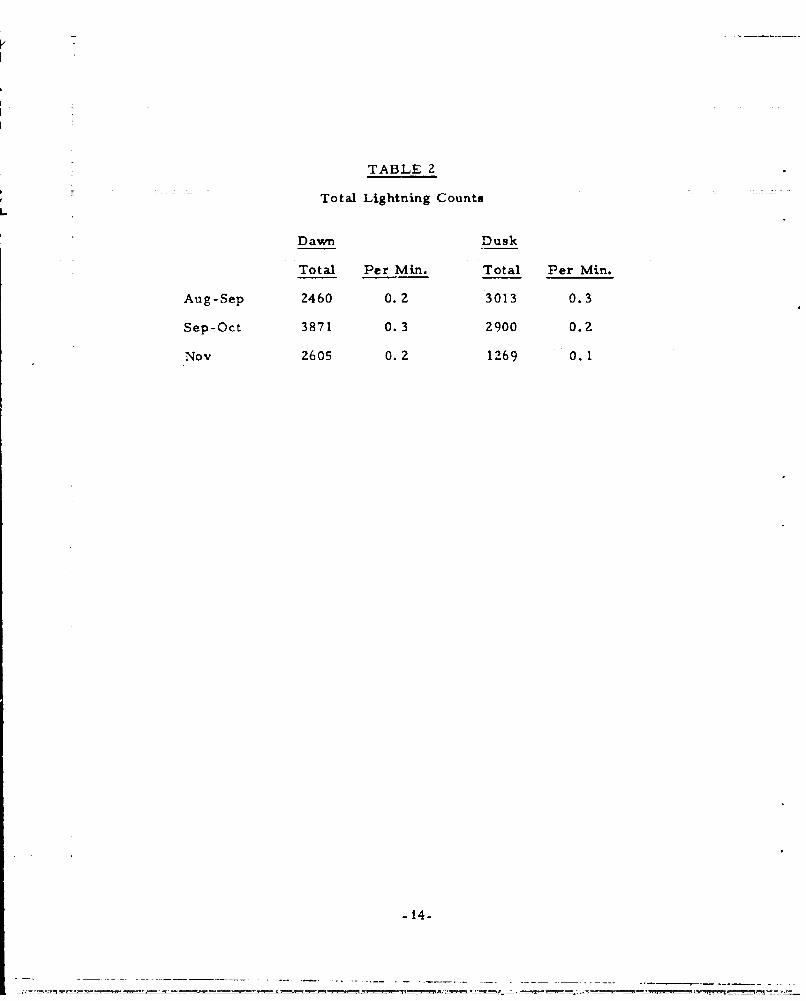
TABLE 2
Total Lightning Count.
Dawn Dusk
Total Per Min. Total Per Min.
Aug-Sep 2460 0.2 3013 0.3
Sep-Oct 3871 0.3 2900 0.2
Nov 2605 0.2 1269 0.1
-14-
1 1 1 0 1 I
1 10 10 10o . V ,,// i , "4V
I A
0 0.5 LO 1.5msec 0 0.5 1.OmsecTIME
Figure 3a. Typical power-time profiles for six events observed
over the S. E. United States in August 1978
-15-
- - - - - - -- ___ ___ -
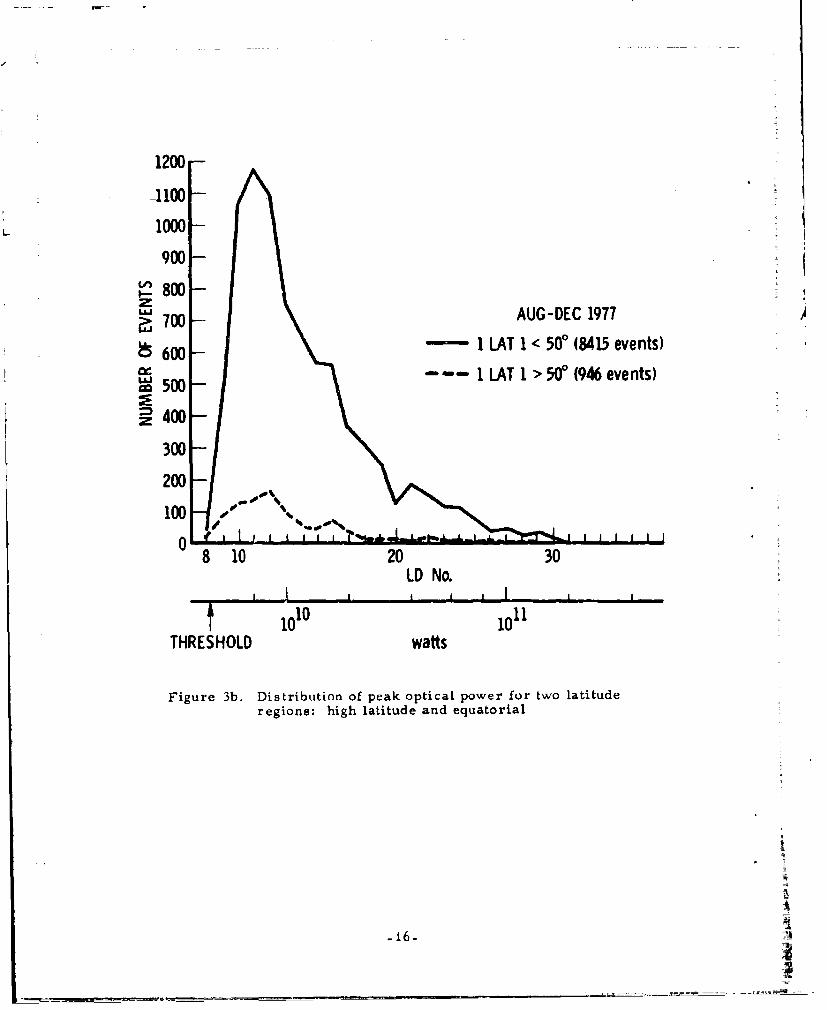
1200
1100
L 1000-
900
28 00zail700 AUG-DEC 1977
.6600 - I LAT 1 <5W(8415 events)W_--- LAT 1 > 51f (946 events)
~500
z 400-
300
200
100
0810 20 30LD No.
T _ 10 10 10 11THRESHOLD watts
Figure 3b. Distribution of peak optical power for two latituderegions; high latitude and equatorial
A
_16_
Probability of occurrence of peak optical power above the threshold
of 4 x 10 watts was also evaluated from the PBE data. As shown by
10Figure 3a, the median for this distribution is about 10 watts, and some-
what less than 1% of the detected lightning strokes had power in excess of
1011 watts. No power larger than 7 x l01 watts has been observed. The
relatively high detection threshold of the PBE sensor severely distorts the
true distribution of peak power, since a great deal of all lightning strokes
have power below this threshold. A previous DMSP lightning sensor,
called the SSL sensor, provided a frequency distribution over the range
108 - 1010 watts (Turman, 1976). Approximately 87% of all lightning
flashes in this range had peak power below 4 x 10⁹ watts, and it was esti-
mated that about 40% of all lightning strokes had power below the SSL
threshold. Therefore, the PBE sensor, even in its most sensitive sampling
rate mode, will detect only about 8% of all lightning flashes occurring
within its view.
GEOGRAPHICAL DISTRIBUTION OF LIGHTNING ACTIVITY
One of the primary goals of this project is to measure the geograph-
ical distribution of lightning activity. The relatively large field of view
of the sensor, however, allows only a coarse-grain development of the
distribution. Geographical bins, 100 x 100, were used in sorting the
lightning data. From its sun-synchronous, polar orbit, the DMSP satellite
sees the earth continuously at local times of dawn (approximately 0700) and
dusk (approximately 1900). The orbital period is 100 minutes, and 15
orbits are completed each day. The result is that the satellite subpoint
-17-
resides within each of these bins for an average of 1-5 minutes per day
for each of the dawn and dusk passes. There are some geographicalL
regions, however, which receive less coverage because of the primary
mission operational schedule. Most of these power-down regions were
over the Pacific Ocean and Indian Ocean.
Lightning count rate for each of the geographical regions was deter-
mined by counting the number of lightning strokes detected while the
satellite subpoint was within that region and then dividing by the total
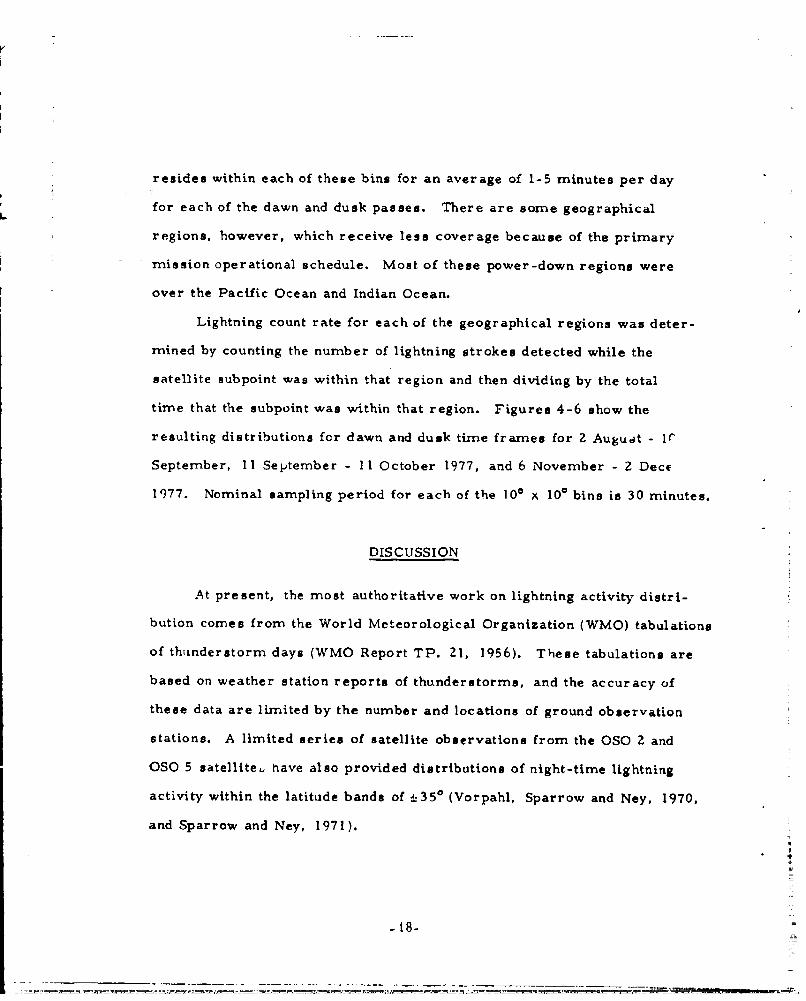
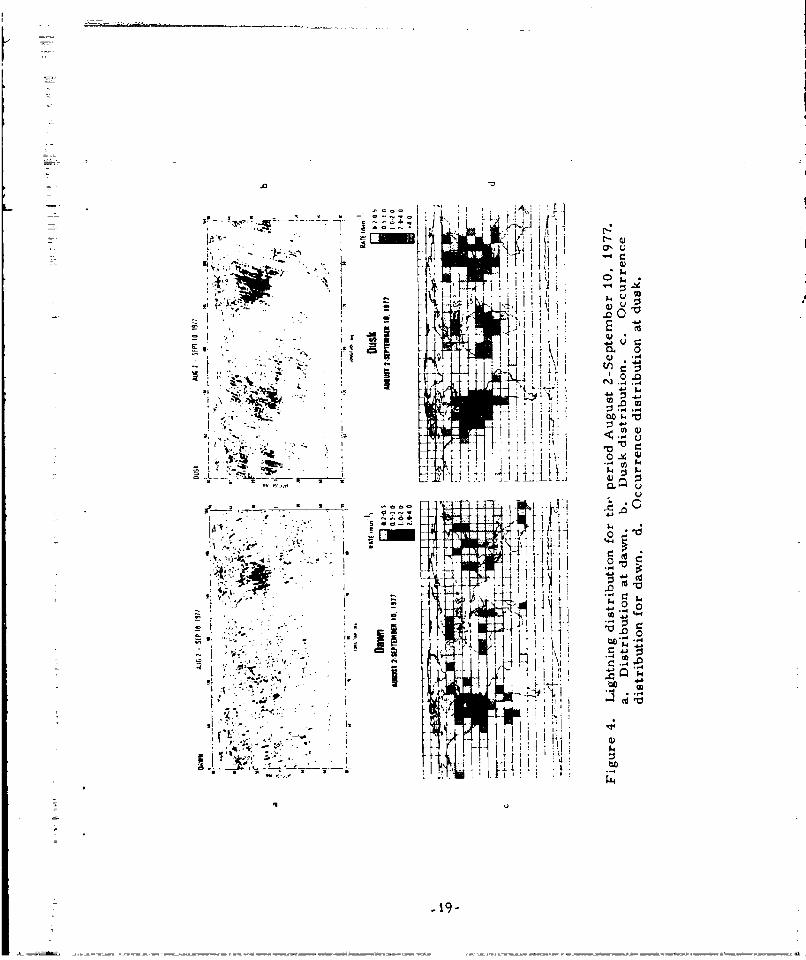
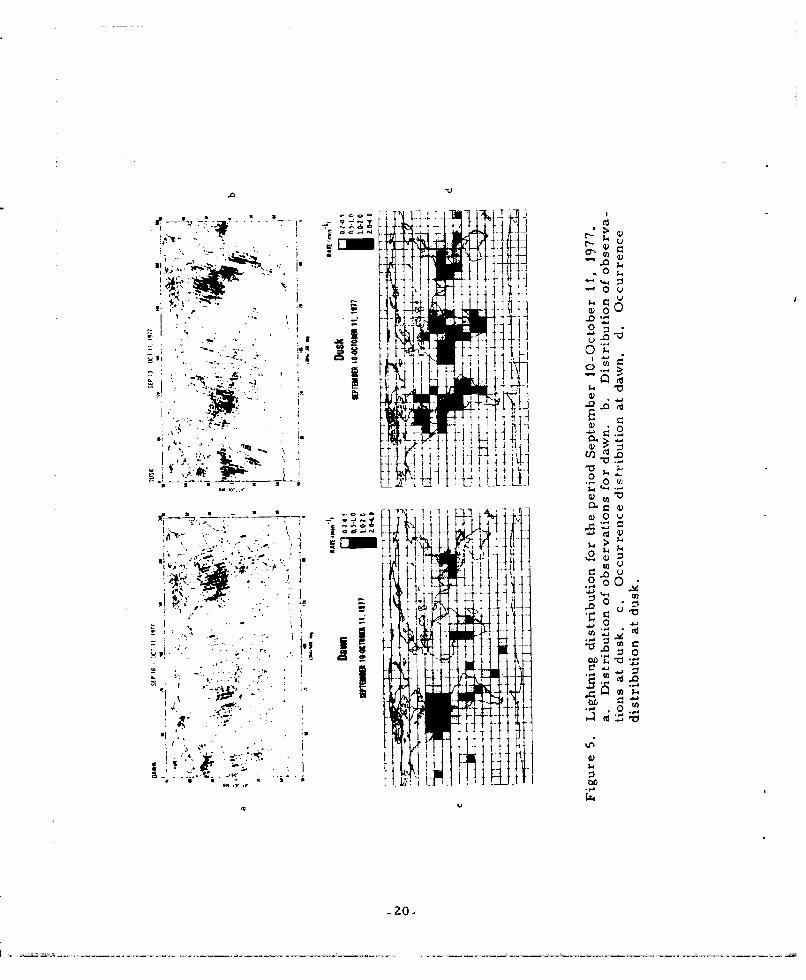
time that the subpoint was within that region. Figures 4-6 show the
resulting distributions for dawn and dusk time frames for 2 Auguat - Ir
September, I1 September - 11 October 1977, and 6 November - 2 Dece
1977. Nominal sampling period for each of the 100 x 100 bins is 30 minutes.
DISCUSSION
At present, the most authoritative work on lightning activity distri-
bution comes from the World Meteorological Organization (WMO) tabulations
of thunderstorm days (WMO Report TP. 21, 1956). These tabulations are
based on weather station reports of thunderstorms, and the accuracy of
these data are limited by the number and locations of ground observation
stations. A limited series of satellite observations from the OSO 2 and
OSO 5 satellite have also provided distributions of night-time lightning
activity within the latitude bands of 1-35 0 (Vorpahl, Sparrow and Ney, 1970,
and Sparrow and Ney, 1971).
- 18-
F
0 -u.5 - - C CCC I V
~ ~ -. I
p..' L-1F1.- 4Ca'
1.411< .4
I'tA(S 4)
~ = Lj .gaLJ CIon
*1 '..s''~b~ '1 .4.4
~a. I I
-a I . III
I .1-
U
S ~ CC .fl! -
- C w
Vt C til/) K]
1K 111>1 .2 ~
.- 4 ~ a..
a! o
-~ V I 111 44'-
9 Ik~ I'
I .. i.jt
WI
ILl liii II.,'.,'I,
'1
U
A9-
0 u
0 - o
XIg
LiLT(.4 0- u~
Al a
I0 &
a~ Ii to$.*
-20-.
II
~*~it I I)
It el0-4 0
* ~ ~ 2 13.00
I- .~ .I -
*0 3
*~( to u ~ 0 0
%. I t± . 0...
a1H
The lightning data now available from the PBE experiment allows
completely global, unbiased distributions of lightning activity which can
be grouped by time (dawn/dusk) and month or season. The first of these
distributions are shown in Figures 4-6. Some general trends can be
deduced from these results. As would be expected, a definite diurnal
trend is displayed over the land masses, with higher lightning activity
at dusk as opposed to dawn. The reverse trend is noted over the oceans,
with higher activity at dawn. Ocean activity is considerable lower than
that over land, but there are a few pockets of significant lightning activity
(0.5 - 1.0 per minute) over the oceans. During the Aug-Sep time frame,
one such area is off the west coast of South America centered at 10"S,
100'W, and another is in the South Pacific off the east coast of Australia,
around 30 0 S, 170 0 E. The North Atlantic also has some regions with high
level lightning activity. During Sep-Oct, active regions appear in the dawn
distribution in the South Pacific (in the vicinity of Tahiti), in the North
Pacific (in the vicinity of Hawaii) and in the South Atlantic (Falkland
Islands). Most oceanic lightning activity in the dusk distribution is
-22-
probably associated with land mass weather, but an interesting region of
high activity exists to the east of New Guinea.
The regions of highest lightning activity are easily identified in the
distributiotns, and correspond well with those areas classically regarded
as lightning capitols of the world. The August - September distributions
show the following high activity areas: (a) Southeast United States, Gulf
of Mexico, and Central America (bounded roughly by latitude 10' - 400 N,
longitude 800 - 110* W), (b) Central Africa (Zaire and the Congo basin),
(c) Southeast Asia (Malaysia, Sumatra, Borneo), (d) India and Southern
China. Note that there is little diurnal variation for the Southeast U. S.,
Gulf of Mexico region, probably because the warm Gulf waters can maintain
through the night thunderstorm activity initiated over land regions during
the day.
A seasonal change is seen in the September - October distributions.
Southern hemisphere activity becomes more prominent, and the strong
Gulf of Mexico dusk activity vanishes. High activity regions are: (a) Central
United States, (b) Florida and Gulf of Mexico at dawn, (c) Central America,
(d) North and Central South America (Columbia, Venezuela, Brazil, Uruguay),
(e) Africa (Zaire, Congo Basin, Mozambique, South Africa), and (f) South-
east Asia (Malaysia, Sumatra, Borneo, Thailand, Cambodia and South
Viet Nam).
The seasonal shift of lightning activity from the Northern hemisphere
to the southern hemisphere during the period August to November follows
the shift of the cumulus cloud distribution from also the northern to the
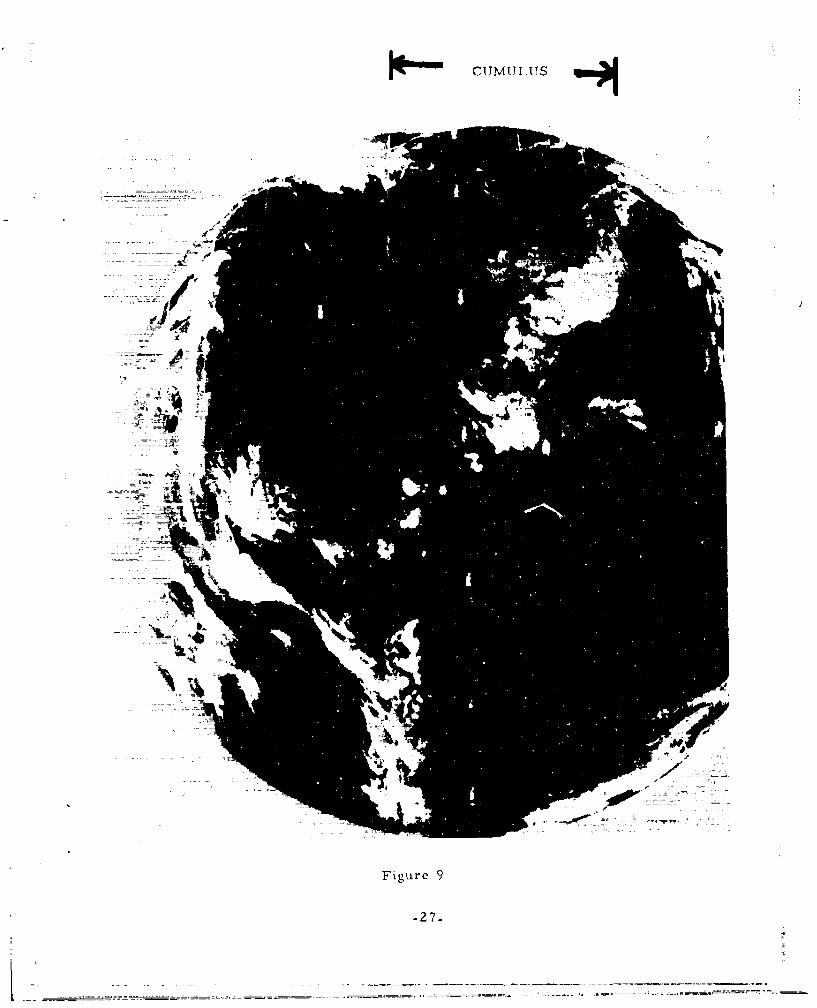
southern hemisphere. Figures 7, 8, 9 show the progression of the cumulus
_23-
C
0
0 :
-24-4
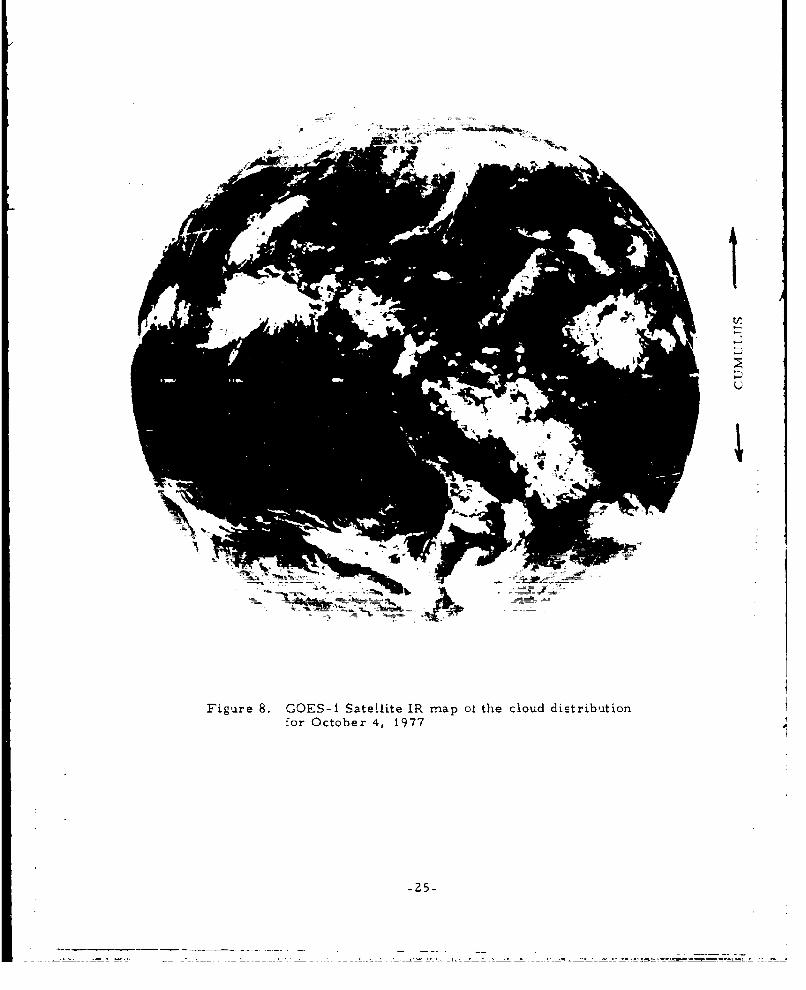
Figure 8. GOES-i Satellite IR map ot the cloud distributionfor October 4, 1977
-25-
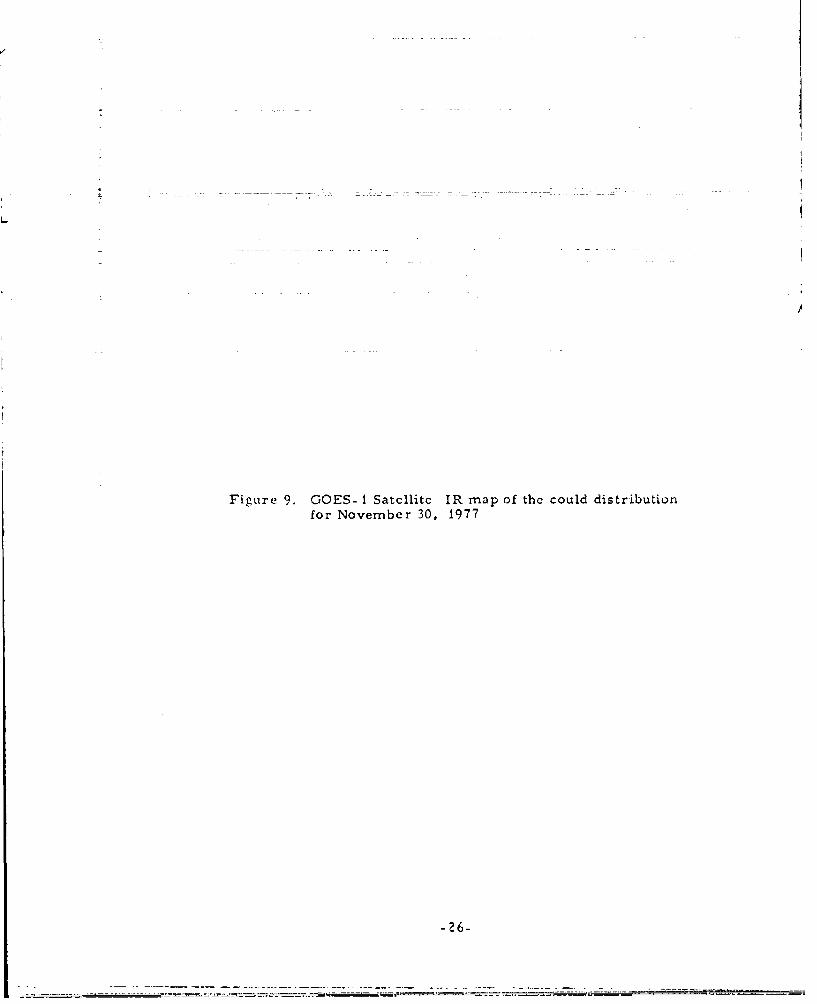
Figure 9. GOES- I Satellite IR map of the could distributionfor November 30, 1977
CUMULUS
_-A7
Figure 9
-27-
clouds (identified by the puffy white spots on the GEOS satellite IR photo-
graphs) as they move south. The photos also show clearly the intertropical
convergence zone atthe equator which usually contains some lightning
activity and also the land domination of the cumulus distribution. As
one would suspect from ground observations, lightning correlates well A
with the formation of cumulus clouds.
The average count rate per minute (Table 3) does not seem to change
appreciably between dawn and dusk times, nor over the months analyzed to
date. The projection of the sensor field of view on the ground is a circle
of about 780 Km radius; the sensor therefore observes a surface area of
6 21.9 x 10⁶ Km . The average lightning rate per unit surface area is there-
fore about I x 10 7 Km " rnin "1 . As mentioned earlier, we estimate that
the PBE sensor detects only about 8% of all lightning flashes occurring
within its viewing area. From these data, then, we estimate that the total
lightning flash rate averages about 1. 3 X 10⁻⁶ Krn 2 min -. The total
worldwide lightning flash rate is then on the order of 600 min- I or on the
order of 10 per seconA. This rate is somewhat lower than the traditionally
accepted (and largely untested) value of 100 sec- (Brooks, 1925).
However, the above estimate of global lightning activity is somewhat
misleading, because the satellite passes over many areas of little or no
lightning activity. But if the occurrence rates for all of the 10* x 10* bins
are summed over the world, only the active areas contribute to this global
rate. Table 3 gives the summed rates for the study periods.
I
-28-
- - - - - .- - . . . . . . . --.- ___ ___
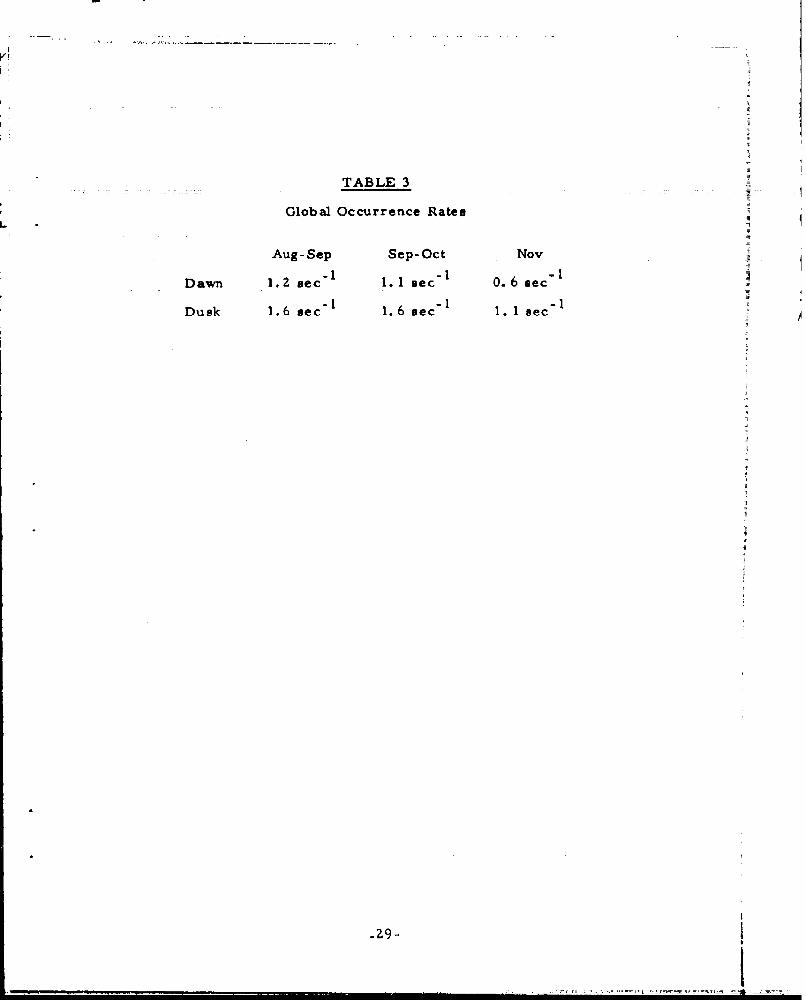
TABLE 3
Global Occurrence Rates
Aug-Sep Sep-Oct Nov
Dawn 1.2 sec-i 1. 1 sec 0. 6 sec
Dusk 1. 6 sec' 1.6 sec 1. 1 sec-
-29-
I ____
Now if the PBE-2 detector observes only 8% of the lightning flashes
in its field of view and one allows another factor of 5-10 for cloud attenua--1
tion, the -2 sec satellite rate agrees quantitatively with the mythical-1
100 sec global rate. However, such calculations are purely speculative
until accurate ground-satellite coordinated observations now in progress
can be evaluated.
APPLICATIONS
Lightning is a principal contributor to atnospheric radio noise.
CCIR (1963) has published contour maps of the global distribution of noise
with season and local time. Most of the observing stations for the study
were located on continental land masses and thus leave open the question
of how good the estimates are over the oceans. The satellite data can
explore this question in detail.
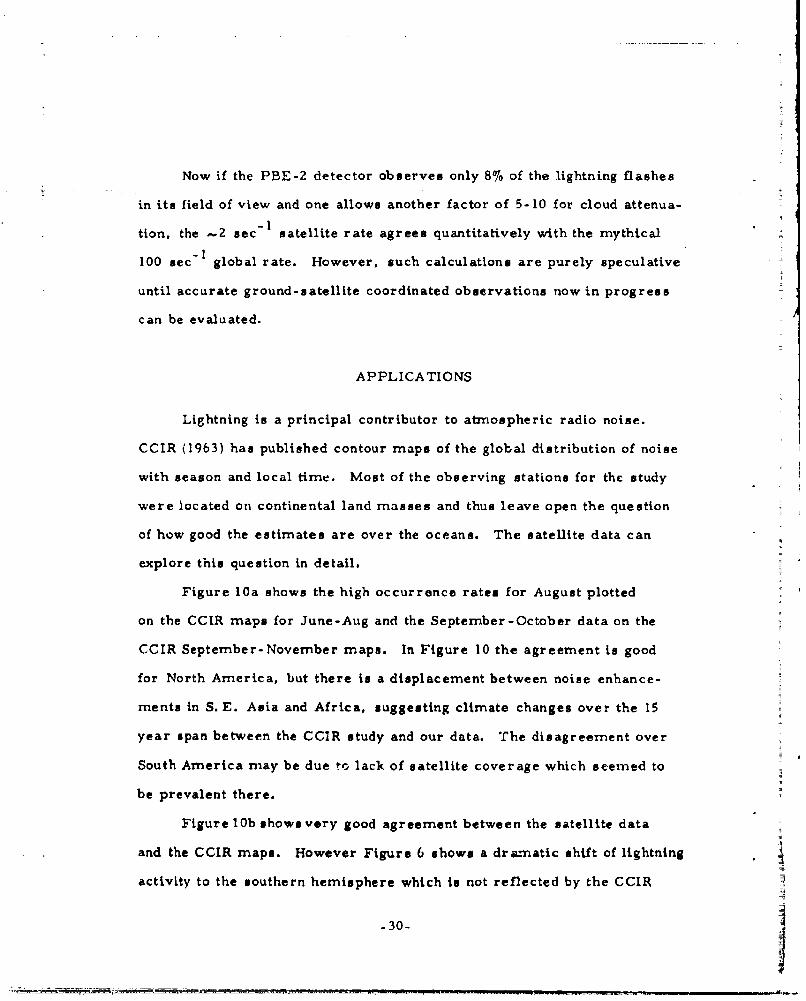
Figure 10a shows the high occurrence rates for August plotted
on the CCIR maps for June-Aug and the September-October data on the
CCIR September-November maps. In Figure 10 the agreement is good
for North America, but there is a displacement between noise enhance-
ments in S. E. Asia and Africa, suggesting climate changes over the 15
year span between the CCIR study and our data. The disagreement over
South America may be due to lack of satellite coverage which seemed to
be prevalent there.
Figure lOb shows very good agreement between the satellite data
and the CCIR maps. However Figure 6 shows a dramatic shift of lightning
activIty to the southern hemisphere which i not reflected by the CCIR
-30-
Ll k
ca I C.)~
cax a)(
b~fAX\iALJA~~~ - >
L. 0
:AXALL IL
0b V) -4j -
n
- 2=2
. 0 : Sb
v i ~jj
C1431o
_ L_ ___'~~
maps. Thus one would be in error if the CCIR map for September-
November were used for November noise predictions. Thus we come to
a suggested change for a revision of the CCIR maps: that November be
included with December and that the equinox period of September-
November be shortened to September-October. There appears to be no
justification for increasing the number of observing stations since most
of the activity is over land.
CONCLUSIONS
We have shown an initial look at the global distribution of lightning
and its seasonal varation. There have been some unexpected results
such as the dramatic shift of activity with season, and the ocean activity
at dawn. With more study and comparison with ground data, we hope to
provide experimenters and theoretical investigators with basic models of
lightning occurrence that will enable them to attack new problems in atmo-
spheric and solar -terrestrial relations.
-32-
REFERENCES
Berger, K. , Novel observations on lightning discharges, J. FranklinL
Institute, 283, 478, 1967.
Brooks, C. E. P., The distribution of thunderstorms over the globe,
Geophysical Memoirs, 24, 147, 1925.
CCIR Report #332, "World distribution and characteristics of atmospheric
radio noise," ITU, Geneva, 1964.
Edgar, B.C., and Turman, B. N., Satellite optical sensing of lightning
activity over the S. E. United States, presented at the Fall Meeting
of the American Geophysical Union, San Francisco, California,
December 1977.
Sparrow. J. G., and E. P. Ney, Lightning observations by satellite,
Nature, 232, 540, 1971.
Turman, B. N., Analysis of lightning data from the DMSP satellite,
Proceedings of the Seventh Conference on Aerospace and Aeronautical
Meteorology and Symposium on Remote Sensing from Satellites, p. 188,
American Meteorological Society, Boston, Mass. 1976.
Uman, M. A., Lightning, McGraw-Hill, N.Y., 1969.
Vorpahl, J., J. G. Sparrow, E. P. Ney, Satellite Observations of Lightning,
Science, 169, 860, 1970.
World Meteorological Organization, Report TP. 21, World distribution of
thunderstorm days, Part II, Geneva, 1956.
-33-
LABORATORY OPERATIONS
The Laboratory Operations of The Atrospace Corporatiot. to conducting
experimental and theoretical investigations necessary for the evaluation and
application of scientific advances to new military concepts and systemns. Ver-
-rzzzflailtyand flexibility have been developed to a high degree by the laboratory ~personnel In dealing with the many problems encounte red in the nation's rapidly
developing space and missile systems. Expertise in the latest scientific devel-
opments is vital to the accomplishment of task@ related to these problems. The
laboratories that contribute to this research are:
4pjyrcsj *L borator Launch and reentry aerodynamic#, heat trants-fer, ri rypsi, l~iI kinetics, structural mechanics, flight dynamics,atmospheric pollutiont. and high-power gas lasers.
Crn an d Physics Laborator - Atmospheric reactions and atmos-pheric optlic ekc rcVeactions Inijpflted atmospheres, chemical reactionsof excited species in rocket plumes, chemical thermodynamics, plasma and
* laser-Induced reactions, laser chenmistry, propulsion chemiAstry, space vacuumand radiation effects on mater!4ls. lubric&Uon and surface phenomena, photo-
- ... -. sensitive materials and sensors, high precision laser ranging, and the appi-.cation of physics and chemistry to problems of law enforcement and biomedicine.
Electronics Research Laboratory: Electromagnetic theory, devices, and-propagation phenomna, includn plasma alectromagnetics; quantum electronics,-lasers. and electro-optics; communication sciences, applied electronic&, semi.conducting, superconducting, and crystal device physics, optical end acoustical -
... maging: atmospheric pollution; mnillimeter wave and far-infrared technology,
Materials Sciences Laorator: Development of new materials; metalmatrix composites and ne om f carbon; test and evaluation of graphiteand ceramics in reentry; spacecraft materials and elertronic components innuclear weapons environment; application of fracture mechanics to stress cor---rosion and fatigue-induced fractures in structural metals.
Stpace Scinces boratory' Atmospheric and Ionospheric physics, radia-tion frm th toshr, density and composition of the atmosphere, auroraeand airglow; magnetoopheric physics, cosmic rays, generation and propagationof plasma waves in the magnetosphere; solar physicsa, studies of solar magneticfields; space astronomy, x-ray astronomy; the effects of ruclear eivlosions,magnetic storms, and solar activity on the earth's atmosphere, ionosphere. andmagnetosphere; the effects of optical, electromagnetic, and particulate radia-tions in space on sPACe systems.
THE AEROSPACE CORiPORLATIONEl Segundo, California