Embed Size (px)
Citation preview
Global Investment HouseA success story
May 2008

2
Company overview
3
A leading GCC and MENA player
Asset Management Principal Investments & Treasury BrokerageReal Estate
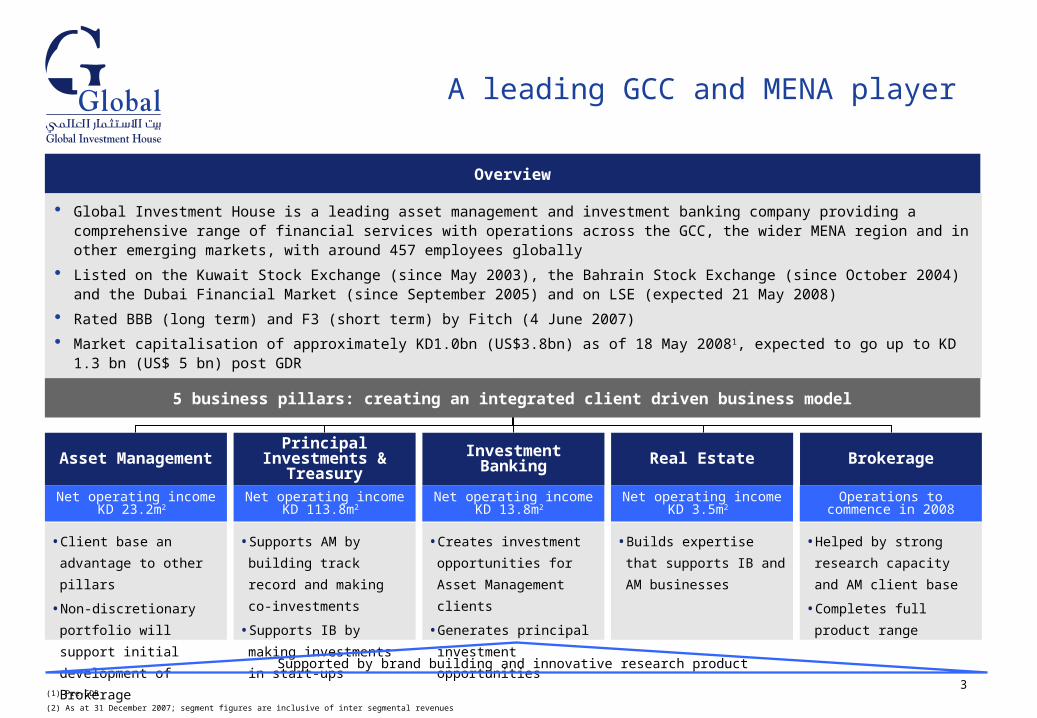
Global Investment House is a leading asset management and investment banking company providing a comprehensive range of financial services with operations across the GCC, the wider MENA region and in other emerging markets, with around 457 employees globally
Listed on the Kuwait Stock Exchange (since May 2003), the Bahrain Stock Exchange (since October 2004) and the Dubai Financial Market (since September 2005) and on LSE (expected 21 May 2008)
Rated BBB (long term) and F3 (short term) by Fitch (4 June 2007)
Market capitalisation of approximately KD1.0bn (US$3.8bn) as of 18 May 20081, expected to go up to KD 1.3 bn (US$ 5 bn) post GDR
Overview
Investment Banking
5 business pillars: creating an integrated client driven business model
• Client base an advantage
to other pillars
• Non-discretionary portfolio
will support initial
development of Brokerage
• Supports AM by building
track record and making
co-investments
• Supports IB by making
investments in start-ups
• Helped by strong research
capacity and AM client
base
• Completes full product
range
• Builds expertise that
supports IB and AM
businesses
• Creates investment
opportunities for Asset
Management clients
• Generates principal
investment opportunities
Supported by brand building and innovative research product
(1) Pre-GDR
(2) As at 31 December 2007; segment figures are inclusive of inter segmental revenues
Net operating income KD 23.2m2
Net operating income KD 113.8m2
Operations to commence in 2008
Net operating income KD 3.5m2
Net operating income KD 13.8m2
4
(1) As at 31 December 2007
(2) Kuwait Stock Exchange
(3) Also has a presence in Pakistan, India and Hong Kong
(4) As at 31 March 2008
History of strong growth
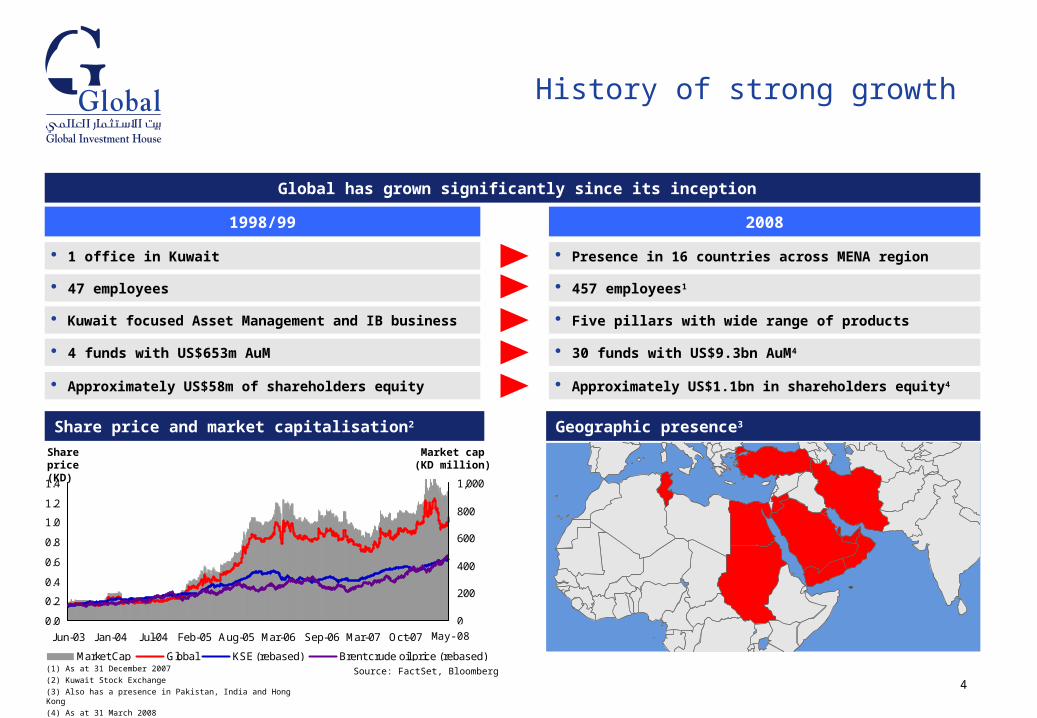
Global has grown significantly since its inception
Geographic presence3
1998/99 2008
1 office in Kuwait Presence in 16 countries across MENA region
47 employees 457 employees1
Kuwait focused Asset Management and IB business Five pillars with wide range of products
4 funds with US$653m AuM 30 funds with US$9.3bn AuM4
Approximately US$58m of shareholders equity Approximately US$1.1bn in shareholders equity4
Source: FactSet, Bloomberg
Share price and market capitalisation2
0.0
0.2
0.4
0.6
0.8
1.0
1.2
1.4
Jun-03 Jan-04 Jul-04 Feb-05 Aug-05 Mar-06 Sep-06 Mar-07 Oct-07 Apr-08
0
200
400
600
800
1,000
Market Cap Global KSE (rebased) Brent crude oil price (rebased)
Share price (KD)
Market cap (KD million)
May-08
5
Strategy
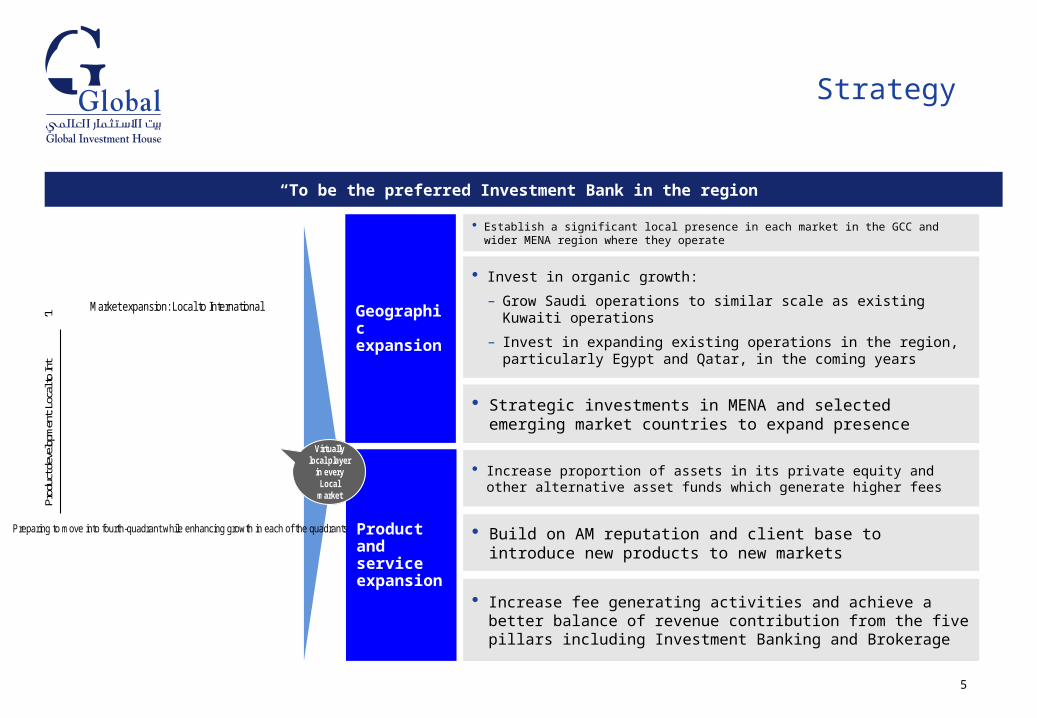
“To be the preferred Investment Bank in the region”
Product and service expansion
Increase proportion of assets in its private equity and other alternative asset funds which generate higher fees
Geographic expansion
Establish a significant local presence in each market in the GCC and wider MENA region where they operate
Invest in organic growth:
– Grow Saudi operations to similar scale as existing Kuwaiti operations
– Invest in expanding existing operations in the region, particularly Egypt and Qatar, in the coming years
Strategic investments in MENA and selected emerging market countries to expand presence
Build on AM reputation and client base to introduce new products to new markets
Increase fee generating activities and achieve a better balance of revenue contribution from the five pillars including Investment Banking and Brokerage
Country-specific product
developed and placed in the same country
GCC and International
productsin Kuwait market
Regional and International
productsin GCC market
Kuwaiti and International
products in Kuwait market
Virtually local player
in every Local
market
Market expansion: Local to International
Prod
uct d
evel
opm
ent:
Loca
l to
Int
’l
Preparing to move into fourth-quadrant while enhancing growth in each of the quadrants
6
Capital increase
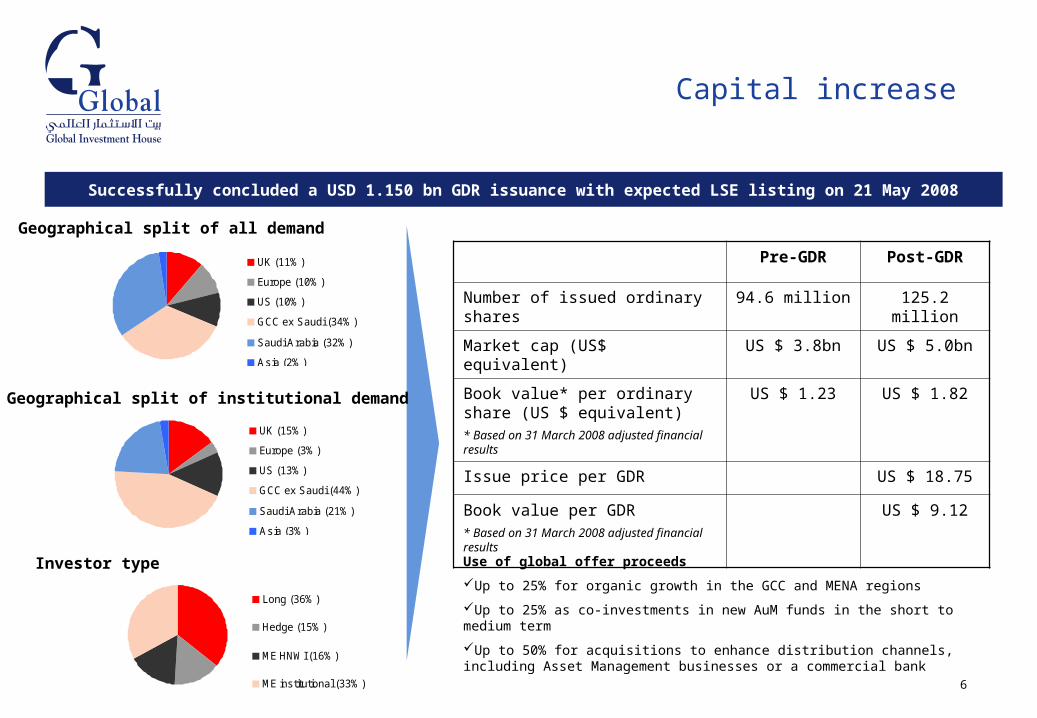
Successfully concluded a USD 1.150 bn GDR issuance with expected LSE listing on 21 May 2008
Geographical split of all demand
Geographical split of institutional demand
Investor type
UK (11%)
Europe (10%)
US (10%)
GCC ex Saudi (34%)
Saudi Arabia (32%)
Asia (2%)
UK (15%)
Europe (3%)
US (13%)
GCC ex Saudi (44%)
Saudi Arabia (21%)
Asia (3%)
Long (36%)
Hedge (15%)
ME HNWI (16%)
ME institutional (33%)
Pre-GDR Post-GDR
Number of issued ordinary shares 94.6 million 125.2 million
Market cap (US$ equivalent) US $ 3.8bn US $ 5.0bn
Book value* per ordinary share (US $ equivalent)* Based on 31 March 2008 adjusted financial results
US $ 1.23 US $ 1.82
Issue price per GDR US $ 18.75
Book value per GDR* Based on 31 March 2008 adjusted financial results
US $ 9.12
Use of global offer proceeds
Up to 25% for organic growth in the GCC and MENA regions
Up to 25% as co-investments in new AuM funds in the short to medium term
Up to 50% for acquisitions to enhance distribution channels, including Asset Management businesses or a commercial bank
7
Economic environment
8
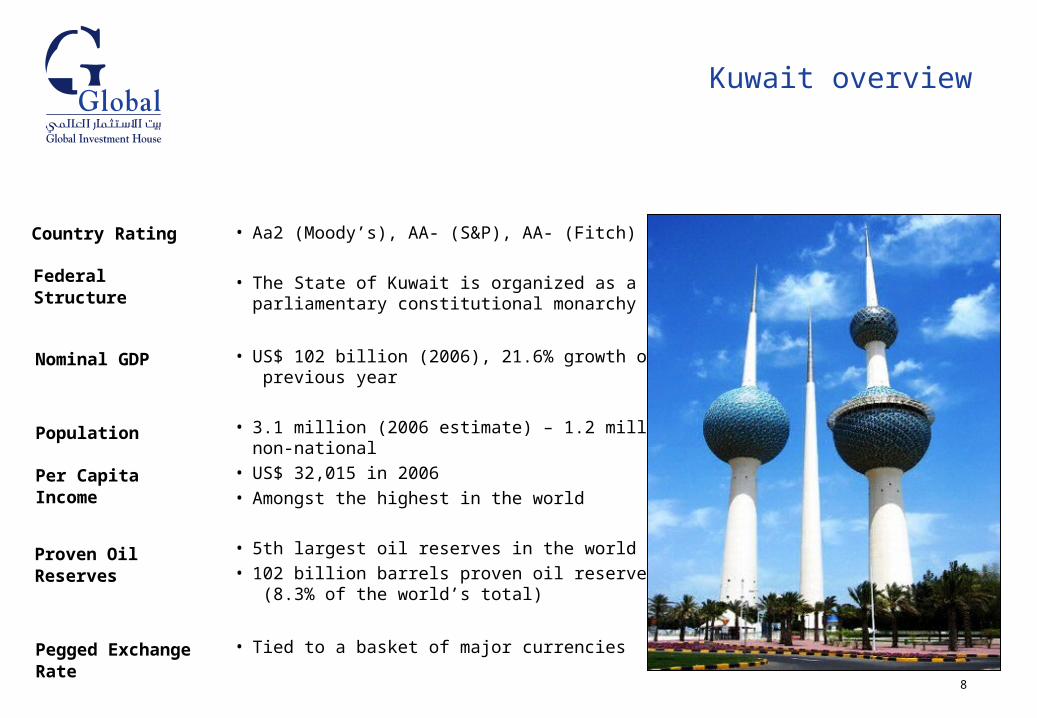
Kuwait overview
Country Rating
Federal Structure
Nominal GDP
Population
Per Capita Income
Proven Oil Reserves
Pegged Exchange Rate
• Aa2 (Moody’s), AA- (S&P), AA- (Fitch)
• The State of Kuwait is organized as a parliamentary constitutional monarchy
• US$ 102 billion (2006), 21.6% growth over previous year
• 3.1 million (2006 estimate) – 1.2 million non-national
• US$ 32,015 in 2006• Amongst the highest in the world
• 5th largest oil reserves in the world• 102 billion barrels proven oil reserves
(8.3% of the world’s total)
• Tied to a basket of major currencies
9
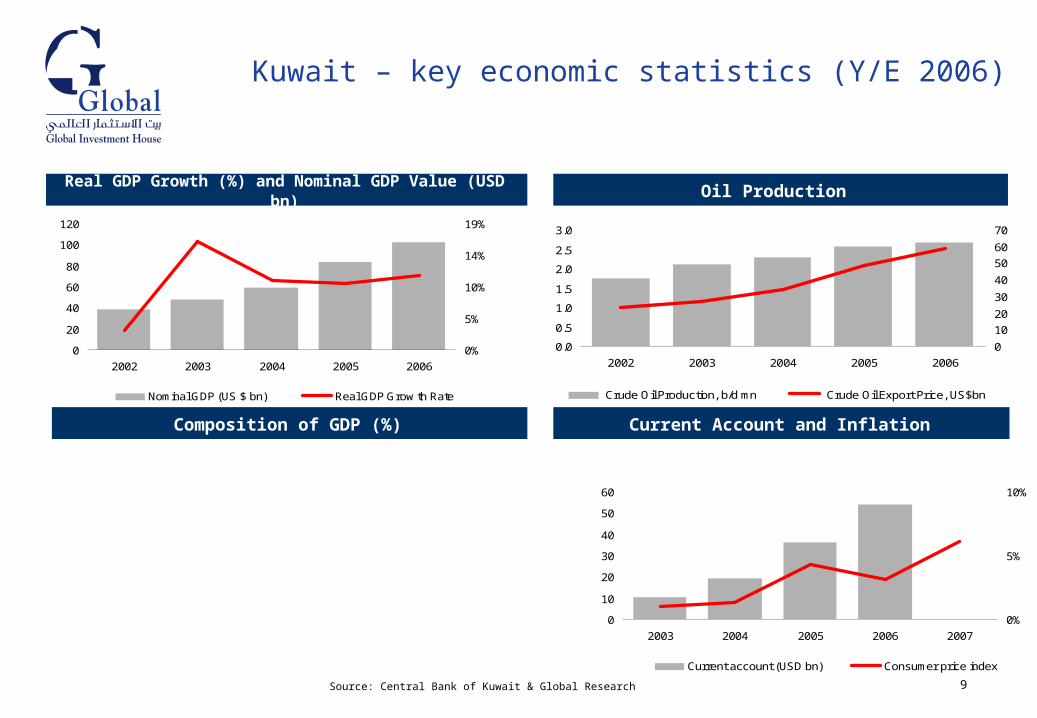
Kuwait – key economic statistics (Y/E 2006)
Oil Production Real GDP Growth (%) and Nominal GDP Value (USD bn)
Composition of GDP (%) Current Account and Inflation
0
20
40
60
80
100
120
2002 2003 2004 2005 2006
0%
5%
10%
14%
19%
Nominal GDP (US $ bn) Real GDP Grow th Rate
0.0
0.5
1.0
1.5
2.0
2.5
3.0
2002 2003 2004 2005 2006
0
10
20
30
40
50
60
70
Crude Oil Production, b/d mn Crude Oil Export Price, US$bn
Source: Central Bank of Kuwait & Global Research
0
10
20
30
40
50
60
2003 2004 2005 2006 2007
0%
5%
10%
Current account (USD bn) Consumer price index
10
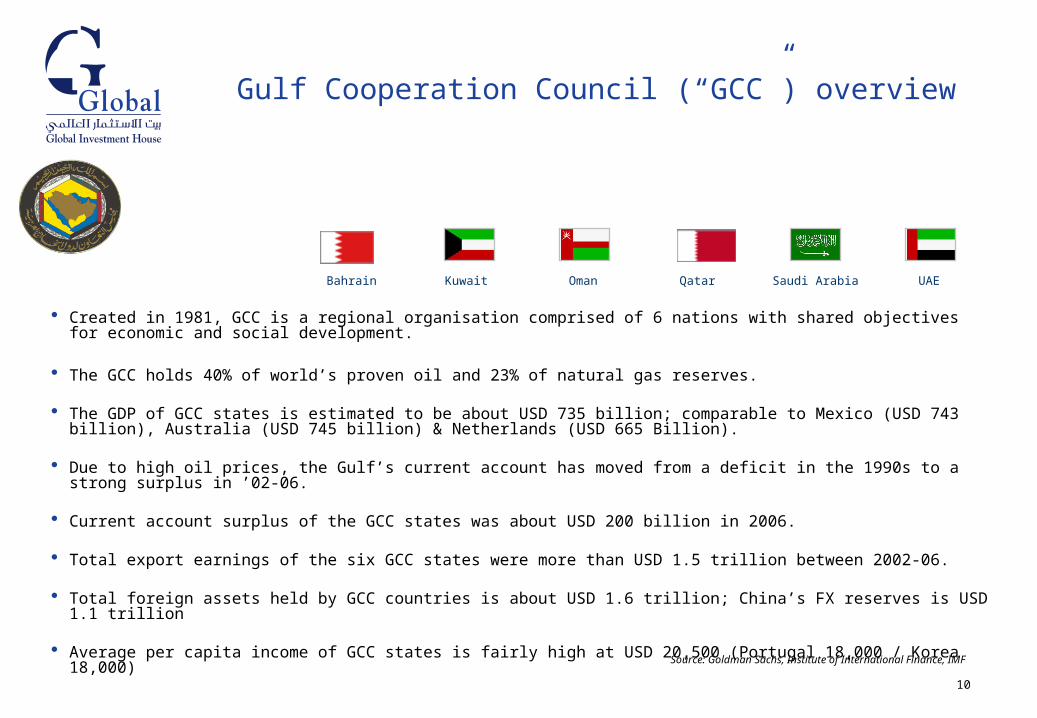
Gulf Cooperation Council (“GCC”) overview
Created in 1981, GCC is a regional organisation comprised of 6 nations with shared objectives for economic and social development.
The GCC holds 40% of world’s proven oil and 23% of natural gas reserves.
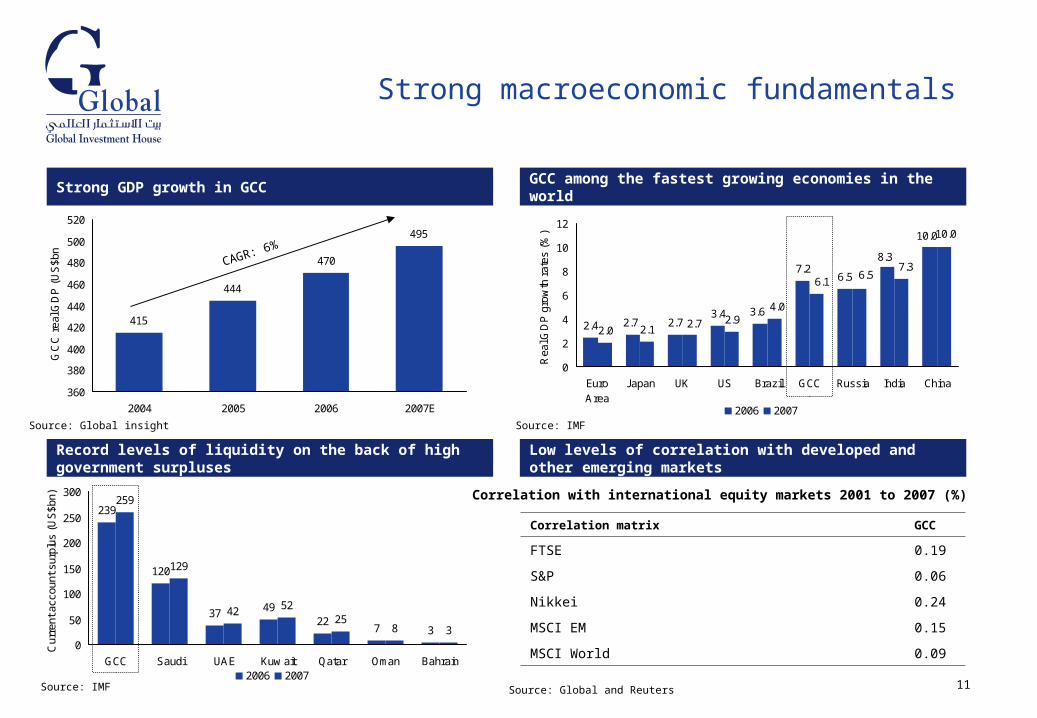
The GDP of GCC states is estimated to be about USD 735 billion; comparable to Mexico (USD 743 billion), Australia (USD 745 billion) & Netherlands (USD 665 Billion).
Due to high oil prices, the Gulf’s current account has moved from a deficit in the 1990s to a strong surplus in ’02-06.
Current account surplus of the GCC states was about USD 200 billion in 2006.
Total export earnings of the six GCC states were more than USD 1.5 trillion between 2002-06.
Total foreign assets held by GCC countries is about USD 1.6 trillion; China’s FX reserves is USD 1.1 trillion
Average per capita income of GCC states is fairly high at USD 20,500 (Portugal 18,000 / Korea 18,000)
Source: Goldman Sachs, Institute of International Finance, IMF
Bahrain Kuwait Oman Qatar Saudi Arabia UAE
11
415
444
470
495
360
380
400
420
440
460
480
500
520
2004 2005 2006 2007E
GC
C r
eal G
DP
(U
S$b
n)
239
120
37 4922
7 3
259
129
42 5225
8 30
50
100
150
200
250
300
GCC Saudi UAE Kuw ait Qatar Oman Bahrain
Cur
rent
acc
ount
sur
plus
(U
S$b
n)
2006 2007
2.4 2.73.4
7.26.5
2.0 2.12.9
3.62.7
8.3
10.0
7.36.5
6.1
4.0
2.7
10.0
0
2
4
6
8
10
12
EuroArea
Japan UK US Brazil GCC Russia India China
Rea
l GD
P g
row
th r
ates
(%
)
2006 2007
Strong macroeconomic fundamentals
Strong GDP growth in GCC
Record levels of liquidity on the back of high government surpluses
GCC among the fastest growing economies in the world
Low levels of correlation with developed and other emerging markets
Source: Global insight Source: IMF
Source: IMF
CAGR: 6%
Correlation matrix GCC
FTSE 0.19
S&P 0.06
Nikkei 0.24
MSCI EM 0.15
MSCI World 0.09
Correlation with international equity markets 2001 to 2007 (%)
Source: Global and Reuters
12
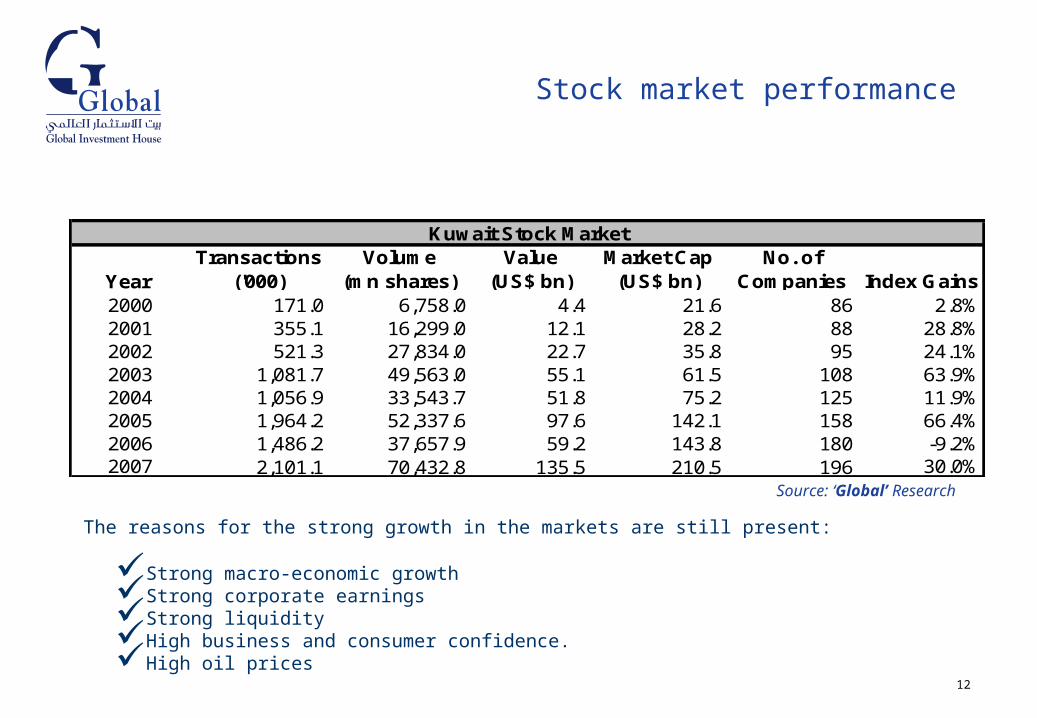
The reasons for the strong growth in the markets are still present:
Strong macro-economic growthStrong corporate earningsStrong liquidityHigh business and consumer confidence.High oil prices
Source: ‘Global’ Research
Year Transactions
('000)Volume
(mn shares)Value
(US$ bn)Market Cap
(US$ bn)No. of
Companies Index Gains2000 171.0 6,758.0 4.4 21.6 86 2.8%2001 355.1 16,299.0 12.1 28.2 88 28.8%2002 521.3 27,834.0 22.7 35.8 95 24.1%2003 1,081.7 49,563.0 55.1 61.5 108 63.9%2004 1,056.9 33,543.7 51.8 75.2 125 11.9%2005 1,964.2 52,337.6 97.6 142.1 158 66.4%2006 1,486.2 37,657.9 59.2 143.8 180 -9.2%2007 2,101.1 70,432.8 135.5 210.5 196 30.0%
Kuwait Stock Market
Stock market performance
13
Investment highlights
14
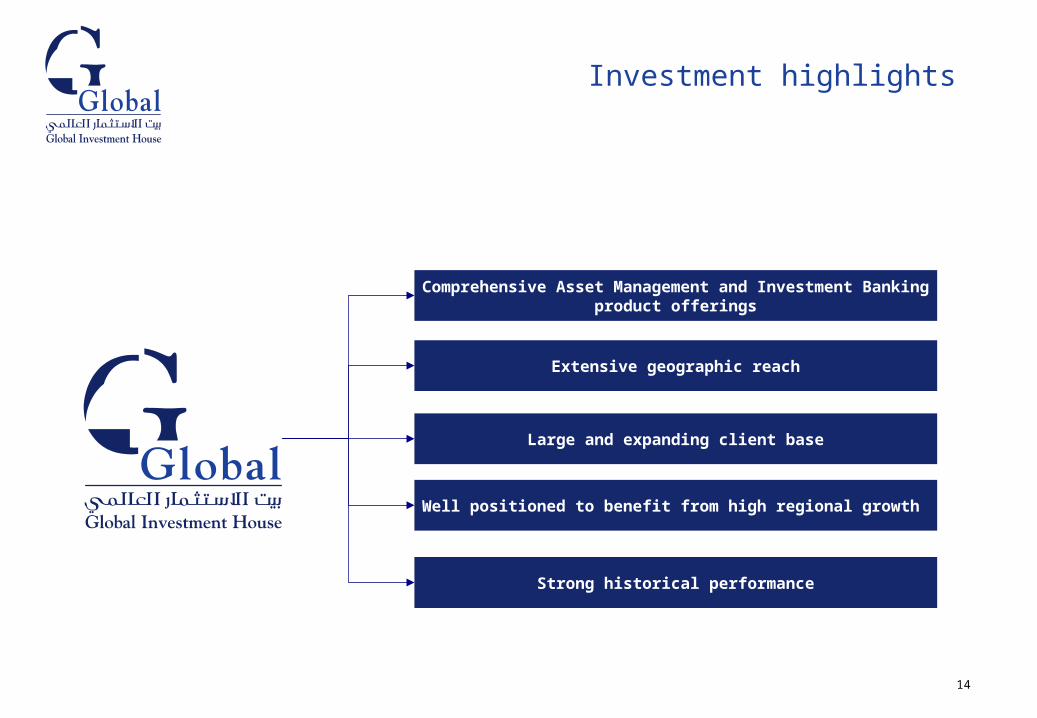
Investment highlights
Well positioned to benefit from high regional growth
Strong historical performance
Large and expanding client base
Comprehensive Asset Management and Investment Banking product offerings
Extensive geographic reach
15
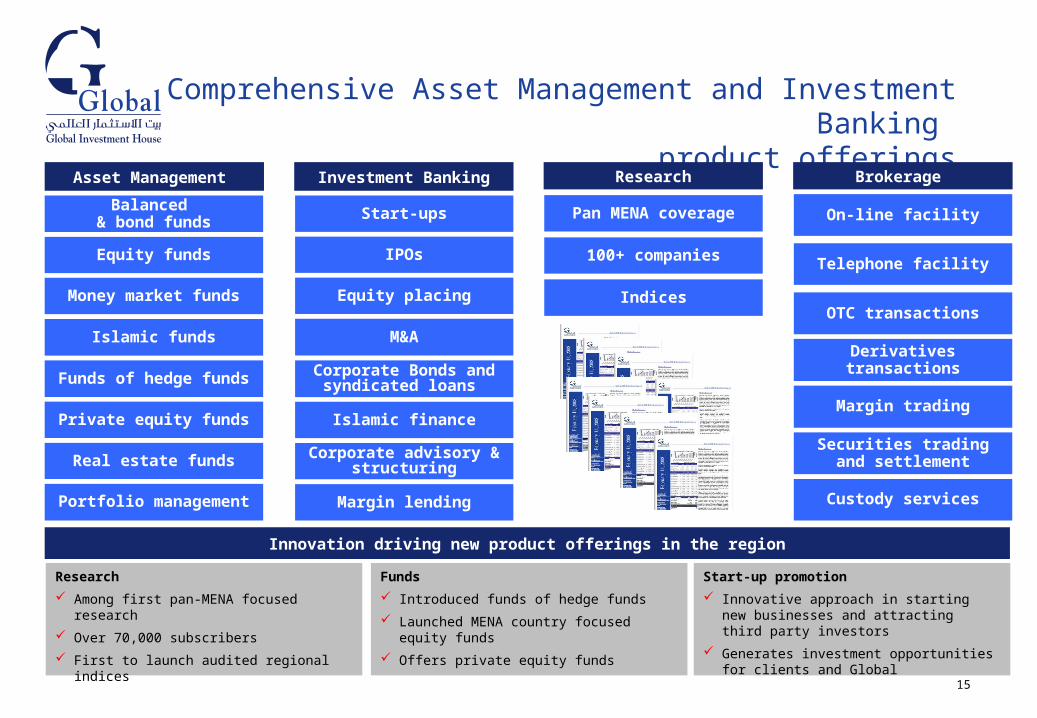
Comprehensive Asset Management and Investment Banking product offerings
Balanced & bond funds
Equity funds
Money market funds
Islamic funds
Funds of hedge funds
Private equity funds
Real estate funds
Portfolio management
Asset Management Investment Banking
Start-ups
IPOs
Equity placing
M&A
Corporate Bonds and syndicated loans
Islamic finance
Corporate advisory & structuring
Margin lending
Innovation driving new product offerings in the region
Research
Pan MENA coverage
100+ companies
Indices
Brokerage
On-line facility
Telephone facility
OTC transactions
Derivatives transactions
Margin trading
Securities trading and settlement
Custody services
Research
Among first pan-MENA focused research
Over 70,000 subscribers
First to launch audited regional indices
Funds
Introduced funds of hedge funds
Launched MENA country focused equity funds
Offers private equity funds
Start-up promotion
Innovative approach in starting new businesses and attracting third party investors
Generates investment opportunities for clients and Global
16
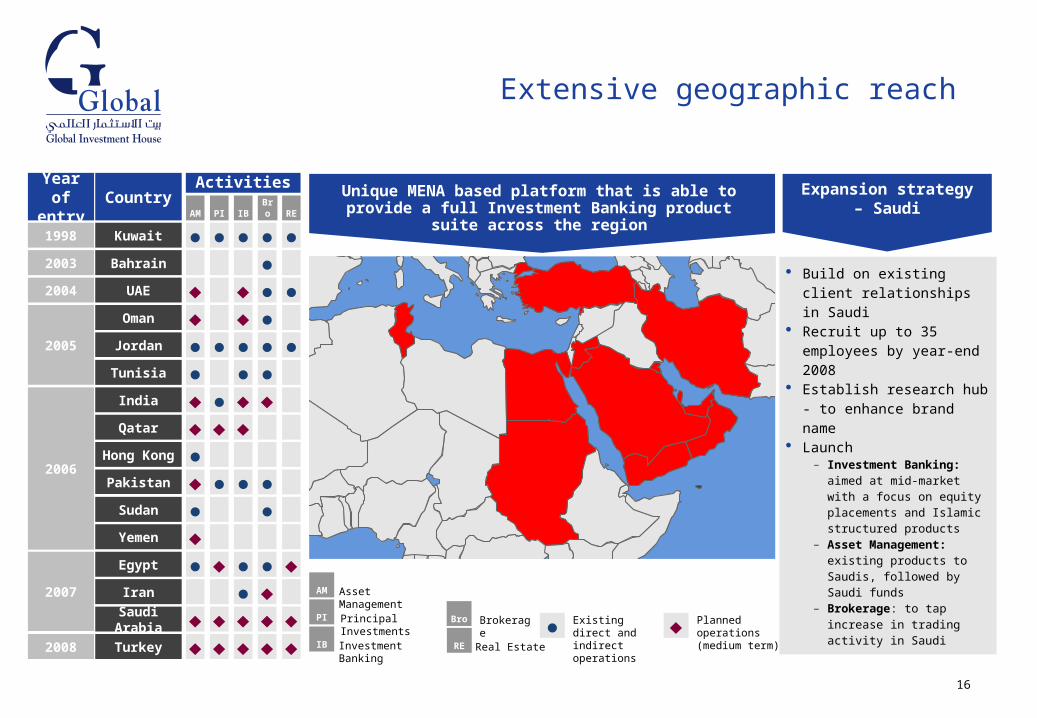
Extensive geographic reach
Unique MENA based platform that is able to provide a full Investment Banking product suite across the region
Asset ManagementAM
Principal InvestmentsPI
Investment BankingIB
BrokerageBro
RE Real Estate
● Existing direct and indirect operations
Planned operations(medium term)Turkey
Country
Kuwait
Hong Kong
Oman
Qatar
Saudi Arabia
UAE
Egypt
Jordan
Bahrain
Tunisia
Iran
Pakistan
Yemen
Sudan
India
2008
Year of entry
1998
2005
2004
2007
2003
2006
Build on existing client relationships in Saudi
Recruit up to 35 employees by year-end 2008
Establish research hub - to enhance brand name
Launch– Investment Banking:
aimed at mid-market with a focus on equity placements and Islamic structured products
– Asset Management: existing products to Saudis, followed by Saudi funds
– Brokerage: to tap increase in trading activity in Saudi
Activities
AM PI IBBro RE
● ● ● ● ●
●
●
● ●
● ● ●
● ● ● ● ●
●
● ● ●
●
● ● ●
● ●
●
Expansion strategy – Saudi
17
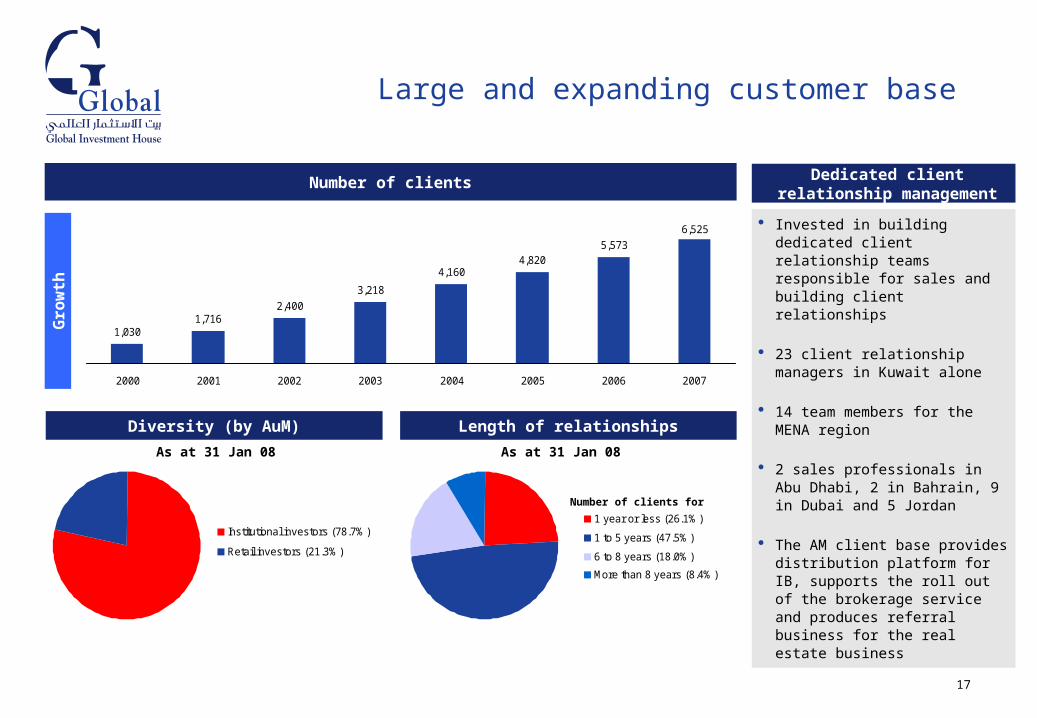
Large and expanding customer base
1,0301,716
2,400
3,218
4,1604,820
5,573
6,525
2000 2001 2002 2003 2004 2005 2006 2007
Number of clients
Gro
wth
Diversity (by AuM) Length of relationships
Institutional investors (78.7%)
Retail investors (21.3%)
As at 31 Jan 08 As at 31 Jan 08
Dedicated client relationship management
Invested in building dedicated client relationship teams responsible for sales and building client relationships
23 client relationship managers in Kuwait alone
14 team members for the MENA region
2 sales professionals in Abu Dhabi, 2 in Bahrain, 9 in Dubai and 5 Jordan
The AM client base provides distribution platform for IB, supports the roll out of the brokerage service and produces referral business for the real estate business
1 year or less (26.1%)
1 to 5 years (47.5%)
6 to 8 years (18.0%)
More than 8 years (8.4%)
Number of clients for
18
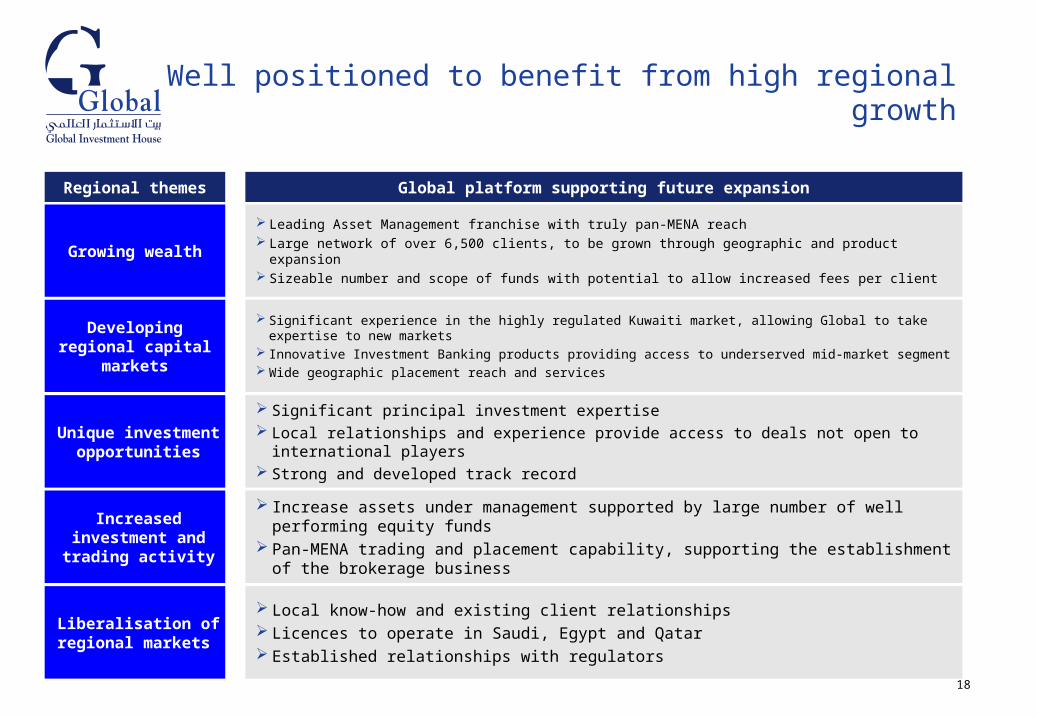
Regional themes
Growing wealth
Global platform supporting future expansion
Leading Asset Management franchise with truly pan-MENA reach Large network of over 6,500 clients, to be grown through geographic and product expansion Sizeable number and scope of funds with potential to allow increased fees per client
Developing regional capital markets
Significant experience in the highly regulated Kuwaiti market, allowing Global to take expertise to new markets
Innovative Investment Banking products providing access to underserved mid-market segment Wide geographic placement reach and services
Unique investment opportunities
Significant principal investment expertise Local relationships and experience provide access to deals not open to international players Strong and developed track record
Increased investment and trading activity
Increase assets under management supported by large number of well performing equity funds Pan-MENA trading and placement capability, supporting the establishment of the brokerage
business
Liberalisation of regional markets
Local know-how and existing client relationships Licences to operate in Saudi, Egypt and Qatar Established relationships with regulators
Well positioned to benefit from high regional growth
19
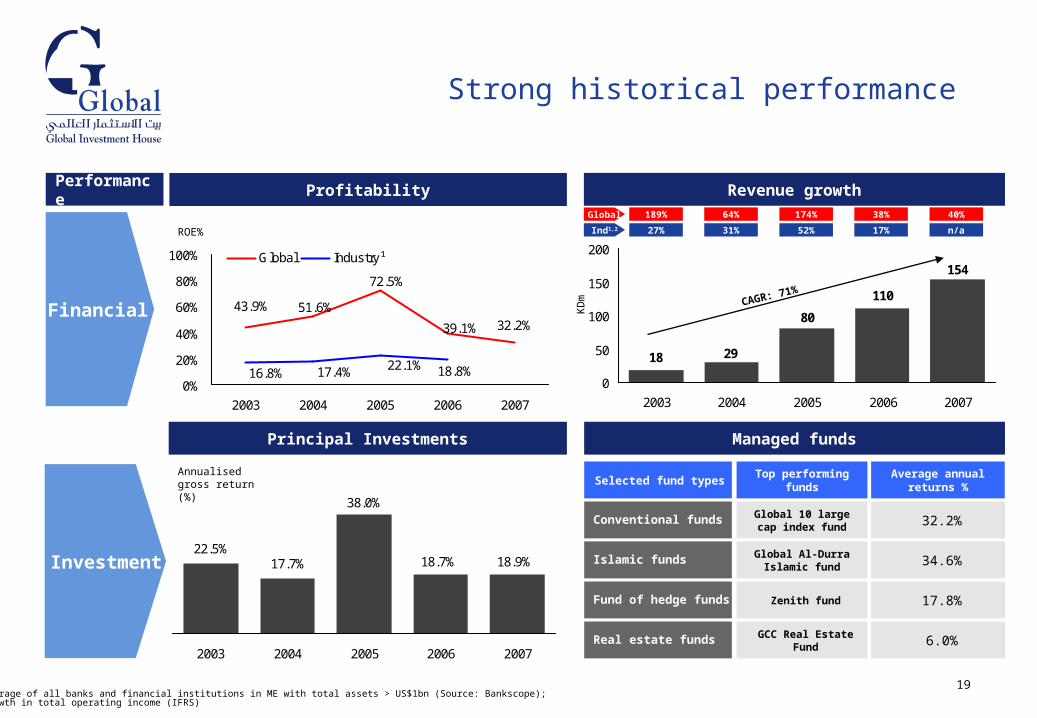
Strong historical performance
Profitability Revenue growth
32.2%39.1%
43.9% 51.6%
72.5%
18.8%22.1%17.4%16.8%0%
20%
40%
60%
80%
100%
2003 2004 2005 2006 2007
Global Industry¹
ROE%
154
110
80
18 29
0
50
100
150
200
2003 2004 2005 2006 2007
Financial CAGR: 71%
Performance
KD
m
(1) Average of all banks and financial institutions in ME with total assets > US$1bn (Source: Bankscope);(2) Growth in total operating income (IFRS)
189% 64% 174% 40%
n/a27% 31% 52%
Global
Ind1,2
38%
17%
Principal Investments Managed funds
Investment 18.9%18.7%
38.0%
22.5%17.7%
2003 2004 2005 2006 2007
Annualised gross return (%) Selected fund types
Conventional funds
Islamic funds
Real estate funds
Fund of hedge funds
Top performing funds
Global 10 large cap index fund 32.2%
Global Al-Durra Islamic fund 34.6%
Zenith fund 17.8%
GCC Real Estate Fund 6.0%
Average annual returns %
20
Business segments
21
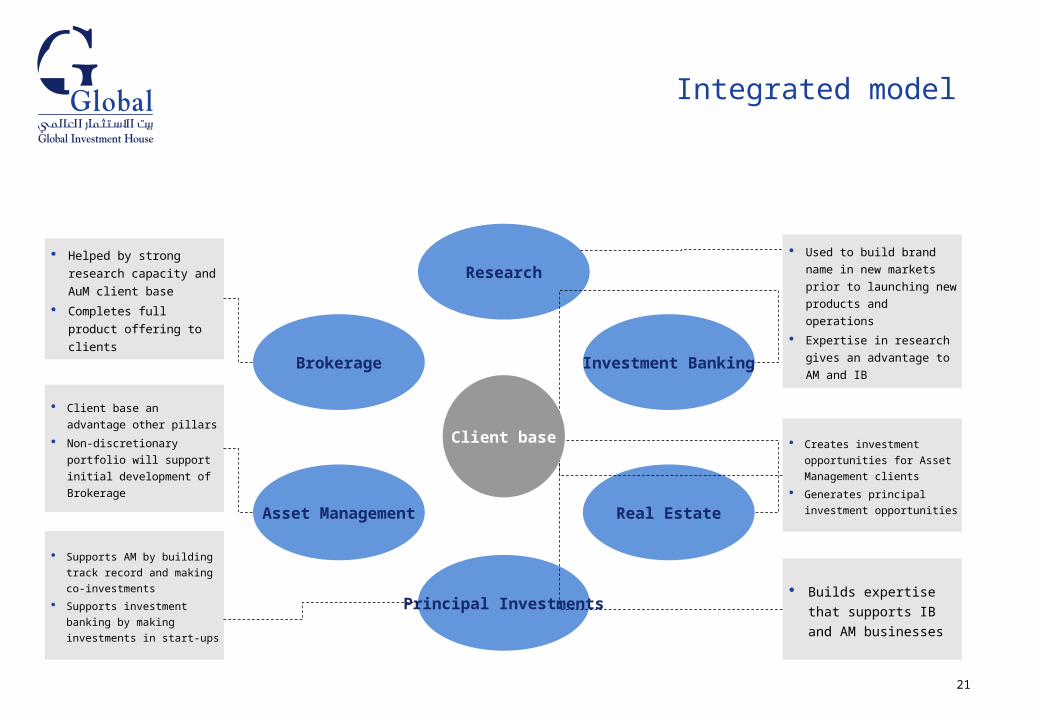
Integrated model
Brokerage
Asset Management Real Estate
Investment Banking
Helped by strong
research capacity and
AuM client base
Completes full product
offering to clients
Client base an advantage
other pillars
Non-discretionary
portfolio will support initial
development of
Brokerage
Creates investment
opportunities for Asset
Management clients
Generates principal
investment opportunities
Builds expertise that
supports IB and AM
businesses
Principal Investments
Supports AM by building
track record and making
co-investments
Supports investment
banking by making
investments in start-ups
Used to build brand
name in new markets
prior to launching new
products and operations
Expertise in research
gives an advantage to
AM and IB
Research
Client base
22
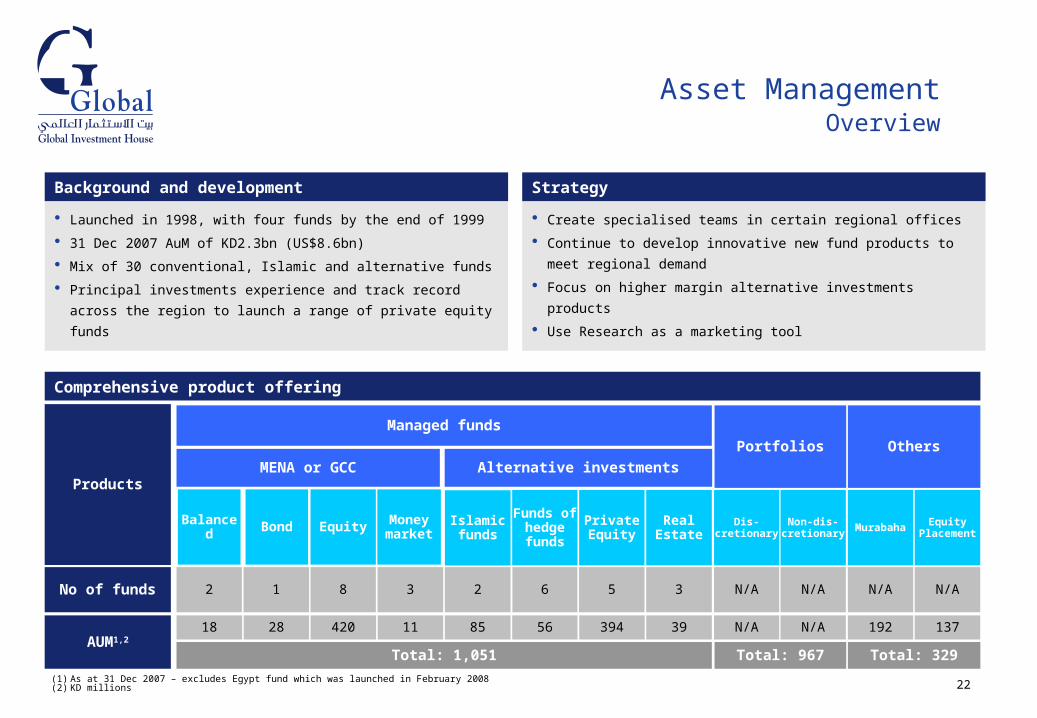
Asset Management Overview
Launched in 1998, with four funds by the end of 1999
31 Dec 2007 AuM of KD2.3bn (US$8.6bn)
Mix of 30 conventional, Islamic and alternative funds
Principal investments experience and track record across
the region to launch a range of private equity funds
Background and development
Products
No of funds
Portfolios Others
Dis-cretionary Murabaha Equity
Placement
Managed funds
Balanced Bond Equity Money market
Islamic funds
Private Equity
Real Estate
Funds of hedge funds
Non-dis-cretionary
Total: 1,051 Total: 967 Total: 329AUM1,2
192 13718 28 420 11 85 394 3956 N/A N/A
N/A N/A N/A2 1 8 3 2 5 36 N/A
MENA or GCC Alternative investments
(1) As at 31 Dec 2007 – excludes Egypt fund which was launched in February 2008(2) KD millions
Comprehensive product offering
Create specialised teams in certain regional offices
Continue to develop innovative new fund products to meet
regional demand
Focus on higher margin alternative investments products
Use Research as a marketing tool
Strategy
23
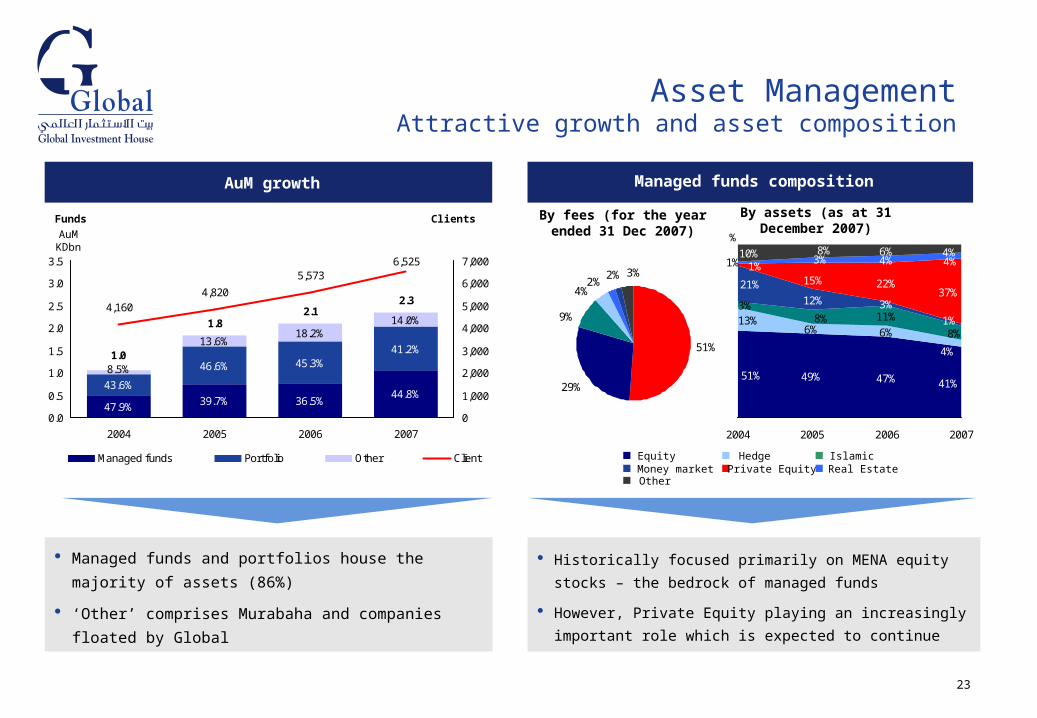
Asset ManagementAttractive growth and asset composition
Managed funds and portfolios house the majority of
assets (86%)
‘Other’ comprises Murabaha and companies floated by
Global
Historically focused primarily on MENA equity stocks – the
bedrock of managed funds
However, Private Equity playing an increasingly important
role which is expected to continue
AuM growth
47.9%
1.82.1
44.8%36.5%39.7%
41.2%45.3%46.6%
43.6%
14.0%18.2%
13.6%
8.5%1.0
2.34,160
4,820
5,5736,525
0.0
0.5
1.0
1.5
2.0
2.5
3.0
3.5
2004 2005 2006 2007
0
1,000
2,000
3,000
4,000
5,000
6,000
7,000
Managed funds Portfolio Other Client
AuMKDbn
Funds Clients
51%
29%
3%
9%
2%2%
4%
49% 47%
6% 6%
11%3%
22%
4%6%
51%41%
13%
4%
8%8%
3% 12%
21%
1%
15%
1%
37%
3%1% 4%
8%10% 4%
2004 2005 2006 2007
Managed funds composition
By fees (for the year ended 31 Dec 2007)
By assets (as at 31 December 2007)
Equity Hedge IslamicMoney market Private Equity Real EstateOther
%
24
Principal Investments and TreasuryOverview
Background
Started in 1999 with KD9m (US$30.5m) to facilitate first stage of expansion outside of Kuwait; approximately KD659m
(US$2.4bn) invested as of 31 December 2007
Treasury operations to pursue short-term opportunistic investments and for general treasury management
Principal Investment criteria:
1. Attractive fundamentals and potential to generate attractive returns in their own right
2. Additional strategic benefits that support one of:
– our regional expansion: investments in associates outside of Kuwait providing new distribution channels and access to new markets
– our product expansion: investments in related financial service companies that can strengthen some of Global’s five business pillars
– Supports our Asset Management and Investment Banking business
– Co-investments in private placements or new Global funds
25
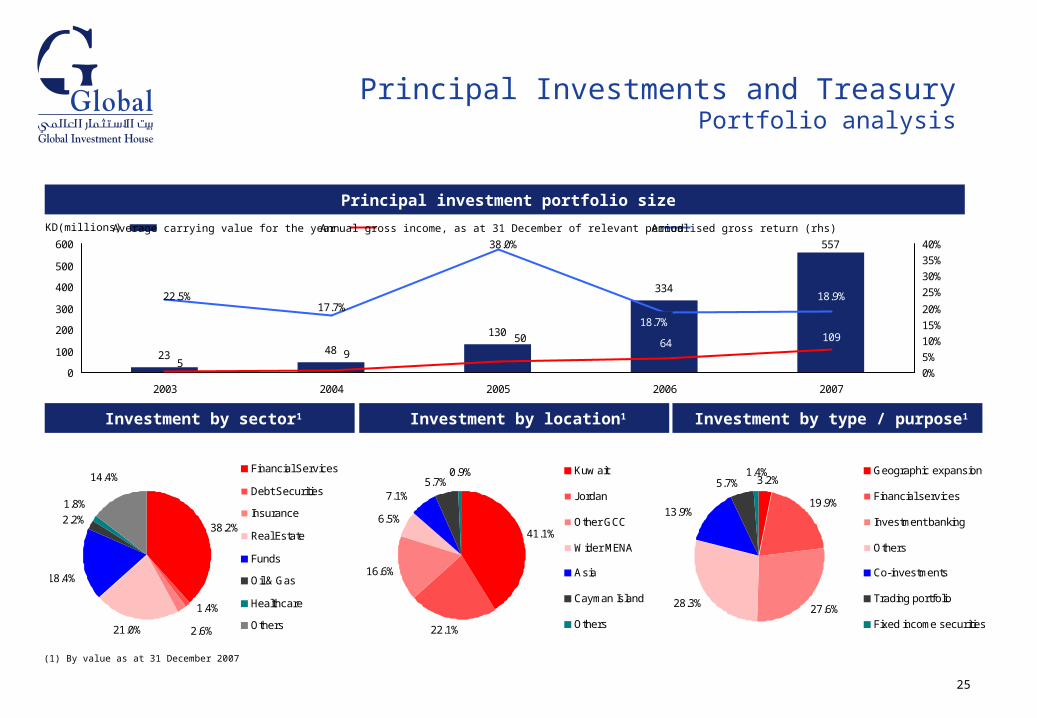
Principal Investments and TreasuryPortfolio analysis
KD(millions)
Investment by sector1
Principal investment portfolio size
Investment by location1 Investment by type / purpose1
38.2%
1.4%
2.6%21.0%
2.2%
1.8%
14.4%
18.4%
Financial Services
Debt Securities
Insurance
Real Estate
Funds
Oil & Gas
Healthcare
Others
(1) By value as at 31 December 2007
41.1%
22.1%
16.6%
6.5%
5.7%0.9%
7.1%
Kuw ait
Jordan
Other GCC
Wider MENA
Asia
Cayman Island
Others
3.2%
19.9%
27.6%28.3%
5.7%
13.9%
1.4% Geographic expansion
Financial services
Investment banking
Others
Co-investments
Trading portfolio
Fixed income securities
23 48
130
334
557
22.5%17.7%
38.0%
18.7%
18.9%
1096450
59
0
100
200
300
400
500
600
2003 2004 2005 2006 2007
0%
5%
10%
15%
20%
25%
30%
35%
40%Average carrying value for the year Annualised gross return (rhs)Annual gross income, as at 31 December of relevant period
26
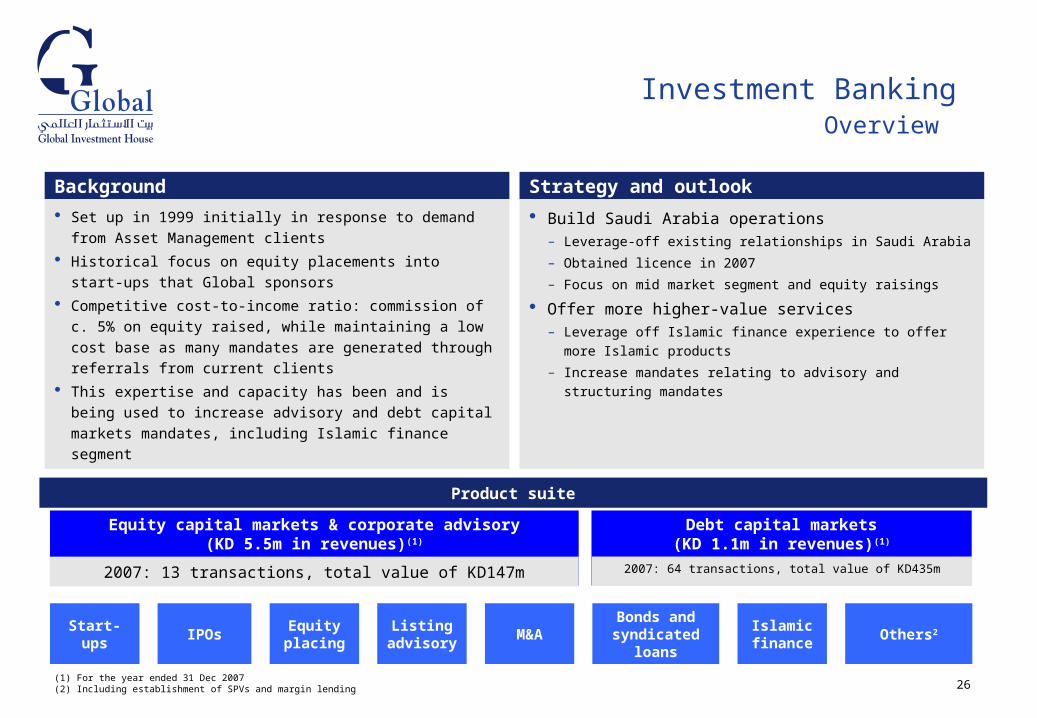
Investment BankingOverview
Background
Set up in 1999 initially in response to demand from Asset
Management clients
Historical focus on equity placements into start-ups that
Global sponsors
Competitive cost-to-income ratio: commission of c. 5% on
equity raised, while maintaining a low cost base as many
mandates are generated through referrals from current
clients
This expertise and capacity has been and is being used to
increase advisory and debt capital markets mandates,
including Islamic finance segment
Strategy and outlook
Build Saudi Arabia operations– Leverage-off existing relationships in Saudi Arabia
– Obtained licence in 2007
– Focus on mid market segment and equity raisings
Offer more higher-value services– Leverage off Islamic finance experience to offer more Islamic
products
– Increase mandates relating to advisory and structuring mandates
Product suite
Equity capital markets & corporate advisory(KD 5.5m in revenues)(1)
Debt capital markets(KD 1.1m in revenues)(1)
Others2Islamic finance
Bonds and syndicated
loansM&A
Equity placing
IPOsStart-upsListing
advisory
(1) For the year ended 31 Dec 2007(2) Including establishment of SPVs and margin lending
2007: 13 transactions, total value of KD147m 2007: 64 transactions, total value of KD435m
27
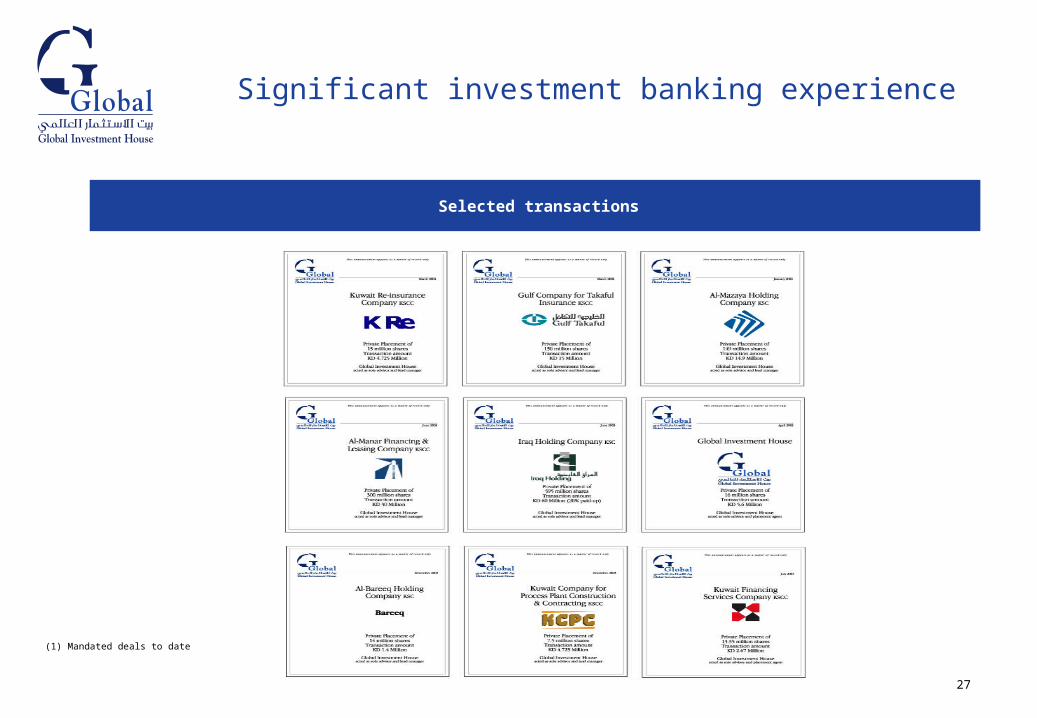
Significant investment banking experience
Selected transactions
(1) Mandated deals to date
28
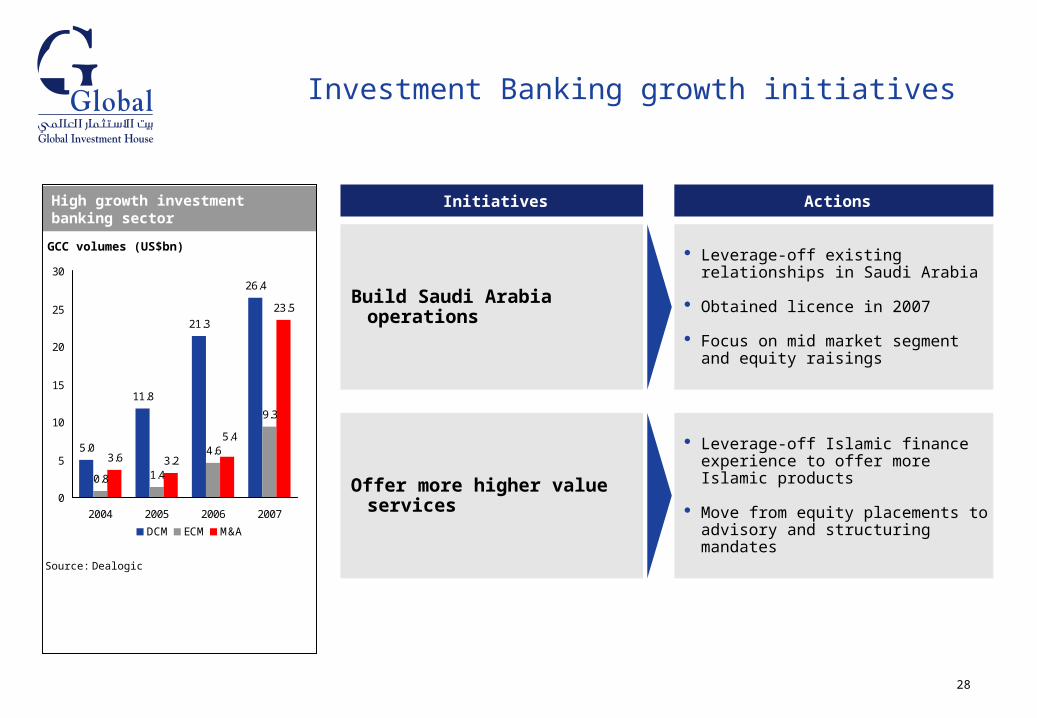
Investment Banking growth initiatives
Initiatives Actions
Leverage-off existing relationships in Saudi Arabia
Obtained licence in 2007
Focus on mid market segment and equity raisings
Leverage-off Islamic finance experience to offer more Islamic products
Move from equity placements to advisory and structuring mandates
Build Saudi Arabia operations
Offer more higher value services
High growth investment banking sector
Source: Dealogic
5.0
11.8
21.3
26.4
0.8 1.4
4.6
9.3
3.6 3.2
23.5
5.4
0
5
10
15
20
25
30
2004 2005 2006 2007
DCM ECM M&A
GCC volumes (US$bn)
29
Real Estate investment
Background and development
Set up in 2006 to focus on commercial and residential real estate
Established to make opportunistic investments to take advantage of attractive growth in the real estate sector in the region
Real Estate expertise also supports Global’s Asset Management and Investment Banking business
– Track record for Real Estate funds
– Expertise to win more real estate related Investment Banking business
Established a dedicated team based in Dubai – who are able to source and invest in high value opportunities for Global, their
clients and certain managed funds
Sold majority of portfolio in 2007 to focus on new opportunities
30
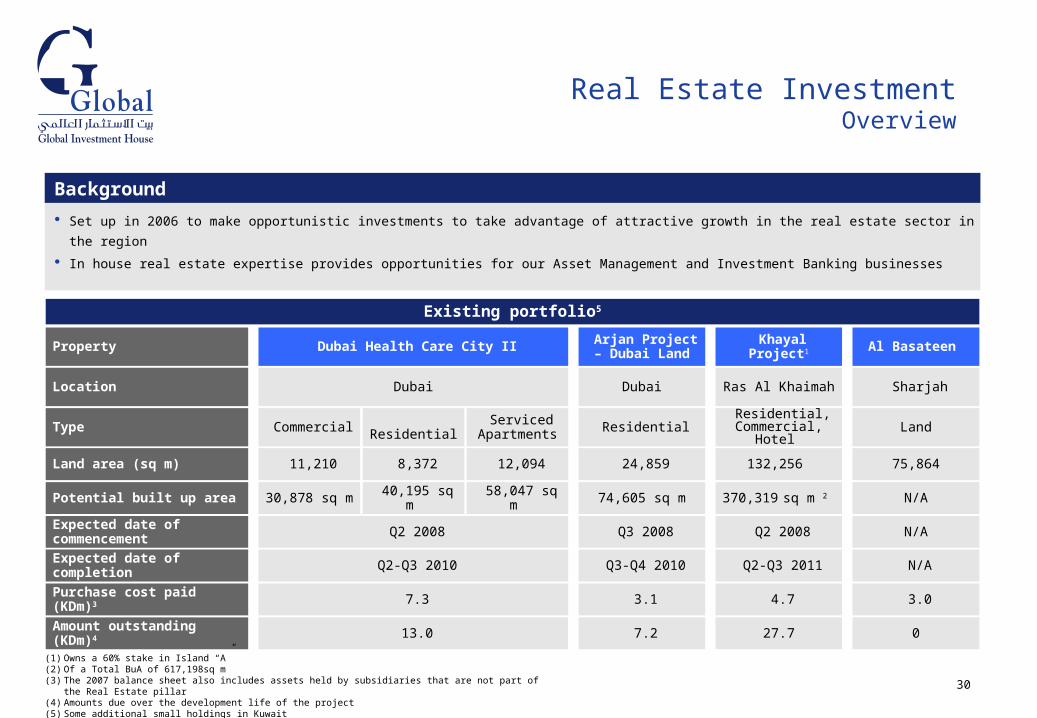
Real Estate InvestmentOverview
Background
Set up in 2006 to make opportunistic investments to take advantage of attractive growth in the real estate sector in the region
In house real estate expertise provides opportunities for our Asset Management and Investment Banking businesses
Existing portfolio5
Location Dubai Dubai Ras Al Khaimah Sharjah
Land area (sq m) 11,210 8,372 12,094 24,859 132,256 75,864
Type Commercial Residential Serviced Apartments Residential Residential,
Commercial, Hotel Land
Expected date of commencement Q2 2008 Q3 2008 Q2 2008 N/A
Expected date of completion Q2-Q3 2010 Q3-Q4 2010 Q2-Q3 2011 N/A
Property Dubai Health Care City II Arjan Project – Dubai Land Khayal Project1 Al Basateen
Potential built up area 30,878 sq m 40,195 sq m 58,047 sq m 74,605 sq m 370,319 sq m 2 N/A
Purchase cost paid (KDm)3 7.3 3.1 4.7 3.0
Amount outstanding(KDm)4 13.0 7.2 27.7 0
(1) Owns a 60% stake in Island “A”(2) Of a Total BuA of 617,198sq m(3) The 2007 balance sheet also includes assets held by subsidiaries that are not part of the Real Estate pillar(4) Amounts due over the development life of the project(5) Some additional small holdings in Kuwait
31
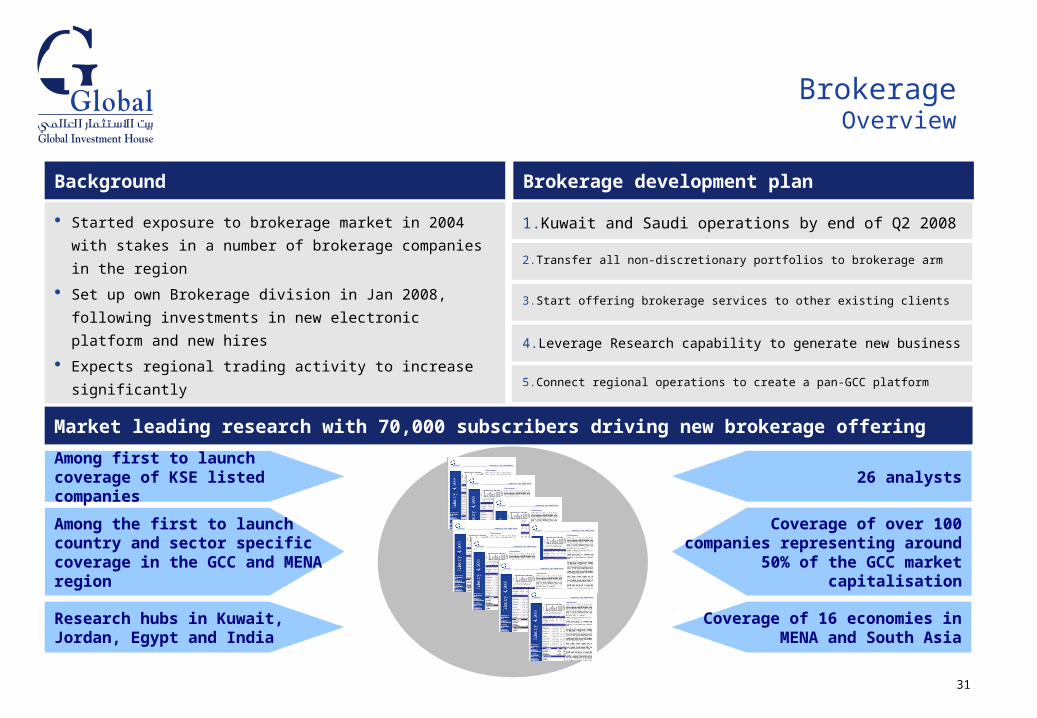
BrokerageOverview
Background
Started exposure to brokerage market in 2004 with stakes
in a number of brokerage companies in the region
Set up own Brokerage division in Jan 2008, following
investments in new electronic platform and new hires
Expects regional trading activity to increase significantly
1. Kuwait and Saudi operations by end of Q2 2008
2. Transfer all non-discretionary portfolios to brokerage arm
3. Start offering brokerage services to other existing clients
4. Leverage Research capability to generate new business
5. Connect regional operations to create a pan-GCC platform
Brokerage development plan
Research hubs in Kuwait, Jordan, Egypt and India
Coverage of 16 economies in MENA and South Asia
Coverage of over 100 companies representing around 50% of the GCC
market capitalisation
Among first to launch coverage of KSE listed companies
26 analysts
Among the first to launch country and sector specific coverage in the GCC and MENA region
Market leading research with 70,000 subscribers driving new brokerage offering
32
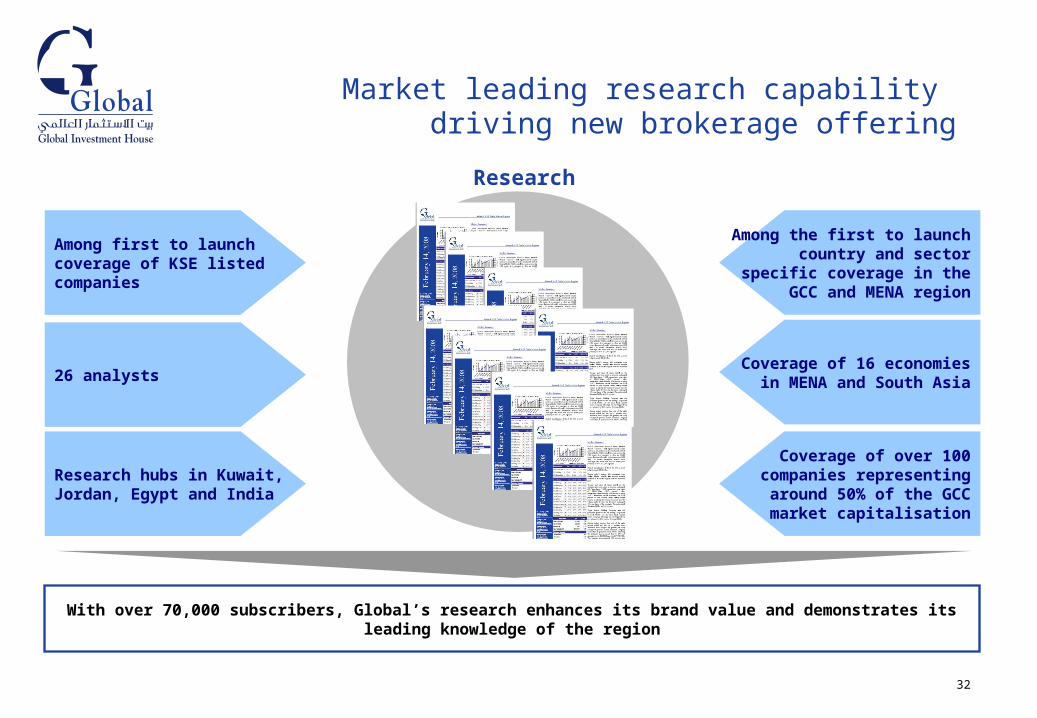
Market leading research capability driving new brokerage offering
Research
Research hubs in Kuwait, Jordan, Egypt and India
Coverage of 16 economies in MENA and South Asia
Coverage of over 100 companies representing
around 50% of the GCC market capitalisation
With over 70,000 subscribers, Global’s research enhances its brand value and demonstrates its leading knowledge of the region
Among first to launch coverage of KSE listed companies
Among the first to launch country and sector specific
coverage in the GCC and MENA region
26 analysts
33
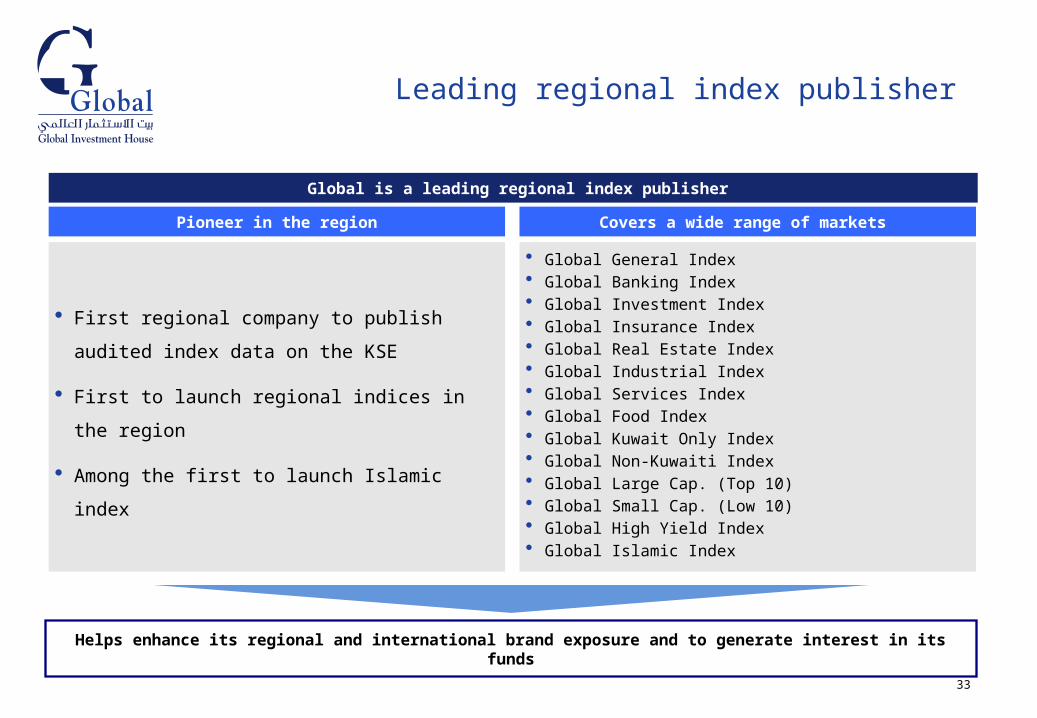
Leading regional index publisher
Global is a leading regional index publisher
Pioneer in the region
First regional company to publish audited index
data on the KSE
First to launch regional indices in the region
Among the first to launch Islamic index
Covers a wide range of markets
Global General Index Global Banking Index Global Investment Index Global Insurance Index Global Real Estate Index Global Industrial Index Global Services Index Global Food Index Global Kuwait Only Index Global Non-Kuwaiti Index Global Large Cap. (Top 10) Global Small Cap. (Low 10) Global High Yield Index Global Islamic Index
Helps enhance its regional and international brand exposure and to generate interest in its funds
34
Financial overview
35
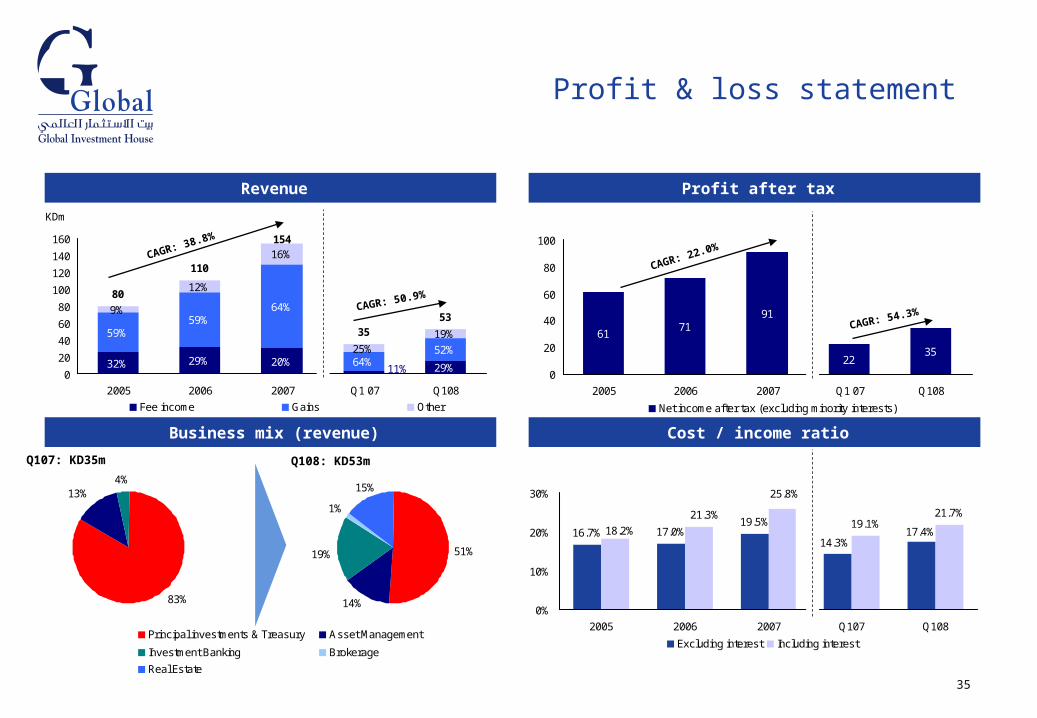
Profit & loss statement
Revenue Profit after tax
Cost / income ratioBusiness mix (revenue)
17.0%19.5% 19.1%
21.7%
17.4%14.3%
16.7%
25.8%
21.3%
18.2%
0%
10%
20%
30%
2005 2006 2007 Q107 Q108
Excluding interest Including interest
80
110
154
3553
29%20%29%32% 11%
52%64%
64%59%
59% 19%25%
16%
12%
9%
0
20
40
60
80
100
120
140
160
2005 2006 2007 Q1 07 Q108
Fee income Gains Other
KDm
CAGR: 38.8%
CAGR: 50.9%
6171
91
2235
0
20
40
60
80
100
2005 2006 2007 Q1 07 Q108
Net income after tax (excluding minority interests)
CAGR: 22.0%
CAGR: 54.3%
83%
13%4%
51%
14%
1%
19%
15%
Q107: KD35m Q108: KD53m
Principal investments & Treasury Asset Management
Investment Banking Brokerage
Real Estate
36
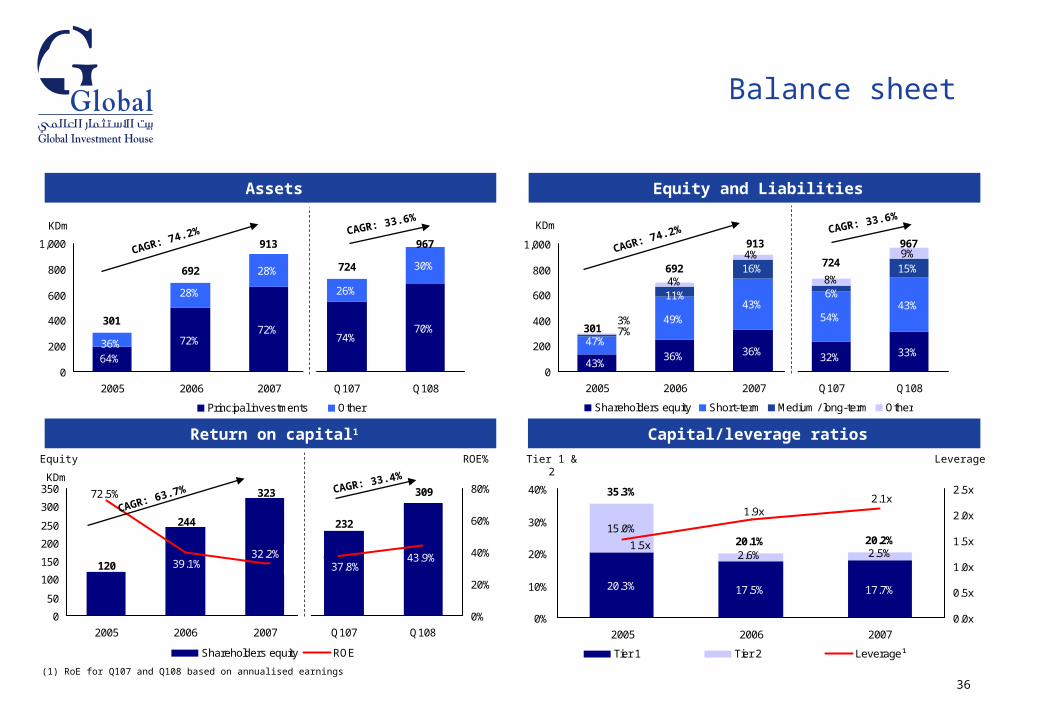
Balance sheet
Assets Equity and Liabilities
724
967
74%70%
64%
72%72%
26%
30%
36%
28%
28%
301
692
913
0
200
400
600
800
1,000
2005 2006 2007 Q107 Q108
Principal investments Other
KDm
967
32% 33%36%36%43%
54%43%43%
49%
47%
6%
15%16%
11%
7%
8%
9%4%
3%
4%
724
913
692
301
0
200
400
600
800
1,000
2005 2006 2007 Q107 Q108
Shareholders equity Short-term Medium / long-term Other
KDm
Return on capital1 Capital/leverage ratios
17.5% 17.7%20.3%
2.5%
15.0%
2.6%20.1% 20.2%
35.3%2.1x
1.9x
1.5x
0%
10%
20%
30%
40%
2005 2006 2007
0.0x
0.5x
1.0x
1.5x
2.0x
2.5x
Tier 1 Tier 2 Leverage¹
Tier 1 & 2
120
244
323
232
30972.5%
39.1%32.2%
37.8%43.9%
0
50
100
150
200
250
300
350
2005 2006 2007 Q107 Q108
0%
20%
40%
60%
80%
Shareholders equity ROE
KDm
ROE% LeverageEquity
CAGR: 74.2% CAGR: 33.6%
CAGR: 63.7% CAGR: 33.4%
(1) RoE for Q107 and Q108 based on annualised earnings
CAGR: 74.2% CAGR: 33.6%
37
1%1%1%1%1%1%1%1%
Asset management Investment banking PI - PE/Quoted securities
PI - Fixed income PI - Co-investments Strategic associates
Lending & Finance Proprietary trading Real estate
Brokerage
Fee income (20%)
Asset based income (80%)
Other income (1%)¹
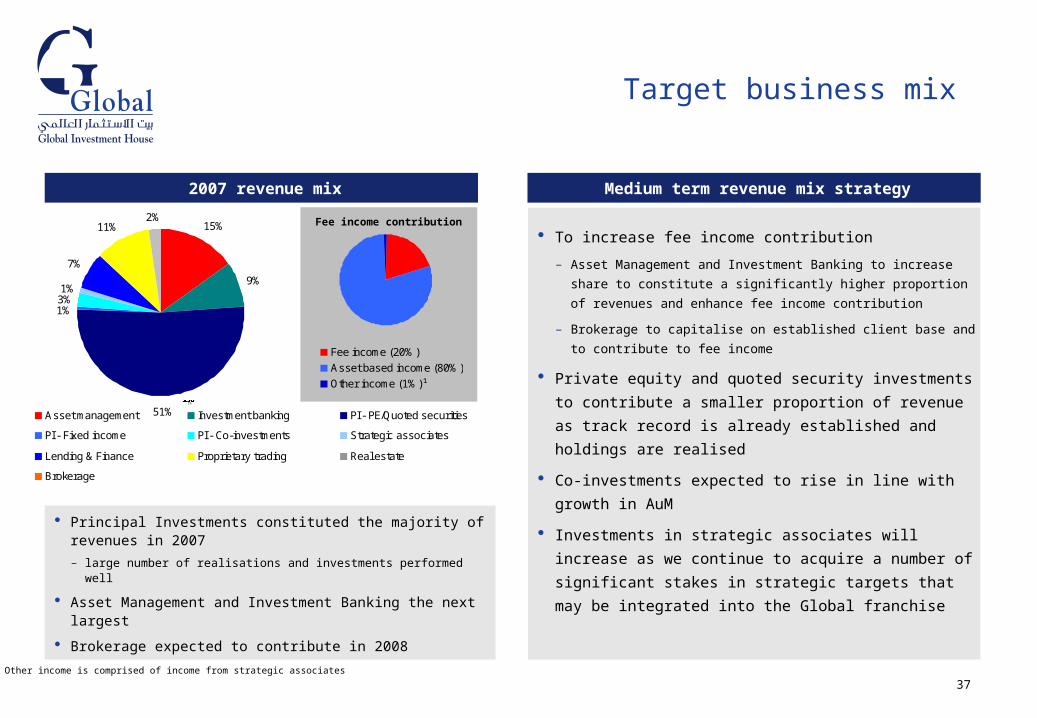
Target business mix
2007 revenue mix
Principal Investments constituted the majority of revenues in 2007
– large number of realisations and investments performed well
Asset Management and Investment Banking the next largest
Brokerage expected to contribute in 2008
To increase fee income contribution
– Asset Management and Investment Banking to increase share to
constitute a significantly higher proportion of revenues and enhance
fee income contribution
– Brokerage to capitalise on established client base and to contribute
to fee income
Private equity and quoted security investments to
contribute a smaller proportion of revenue as track record
is already established and holdings are realised
Co-investments expected to rise in line with growth in AuM
Investments in strategic associates will increase as we
continue to acquire a number of significant stakes in
strategic targets that may be integrated into the Global
franchise
15%
9%
1%
1%
7%
11%2%
3%
51%
Fee income contribution
(1) Other income is comprised of income from strategic associates
Medium term revenue mix strategy
38
Global stock & shareholders
39
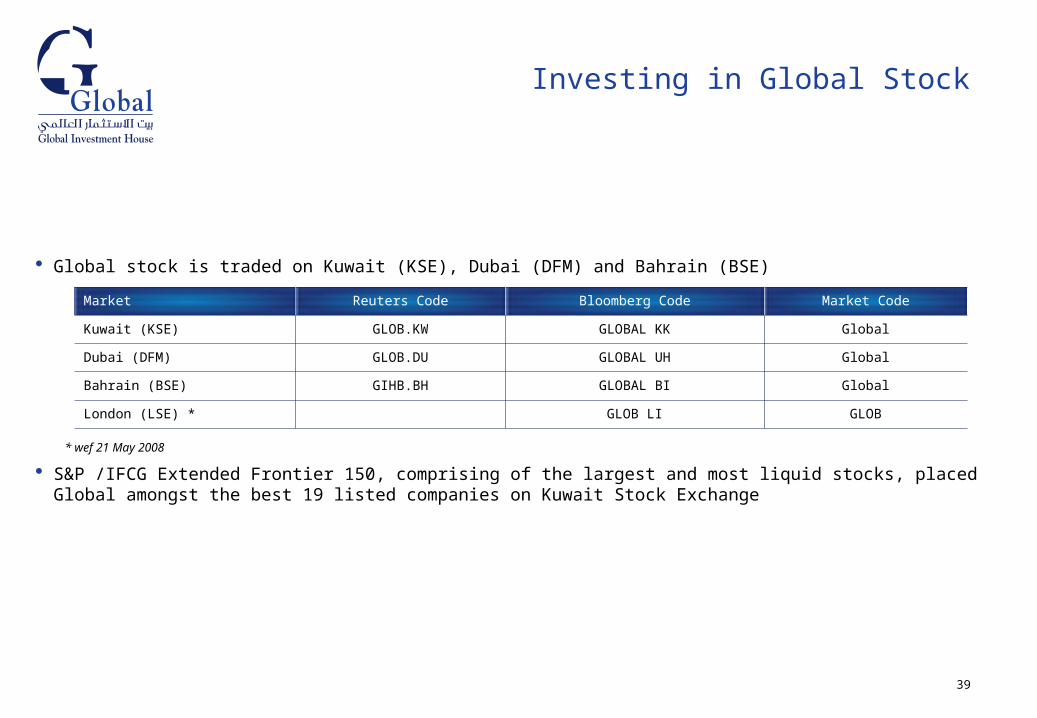
Investing in Global Stock
Global stock is traded on Kuwait (KSE), Dubai (DFM) and Bahrain (BSE)
* wef 21 May 2008
S&P /IFCG Extended Frontier 150, comprising of the largest and most liquid stocks, placed Global amongst the best 19 listed companies on Kuwait Stock Exchange
Market Reuters Code Bloomberg Code Market Code
Kuwait (KSE) GLOB.KW GLOBAL KK Global
Dubai (DFM) GLOB.DU GLOBAL UH Global
Bahrain (BSE) GIHB.BH GLOBAL BI Global
London (LSE) * GLOB LI GLOB
40
Ownership Key Points
Regulatory
– Public disclosure once ownership reaches 5% or over whether it is direct, indirect, or in different markets.
– Ceiling for total non-GCC investors ownership is 49%
Restrictions as per articles of association
– Maximum ownership by a single investor is limited to 20% of the issued capital.
41
Awards & recognition
42
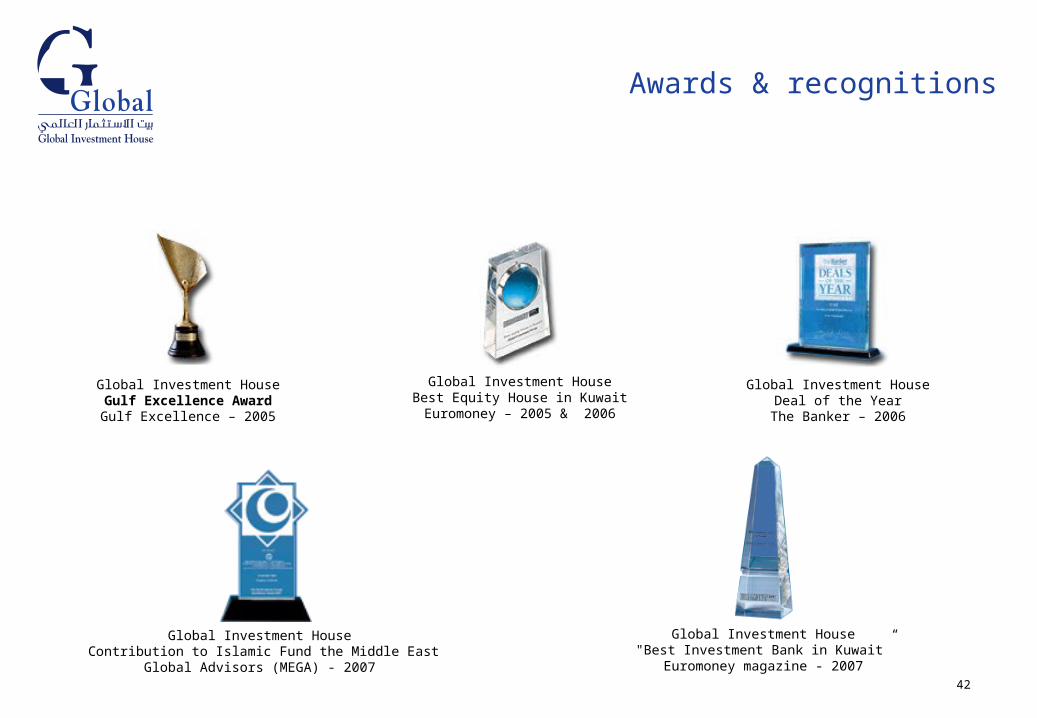
Global Investment HouseGulf Excellence AwardGulf Excellence – 2005
Global Investment HouseDeal of the Year
The Banker – 2006
Global Investment HouseBest Equity House in KuwaitEuromoney – 2005 & 2006
Global Investment House"Best Investment Bank in Kuwait”
Euromoney magazine - 2007
Global Investment House Contribution to Islamic Fund the Middle East
Global Advisors (MEGA) - 2007
Awards & recognitions
43
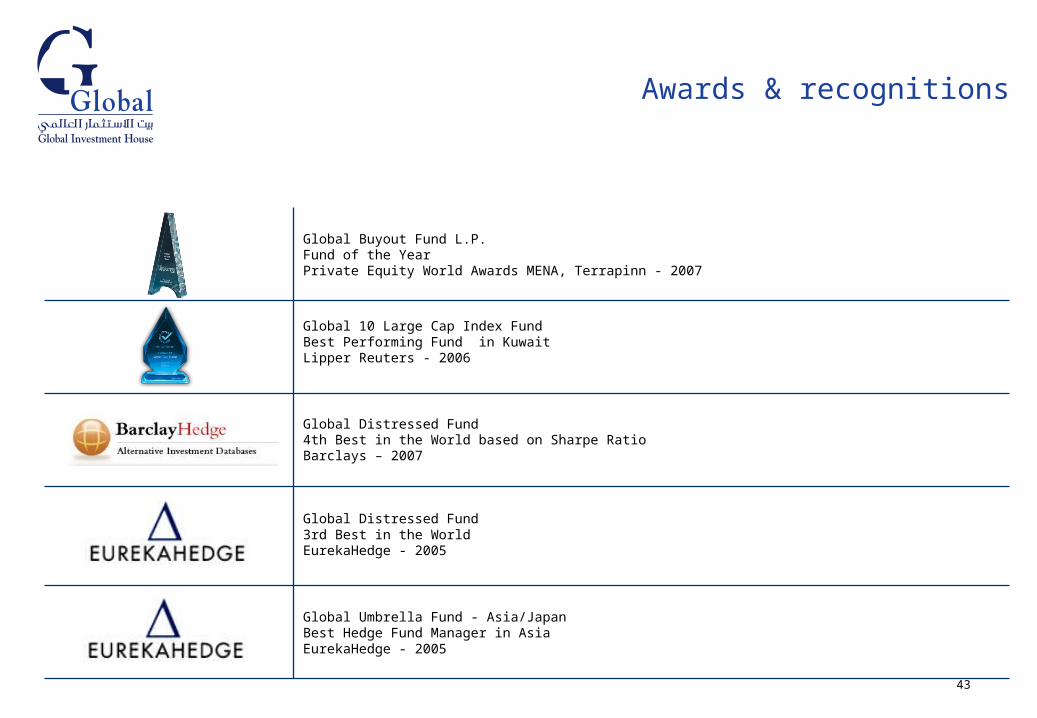
Awards & recognitions
Global Buyout Fund L.P.Fund of the YearPrivate Equity World Awards MENA, Terrapinn - 2007
Global 10 Large Cap Index FundBest Performing Fund in KuwaitLipper Reuters - 2006
Global Distressed Fund4th Best in the World based on Sharpe RatioBarclays – 2007
Global Distressed Fund3rd Best in the WorldEurekaHedge - 2005
Global Umbrella Fund - Asia/Japan Best Hedge Fund Manager in AsiaEurekaHedge - 2005
44
Global Investment House has obtained the information in this presentation from sources it believes to be reliable. Although Global Investment House has taken all reasonable care to ensure that the information herein is accurate and correct, Global Investment House makes no representation or warranty, express or implied, as to the accuracy, correctness or completeness of such information. Furthermore, Global Investment House makes no representation or warranty, express or implied, that its future results will be consistent with results implied, directly or indirectly, by such information or with Global Investment House’s past results. Any information herein is as of the date of this presentation and may change without notice. Global Investment House undertakes no obligation to update the information in this presentation. In addition, information in this presentation may be condensed or incomplete, and this presentation may not contain all material information in respect of Global Investment House.
This presentation also contains “forward-looking statements” that relate to, among other things, Global Investment House’s plans, objectives, goals, and strategies. Such forward-looking statements may be characterized by words such as “anticipates,” “estimates,” “expects,” “projects,” “believes,” “intends,” “plans,” “may,” “will” and “should” and similar expressions but are not the exclusive means of identifying such statements. Such forward-looking statements involve known and unknown risks, uncertainties and other important factors that could cause Global Investment House’s results to be materially different from the operating, financial or other results expressed or implied by such statements. Although Global Investment House believes the basis for such forward-looking statements to be fair and reasonable, Global Investment House makes no representation or warranty, express or implied, as to the fairness or reasonableness of such forward-looking statements. Furthermore, Global Investment House makes no representation or warranty, express or implied, that the results anticipated by such forward-looking statements will be achieved. Such forward-looking statements represent, in each case, only one of many possible scenarios and should not be viewed as the most likely or standard scenario. Global Investment House undertakes no obligation to update the forward-looking statements in this presentation.
Disclaimer