Embed Size (px)
Citation preview
Disclosures & Disclaimer
This report must be read with the disclosures and the analyst certifications in
the Disclosure appendix, and with the Disclaimer, which forms part of it.
Issuer of report: HSBC Bank plc
View HSBC Global Research at:
https://www.research.hsbc.com
Sector OEMs poised for industrial scale-up and support from
policy on the rise: hydrogen may at last be coming of age
HSBC Hydrogen Week highlighted: 1) maturity of technology
2) green hydrogen prospects; and 3) business case for HGVs
We address key investor questions on hydrogen
Feedback from HSBC Hydrogen Week – strong growth momentum
Over the week of 29 June to 2 July we hosted expert speakers and leading sector
OEMs in our inaugural virtual hydrogen investor event. Overall we see strong growth
momentum for hydrogen technologies, which we believe will play an increasingly key
role in global decarbonisation efforts.
Manufacturer scale-up, rising corporate activity and explicit policy support
Producers of electrolysers (which enable the generation of clean hydrogen) are
scaling up rapidly to meet a multi-GW pipeline of announced projects that can drive
down the costs of ‘green’ hydrogen to a level comparable with today’s ‘grey’
hydrogen. Fuel cell technologies (which convert hydrogen into power) are also
maturing and OEMs are scaling up capacity to pursue applications across transport
(with much focus on trucks), power and industry. Industrial partnerships, JVs and
rising M&A activity signal greater corporate strategic alignment with hydrogen and
project announcements continue to increase in scale. This is underpinned by
increasingly explicit policy support, most notably in the EU, which now targets 6GW
of green hydrogen capacity by 2024 and 40GW by 2030.
Is it really different this time? Key investor questions
Building on deep dive Spotlight reports on we have published on green hydrogen and
on decarbonising trucks, in this note we attempt to address key investor questions we
have received:
1. What is different this time? What are companies saying?
2. Green vs grey hydrogen: how do we close the cost gap?
3. Is offshore wind more attractive for hydrogen than other renewables?
4. Will hydrogen lose out to batteries in transport applications?
5. Does decarbonising HGVs with hydrogen make sense?
6. How is policy support for hydrogen developing?
This is a redacted version of the report published on 10-Jul-20. Please contact your
HSBC representative or email [email protected] for information.
10 July 2020
Sean McLoughlin* EMEA Head of Industrials Research
HSBC Bank plc
Edward Perry*, CFA Analyst
HSBC Bank plc
Ashim Paun
Co-Head, ESG Research; Climate Change Strategist
HSBC Bank plc
Davey Jose*
Thematic Analyst, Disruptive Technologies
HSBC Bank plc
Sarthak Sikka* Associate Bangalore
* Employed by a non-US affiliate of HSBC Securities (USA) Inc, and is not registered/ qualified pursuant to FINRA regulations
Global Hydrogen Equities & ESG EM Europe
Approaching sector tipping point – hydrogen FAQs
Equities & ESG ● EM Europe 10 July 2020
2
HSBC Hydrogen Week feedback
Over the week of 29 June to 2 July we hosted expert speakers and leading sector OEMs in our
inaugural virtual hydrogen investor event. We present our main conclusions below.
Technologies poised for scale-up
Overall we heard that both electrolyser and fuel cell technologies are poised for industrial scale-
up thanks to strong demand growth both in upstream (hydrogen generation) and downstream
(end market applications for hydrogen in transport, power and industry). OEMs believe that
industrialisation can drive a 30-50% drop in equipment costs by 2025 and a 70+% fall by 2030
compared with current levels. This is key to green hydrogen reaching cost parity with grey
hydrogen and ultimately enabling the decarbonisation of wide segments of the global economy
such as transport, heavy industry and heat.
Focus on decarbonising HGVs
We noted an increasingly compelling role for hydrogen in the long-haul heavy goods vehicle
(HGV) segment. This is owing to two key advantages over battery-powered electric trucks,
namely: 1) lower weight leading to longer range; 2) rapid refuelling time. As long-haul road
transport typically moves along main road arteries (c.5% of the road network), it requires far
fewer refuelling stations compared to more localised transport. This is important as hydrogen
refuelling technology is relatively immature and lacks standardisation.
Policy support on the increase
Crucially, policy momentum for hydrogen is on the increase, which is key given that only a
handful of niche applications are business-case positive today (e.g. fork lift trucks). Japan,
Korea and China already have substantial support mechanisms in place. In June 2020
California set firm targets in place for zero emission commercial transport. In June several
countries such as Germany, Portugal and Netherlands set national hydrogen targets.
On 8 July the EU released its EU Hydrogen Strategy, potentially positioning Europe as the
hydrogen leader. The scale of and budget for the hydrogen ecosystem and for renewable power
were a surprise, beating the figures outlined in a leaked draft in June. By 2024 the EU envisages
6GW or 1m tonnes of renewable hydrogen production rising to 40GW (or 10m tonnes) by 2030.
The total investments planned to 2030 are EUR24-42bn for electrolysers as well as EUR220-
340bn to scale up and directly connect 80-120GW of renewable capacity in order to power the
hydrogen production. Driven by this, we see accelerated hydrogen adoption across
industries/geographies and thus greater confidence in improving hydrogen economics to 2030.
Hydrogen FAQs
HSBC Hydrogen Week highlighted approaching tipping point
OEMs ready for scale-up and policy support is on the rise
We answer key investor questions on the hydrogen sector
3
Equities & ESG ● EM Europe 10 July 2020
Global Hydrogen – key investor questions
Following thematic reports we have published on green hydrogen and on decarbonising trucks,
we have met and discussed with many investors. In this note we provide feedback on key
questions from investor meetings
1) Why is it different this time? What are companies saying?
Firstly, we note an acceleration of M&A activity as corporates position themselves more directly
in hydrogen, either through stakes in technology OEMs or outright acquisitions. Secondly we
see a number of new industrial partnerships aimed at accelerating the uptake of hydrogen
technologies, particularly in transport. Pooling know-how and sharing R&D costs certainly
makes sense for manufacturers, in our view.
Corporate actions in hydrogen technologies
Joint Venture/Acquisition Description
Nikola / CNH Industrial / Bosch
USD250m of funding by CNH to accelerate Nikola's plans to develop fuel-cell technology in heavy-duty trucks. CNH will provide manufacturing know-how, purchasing power and plant engineering to Nikola's technology. The other key development partner Bosch will provide the fuel cell systems.
Michelin / Faurecia Combined initial investment of EUR140m to accelerate development of next gen. fuel cells, launch mass production and expand in Europe, China and US. Faurecia will contribute with its technological hydrogen mobility expertise and Michelin with its hydrogen fuel cell kit manufacturing know-how
Weichai / Ballard An equity investment of USD163m by Weichai in Ballard followed by the formation of a JV to support the FCEV market in China. The JV will assemble fuel cell parts supplied by Ballard. Assembled modules will be sold to Weichai to support its commitment to supply min 2000 FCEVs in China by 2021, using Ballard technology
Bosch / PowerCell Agreement to jointly develop PowerCell’s existing S3 fuel cell stack for the automotive industry. Bosch will produce and sell the jointly developed fuel cell and PowerCell will get royalty payments for each fuel cell sold
Cummins / Hydrogenics Cummins acquired fuel cell and hydrogen production technology provider Hydrogenics. The acquisition is expected to strengthen Cummins’ existing fuel cell expertise.
Daimler / Volvo 50/50 joint venture to develop and accelerate fuel cell technology. Volvo paid EUR600m and Daimler is transferring its entire fuel cell activities (developed for the passenger segment). The collaboration will reduce development costs
ITM Power / Linde Linde acquired a 20% stake in ITM power. Linde will predominantly handle EPC of contracts and ITM will provide electrolyser systems.
Weichai / Ceres Power Weichai took a 20% stake in Ceres to explore new fuel cell business models in the Chinese market Toyota/ Beijing Automobile Group / China FAW corp. / Beijing SinoHytec / Dongfeng Motor Corp. / Guangzhou Automobile Group Co.
Toyota teamed up with five companies in China with the aim to develop fuel cells for commercial vehicles and increase its penetration in the China market. The new entity will have an initial capital of USD46m and Toyota will have 65% ownership in the new company.
Source: Company data Thirdly we see a rising diversity of project announcements, often by large consortia and of
increasing scale and ambition. Momentum towards industrialisation looks clear, in our view. We
outline some recent key developments and announcements in the next table.

Equities & ESG ● EM Europe 10 July 2020
4
Project announcements of green/blue hydrogen
Company Country Description
Equinor UK 1) Development of 600MW auto thermal reformer (ATR) with carbon capture to convert natural gas to hydrogen, located in Saltend Chemicals Park (SCP) industrial cluster in the UK.
2) Hydrogen generated from the plant will enable industrial customers in the park to switch over to hydrogen and the power plant in the park to move to a 30% hydrogen to natural gas blend
3) As a result, emissions from SCP will reduce by nearly 900k tonnes of CO2 per year Keppel / Mitsubishi Heavy Industries
Singapore 1) MOU to explore hydrogen powered tri-generation plant concept for data centres 2) Hydrogen generated through steam methane reforming will be supplied to tri-generation plant
which produces heat, power and cooling. Chilled water produced by the plant will be used to cool data centre's systems and facilities
3) Hydrogen manufacture unit will be fitted with carbon capture system to reduce emissions McPhy / Atawey / TSM (MAT)
France 1) Consortium selected to supply 14 hydrogen stations which will be deployed in France 2) The project is expected to generate EUR11m in sales. McPhy will install 5 hydrogen stations
out of the 14 stations Ørsted Denmark 1) Plans to install 5GW offshore wind hub connecting Denmark, Poland, Sweden and Germany
which will support large scale production of green hydrogen 2) The hub situated in Baltic Sea will be called "the world's first energy island"
ACWA / Air products / NEOM
Saudi Arabia 1) A JV project to produce 650 tonnes of hydrogen/day and 1.2mn tonnes/year of green ammonia 2) Electrolyser plant will be integrated with 4GW of solar, wind and other renewable projects 3) A total investment of USD5bn will be done in the project
Source: Company data
2) How do we close the gap between grey and green hydrogen?
Essentially, we do this by massively scaling up green hydrogen, so that equipment costs
plummet, and by using cheaper renewable electricity. Here it’s worth a quick recap. Over 90%
of pure hydrogen produced globally is used in the oil refining and chemicals sectors. According
to IEA, global demand of pure hydrogen was 70-74m tonnes in 2018, 52% of which was used in
diesel refining, 42% in ammonia production and only 6% in other (mostly chemical) industries.
On the supply side, 90% of hydrogen is produced for in-house use, as is the case for refineries.
Merchant sales account for c.10% of the pure hydrogen market with the three biggest gas
companies, Linde, Air Liquide and Air products we estimate accounting for over 75% of the total
merchant market.
Global annual hydrogen demand in pure form by application (in million tonnes)
Pure hydrogen production by type
Source:IEA, 2018 data Source: Company reports, HSBC estimates
0
10
20
30
40
50
60
70
80
1975
1980
1985
1990
1995
2000
2005
2010
2015
2018
Refining Ammonia Other pure
Captive90%
Merchant10%
5
Equities & ESG ● EM Europe 10 July 2020
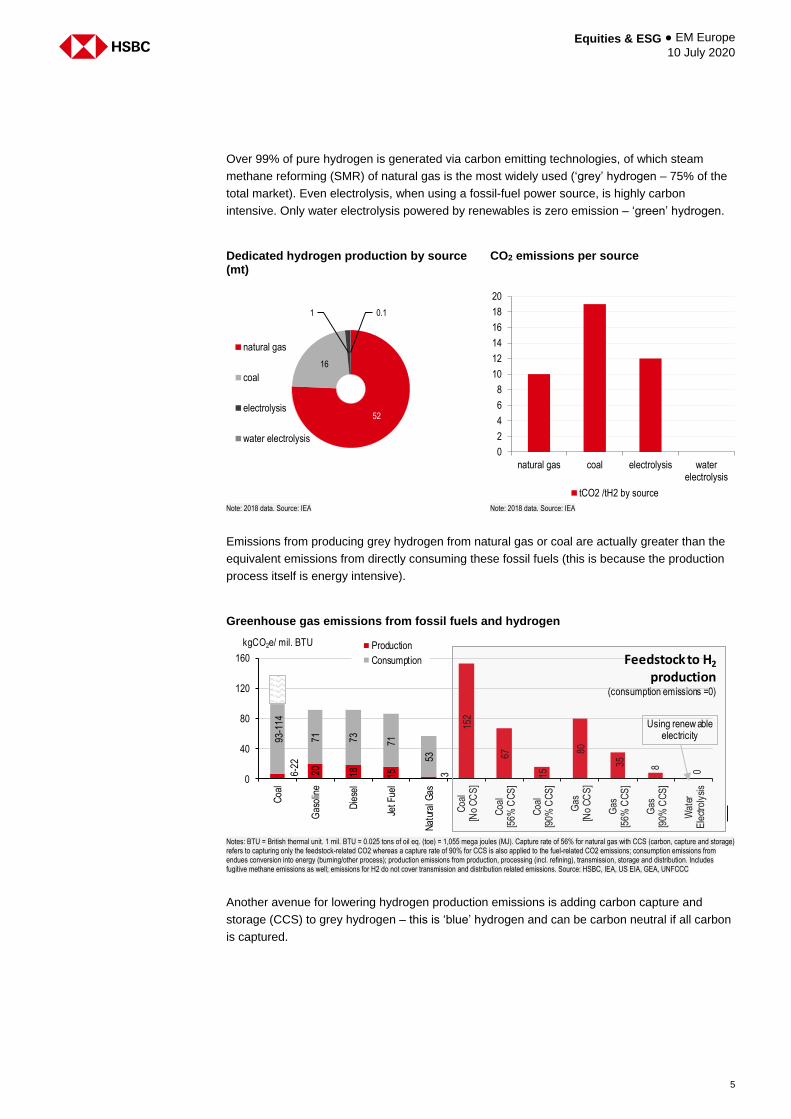
Over 99% of pure hydrogen is generated via carbon emitting technologies, of which steam
methane reforming (SMR) of natural gas is the most widely used (‘grey’ hydrogen – 75% of the
total market). Even electrolysis, when using a fossil-fuel power source, is highly carbon
intensive. Only water electrolysis powered by renewables is zero emission – ‘green’ hydrogen.
Dedicated hydrogen production by source (mt)
CO2 emissions per source
Note: 2018 data. Source: IEA Note: 2018 data. Source: IEA
Emissions from producing grey hydrogen from natural gas or coal are actually greater than the
equivalent emissions from directly consuming these fossil fuels (this is because the production
process itself is energy intensive).
Greenhouse gas emissions from fossil fuels and hydrogen
Notes: BTU = British thermal unit. 1 mil. BTU = 0.025 tons of oil eq. (toe) = 1,055 mega joules (MJ). Capture rate of 56% for natural gas with CCS (carbon, capture and storage) refers to capturing only the feedstock-related CO2 whereas a capture rate of 90% for CCS is also applied to the fuel-related CO2 emissions; consumption emissions from endues conversion into energy (burning/other process); production emissions from production, processing (incl. refining), transmission, storage and distribution. Includes fugitive methane emissions as well; emissions for H2 do not cover transmission and distribution related emissions. Source: HSBC, IEA, US EIA, GEA, UNFCCC
Another avenue for lowering hydrogen production emissions is adding carbon capture and
storage (CCS) to grey hydrogen – this is ‘blue’ hydrogen and can be carbon neutral if all carbon
is captured.
52
16
1 0.1
natural gas
coal
electrolysis
water electrolysis
0
2
4
6
8
10
12
14
16
18
20
natural gas coal electrolysis waterelectrolysis
tCO2 /tH2 by source
6-22
20 18 15 3
152
67
15
80
35 8 0
93-1
14
71 73 71
53
0
40
80
120
160
Coa
l
Gas
olin
e
Die
sel
Jet F
uel
Nat
ural
Gas
Coa
l[N
o C
CS
]
Coa
l[5
6% C
CS
]
Coa
l[9
0% C
CS
]
Gas
[No
CC
S]
Gas
[56%
CC
S]
Gas
[90%
CC
S]
Wat
erE
lect
roly
sis
Production
Consumption
kgCO2e/ mil. BTU
Feedstock to H2
production(consumption emissions =0)
Using renew ableelectricity

Equities & ESG ● EM Europe 10 July 2020
6
An overview of hydrogen production routes
Type of hydrogen Grey Blue Green
Production route Natural gas reforming / coal gasification
Natural gas reforming / coal gasification + carbon capture
Electrolysis of hydrogen compounds
Cost (USD/kg) 1.0-1.5 1.5-2.5 4.0-6.0
Pro Relatively cheap, commercially widespread
Carbon neutral Zero carbon (where power source is renewable)
Con High carbon emissions High CCS investment costs High capex and water intensive
Source: HSBC
The issue with green hydrogen has always centred on unfavourable economics. In 2019, unit
production cost of green hydrogen was USD2.5-7/kg vs USD1-2/kg for grey hydrogen. BNEF
forecasts green hydrogen prices can fall to USD1.5-3/kg by 2030 and <USD1/kg by 2050.
Renewable hydrogen costs are expected to fall by 2050
Source: BNEF A major driver for the cost decline of green hydrogen is the sharp fall in electrolyser equipment
costs. Companies are ramping up to meet a rapidly growing multi-GW pipeline of electrolyser
projects. We expect capex to fall from USD1000/kW in 2019 to USD400/kW in 2040 driven by
economies of scale.
In January 2020 we had identified a 3.2GW electrolyser project pipeline with visibility to 2025.
By June that pipeline has doubled and now stands at 6.2GW, driven by recently announced
large size orders of 750-1000MW providing visibility to 2030. According to a June 2020 Wood
Mackenzie report, the project pipeline stands at 8.2GW with 2GW of unspecified orders.
Announced project pipeline- PEM electrolyser
Location Capacity (MW) Developer Start End use
Germany 10 Shell 2020 Oil refining Canada 20 Air Liquide 2020 Industry, mobility Germany 140 Linde, Siemens, VNG 2024 Industry, chemicals, oil refining, power storage Australia 300 Siemens, Hydrogen renewables Australia - Mobility, Gas grid injection UK 100 ITM Power, Ørsted - Power to gas, transport Germany 50 Vattenfall, ARGE Netz, MAN Energy - Power, industry, synthetic gas for transport Australia 1000 Macquire 2027 Industrial uses Netherlands 750 Shell, Gasunie 2027 Industrial uses France 760 ENGIE, Air Liquide 2027 Industry, mobility, energy Germany 100 BP, Evonik, Nowega, OGE & RWE 2022 Industrial use, refinery and chemicals Portugal 100 - - Industrial uses UK 250 ENGIE, ODE 2032 Power to gas
3580
Source: BNEF, Wood Mackenzie, HSBC
0
5
10
15
20
25
30
35
40
0
1
2
3
4
5
6
7
2019 2030 2050
US
D/m
mb
tu
US
D/k
g
Fossil fuel derived hydrogen Renewable derived hydrogen
7
Equities & ESG ● EM Europe 10 July 2020
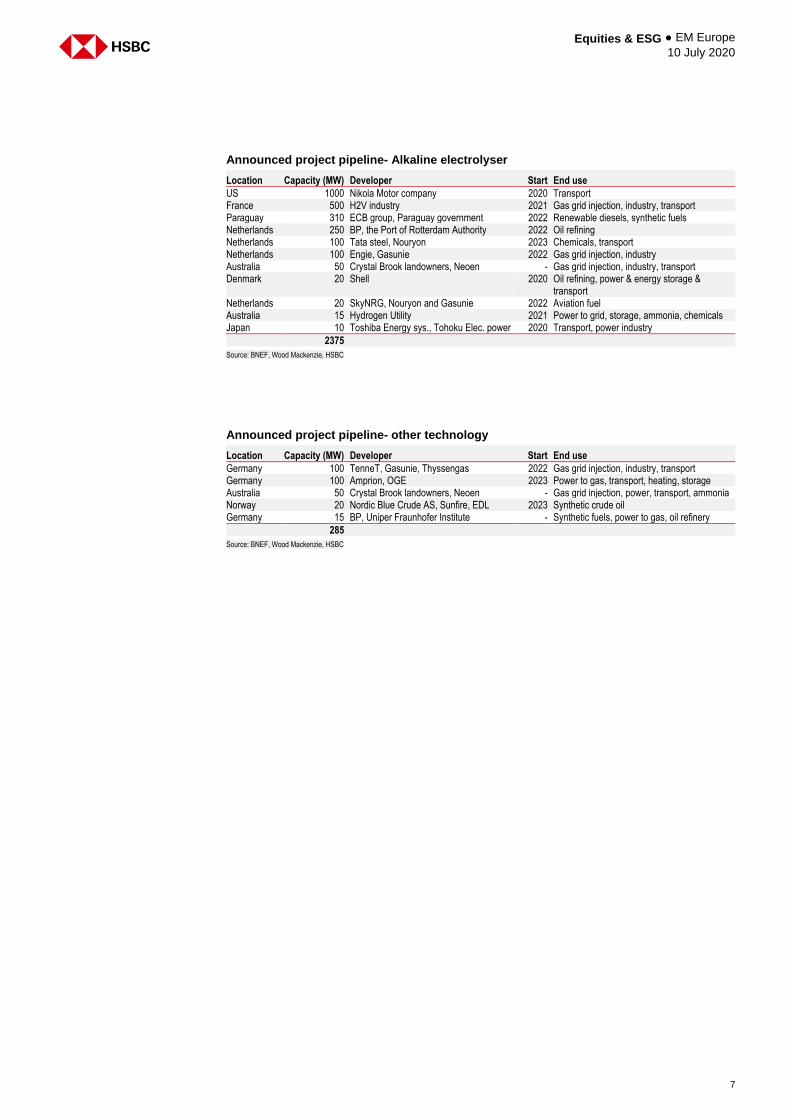
Announced project pipeline- Alkaline electrolyser
Location Capacity (MW) Developer Start End use
US 1000 Nikola Motor company 2020 Transport France 500 H2V industry 2021 Gas grid injection, industry, transport Paraguay 310 ECB group, Paraguay government 2022 Renewable diesels, synthetic fuels Netherlands 250 BP, the Port of Rotterdam Authority 2022 Oil refining Netherlands 100 Tata steel, Nouryon 2023 Chemicals, transport Netherlands 100 Engie, Gasunie 2022 Gas grid injection, industry Australia 50 Crystal Brook landowners, Neoen - Gas grid injection, industry, transport Denmark 20 Shell 2020 Oil refining, power & energy storage &
transport Netherlands 20 SkyNRG, Nouryon and Gasunie 2022 Aviation fuel Australia 15 Hydrogen Utility 2021 Power to grid, storage, ammonia, chemicals Japan 10 Toshiba Energy sys., Tohoku Elec. power 2020 Transport, power industry
2375
Source: BNEF, Wood Mackenzie, HSBC
Announced project pipeline- other technology
Location Capacity (MW) Developer Start End use
Germany 100 TenneT, Gasunie, Thyssengas 2022 Gas grid injection, industry, transport Germany 100 Amprion, OGE 2023 Power to gas, transport, heating, storage Australia 50 Crystal Brook landowners, Neoen - Gas grid injection, power, transport, ammonia Norway 20 Nordic Blue Crude AS, Sunfire, EDL 2023 Synthetic crude oil Germany 15 BP, Uniper Fraunhofer Institute - Synthetic fuels, power to gas, oil refinery
285
Source: BNEF, Wood Mackenzie, HSBC
Equities & ESG ● EM Europe 10 July 2020
8
3) Is offshore wind better suited for green hydrogen than other renewables?
Other key considerations in closing the cost gap between grey and green are: 1) electricity cost
and 2) electrolyser utilisation rate.
The unit cost of offshore wind electricity (or levelised cost of electricity – LCOE) is higher than
both solar and onshore wind today, but we expect that gap to close rapidly as larger turbines
drive better economics. At this point offshore wind will offer a better value proposition for green
hydrogen production compared to onshore and solar power thanks to its higher load factor.
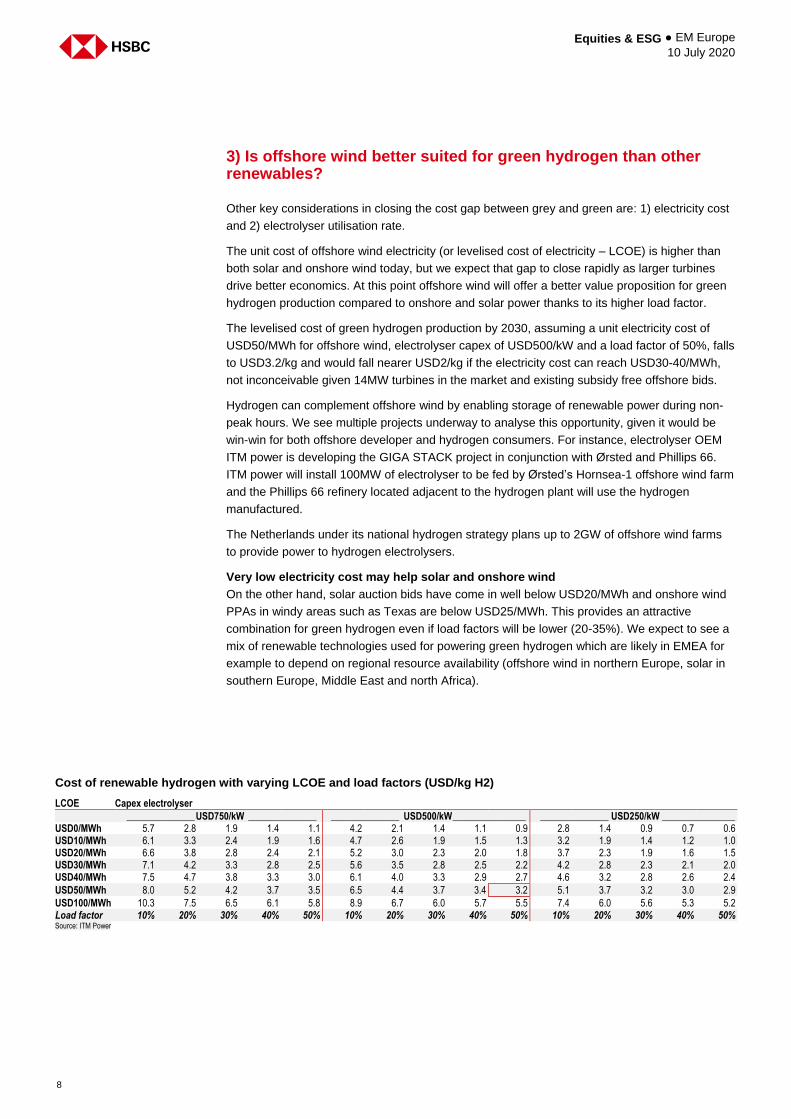
The levelised cost of green hydrogen production by 2030, assuming a unit electricity cost of
USD50/MWh for offshore wind, electrolyser capex of USD500/kW and a load factor of 50%, falls
to USD3.2/kg and would fall nearer USD2/kg if the electricity cost can reach USD30-40/MWh,
not inconceivable given 14MW turbines in the market and existing subsidy free offshore bids.
Hydrogen can complement offshore wind by enabling storage of renewable power during non-
peak hours. We see multiple projects underway to analyse this opportunity, given it would be
win-win for both offshore developer and hydrogen consumers. For instance, electrolyser OEM
ITM power is developing the GIGA STACK project in conjunction with Ørsted and Phillips 66.
ITM power will install 100MW of electrolyser to be fed by Ørsted’s Hornsea-1 offshore wind farm
and the Phillips 66 refinery located adjacent to the hydrogen plant will use the hydrogen
manufactured.
The Netherlands under its national hydrogen strategy plans up to 2GW of offshore wind farms
to provide power to hydrogen electrolysers.
Very low electricity cost may help solar and onshore wind
On the other hand, solar auction bids have come in well below USD20/MWh and onshore wind
PPAs in windy areas such as Texas are below USD25/MWh. This provides an attractive
combination for green hydrogen even if load factors will be lower (20-35%). We expect to see a
mix of renewable technologies used for powering green hydrogen which are likely in EMEA for
example to depend on regional resource availability (offshore wind in northern Europe, solar in
southern Europe, Middle East and north Africa).
Cost of renewable hydrogen with varying LCOE and load factors (USD/kg H2)
LCOE Capex electrolyser
______________ USD750/kW ______________ ______________ USD500/kW _______________ ______________ USD250/kW _______________ USD0/MWh 5.7 2.8 1.9 1.4 1.1 4.2 2.1 1.4 1.1 0.9 2.8 1.4 0.9 0.7 0.6 USD10/MWh 6.1 3.3 2.4 1.9 1.6 4.7 2.6 1.9 1.5 1.3 3.2 1.9 1.4 1.2 1.0 USD20/MWh 6.6 3.8 2.8 2.4 2.1 5.2 3.0 2.3 2.0 1.8 3.7 2.3 1.9 1.6 1.5 USD30/MWh 7.1 4.2 3.3 2.8 2.5 5.6 3.5 2.8 2.5 2.2 4.2 2.8 2.3 2.1 2.0 USD40/MWh 7.5 4.7 3.8 3.3 3.0 6.1 4.0 3.3 2.9 2.7 4.6 3.2 2.8 2.6 2.4
USD50/MWh 8.0 5.2 4.2 3.7 3.5 6.5 4.4 3.7 3.4 3.2 5.1 3.7 3.2 3.0 2.9
USD100/MWh 10.3 7.5 6.5 6.1 5.8 8.9 6.7 6.0 5.7 5.5 7.4 6.0 5.6 5.3 5.2 Load factor 10% 20% 30% 40% 50% 10% 20% 30% 40% 50% 10% 20% 30% 40% 50% Source: ITM Power
9
Equities & ESG ● EM Europe 10 July 2020
4) Will hydrogen lose out to batteries in transport?
Yes and no, we think. The table below shows the huge head start that battery electric vehicles
(BEVs) have over fuel cell electric vehicles (FCEVs) in the passenger vehicle market. Car
charging infrastructure is being rolled out and most car manufacturers have launched, or will be
launching, a BEV. The world already uses electric power for 250,000 light-duty vehicles on top
of a global passenger EV fleet of 5m+. Only Toyota and Hyundai are actively pursuing this
FCEV market.
A comparison of BEV and FCEV parameters
EV type Drivetrain Charging / refuelling Time to refill
Range Refuelling infrastructure Fleet in operation*
BEV electric motor home and public sockets 3-4 minutes 300km >500k publicly accessible charging points
5,100,000
FCEV fuel cells and electric motor hydrogen refuelling pump 1-8 hours 400km 380 refuelling stations 12,950
*YE 2018 figure. Source: IEA, E4Tech
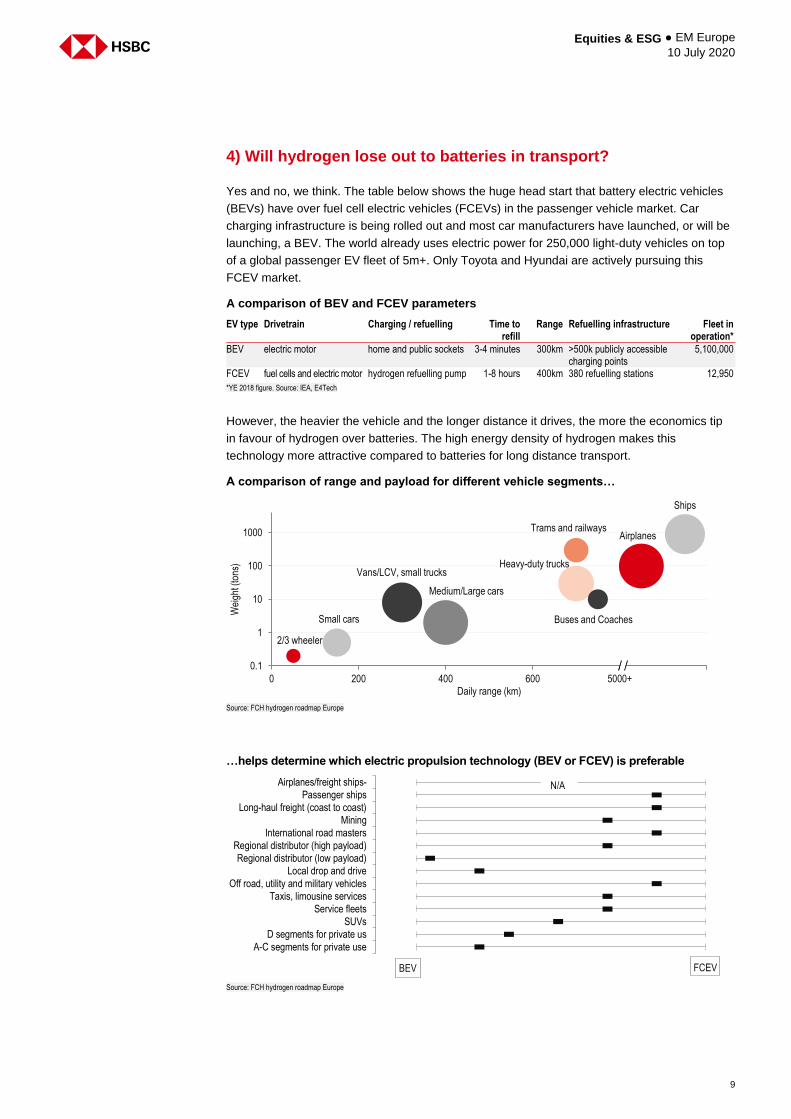
However, the heavier the vehicle and the longer distance it drives, the more the economics tip
in favour of hydrogen over batteries. The high energy density of hydrogen makes this
technology more attractive compared to batteries for long distance transport.
A comparison of range and payload for different vehicle segments…
Source: FCH hydrogen roadmap Europe
…helps determine which electric propulsion technology (BEV or FCEV) is preferable
Source: FCH hydrogen roadmap Europe
2/3 wheeler
Small cars
Vans/LCV, small trucks
Medium/Large cars
Heavy-duty trucks
Trams and railwaysAirplanes
Ships
Buses and Coaches
0.1
1
10
100
1000
0 200 400 600 5000+
Wei
ght (
tons
)
Daily range (km)
Airplanes/freight ships-
Passenger ships
Long-haul freight (coast to coast)
Mining
International road masters
Regional distributor (high payload)
Regional distributor (low payload)
Local drop and drive
Off road, utility and military vehicles
Taxis, limousine services
Service fleets
SUVs
D segments for private us
A-C segments for private use
BEV FCEV
N/A
Equities & ESG ● EM Europe 10 July 2020
10
5) Does decarbonising HGVs with hydrogen make sense?
Within the heavy goods vehicle (HGV) segment we see an emerging consensus that batteries
make sense for short- to medium-haul commercial transport but hydrogen is better suited for
long-haul.
As mentioned, the high energy density of hydrogen makes this technology more attractive
compared to batteries for long distance transport; the weight difference between a battery
electric class 8 truck and its fuel cell equivalent can be as high as 1.5 tonnes, a significant
parasitic load that would limit comparable range for the largest long-haul battery vehicles.
In addition, rapid refuelling time makes a difference for long-haul journeys, as multi-hour battery
charging breaks would increase overall transport time. Existing charging stations used for
passenger EVs may also not be sufficient to power the heavier and more energy demanding
heavy battery electric trucks.
A key issue holding back hydrogen has been the lack of refuelling infrastructure. We see
commercial and policy momentum to encourage and develop cheaper green hydrogen and to
build related infrastructure for HGVs is slowly increasing. Furthermore, as long-haul road
transport typically moves along main road arteries (c.5% of the road network), it requires far
fewer refuelling stations compared to more localised transport. This is important as hydrogen
refuelling technology is relatively immature and lacks standardisation.
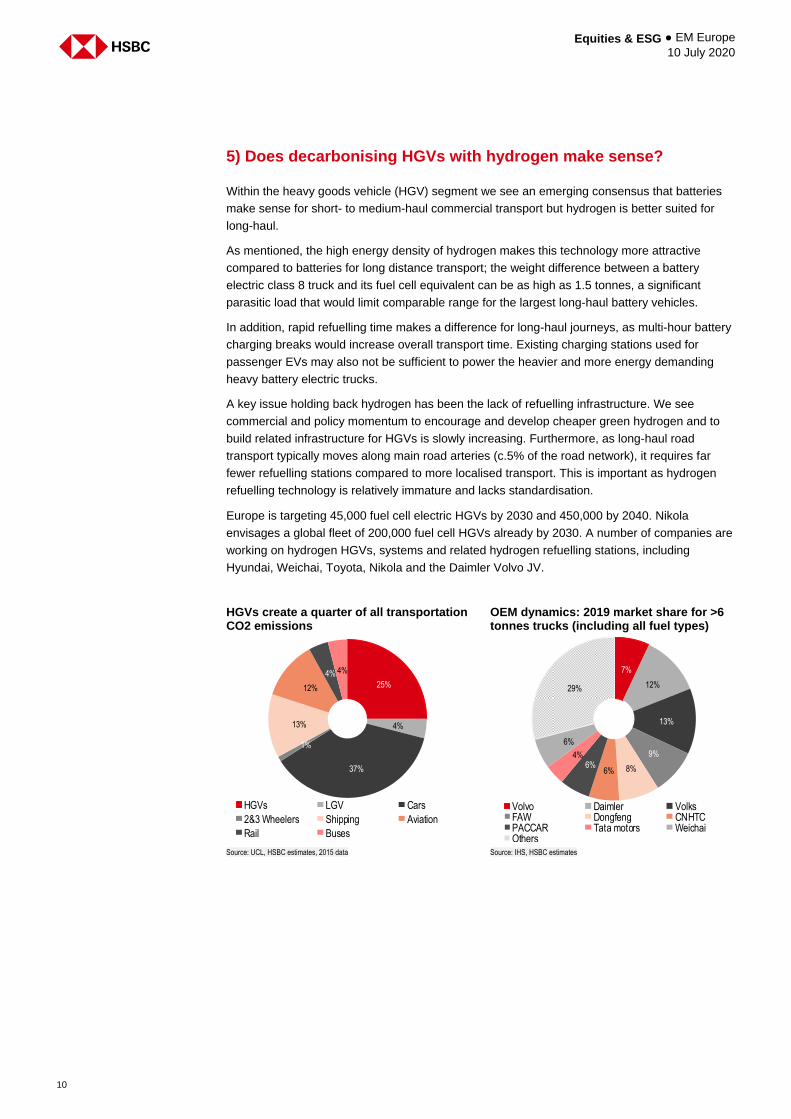
Europe is targeting 45,000 fuel cell electric HGVs by 2030 and 450,000 by 2040. Nikola
envisages a global fleet of 200,000 fuel cell HGVs already by 2030. A number of companies are
working on hydrogen HGVs, systems and related hydrogen refuelling stations, including
Hyundai, Weichai, Toyota, Nikola and the Daimler Volvo JV.
HGVs create a quarter of all transportation CO2 emissions
OEM dynamics: 2019 market share for >6 tonnes trucks (including all fuel types)
Source: UCL, HSBC estimates, 2015 data Source: IHS, HSBC estimates
25%
4%
37%
1%
13%
12%
4% 4%
HGVs LGV Cars
2&3 Wheelers Shipping Aviation
Rail Buses
7%
12%
13%
9%
8%6%6%
4%
6%
29%
Volvo Daimler VolksFAW Dongfeng CNHTCPACCAR Tata motors WeichaiOthers
11
Equities & ESG ● EM Europe 10 July 2020
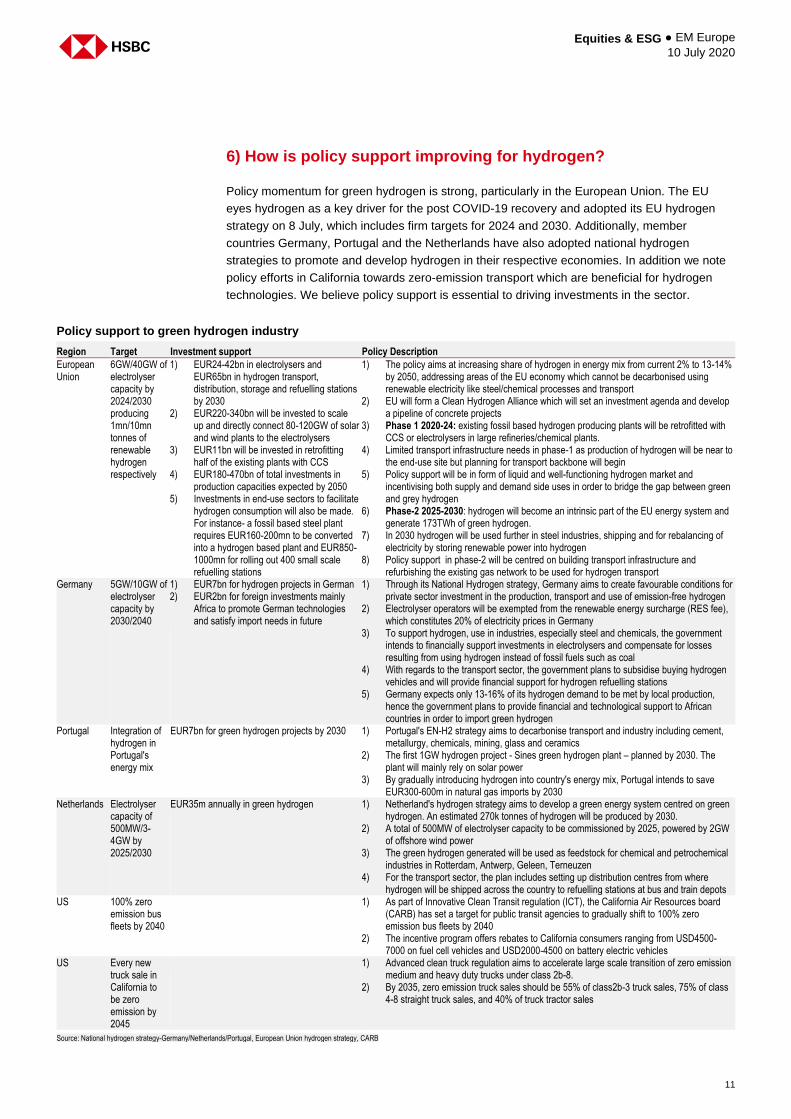
6) How is policy support improving for hydrogen?
Policy momentum for green hydrogen is strong, particularly in the European Union. The EU
eyes hydrogen as a key driver for the post COVID-19 recovery and adopted its EU hydrogen
strategy on 8 July, which includes firm targets for 2024 and 2030. Additionally, member
countries Germany, Portugal and the Netherlands have also adopted national hydrogen
strategies to promote and develop hydrogen in their respective economies. In addition we note
policy efforts in California towards zero-emission transport which are beneficial for hydrogen
technologies. We believe policy support is essential to driving investments in the sector.
Policy support to green hydrogen industry
Region Target Investment support Policy Description
European Union
6GW/40GW of electrolyser capacity by 2024/2030 producing 1mn/10mn tonnes of renewable hydrogen respectively
1) EUR24-42bn in electrolysers and EUR65bn in hydrogen transport, distribution, storage and refuelling stations by 2030
2) EUR220-340bn will be invested to scale up and directly connect 80-120GW of solar and wind plants to the electrolysers
3) EUR11bn will be invested in retrofitting half of the existing plants with CCS
4) EUR180-470bn of total investments in production capacities expected by 2050
5) Investments in end-use sectors to facilitate hydrogen consumption will also be made. For instance- a fossil based steel plant requires EUR160-200mn to be converted into a hydrogen based plant and EUR850-1000mn for rolling out 400 small scale refuelling stations
1) The policy aims at increasing share of hydrogen in energy mix from current 2% to 13-14% by 2050, addressing areas of the EU economy which cannot be decarbonised using renewable electricity like steel/chemical processes and transport
2) EU will form a Clean Hydrogen Alliance which will set an investment agenda and develop a pipeline of concrete projects
3) Phase 1 2020-24: existing fossil based hydrogen producing plants will be retrofitted with CCS or electrolysers in large refineries/chemical plants.
4) Limited transport infrastructure needs in phase-1 as production of hydrogen will be near to the end-use site but planning for transport backbone will begin
5) Policy support will be in form of liquid and well-functioning hydrogen market and incentivising both supply and demand side uses in order to bridge the gap between green and grey hydrogen
6) Phase-2 2025-2030: hydrogen will become an intrinsic part of the EU energy system and generate 173TWh of green hydrogen.
7) In 2030 hydrogen will be used further in steel industries, shipping and for rebalancing of electricity by storing renewable power into hydrogen
8) Policy support in phase-2 will be centred on building transport infrastructure and refurbishing the existing gas network to be used for hydrogen transport
Germany 5GW/10GW of electrolyser capacity by 2030/2040
1) EUR7bn for hydrogen projects in German 2) EUR2bn for foreign investments mainly
Africa to promote German technologies and satisfy import needs in future
1) Through its National Hydrogen strategy, Germany aims to create favourable conditions for private sector investment in the production, transport and use of emission-free hydrogen
2) Electrolyser operators will be exempted from the renewable energy surcharge (RES fee), which constitutes 20% of electricity prices in Germany
3) To support hydrogen, use in industries, especially steel and chemicals, the government intends to financially support investments in electrolysers and compensate for losses resulting from using hydrogen instead of fossil fuels such as coal
4) With regards to the transport sector, the government plans to subsidise buying hydrogen vehicles and will provide financial support for hydrogen refuelling stations
5) Germany expects only 13-16% of its hydrogen demand to be met by local production, hence the government plans to provide financial and technological support to African countries in order to import green hydrogen
Portugal Integration of hydrogen in Portugal's energy mix
EUR7bn for green hydrogen projects by 2030 1) Portugal's EN-H2 strategy aims to decarbonise transport and industry including cement, metallurgy, chemicals, mining, glass and ceramics
2) The first 1GW hydrogen project - Sines green hydrogen plant – planned by 2030. The plant will mainly rely on solar power
3) By gradually introducing hydrogen into country's energy mix, Portugal intends to save EUR300-600m in natural gas imports by 2030
Netherlands Electrolyser capacity of 500MW/3-4GW by 2025/2030
EUR35m annually in green hydrogen 1) Netherland's hydrogen strategy aims to develop a green energy system centred on green hydrogen. An estimated 270k tonnes of hydrogen will be produced by 2030.
2) A total of 500MW of electrolyser capacity to be commissioned by 2025, powered by 2GW of offshore wind power
3) The green hydrogen generated will be used as feedstock for chemical and petrochemical industries in Rotterdam, Antwerp, Geleen, Terneuzen
4) For the transport sector, the plan includes setting up distribution centres from where hydrogen will be shipped across the country to refuelling stations at bus and train depots
US 100% zero emission bus fleets by 2040
1) As part of Innovative Clean Transit regulation (ICT), the California Air Resources board (CARB) has set a target for public transit agencies to gradually shift to 100% zero emission bus fleets by 2040
2) The incentive program offers rebates to California consumers ranging from USD4500-7000 on fuel cell vehicles and USD2000-4500 on battery electric vehicles
US Every new truck sale in California to be zero emission by 2045
1) Advanced clean truck regulation aims to accelerate large scale transition of zero emission medium and heavy duty trucks under class 2b-8.
2) By 2035, zero emission truck sales should be 55% of class2b-3 truck sales, 75% of class 4-8 straight truck sales, and 40% of truck tractor sales
Source: National hydrogen strategy-Germany/Netherlands/Portugal, European Union hydrogen strategy, CARB

Equities & ESG ● EM Europe 10 July 2020
12
Disclosure appendix
Analyst Certification
The following analyst(s), economist(s), or strategist(s) who is(are) primarily responsible for this report, including any analyst(s)
whose name(s) appear(s) as author of an individual section or sections of the report and any analyst(s) named as the covering
analyst(s) of a subsidiary company in a sum-of-the-parts valuation certifies(y) that the opinion(s) on the subject security(ies) or
issuer(s), any views or forecasts expressed in the section(s) of which such individual(s) is(are) named as author(s), and any other
views or forecasts expressed herein, including any views expressed on the back page of the research report, accurately reflect
their personal view(s) and that no part of their compensation was, is or will be directly or indirectly related to the specific
recommendation(s) or views contained in this research report: Sean McLoughlin, Edward Perry, CFA, Ashim Paun and Davey
Jose
Important disclosures
Equities: Stock ratings and basis for financial analysis
HSBC and its affiliates, including the issuer of this report (“HSBC”) believes an investor's decision to buy or sell a stock should
depend on individual circumstances such as the investor's existing holdings, risk tolerance and other considerations and that
investors utilise various disciplines and investment horizons when making investment decisions. Ratings should not be used or
relied on in isolation as investment advice. Different securities firms use a variety of ratings terms as well as different rating
systems to describe their recommendations and therefore investors should carefully read the definitions of the ratings used in
each research report. Further, investors should carefully read the entire research report and not infer its contents from the rating
because research reports contain more complete information concerning the analysts' views and the basis for the rating.
From 23rd March 2015 HSBC has assigned ratings on the following basis:
The target price is based on the analyst’s assessment of the stock’s actual current value, although we expect it to take six to 12
months for the market price to reflect this. When the target price is more than 20% above the current share price, the stock will
be classified as a Buy; when it is between 5% and 20% above the current share price, the stock may be classified as a Buy or a
Hold; when it is between 5% below and 5% above the current share price, the stock will be classified as a Hold; when it is between
5% and 20% below the current share price, the stock may be classified as a Hold or a Reduce; and when it is more than 20%
below the current share price, the stock will be classified as a Reduce.
Our ratings are re-calibrated against these bands at the time of any 'material change' (initiation or resumption of coverage, change
in target price or estimates).
Upside/Downside is the percentage difference between the target price and the share price.
Prior to this date, HSBC’s rating structure was applied on the following basis:
For each stock we set a required rate of return calculated from the cost of equity for that stock’s domestic or, as appropriate,
regional market established by our strategy team. The target price for a stock represented the value the analyst expected the
stock to reach over our performance horizon. The performance horizon was 12 months. For a stock to be classified as Overweight,
the potential return, which equals the percentage difference between the current share price and the target price, including the
forecast dividend yield when indicated, had to exceed the required return by at least 5 percentage points over the succeeding 12
months (or 10 percentage points for a stock classified as Volatile*). For a stock to be classified as Underweight, the stock was
expected to underperform its required return by at least 5 percentage points over the succeeding 12 months (or 10 percentage
points for a stock classified as Volatile*). Stocks between these bands were classified as Neutral.
*A stock was classified as volatile if its historical volatility had exceeded 40%, if the stock had been listed for less than 12 months
(unless it was in an industry or sector where volatility is low) or if the analyst expected significant volatility. However, stocks which
we did not consider volatile may in fact also have behaved in such a way. Historical volatility was defined as the past month's
average of the daily 365-day moving average volatilities. In order to avoid misleadingly frequent changes in rating, however,
volatility had to move 2.5 percentage points past the 40% benchmark in either direction for a stock's status to change.
13
Equities & ESG ● EM Europe 10 July 2020
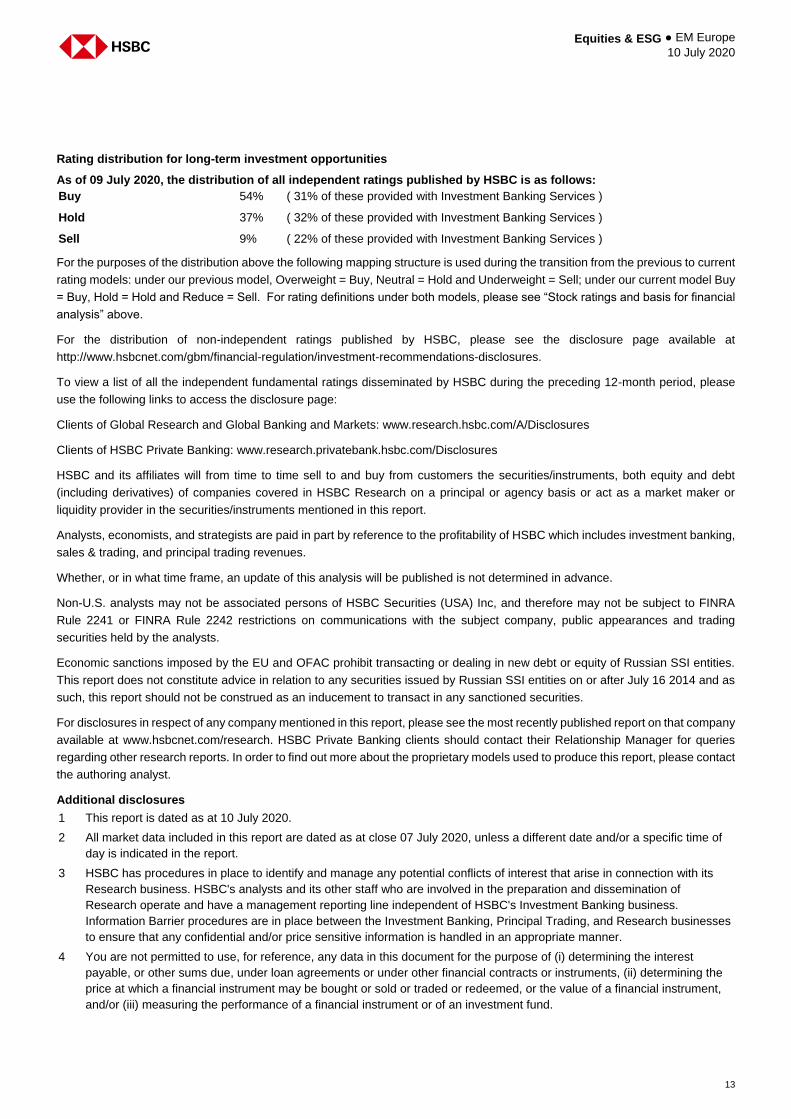
Rating distribution for long-term investment opportunities
As of 09 July 2020, the distribution of all independent ratings published by HSBC is as follows:
For the purposes of the distribution above the following mapping structure is used during the transition from the previous to current
rating models: under our previous model, Overweight = Buy, Neutral = Hold and Underweight = Sell; under our current model Buy
= Buy, Hold = Hold and Reduce = Sell. For rating definitions under both models, please see “Stock ratings and basis for financial
analysis” above.
For the distribution of non-independent ratings published by HSBC, please see the disclosure page available at
http://www.hsbcnet.com/gbm/financial-regulation/investment-recommendations-disclosures.
To view a list of all the independent fundamental ratings disseminated by HSBC during the preceding 12-month period, please
use the following links to access the disclosure page:
Clients of Global Research and Global Banking and Markets: www.research.hsbc.com/A/Disclosures
Clients of HSBC Private Banking: www.research.privatebank.hsbc.com/Disclosures
HSBC and its affiliates will from time to time sell to and buy from customers the securities/instruments, both equity and debt
(including derivatives) of companies covered in HSBC Research on a principal or agency basis or act as a market maker or
liquidity provider in the securities/instruments mentioned in this report.
Analysts, economists, and strategists are paid in part by reference to the profitability of HSBC which includes investment banking,
sales & trading, and principal trading revenues.
Whether, or in what time frame, an update of this analysis will be published is not determined in advance.
Non-U.S. analysts may not be associated persons of HSBC Securities (USA) Inc, and therefore may not be subject to FINRA
Rule 2241 or FINRA Rule 2242 restrictions on communications with the subject company, public appearances and trading
securities held by the analysts.
Economic sanctions imposed by the EU and OFAC prohibit transacting or dealing in new debt or equity of Russian SSI entities.
This report does not constitute advice in relation to any securities issued by Russian SSI entities on or after July 16 2014 and as
such, this report should not be construed as an inducement to transact in any sanctioned securities.
For disclosures in respect of any company mentioned in this report, please see the most recently published report on that company
available at www.hsbcnet.com/research. HSBC Private Banking clients should contact their Relationship Manager for queries
regarding other research reports. In order to find out more about the proprietary models used to produce this report, please contact
the authoring analyst.
Additional disclosures
1 This report is dated as at 10 July 2020.
2 All market data included in this report are dated as at close 07 July 2020, unless a different date and/or a specific time of
day is indicated in the report.
3 HSBC has procedures in place to identify and manage any potential conflicts of interest that arise in connection with its
Research business. HSBC's analysts and its other staff who are involved in the preparation and dissemination of
Research operate and have a management reporting line independent of HSBC's Investment Banking business.
Information Barrier procedures are in place between the Investment Banking, Principal Trading, and Research businesses
to ensure that any confidential and/or price sensitive information is handled in an appropriate manner.
4 You are not permitted to use, for reference, any data in this document for the purpose of (i) determining the interest
payable, or other sums due, under loan agreements or under other financial contracts or instruments, (ii) determining the
price at which a financial instrument may be bought or sold or traded or redeemed, or the value of a financial instrument,
and/or (iii) measuring the performance of a financial instrument or of an investment fund.
Buy 54% ( 31% of these provided with Investment Banking Services )
Hold 37% ( 32% of these provided with Investment Banking Services )
Sell 9% ( 22% of these provided with Investment Banking Services )

Equities & ESG ● EM Europe 10 July 2020
14
Production & distribution disclosures
1. This report was produced and signed off by the author on 09 Jul 2020 16:11 GMT.
2. In order to see when this report was first disseminated please see the disclosure page available at
https://www.research.hsbc.com/R/34/LwMW9df
15
Equities & ESG ● EM Europe 10 July 2020
Disclaimer Legal entities as at 22 June 2020
‘UAE’ HSBC Bank Middle East Limited, Dubai; ‘HK’ The Hongkong and Shanghai Banking Corporation Limited, Hong Kong;
‘TW’ HSBC Securities (Taiwan) Corporation Limited; 'CA' HSBC Securities (Canada) Inc.; HSBC France, S.A., Madrid, Milan,
Stockholm; ‘DE’ HSBC Trinkaus & Burkhardt AG, Düsseldorf; 000 HSBC Bank (RR), Moscow; ‘IN’ HSBC Securities and
Capital Markets (India) Private Limited, Mumbai; ‘JP’ HSBC Securities (Japan) Limited, Tokyo; ‘EG’ HSBC Securities Egypt
SAE, Cairo; ‘CN’ HSBC Investment Bank Asia Limited, Beijing Representative Office; The Hongkong and Shanghai Banking
Corporation Limited, Singapore Branch; The Hongkong and Shanghai Banking Corporation Limited, Seoul Securities
Branch; The Hongkong and Shanghai Banking Corporation Limited, Seoul Branch; HSBC Securities (South Africa) (Pty)
Ltd, Johannesburg; HSBC Bank plc, London, Tel Aviv; ‘US’ HSBC Securities (USA) Inc, New York; HSBC Yatirim Menkul
Degerler AS, Istanbul; HSBC México, SA, Institución de Banca Múltiple, Grupo Financiero HSBC; HSBC Bank Australia
Limited; HSBC Bank Argentina SA; HSBC Saudi Arabia Limited; The Hongkong and Shanghai Banking Corporation
Limited, New Zealand Branch incorporated in Hong Kong SAR; The Hongkong and Shanghai Banking Corporation Limited,
Bangkok Branch; PT Bank HSBC Indonesia; HSBC Qianhai Securities Limited; Banco HSBC S.A.
Issuer of report
HSBC Bank plc
8 Canada Square
London, E14 5HQ, United Kingdom
Telephone: +44 20 7991 8888
Fax: +44 20 7992 4880
Website: www.research.hsbc.com
In the UK this document has been issued and approved by HSBC Bank plc (“HSBC”) for the information of its Clients (as defined in the Rules of FCA) and those of its affiliates only. It is not
intended for Retail Clients in the UK. If this research is received by a customer of an affiliate of HSBC, its provision to the recipient is subject to the terms of business in place between the
recipient and such affiliate.
HSBC Securities (USA) Inc. accepts responsibility for the content of this research report prepared by its non-US foreign affiliate. All U.S. persons receiving and/or accessing this report and
wishing to effect transactions in any security discussed herein should do so with HSBC Securities (USA) Inc. in the United States and not with its non-US foreign affiliate, the issuer of this report.
In Singapore, this publication is distributed by The Hongkong and Shanghai Banking Corporation Limited, Singapore Branch for the general information of institutional investors or other persons
specified in Sections 274 and 304 of the Securities and Futures Act (Chapter 289) (“SFA”) and accredited investors and other persons in accordance with the conditions specified in Sections
275 and 305 of the SFA. Only Economics or Currencies reports are intended for distribution to a person who is not an Accredited Investor, Expert Investor or Institutional Investor as defined in
SFA. The Hongkong and Shanghai Banking Corporation Limited, Singapore Branch accepts legal responsibility for the contents of reports pursuant to Regulation 32C(1)(d) of the Financial
Advisers Regulations. This publication is not a prospectus as defined in the SFA. This publication is not a prospectus as defined in the SFA. It may not be further distributed in whole or in part
for any purpose. The Hongkong and Shanghai Banking Corporation Limited Singapore Branch is regulated by the Monetary Authority of Singapore. Recipients in Singapore should contact a
"Hongkong and Shanghai Banking Corporation Limited, Singapore Branch" representative in respect of any matters arising from, or in connection with this report. Please refer to The Hongkong
and Shanghai Banking Corporation Limited Singapore Branch’s website at www.business.hsbc.com.sg for contact details.
In Australia, this publication has been distributed by The Hongkong and Shanghai Banking Corporation Limited (ABN 65 117 925 970, AFSL 301737) for the general information of its “wholesale”
customers (as defined in the Corporations Act 2001). Where distributed to retail customers, this research is distributed by HSBC Bank Australia Limited (ABN 48 006 434 162, AFSL No.
232595). These respective entities make no representations that the products or services mentioned in this document are available to persons in Australia or are necessarily suitable for any
particular person or appropriate in accordance with local law. No consideration has been given to the particular investment objectives, financial situation or particular needs of any recipient.
This publication has been distributed in Japan by HSBC Securities (Japan) Limited. It may not be further distributed, in whole or in part, for any purpose. In Hong Kong, this document has been
distributed by The Hongkong and Shanghai Banking Corporation Limited in the conduct of its Hong Kong regulated business for the information of its institutional and professional customers; it
is not intended for and should not be distributed to retail customers in Hong Kong. The Hongkong and Shanghai Banking Corporation Limited makes no representations that the products or
services mentioned in this document are available to persons in Hong Kong or are necessarily suitable for any particular person or appropriate in accordance with local law. All inquiries by such
recipients must be directed to The Hongkong and Shanghai Banking Corporation Limited. In Korea, this publication is distributed by The Hongkong and Shanghai Banking Corporation Limited,
Seoul Securities Branch ("HBAP SLS") for the general information of professional investors specified in Article 9 of the Financial Investment Services and Capital Markets Act (“FSCMA”). This
publication is not a prospectus as defined in the FSCMA. It may not be further distributed in whole or in part for any purpose. HBAP SLS is regulated by the Financial Services Commission and
the Financial Supervisory Service of Korea. This publication is distributed in New Zealand by The Hongkong and Shanghai Banking Corporation Limited, New Zealand Branch incorporated in
Hong Kong SAR.
This document is not and should not be construed as an offer to sell or the solicitation of an offer to purchase or subscribe for any investment. HSBC has based this document on information
obtained from sources it believes to be reliable but which it has not independently verified; HSBC makes no guarantee, representation or warranty and accepts no responsibility or liability as to
its accuracy or completeness. The opinions contained within the report are based upon publicly available information at the time of publication and are subject to change without notice. From
time to time research analysts conduct site visits of covered issuers. HSBC policies prohibit research analysts from accepting payment or reimbursement for travel expenses from the issuer for
such visits.
Nothing herein excludes or restricts any duty or liability to a customer which HSBC has under the Financial Services and Markets Act 2000 or under the Rules of FCA and PRA. A recipient who
chooses to deal with any person who is not a representative of HSBC in the UK will not enjoy the protections afforded by the UK regulatory regime. Past performance is not necessarily a guide
to future performance. The value of any investment or income may go down as well as up and you may not get back the full amount invested. Where an investment is denominated in a currency
other than the local currency of the recipient of the research report, changes in the exchange rates may have an adverse effect on the value, price or income of that investment. In case of
investments for which there is no recognised market it may be difficult for investors to sell their investments or to obtain reliable information about its value or the extent of the risk to which it is
exposed.
In Canada, this document has been distributed by HSBC Securities (Canada) Inc. (member IIROC), and/or its affiliates. The information contained herein is under no circumstances to be
construed as investment advice in any province or territory of Canada and is not tailored to the needs of the recipient. No securities commission or similar regulatory authority in Canada has
reviewed or in any way passed judgment upon these materials, the information contained herein or the merits of the securities described herein, and any representation to the contrary is an
offense. In Brazil, this document has been distributed by Banco HSBC S.A. ("HSBC Brazil"), and/or its affiliates. As required by Instruction No. 598/18 of the Securities and Exchange Commission
of Brazil (Comissão de Valores Mobiliários), potential conflicts of interest concerning (i) HSBC Brazil and/or its affiliates; and (ii) the analyst(s) responsible for authoring this report are stated on
the chart above labelled "HSBC & Analyst Disclosures".
HSBC Bank plc is registered in England No 14259, is authorised by the Prudential Regulation Authority and regulated by the Financial Conduct Authority and the Prudential Regulation Authority
and is a member of the London Stock Exchange. (070905)
If you are an HSBC Private Banking (“PB”) customer with approval for receipt of relevant research publications by an applicable HSBC legal entity, you are eligible to receive this publication. To
be eligible to receive such publications, you must have agreed to the applicable HSBC entity’s terms and conditions (“KRC Terms”) for access to the KRC, and the terms and conditions of any
other internet banking service offered by that HSBC entity through which you will access research publications using the KRC. Distribution of this publication is the sole responsibility of the
HSBC entity with whom you have agreed the KRC Terms.
If you do not meet the aforementioned eligibility requirements please disregard this publication and, if you are a customer of PB, please notify your Relationship Manager. Receipt of research
publications is strictly subject to the KRC Terms, which can be found at https://research.privatebank.hsbc.com/ – we draw your attention also to the provisions contained in the Important Notes
section therein.
© Copyright 2020, HSBC Bank plc, ALL RIGHTS RESERVED. No part of this publication may be reproduced, stored in a retrieval system, or transmitted, on any form or by any means, electronic,
mechanical, photocopying, recording, or otherwise, without the prior written permission of HSBC Bank plc. MCI (P) 077/12/2019, MCI (P) 016/02/2020
[1150859]