Embed Size (px)
Citation preview
Global HR 2010Transformation
An ongoing journey
Conducted by SharedXpertise in association with ADP

table of contents
introduction ............................................................................ 4
about the survey...................................................................... 5
executive summary.................................................................. 6
research findings ..................................................................... 8
HR transformation status .................................................. 8
HR transformation outcomes .......................................... 12
outsourcing and shared services ..................................... 18
HR management practices .............................................. 28
about the survey participants ................................................ 30
about the research sponsors .................................................. 32
Conducted by SharedXpertise in association with ADP
introduction 4
about the survey 5
executive summary 6
research findings 8
HR transformation status 8
HR transformation outcomes 12
outsourcing and shared services 18
HR management practices 28
about the survey participants 30
about the research sponsors 32
contents
[3]
Conducted by SharedXpertise in association with ADP
introduction
[4]
one glass, two ways to see it
There are many ways to look at things, but a situation can usually be analysed by viewing it
from one of two angles: the glass is half full or it’s half empty.
In other words, look on the bright side of the story or let your less optimistic side take
control.
In fact the real choice is between the intent to get better at something or just maintain a
situation as is. What do you think we chose for ADP, a company that has been in business
for over 60 years? What could have led us to support the Global HR Transformation Report
for so many years, if not the will to understand where room for improvement exists?
What does this year’s report tell us? First of all, things are heading in the right direction. No
revolution here but a movement that has been steadily gathering momentum. Companies
around the world that embarked on HR Transformation years ago now reap the rewards of
their efforts. Regional variances still exist but those of you who have been reading the
report for several years will find concepts that were previously unfamiliar are now
conventional wisdom.
So, is HR Transformation over? It would be foolish to think so. There are in fact many
aspects yet to be examined; ideas and actions to be carefully considered that could lead to
fantastic opportunities. I am confident the HR Transformation journey is far from over.
More than ever, companies have to deal with uncertainty and new forms of competition,
and I invite you to listen carefully to how other HR professionals identify new challenges
and bring innovations. Any component of a business has the potential to play a significant
role in the changes that must be made for a company not just to survive, but to thrive.
HR plays an important role in reaching this goal. It is in our interest, as solution providers
and HR professionals, to strive to move forward together toward the goal of making HR
more agile. We may then accurately assess the resources needed to manage change, deal
with cultural differences, and define the appropriate breakout of processes to manage at
the local, regional and global levels. These are but a few examples of how to solve the
equation.
This is how HR and, more specifically HR Transformation, should be viewed: a sophisticated
equation. No one said it would be easy to figure out, nor that its components would remain
the same, but mathematics is all about defining new possibilities and transforming them
into real opportunities.
New challenges lie ahead. It is up to us to leverage this report to find innovative ways to
meet them.
I wish you a rewarding read,
Doug Cummings
Senior Vice President, Global MNC Sales
ADP Employer Services
Conducted by SharedXpertise in association with ADP
about the survey
[5]
Our survey, now in its seventh year, examines trends in human resources (HR)
transformation practices (which we define as any concerted effort to change and
improve HR operations, whether through outsourcing, shared services, internal
reengineering, or a combination of these strategies) in organisations around the
globe. The 2010 report offers a view of market trends and changes in HR
transformation, as well as a perspective on future plans.
In addition to discussing transformation status and strategy, our report addresses:
• Reasons organisations transform, and the barriers that limit their transformation
• Transformation timing, cost and satisfaction
• Engagement of external resources and experience
• Current and future transformation scope
• HR outsourcing and shared services strategy, budget and provider selection
The survey received responses from 225 executives around the globe in varying
stages of HR transformation. For a full breakdown of respondent demographics,
please visit the About the Survey Participants section of the report.
executive summary
Conducted by SharedXpertise in association with ADP [6]
HR transformation continues to take longer than anticipated.
Organisations in all regions take slightly longer to transform
than they originally anticipate, a finding that has been
consistent throughout the seven years of our research.
On average, HR leaders say HR transformation requires two to
three years; more than a quarter of organisations take more
than four years to transform HR. The top reasons
transformation is delayed are: management/leadership/
organisational changes impacted transformation progress;
and, timing and transformation is/was more complex than
expected.
And continues to generate less in savings than anticipated. At
the same time, organisations often miss their transformation
savings targets by a slim margin: whilst 62% of all respondents
anticipate savings of 6% – 25%, 57% actually achieve those
savings; another 14% anticipate the lowest level of savings
(less than 5% savings), but 20% say they actually achieve
savings in that range. Respondents in EMEA are more
aggressive than those in other regions in both their cost
savings expectations and results.
Organisations achieve the best transformation results in
organisational management areas. Survey respondents say
they perform best in aligning the organisation around
common objectives (79% of respondents say they exceed or
meet expectations in this area) and responding to
organisational changes (73% of all respondents exceed or
meet expectations). Respondents rate themselves worst at
leveraging HR transformation to free internal HR staff to focus
on strategic issues (46% say the fall below expectations in this
area) and benefiting from a new technology to empower line
management (42% say they fall below expectations in this
area).
Organisations do a good job of matching areas of importance
to performance. Generally, organisations are performing best
in the areas that they deem important, with the single
exception being the objective of freeing internal HR staff to
focus on strategic issues, which has the lowest reported
performance of all key performance areas.
HR transformation hurdles are becoming entrenched. Across
all seven years we’ve been conducting this research, the main
hurdles to HR transformation have remained unchanged, with
skills of existing HR staff at the top of the list every year.
Other top hurdles continue to include underestimation of
resources needed (52%), lack of adequate technology (41%),
and internal bureaucracy (40%).
HR outsourcing appears to be declining. Across the past three
years, the proportion of respondents who say they are
currently outsourcing or considering outsourcing HR
processes has slowly declined, from 65% in 2008 to 59% in
2009, and 54% in 2010.
Transformation is on the rise again. After a dip in 2009, HR
transformation appears to be on the rise again with 85% of all
respondents saying they are considering, in the process of, or
finished with HR transformation. In fact, although the recent
economic recession does appear to have had some impact on
HR transformation activity (many indicators were down in
2009 over 2008) there are signs of increased transformation
activity improvement in 2010 (though generally not back to
2008 levels):
• Transformation efforts overall were down in 2009,
reversing a years-long trend of growth, but on the rise
again in 2010.
• The proportion of respondents who say they are not
transforming due to cost pressures increased
significantly from 2008 to 2009,but declined from 2009
to 2010.
• Internal reengineering (versus engaging outsourcing,
shared services or some kind of hybrid approach) was up
significantly in 2009 over 2008, but it stayed virtually the
same in 2010.
Regional shifts in HR transformation may be appearing on the
horizon. On a regional basis, organisations in the Americas are
slightly more likely than their counterparts in other regions to
be engaged in HR transformation, but longitudinal research
indicates there may be changes. Our results show an increase
in HR transformation activity in Europe/Middle East/Africa
(EMEA) (75% transforming in 2008 versus 87% in 2010), and a
decline in activity in Asia Pacific (93% transforming in 2008
versus 81% in 2010), whilst the Americas remain fairly steady
at 89%.
Transformation approaches vary by region. Americas-based
organisations are most likely to employ a hybrid approach,
Asia Pacific oranisations focus on internal reengineering, and
EMEA organisations are the most varied with nearly equal
portions engaging hybrid, internal reengineering and shared
services approaches.
Top reasons organisations engage in HR transformation also
vary by region. In a departure from prior years, our 2010
research indicates different top reasons for transformation by
region:
• Americas: to align the organisation on common
objectives and to free internal HR staff to focus on
strategic issues (both selected by 56% of respondents)
• Asia Pacific: to add and/or improve service for line
management and employees or to respond to
organisational changes (both are selected by 65% of
respondents)
• EMEA: to reduce/better manage costs (62% of
respondents)
summary of 2010 findings
Conducted by SharedXpertise in association with ADP
executive summary
[7]
Even with changes across time, HR outsourcing continues to
be focused on transactional activities. Organisations in all
regions are most likely to outsource/consider outsourcing
payroll, and least likely to outsource/consider outsourcing the
entire HR function.
With HR outsourcing as a whole down, few individual
processes experience an increase in outsourcing between
2009 and 2010. The highest increase in outsourcing is in
assessment/performance appraisal, which, although
uncommon, rose from 19% to 26% between 2009 and 2010.
Payroll, the most commonly outsourced HR process, also saw
an increase, from 80% in 2009 to 84% in 2010.
Most buyers develop their own processes for identifying and
selecting their provider(s). Nearly three quarters of all
respondents say they develop and/or use their own process
to identify and select their provider(s), down from a high of
87% in 2009, but nearly equally to 2008’s 70%. 2010 saw a
decline in the use of consultants or sourcing advisors, with
36% of respondents saying they engage a consultant or
sourcing advisor versus 51% in 2009. The issuing of requests
for information (RFIs) and requests for proposals (RFPs) is also
down.
The top four provider selection criteria remain ever constant.
The top four provider selection criteria remain unchanged
over the previous four years, although they regularly change
positions. In 2010, the top provider selection criterion is
proven ability to meet service levels, followed by functional
coverage and expertise, then price followed by multi-country
capabilities. There are limited differences in the top criteria
amongst the different regions.
Organisations most often budget less than US$1M annually
for HR outsourcing. The highest percentage of respondents
(41%) budget less than US$1M annually for HR outsourcing;
another 30% budget US$1M – US$10M, and the remaining
29% budget more than US$10M. Analysis of year-over-year
HR outsourcing budgets indicates growth at both ends of the
budget scale, with an expanding proportion budgeting either
less than US$1M or more than US$11M.
Although HR outsourcing appears to be declining,
respondents say budgets are rising. In spite of the fact that a
declining percentage of respondents say they are currently
outsourcing or considering doing so, the percentage of
respondents who say their HR budgets are increasing is up:
48% of respondents say they anticipate their HR outsourcing
budgets to increase over the next three years versus 42% in
2009 (although not up to the 2008 level of 55%). Most often,
organisations say they expect budgets to increase by 10% –
24% (20% of all respondents); 17% say they anticipate an
increase of less than 10%.
The use of shared services for some transactional services
remains common. Just about two-thirds of all respondents say
they manage one or more HR process(es) through a shared
services model. As with outsourcing, organisations are more
likely to manage transactional processes – such as payroll and
HR information systems (HRIS) – in a shared services
environment than they are strategic processes. Respondents
from the Americas are more likely than are their counterparts
in other regions to manage at least one HR process through a
shared services model (71% of Americas respondents versus
56% of Asia Pacific respondents and 63% of EMEA
respondents).
HR functional management may be becoming increasingly
global. The HR function is most often centralised at a global
level, with 42% of all respondents selecting that option,
versus domestic and regional centralisation, each selected by
29% of respondents. This finding represents a change over
2009 when the split was fairly equal amongst the three
options (35% domestic, 33% regional and 32% global).
Whilst HR functions are most often centralised on a global
level, individual HR processes are most often managed on a
local level. Nearly all HR processes are most likely to be
managed locally, versus regionally or globally. Only stock
option management is just slightly more likely to be managed
on a global level than a local level.
Most organisations have a common HR information system
(HRIS). Amongst those organisations that have a common
HRIS (80% of all respondents), over a third (35%) say it is
managed at a global level; nearly as many (32%), though, say
their HRIS is managed at a domestic level. Least likely
amongst those that have a common HRIS is management at
the regional level (14% of all respondents).
research findings
Conducted by SharedXpertise in association with ADP [8]
who is transforming HR
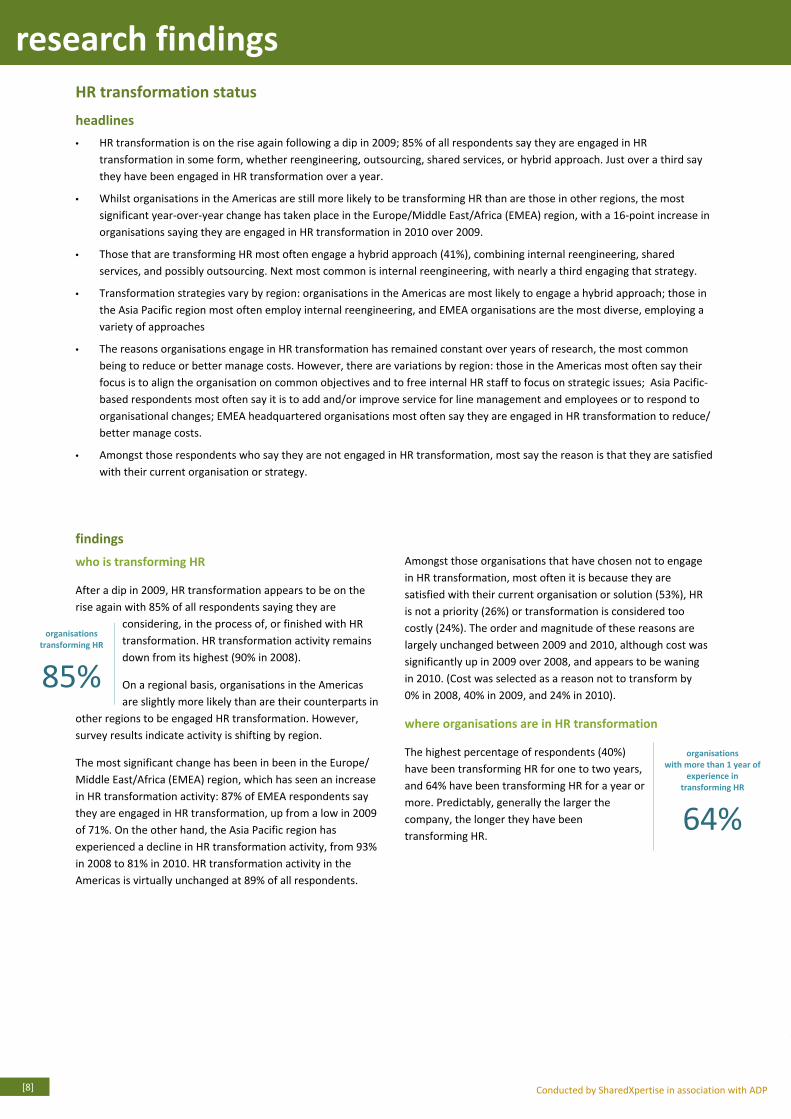
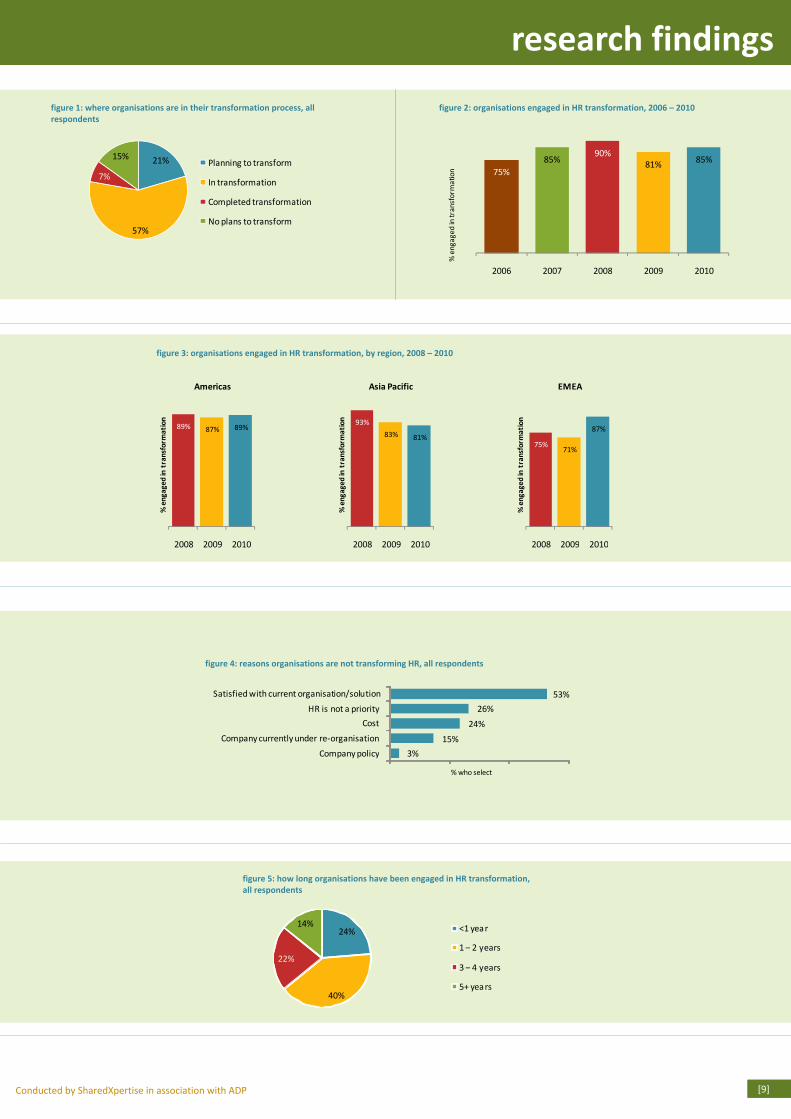
After a dip in 2009, HR transformation appears to be on the
rise again with 85% of all respondents saying they are
considering, in the process of, or finished with HR
transformation. HR transformation activity remains
down from its highest (90% in 2008).
On a regional basis, organisations in the Americas
are slightly more likely than are their counterparts in
other regions to be engaged HR transformation. However,
survey results indicate activity is shifting by region.
The most significant change has been in been in the Europe/
Middle East/Africa (EMEA) region, which has seen an increase
in HR transformation activity: 87% of EMEA respondents say
they are engaged in HR transformation, up from a low in 2009
of 71%. On the other hand, the Asia Pacific region has
experienced a decline in HR transformation activity, from 93%
in 2008 to 81% in 2010. HR transformation activity in the
Americas is virtually unchanged at 89% of all respondents.
organisations
transforming HR
85%
Amongst those organisations that have chosen not to engage
in HR transformation, most often it is because they are
satisfied with their current organisation or solution (53%), HR
is not a priority (26%) or transformation is considered too
costly (24%). The order and magnitude of these reasons are
largely unchanged between 2009 and 2010, although cost was
significantly up in 2009 over 2008, and appears to be waning
in 2010. (Cost was selected as a reason not to transform by
0% in 2008, 40% in 2009, and 24% in 2010).
where organisations are in HR transformation
The highest percentage of respondents (40%)
have been transforming HR for one to two years,
and 64% have been transforming HR for a year or
more. Predictably, generally the larger the
company, the longer they have been
transforming HR.
organisations
with more than 1 year of
experience in
transforming HR
64%
HR transformation status
• HR transformation is on the rise again following a dip in 2009; 85% of all respondents say they are engaged in HR
transformation in some form, whether reengineering, outsourcing, shared services, or hybrid approach. Just over a third say
they have been engaged in HR transformation over a year.
• Whilst organisations in the Americas are still more likely to be transforming HR than are those in other regions, the most
significant year-over-year change has taken place in the Europe/Middle East/Africa (EMEA) region, with a 16-point increase in
organisations saying they are engaged in HR transformation in 2010 over 2009.
• Those that are transforming HR most often engage a hybrid approach (41%), combining internal reengineering, shared
services, and possibly outsourcing. Next most common is internal reengineering, with nearly a third engaging that strategy.
• Transformation strategies vary by region: organisations in the Americas are most likely to engage a hybrid approach; those in
the Asia Pacific region most often employ internal reengineering, and EMEA organisations are the most diverse, employing a
variety of approaches
• The reasons organisations engage in HR transformation has remained constant over years of research, the most common
being to reduce or better manage costs. However, there are variations by region: those in the Americas most often say their
focus is to align the organisation on common objectives and to free internal HR staff to focus on strategic issues; Asia Pacific-
based respondents most often say it is to add and/or improve service for line management and employees or to respond to
organisational changes; EMEA headquartered organisations most often say they are engaged in HR transformation to reduce/
better manage costs.
• Amongst those respondents who say they are not engaged in HR transformation, most say the reason is that they are satisfied
with their current organisation or strategy.
headlines
findings
Conducted by SharedXpertise in association with ADP
research findings
[9]
figure 1: where organisations are in their transformation process, all
respondents
21%
57%
7%
15%Planning to transform
In transformation
Completed transformation
No plans to transform
75%
85%90%
81%85%
2006 2007 2008 2009 2010
% e
ng
ag
ed
in t
ran
sfo
rma
tio
n
figure 2: organisations engaged in HR transformation, 2006 – 2010
93%
83% 81%
2008 2009 2010
% e
ng
ag
ed
in t
ran
sfo
rma
tio
n
Asia Pacific
75%71%
87%
2008 2009 2010
% e
ng
ag
ed
in t
ran
sfo
rma
tio
n
EMEA
figure 3: organisations engaged in HR transformation, by region, 2008 – 2010
89% 87% 89%
2008 2009 2010
% e
ng
ag
ed
in t
ran
sfo
rma
tio
n
Americas
3%
15%
24%
26%
53%
Company policy
Company currently under re-organisation
Cost
HR is not a priority
Satisfied with current organisation/solution
% who select
figure 4: reasons organisations are not transforming HR, all respondents
24%
40%
22%
14%<1 year
1 – 2 years
3 – 4 years
5+ years
figure 5: how long organisations have been engaged in HR transformation,
all respondents
research findings
Conducted by SharedXpertise in association with ADP [10]
how organisations are transforming HR
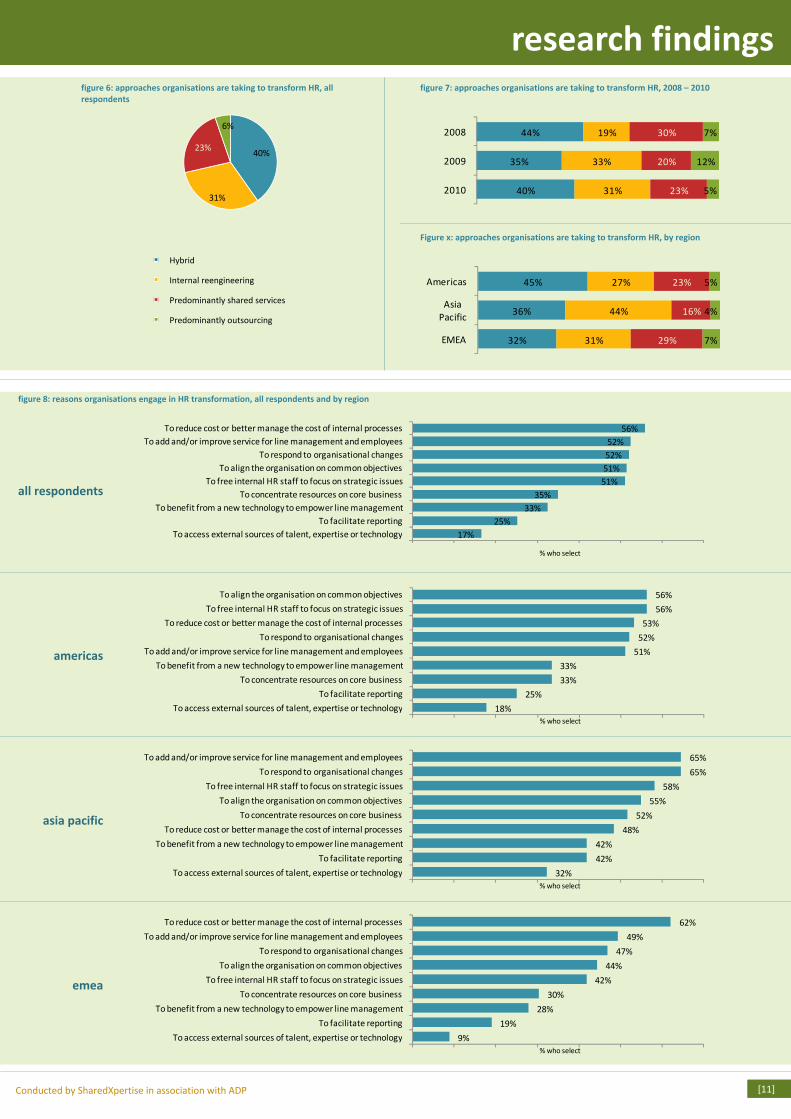
Organisations are most often transforming HR through a
hybrid approach of outsourcing, centralised services and
internal reengineering (40% selected this option). Next most
common is internal reengineering (31%), followed by a
predominantly shared services approach (23%), then by a
predominantly outsourcing approach (6%).
This pattern is somewhat similar to the approach
organisations noted in our 2009 research, when, likely due to
the global economic recession, internal reengineering jumped
from 19% of all respondents to 33%. Whilst down slightly, to
31%, in 2010, that approach remains strong. At the same
time, outsourcing rose in 2009 over 2008, but is off again in
2010.
Transformation approaches vary somewhat by region.
Organisations in the Americas are the most likely to engage in
a hybrid approach (45%), whilst those in the Asia Pacific
region are most likely to engage in internal reengineering
(44%). Organisations headquartered in EMEA are much more
diverse in their approach, with nearly equal portions engaging
in hybrid (32%), internal reengineering (31%) and shared
services (29%) approaches. In all regions, a transformation
approach based predominantly on outsourcing is uncommon.
why organisations are transforming HR
The main reasons organisations transform HR have remained
fairly constant over the past several years, with reducing/
better managing costs the top reason (56% select this option
on 2010), as it has been for all but one year. (2008, when cost
reduction/management dropped to number three, appears to
have been an anomaly.) Other top reasons to transform HR
(also consistent across the years) are adding/improving
service for line managers and employees (52%), responding to
organisational changes (52%), aligning the organisation on
common objectives (51%), and freeing internal HR staff to
focus on strategic issues (51%).
Unlike in years past, this year’s results indicate some variation
in response by region. Respondents from organisations based
in the Americas most often say they are engaged in HR
transformation to align the organisation on common
objectives and to free internal HR staff to focus on strategic
issues (both are selected by 56% of respondents). Asia Pacific-
based respondents most often say they are engaged in HR
transformation to add and/or improve service for line
management and employees or to respond to organisational changes (both are selected by 65% of Asia Pacific
respondents). EMEA headquartered organisations most often
say they are engaged in HR transformation to reduce/better
manage costs (62% of EMEA respondents).
HR transformation status, continued
findings
Conducted by SharedXpertise in association with ADP
research findings
[11]
40%
31%
23%
6%
figure 6: approaches organisations are taking to transform HR, all
respondents
40%
35%
44%
31%
33%
19%
23%
20%
30%
5%
12%
7%
2010
2009
2008
figure 7: approaches organisations are taking to transform HR, 2008 – 2010
32%
36%
45%
31%
44%
27%
29%
16%
23%
7%
4%
5%
EMEA
Asia
Pacific
Americas
Figure x: approaches organisations are taking to transform HR, by region
18%
25%
33%
33%
51%
52%
53%
56%
56%
To access external sources of talent, expertise or technology
To facilitate reporting
To concentrate resources on core business
To benefit from a new technology to empower line management
To add and/or improve service for line management and employees
To respond to organisational changes
To reduce cost or better manage the cost of internal processes
To free internal HR staff to focus on strategic issues
To align the organisation on common objectives
% who select
32%
42%
42%
48%
52%
55%
58%
65%
65%
To access external sources of talent, expertise or technology
To facilitate reporting
To benefit from a new technology to empower line management
To reduce cost or better manage the cost of internal processes
To concentrate resources on core business
To align the organisation on common objectives
To free internal HR staff to focus on strategic issues
To respond to organisational changes
To add and/or improve service for line management and employees
% who select
9%
19%
28%
30%
42%
44%
47%
49%
62%
To access external sources of talent, expertise or technology
To facilitate reporting
To benefit from a new technology to empower line management
To concentrate resources on core business
To free internal HR staff to focus on strategic issues
To align the organisation on common objectives
To respond to organisational changes
To add and/or improve service for line management and employees
To reduce cost or better manage the cost of internal processes
% who select
figure 8: reasons organisations engage in HR transformation, all respondents and by region
Hybrid
Internal reengineering
Predominantly shared services
Predominantly outsourcing
americas
all respondents
asia pacific
emea
17%
25%
33%
35%
51%
51%
52%
52%
56%
To access external sources of talent, expertise or technology
To facilitate reporting
To benefit from a new technology to empower line management
To concentrate resources on core business
To free internal HR staff to focus on strategic issues
To align the organisation on common objectives
To respond to organisational changes
To add and/or improve service for line management and employees
To reduce cost or better manage the cost of internal processes
% who select
research findings
Conducted by SharedXpertise in association with ADP [12]
time and savings
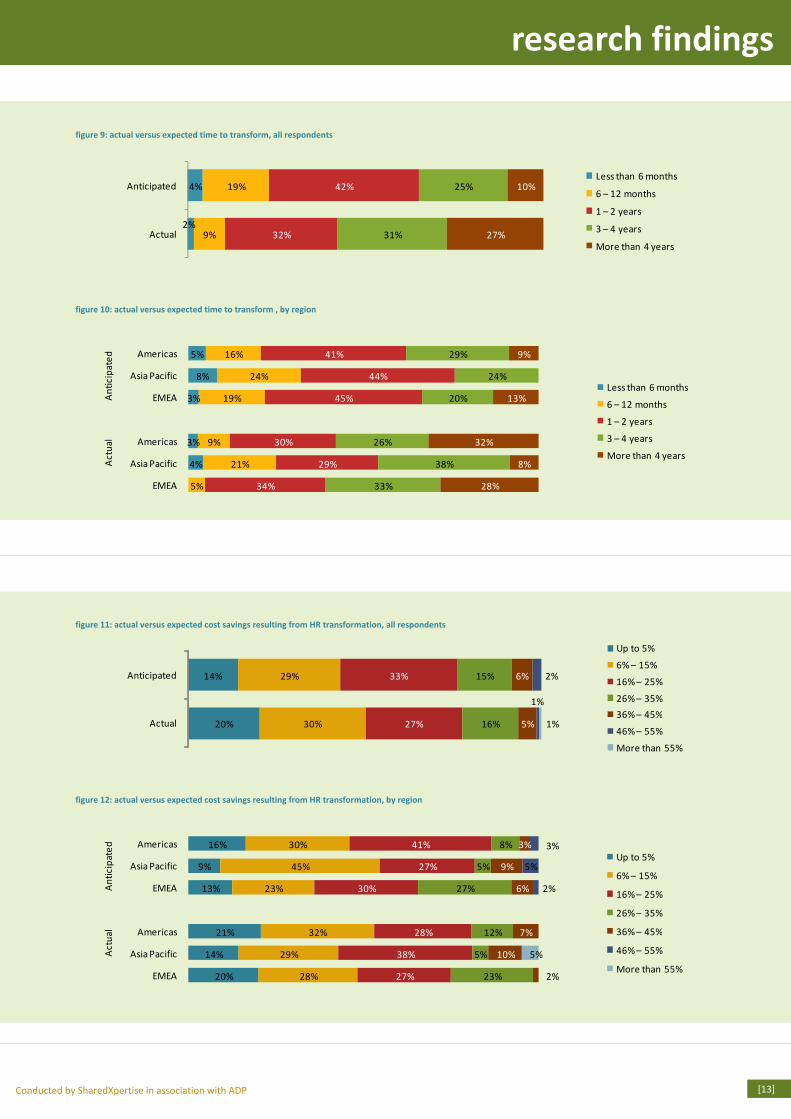
HR transformation takes slightly longer than anticipated to
achieve, a result we have found throughout the seven years
we have conducted this research. Across all
respondents, those responsible for HR
transformation most often anticipate
transformation taking one to two years (42% of
respondents), whilst 32% actually achieve that
result. Another quarter (25%) expect
transformation to require three to four years, whilst 31%
actually take that amount of time; and only 10% anticipate
taking more than four years, whilst more than a quarter (27%)
actually require that amount of time. The remaining 23%
anticipate transformation taking a year or less; only 11%
actually achieve transformation in the timeframe.
Organisations in different regions tend to follow similar
patterns as the overall response, although Asia Pacific
organisations appear to be more aggressive in both
anticipated and actual transformation timing.
The most common reasons respondents cite for taking longer
than anticipated to achieve HR transformation include:
• Management/leadership/organisational changes impacted transformation progress and timing.
• Transformation is/was more complex than expected.
• Staff turnover impacts(ed) transformation progress and timing.
• The staff is/was too stretched to focus on transformation
• Competing priorities impacts(ed) transformation progress and timing.
As with time-to-transform results, organisations often miss
their cost savings expectations by a slim margin. A majority of
respondents (62%) anticipate savings of 6% – 25% (the
highest portion anticipating savings of 16% – 25%), but 57%
actually achieve those savings. Whilst 14% anticipate the
lowest level of savings (less than 5% savings), 20% say they
actually achieve savings in that range. On the other end of the
scale, however, virtually the same proportion of respondents
anticipate and achieve savings of more than 35% (8%
anticipate those savings; 7% achieve them).
Again here, whilst organisations in different
regions generally follow similar patterns, there
are regional differences. EMEA organisations
tend to be most aggressive in their planning, with
just over a third (35%) anticipating savings of
more than 25% (versus 19% and 14% of Asia
Pacific and Americas respondents, respectively,
anticipating this level of savings).
Interestingly, whilst a higher proportion of EMEA respondents
actually achieve savings of more than 25% (25% of EMEA
respondents say they achieve that level of savings, versus 20%
of Asia Pacific and 19% of Americas respondents), that means
EMEA respondents are generally underperforming their
expectations, whilst Americas and Asia Pacific respondents
are outperforming their expectations, even if only slightly.
HR transformation outcomes
• HR transformation takes slightly longer and generates slightly less savings than first anticipated, a finding that has remained
unchanged across seven years of research.
• Organisations cite management/leadership/organisational changes as the top reason for slower-than-expected results.
• Organisations realise the best results from HR transformation in organisational management areas, and the worst results in
leveraging HR staff into more strategic areas.
• On the whole, respondents do not appear terribly happy with their HR transformation performance overall. On a 5-point
scale, the highest performing area (adding and/or improving service for line management and employees) achieves only a
2.89 score.
• That said, organisations generally report performing better in areas that they deem important and less well in areas they
deem unimportant, so it appears focus and resourcing are being thoughtfully applied.
• The main hurdles to successful HR transformation remain unchanged over the years, with skills of existing HR staff perpetually
topping the list. In the 2010 research the next most common hurdle is underestimating the resources needed to transform.
headlines
findings
average number of
years to transform
2-3
average cost savings
16%-
25%
Conducted by SharedXpertise in association with ADP
research findings
[13]
2%
4%
9%
19%
32%
42%
31%
25%
27%
10%
Actual
AnticipatedLess than 6 months
6 – 12 months
1 – 2 years
3 – 4 years
More than 4 years
4%
3%
3%
8%
5%
5%
21%
9%
19%
24%
16%
34%
29%
30%
45%
44%
41%
33%
38%
26%
20%
24%
29%
28%
8%
32%
13%
9%
EMEA
Asia Pacific
Americas
EMEA
Asia Pacific
Americas
Ac
tua
lA
nti
cip
ate
d
Less than 6 months
6 – 12 months
1 – 2 years
3 – 4 years
More than 4 years
figure 9: actual versus expected time to transform, all respondents
figure 10: actual versus expected time to transform , by region
20%
14%
30%
29%
27%
33%
16%
15%
5%
6%
1%
2%
1%Actual
Anticipated
Up to 5%
6% – 15%
16% – 25%
26% – 35%
36% – 45%
46% – 55%
More than 55%
20%
14%
21%
13%
9%
16%
28%
29%
32%
23%
45%
30%
27%
38%
28%
30%
27%
41%
23%
5%
12%
27%
5%
8%
2%
10%
7%
6%
9%
3%
2%
5%
3%
5%
EMEA
Asia Pacific
Americas
EMEA
Asia Pacific
Americas
Ac
tua
lA
nti
cip
ate
d
Up to 5%
6% – 15%
16% – 25%
26% – 35%
36% – 45%
46% – 55%
More than 55%
figure 11: actual versus expected cost savings resulting from HR transformation, all respondents
figure 12: actual versus expected cost savings resulting from HR transformation, by region
research findings
Conducted by SharedXpertise in association with ADP [14]
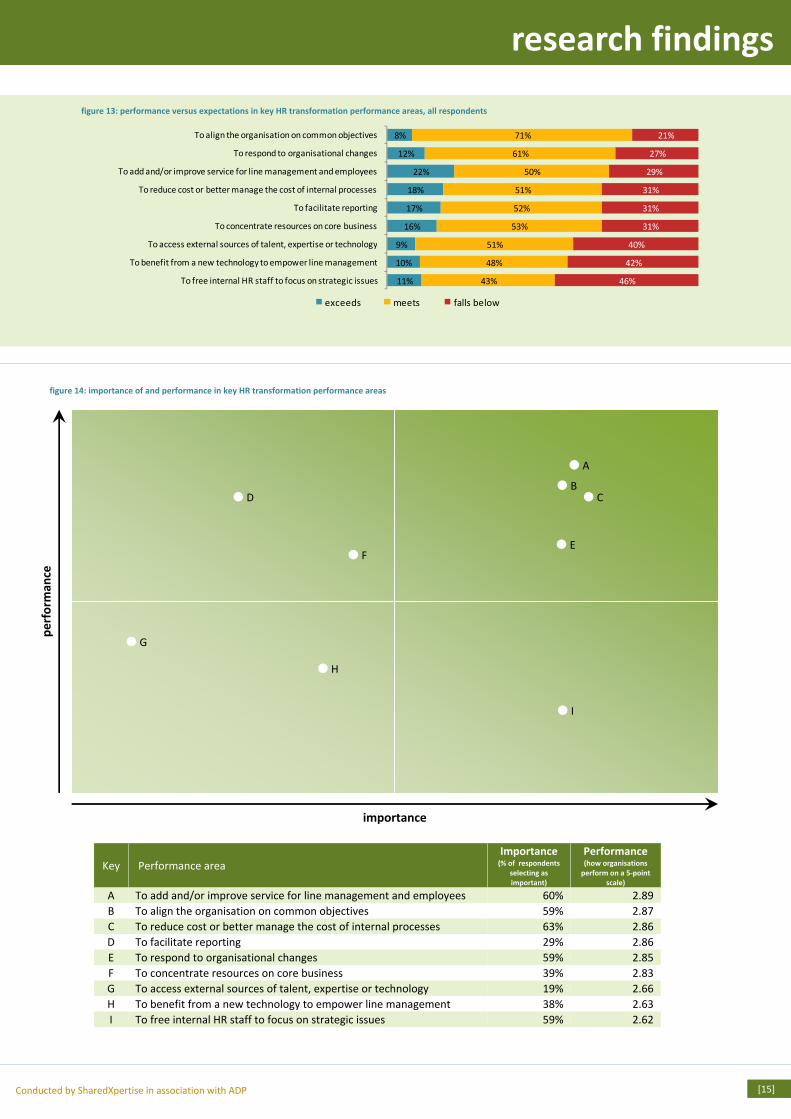
outcomes versus expectations
Similar to prior years, respondents report best results from
their HR transformation efforts in organisational management
areas, including aligning the organisation around common
objectives (79% of respondents say they exceed or meet
expectations in this area) and responding to organisational
changes (73% meet or exceed expectations in this area).
Respondents say they most often exceed expectations in
adding or improving service for
line management and employees;
22% of all respondents say they
have exceeded expectations in
that area.
On the other hand, respondents rate themselves worst at
leveraging HR transformation to free internal HR staff to focus
on strategic issues (46% say the fall below expectations in this
area) and benefiting from a new technology to empower line
management (42% say they fall below expectations in this
area); 40% of respondents also say they are failing to access
external sources of talent, expertise or technology.
Applying a 5-point scale to respondents’ performance (where
performance that is far below expectations=1, and
performance that far exceeds expectations=5), on the whole
respondents are not terribly happy with their performance.
The highest performing reported area, adding and/or
improving service for line management and employees,
achieves only 2.89 points on the 5-point scale. The
performance band is fairly narrow, though, as the lowest
performing area, freeing internal HR staff to focus on strategic
issues, scores 2.62 points on the 5-point scale.
That said, organisations appear to be doing a reasonably good
job of matching areas of importance (see the why
organisations are transforming section) to performance.
Generally, organisations are performing best in the areas that
they deem important, with the single exception being the
objective of freeing internal HR staff to focus on strategic
issues, which has the lowest reported performance of all key
performance areas.
HR transformation outcomes, continued
findings
best results in HR transformation
organisational management
worst results in HR transformation
freeing HR staff to focus on
strategic issues
Conducted by SharedXpertise in association with ADP
research findings
[15]
11%
10%
9%
16%
17%
18%
22%
12%
8%
43%
48%
51%
53%
52%
51%
50%
61%
71%
46%
42%
40%
31%
31%
31%
29%
27%
21%
To free internal HR staff to focus on strategic issues
To benefit from a new technology to empower line management
To access external sources of talent, expertise or technology
To concentrate resources on core business
To facilitate reporting
To reduce cost or better manage the cost of internal processes
To add and/or improve service for line management and employees
To respond to organisational changes
To align the organisation on common objectives
exceeds meets falls below
figure 13: performance versus expectations in key HR transformation performance areas, all respondents
A
importance
pe
rfo
rma
nce
figure 14: importance of and performance in key HR transformation performance areas
Performance area
Importance (% of respondents
selecting as
important)
Performance (how organisations
perform on a 5-point
scale)
To add and/or improve service for line management and employees 60% 2.89
To align the organisation on common objectives 59% 2.87
To reduce cost or better manage the cost of internal processes 63% 2.86
To facilitate reporting 29% 2.86
To respond to organisational changes 59% 2.85
To concentrate resources on core business 39% 2.83
To access external sources of talent, expertise or technology 19% 2.66
To benefit from a new technology to empower line management 38% 2.63
To free internal HR staff to focus on strategic issues 59% 2.62
Key
A
B
C
D
E
F
G
H
I
B C D
E F
G
H
I
research findings
Conducted by SharedXpertise in association with ADP [16]
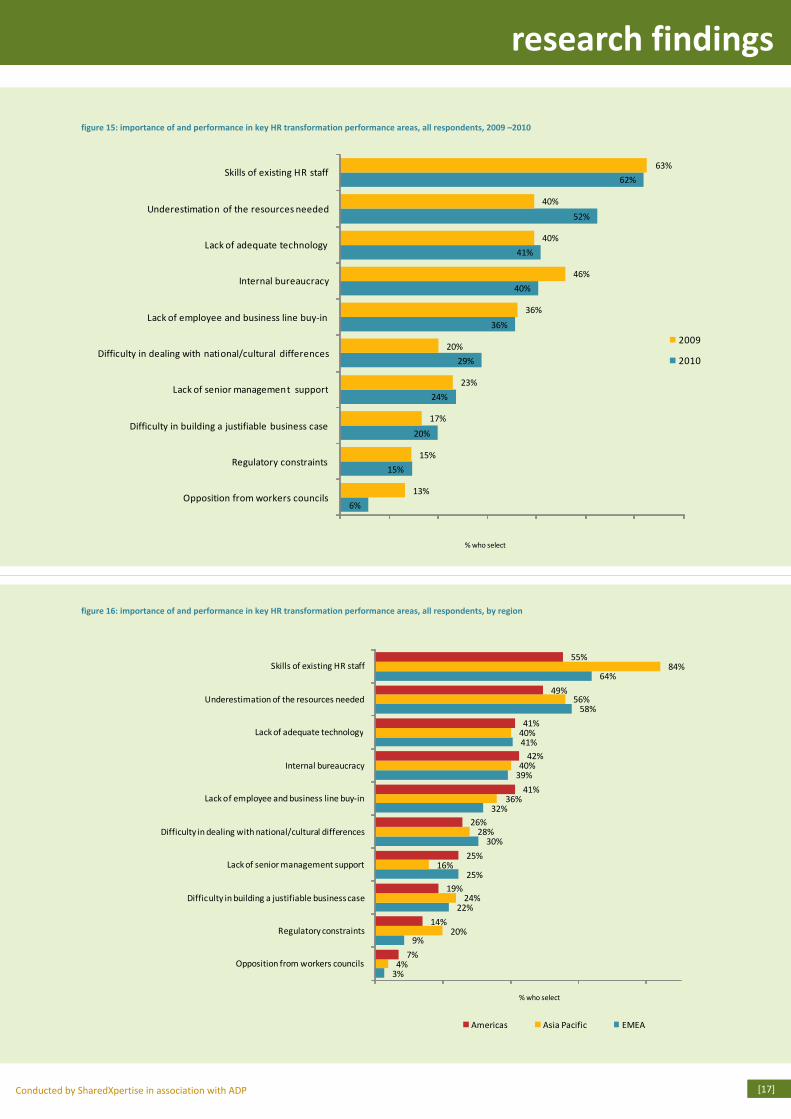
hurdles to HR transformation
Across all seven years we’ve been conducting this research,
the main hurdles to HR transformation have remained
unchanged, with skills of existing HR staff at the top of the list
every year. Other top hurdles continue to include
underestimation of resources needed (52% selected this
hurdle), lack of adequate technology (41% selected this
hurdle), and internal bureaucracy (40% selected this hurdle).
In 2009, we noted a reversal of a trend that we had seen in
prior years: for the first time it appeared that some hurdles
were declining. In 2008 we noted that 7 of the 10 identified
hurdles received higher responses between 2006 and 2008. In
2009, all but one (opposition from worker’s councils – and
that had only a very slight increase) experienced a decrease
(meaning fewer respondents selected almost every hurdle in
2009 versus what they noted in prior years). The 2010 results
do not carry forward that trend; instead, we see a mixed bag,
with some hurdles declining whilst others are increasing.
Overall, the proportion of respondents who selected skills of
existing HR staff is virtually unchanged (62% in 2010; 63% in
2009). Underestimation of resources needed grew the most,
with 52% selecting this hurdle in 2010 versus 40% in 2009.
Difficulty in dealing with national/cultural differences grew by
9 percentage points, from 20% in 2009 to 29% in 2010.
Opposition from workers’ councils, never selected by many
respondents from the start, dropped the most, from 13% in
2009 to 6% in 2010. Internal bureaucracy dropped by 6
points, from 46% in 2009 to 40% in 2010.
Regional differences in hurdles to HR transformation are fairly
limited, with all three regions selecting the same two top
hurdles: skills of existing HR staff as the number one (55% of
Americas respondents; 84% of Asia Pacific respondents; 64%
of EMEA respondents), and underestimation of the resources
needed as number two (49% of Americas respondents; 56% of
Asia Pacific respondents; 58% of EMEA respondents).
HR transformation outcomes, continued
findings
Conducted by SharedXpertise in association with ADP
research findings
[17]
6%
15%
20%
24%
29%
36%
40%
41%
52%
62%
13%
15%
17%
23%
20%
36%
46%
40%
40%
63%
Opposition from workers councils
Regulatory constraints
Difficulty in building a justifiable business case
Lack of senior management support
Difficulty in dealing with national/cultural differences
Lack of employee and business line buy-in
Internal bureaucracy
Lack of adequate technology
Underestimation of the resources needed
Skills of existing HR staff
% who select
2009
2010
figure 15: importance of and performance in key HR transformation performance areas, all respondents, 2009 –2010
3%
9%
22%
25%
30%
32%
39%
41%
58%
64%
7%
14%
19%
25%
26%
41%
42%
41%
49%
55%
4%
20%
24%
16%
28%
36%
40%
40%
56%
84%
Opposition from workers councils
Regulatory constraints
Difficulty in building a justifiable business case
Lack of senior management support
Difficulty in dealing with national/cultural differences
Lack of employee and business line buy-in
Internal bureaucracy
Lack of adequate technology
Underestimation of the resources needed
Skills of existing HR staff
% who select
Americas Asia Pacific EMEA
figure 16: importance of and performance in key HR transformation performance areas, all respondents, by region
research findings
Conducted by SharedXpertise in association with ADP [18]
outsourcing and shared services
• Across the last three years, the proportion of respondents who say they are currently outsourcing HR services or plan to
outsource them has declined, from 65% (in 2008) to 54% (in 2010).
• Whilst outsourcing remains more common in organisations in the Americas than in other regions, American organisations
have experienced the greatest decline in percentage who say they are outsourcing or plan to outsource HR processes.
• Although HR outsourcing is down as a whole, a few individual processes experienced an increase in outsourcing between 2009
and 2010; the highest increase is in assessment/performance appraisal, rising from 19% in 2009 to 26% of respondents in
2010 saying they are/are considering outsourcing. Payroll also saw an increase, from 80% in 2009 to 84% in 2010.
• The greatest declines were in leave administration (52% in 2009; 34% in 2010) and recruitment/selection (47% in 2009; 37% in
2010).
• Health and welfare benefits show the greatest variation amongst regions, with 82% of Asia Pacific organisations outsourcing/
considering outsourcing the process, versus Americas organisations (62% of respondents) and EMEA orgnisations (50% of
respondents). • Nearly three quarters (73%) of all respondents say they develop and/or use their own process to identify and select their
provider(s); the last three years has seen a decline in the use of consultants or sourcing advisors, from 49% in 2008 to 36% in
2010.
• The issuing of both requests for information (RFIs) and request for proposals (RFPs) is down in 2010 over 2009 (RFIs: 65% in
2009 to 51% in 2010; RFPs: 76% in 2009 to 65% in 2010).
• The top outsourcing provider selection criterion is proven ability to meet service levels, followed by functional coverage and
expertise, then price followed by multi-country capabilities. Amongst the three regions, all rank the same criteria in the top
three, although in different orders. • Organisations most often budget less than US$1M annually for HR outsourcing (41% of all respondents), followed by US$1M –
US$10M (30% of all respondents).
• Analysis of year-over-year HR outsourcing budgets indicates growth at both ends of the budget scale, with an expanding
proportion budgeting either less than US$1M or more than US$11M.
• Nearly half of all respondents (48%) say they expect to increase HR outsourcing budgets over the next three years, most often
by up to 24%. That proportion of respondents shows an increase over 2009, when it was 42%, but still does not match 2008’s
55%.
• In spite of the fact that a smaller percentage say they are currently outsourcing or anticipate outsourcing HR services, over the
last two years we have seen a significant decline in the proportion of respondents who say they anticipate their HR
outsourcing budgets to decrease, coupled with a significant increase in the proportion of organisations that anticipate their
budgets to stay the same.
• Just about two-thirds of all respondents (66%) say they manage one or more HR process(es) through a shared services model,
a proportion that is essentially unchanged from 2009’s 68%.
headlines
Conducted by SharedXpertise in association with ADP
research findings
[19]
year all americas asia pacific emea
2008 % outsourcing HR
processes 65% 83% 33% 60%
2009 % outsourcing HR
processes 59% 64% 56% 56%
2010 % outsourcing HR
processes 54% 60% 42% 54%
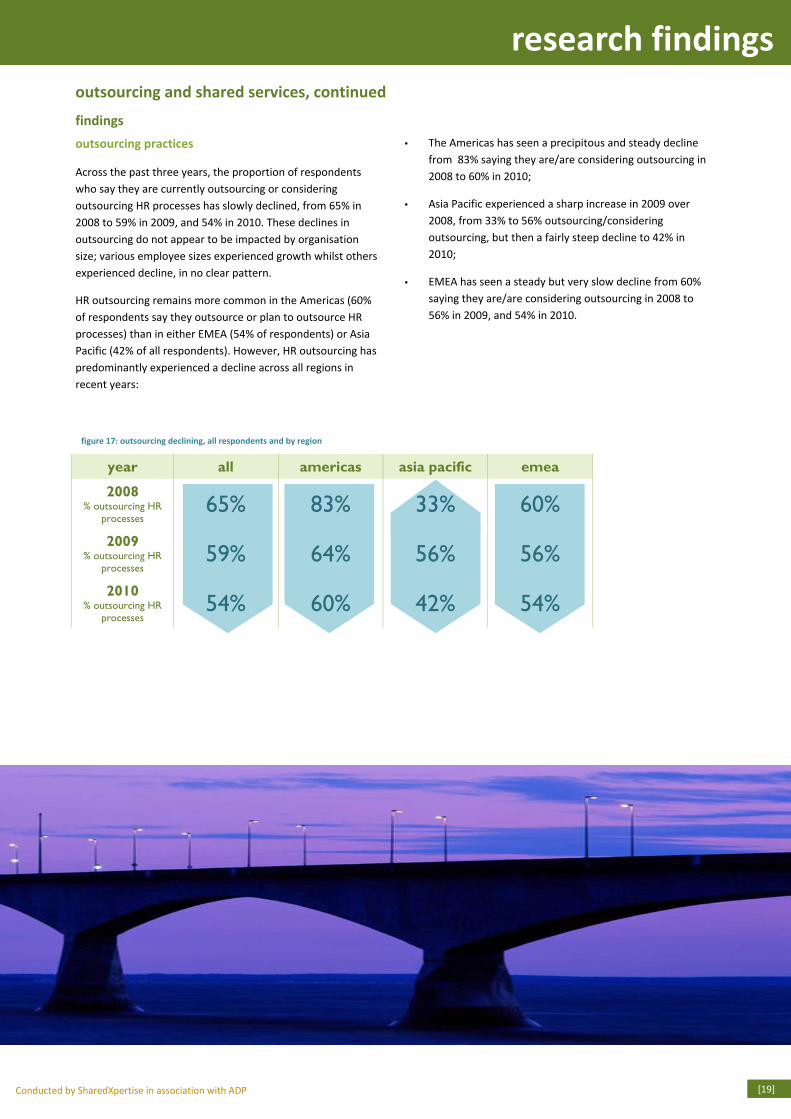
figure 17: outsourcing declining, all respondents and by region
outsourcing practices
Across the past three years, the proportion of respondents
who say they are currently outsourcing or considering
outsourcing HR processes has slowly declined, from 65% in
2008 to 59% in 2009, and 54% in 2010. These declines in
outsourcing do not appear to be impacted by organisation
size; various employee sizes experienced growth whilst others
experienced decline, in no clear pattern.
HR outsourcing remains more common in the Americas (60%
of respondents say they outsource or plan to outsource HR
processes) than in either EMEA (54% of respondents) or Asia
Pacific (42% of all respondents). However, HR outsourcing has
predominantly experienced a decline across all regions in
recent years:
• The Americas has seen a precipitous and steady decline
from 83% saying they are/are considering outsourcing in
2008 to 60% in 2010;
• Asia Pacific experienced a sharp increase in 2009 over
2008, from 33% to 56% outsourcing/considering
outsourcing, but then a fairly steep decline to 42% in
2010;
• EMEA has seen a steady but very slow decline from 60%
saying they are/are considering outsourcing in 2008 to
56% in 2009, and 54% in 2010.
findings
outsourcing and shared services, continued
research findings
Conducted by SharedXpertise in association with ADP [20]
outsourcing practices, continued
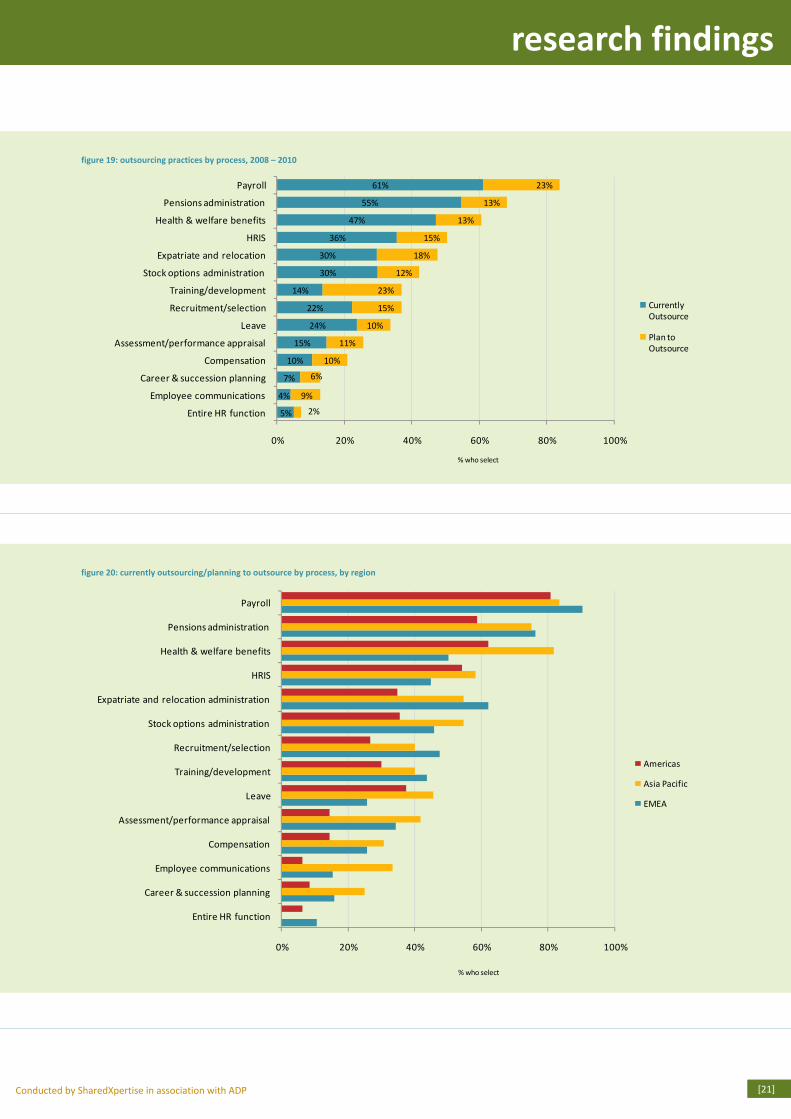
Transactional processes are more likely to be outsourced,
whilst strategic processes are more often retained in house, a
finding that has been consistent across all years we have
conducted this research. With HR outsourcing as a whole
down, a few individual processes experienced an increase in
outsourcing between 2009 and 2010. The highest increase in
outsourcing is in assessment/performance appraisal; although
still uncommon, it rose from 19% in 2009 to 26% of
respondents in 2010 saying they are/are considering
outsourcing. Payroll, always the most commonly outsourced
HR process, also saw an increase, from 80% in 2009 to 84% in
2010.
Leave administration saw the greatest decline, falling from
52% in 2009 to 34% in 2010. Recruitment/selection also saw a
decline, down from 47% in 2009 from 37% in 2010.
Organisations in all regions are most likely to outsource/
consider outsourcing payroll, and least likely to outsource/
consider outsourcing the entire HR function. Health and
welfare benefits show the greatest variation amongst regions,
with 82% of Asia Pacific organisations outsourcing/
considering outsourcing the process, versus Americas
organisations (62% of respondents) and EMEA orgnisations
(50% of respondents). EMEA organisations are more likely to
outsource/consider outsourcing expatriate and relocation
administration (62% of respondents) than are their
counterparts in the other regions (55% for Asia Pacific
organisations; 35% for Americas organisations). And, Asia
Pacific respondents are more likely to outsource/consider
outsourcing performance appraisal (42% of respondents) than
are their colleagues in EMEA (34% of respondents) and the
Americas (14% of respondents).
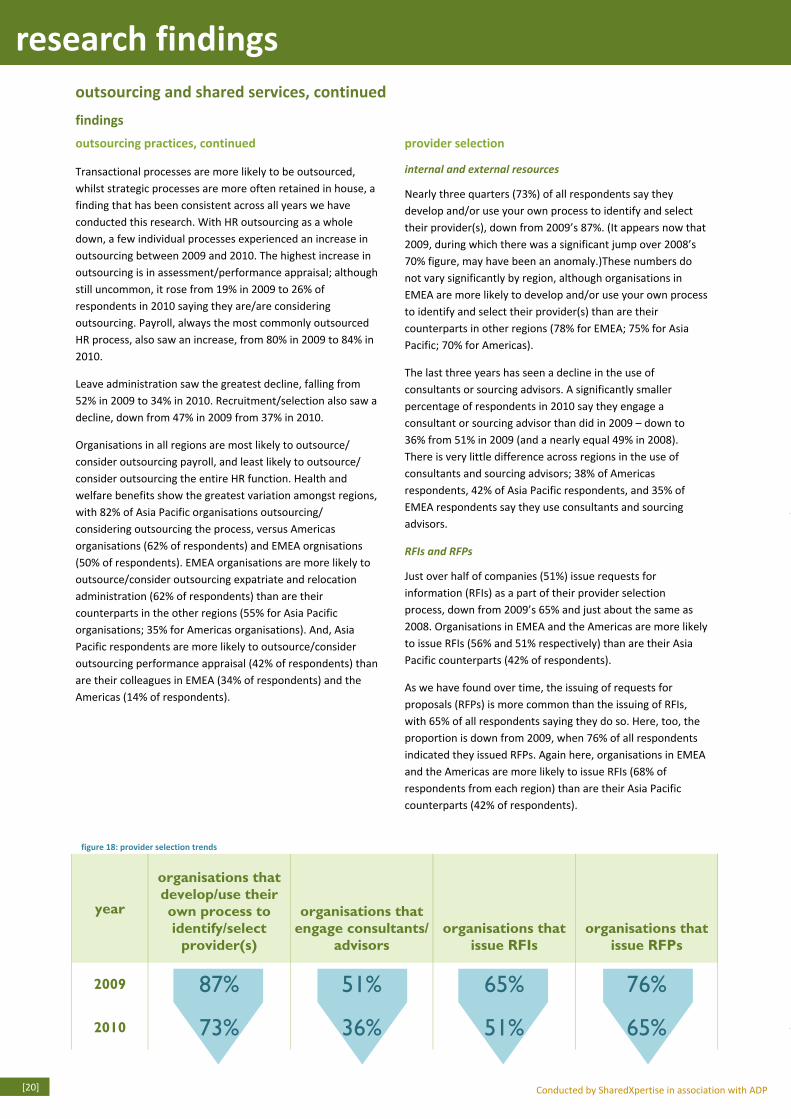
provider selection
internal and external resources
Nearly three quarters (73%) of all respondents say they
develop and/or use your own process to identify and select
their provider(s), down from 2009’s 87%. (It appears now that
2009, during which there was a significant jump over 2008’s
70% figure, may have been an anomaly.)These numbers do
not vary significantly by region, although organisations in
EMEA are more likely to develop and/or use your own process
to identify and select their provider(s) than are their
counterparts in other regions (78% for EMEA; 75% for Asia
Pacific; 70% for Americas).
The last three years has seen a decline in the use of
consultants or sourcing advisors. A significantly smaller
percentage of respondents in 2010 say they engage a
consultant or sourcing advisor than did in 2009 – down to
36% from 51% in 2009 (and a nearly equal 49% in 2008).
There is very little difference across regions in the use of
consultants and sourcing advisors; 38% of Americas
respondents, 42% of Asia Pacific respondents, and 35% of
EMEA respondents say they use consultants and sourcing
advisors.
RFIs and RFPs
Just over half of companies (51%) issue requests for
information (RFIs) as a part of their provider selection
process, down from 2009’s 65% and just about the same as
2008. Organisations in EMEA and the Americas are more likely
to issue RFIs (56% and 51% respectively) than are their Asia
Pacific counterparts (42% of respondents).
As we have found over time, the issuing of requests for
proposals (RFPs) is more common than the issuing of RFIs,
with 65% of all respondents saying they do so. Here, too, the
proportion is down from 2009, when 76% of all respondents
indicated they issued RFPs. Again here, organisations in EMEA
and the Americas are more likely to issue RFIs (68% of
respondents from each region) than are their Asia Pacific
counterparts (42% of respondents).
outsourcing and shared services, continued
findings
year
organisations that develop/use their own process to identify/select provider(s)
organisations that engage consultants/
advisors
organisations that issue RFIs
organisations that issue RFPs
2009 87% 51% 65% 76%
2010 73% 36% 51% 65%
figure 18: provider selection trends
Conducted by SharedXpertise in association with ADP
research findings
[21]
5%
4%
7%
10%
15%
24%
22%
14%
30%
30%
36%
47%
55%
61%
2%
9%
6%
10%
11%
10%
15%
23%
12%
18%
15%
13%
13%
23%
0% 20% 40% 60% 80% 100%
Entire HR function
Employee communications
Career & succession planning
Compensation
Assessment/performance appraisal
Leave
Recruitment/selection
Training/development
Stock options administration
Expatriate and relocation
HRIS
Health & welfare benefits
Pensions administration
Payroll
% who select
Currently
Outsource
Plan to
Outsource
figure 19: outsourcing practices by process, 2008 – 2010
0% 20% 40% 60% 80% 100%
Entire HR function
Career & succession planning
Employee communications
Compensation
Assessment/performance appraisal
Leave
Training/development
Recruitment/selection
Stock options administration
Expatriate and relocation administration
HRIS
Health & welfare benefits
Pensions administration
Payroll
% who select
Americas
Asia Pacific
EMEA
figure 20: currently outsourcing/planning to outsource by process, by region
research findings
Conducted by SharedXpertise in association with ADP [22]
provider selection, continued
provider selection criteria
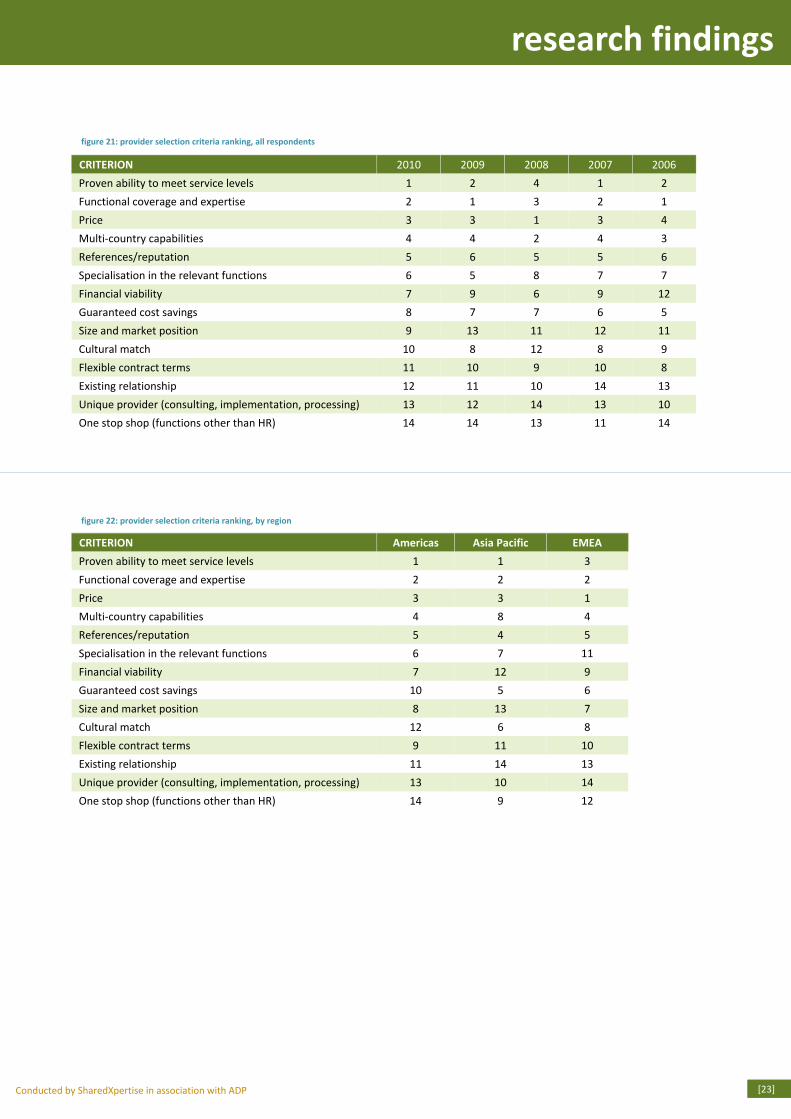
The top four provider selection criteria remain unchanged
over the previous four years, although, as we noted last year,
they regularly change positions. In 2010, the top provider
selection criterion is proven ability to meet service levels,
followed by functional coverage and expertise (these two
were in the reverse positions in 2009), then price followed by
multi-country capabilities (each of which were in the same
position in 2009). The only notable change between 2009 and
2010 is that size and market position has moved up in
importance; whilst still not in the top of the list, that criterion
moved from thirteenth position in 2009 to ninth in 2010.
Amongst the three regions, all rank the same criteria in the
top three, although in different orders. The Americas and Asia
Pacific respondents rank the same top three as the overall
rankings: proven ability to meet service levels ranks first,
functional coverage and expertise ranks second, and price
ranks third. EMEA respondents, however, rank price at the
top, followed by functional coverage and expertise, then
proven ability to meet service levels. Other significant
variances amongst the three regions are that respondents in
the Americas and EMEA rank size and market position in the
middle of the criteria set (eighth and seventh respectively)
whilst Asia Pacific respondents rank it near the bottom,
thirteenth. Likewise, Asia Pacific and EMEA respondents rank
cultural match in the middle of the criteria set (sixth and
eighth respectively), whilst Americas respondents rank it
closer to the bottom, in the twelfth position.
outsourcing and shared services, continued
findings
Conducted by SharedXpertise in association with ADP
research findings
[23]
CRITERION 2010 2009 2008 2007 2006
Proven ability to meet service levels 1 2 4 1 2
Functional coverage and expertise 2 1 3 2 1
Price 3 3 1 3 4
Multi-country capabilities 4 4 2 4 3
References/reputation 5 6 5 5 6
Specialisation in the relevant functions 6 5 8 7 7
Financial viability 7 9 6 9 12
Guaranteed cost savings 8 7 7 6 5
Size and market position 9 13 11 12 11
Cultural match 10 8 12 8 9
Flexible contract terms 11 10 9 10 8
Existing relationship 12 11 10 14 13
Unique provider (consulting, implementation, processing) 13 12 14 13 10
One stop shop (functions other than HR) 14 14 13 11 14
CRITERION Americas Asia Pacific EMEA
Proven ability to meet service levels 1 1 3
Functional coverage and expertise 2 2 2
Price 3 3 1
Multi-country capabilities 4 8 4
References/reputation 5 4 5
Specialisation in the relevant functions 6 7 11
Financial viability 7 12 9
Guaranteed cost savings 10 5 6
Size and market position 8 13 7
Cultural match 12 6 8
Flexible contract terms 9 11 10
Existing relationship 11 14 13
Unique provider (consulting, implementation, processing) 13 10 14
One stop shop (functions other than HR) 14 9 12
figure 21: provider selection criteria ranking, all respondents
figure 22: provider selection criteria ranking, by region
research findings
Conducted by SharedXpertise in association with ADP [24]
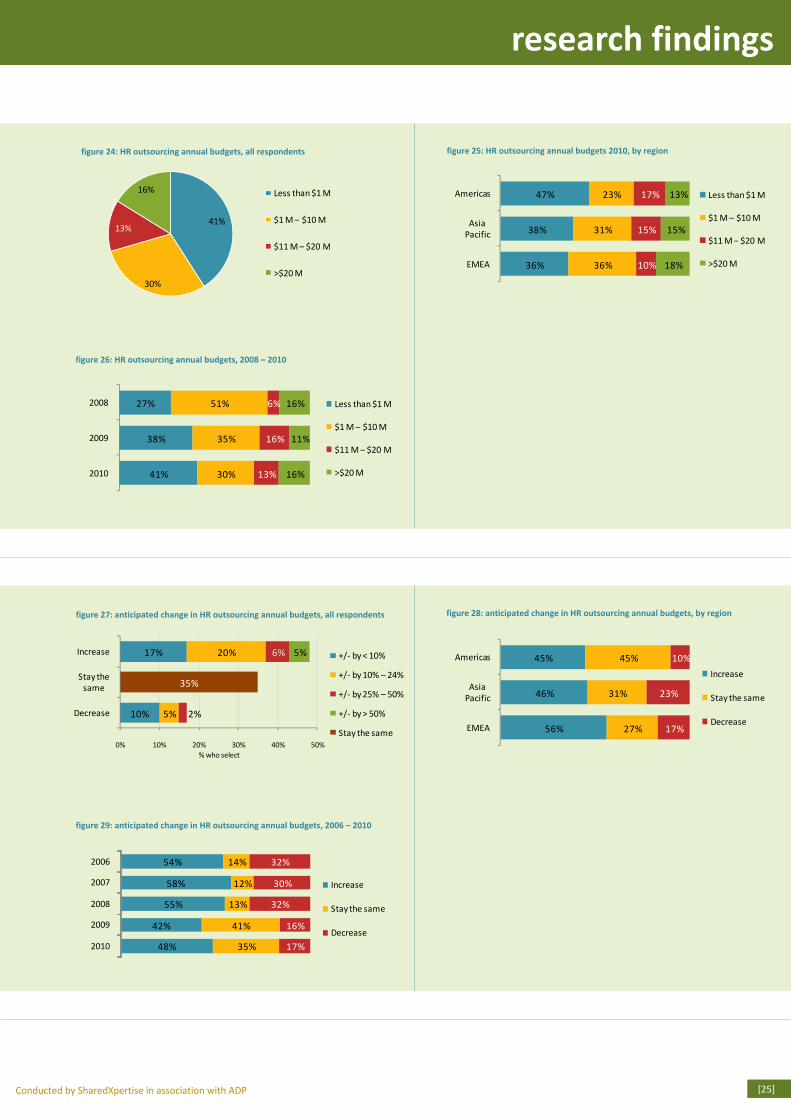
budgeting for HR outsourcing
Organisations most often budget less than US$1M annually
for HR outsourcing (41% of all respondents), followed by
US$1M – US$10M (30% of all respondents). Another 13%
budget US$11M – US$20M annually, and the remaining 16%
budget US$21M or more annually.
Predictably, annual budgets generally correlate to
organisation size, with organisations with fewer employees
budgeting less than those with more employees;
organisations with 25,000+ employees make up virtually all of
the respondents who say they budget US$21M or more
annually.
Analysis of year-over-year HR outsourcing budgets indicates
growth at both ends of the budget scale, with an expanding
proportion budgeting either less than US$1M or more than
US$11M. (Employee sizes within our sample have remained
fairly similar over time.)
Organisations in the Americas are likely to budget on the
lower end of the scale when compared to their counterparts
in other regions, with nearly half (47%) saying their HR
outsourcing budget is less than US$1M.
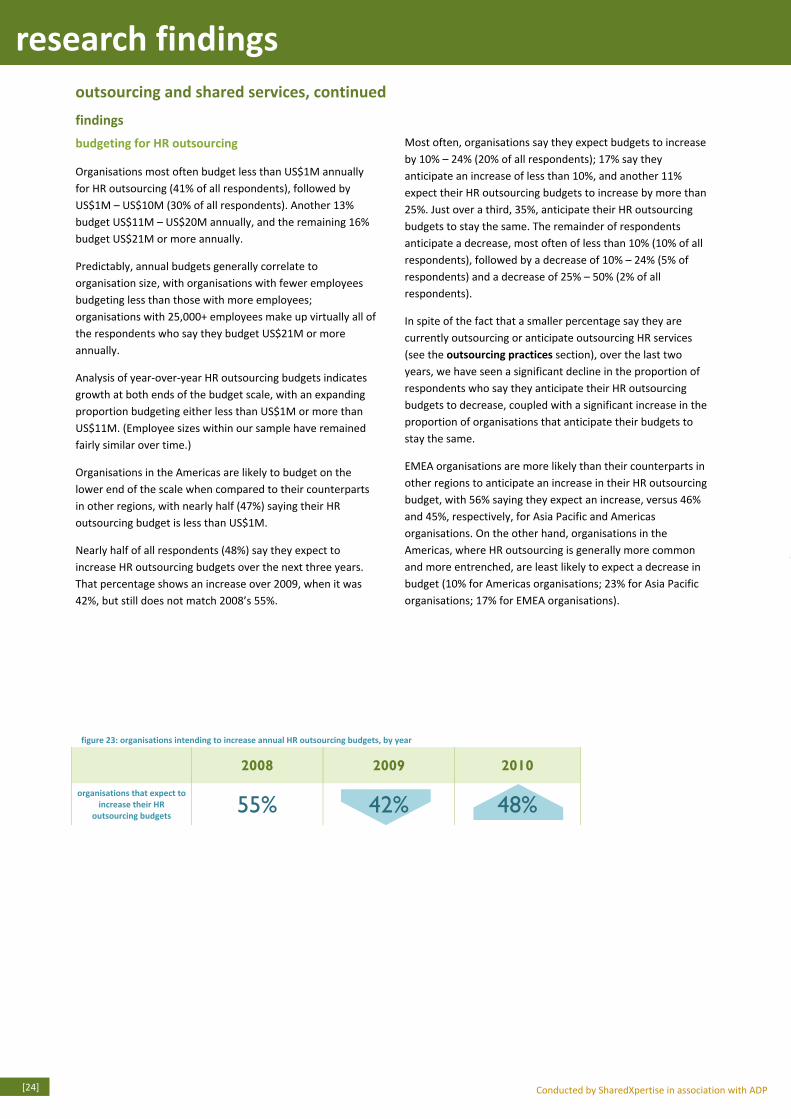
Nearly half of all respondents (48%) say they expect to
increase HR outsourcing budgets over the next three years.
That percentage shows an increase over 2009, when it was
42%, but still does not match 2008’s 55%.
Most often, organisations say they expect budgets to increase
by 10% – 24% (20% of all respondents); 17% say they
anticipate an increase of less than 10%, and another 11%
expect their HR outsourcing budgets to increase by more than
25%. Just over a third, 35%, anticipate their HR outsourcing
budgets to stay the same. The remainder of respondents
anticipate a decrease, most often of less than 10% (10% of all
respondents), followed by a decrease of 10% – 24% (5% of
respondents) and a decrease of 25% – 50% (2% of all
respondents).
In spite of the fact that a smaller percentage say they are
currently outsourcing or anticipate outsourcing HR services
(see the outsourcing practices section), over the last two
years, we have seen a significant decline in the proportion of
respondents who say they anticipate their HR outsourcing
budgets to decrease, coupled with a significant increase in the
proportion of organisations that anticipate their budgets to
stay the same.
EMEA organisations are more likely than their counterparts in
other regions to anticipate an increase in their HR outsourcing
budget, with 56% saying they expect an increase, versus 46%
and 45%, respectively, for Asia Pacific and Americas
organisations. On the other hand, organisations in the
Americas, where HR outsourcing is generally more common
and more entrenched, are least likely to expect a decrease in
budget (10% for Americas organisations; 23% for Asia Pacific
organisations; 17% for EMEA organisations).
outsourcing and shared services, continued
findings
2008 2009 2010
organisations that expect to
increase their HR
outsourcing budgets 55% 42% 48%
figure 23: organisations intending to increase annual HR outsourcing budgets, by year
Conducted by SharedXpertise in association with ADP
research findings
[25]
figure 24: HR outsourcing annual budgets, all respondents
figure 26: HR outsourcing annual budgets, 2008 – 2010
figure 25: HR outsourcing annual budgets 2010, by region
48%
42%
55%
58%
54%
35%
41%
13%
12%
14%
17%
16%
32%
30%
32%
2010
2009
2008
2007
2006
Increase
Stay the same
Decrease
figure 27: anticipated change in HR outsourcing annual budgets, all respondents
figure 29: anticipated change in HR outsourcing annual budgets, 2006 – 2010
56%
46%
45%
27%
31%
45%
17%
23%
10%
EMEA
Asia
Pacific
Americas
Increase
Stay the same
Decrease
figure 28: anticipated change in HR outsourcing annual budgets, by region
41%
30%
13%
16% Less than $1 M
$1 M – $10 M
$11 M – $20 M
>$20 M36%
38%
47%
36%
31%
23%
10%
15%
17%
18%
15%
13%
EMEA
Asia
Pacific
Americas Less than $1 M
$1 M – $10 M
$11 M – $20 M
>$20 M
41%
38%
27%
30%
35%
51%
13%
16%
6%
16%
11%
16%
2010
2009
2008 Less than $1 M
$1 M – $10 M
$11 M – $20 M
>$20 M
10%
17%
5%
20%
2%
6% 5%
35%
0% 10% 20% 30% 40% 50%
Decrease
Stay the
same
Increase
% who select
+/- by < 10%
+/- by 10% – 24%
+/- by 25% – 50%
+/- by > 50%
Stay the same
research findings
Conducted by SharedXpertise in association with ADP [26]
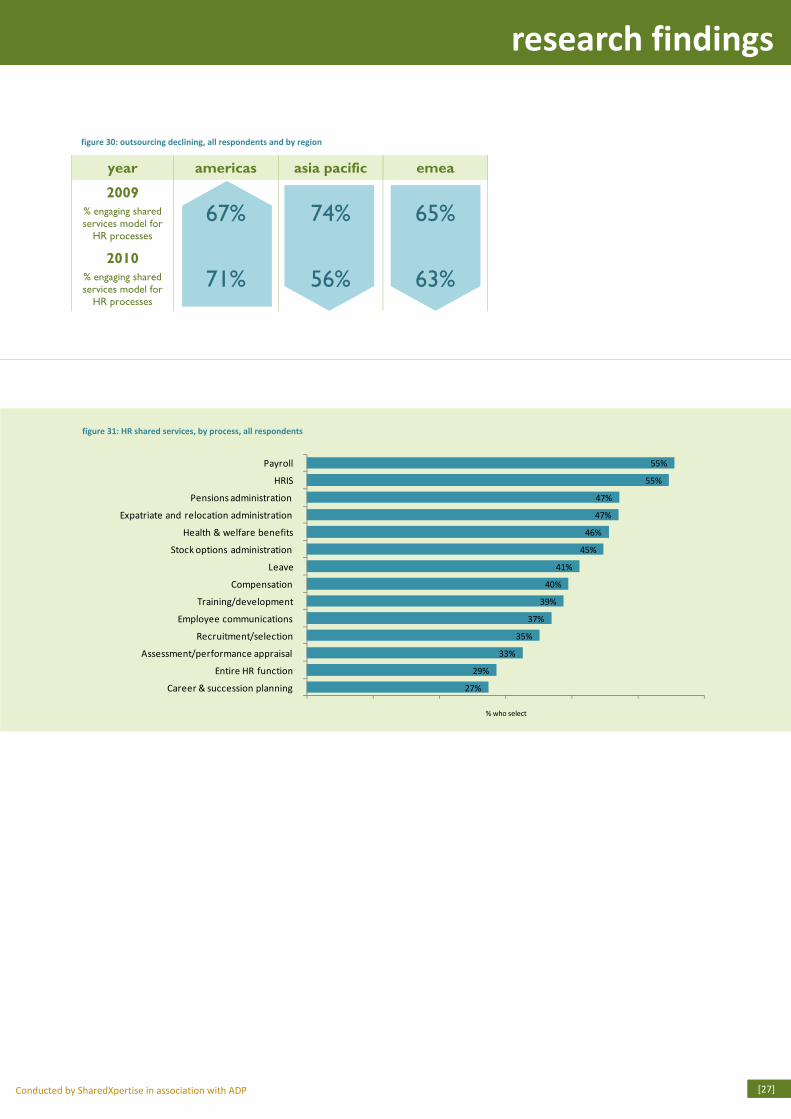
shared services
Just about two-thirds of all respondents (66%) say they
manage one or more HR processes through a shared services
model. (This proportion is essentially unchanged from 2009’s
68%.)
As with outsourcing, organisations are more likely to manage
transactional processes – such as payroll and HR information
systems (HRIS) – in a shared services environment than they
are strategic processes. As such, processes like career/
succession planning and assessment/performance appraisal
are considerably less likely to be managed through a shared
services model. There have been no notable differences, by
process, in likelihood to manage processes in a shared
services model across the years of the research: whilst we
may find that individual processes are more or less likely to
managed through shared services year-over-year, those
processes generally rank in the same place within the overall
list of HR processes.
Respondents from the Americas are more likely than are their
counterparts in other regions to manage at least one HR
process through a shared services model (71% of
Americas respondents versus 56% of Asia Pacific
respondents and 63% of EMEA respondents). That
represents a change from last year, as well as a
significant drop for Asia Pacific respondents, when
74% of Asia Pacific respondents said they managed
or more HR processes through a shared services
centre.
outsourcing and shared services, continued
findings
organisations
using a shared
services model
66%
Conducted by SharedXpertise in association with ADP
research findings
[27]
year americas asia pacific emea
2009 % engaging shared services model for
HR processes
67% 74% 65%
2010 % engaging shared services model for
HR processes
71% 56% 63%
figure 30: outsourcing declining, all respondents and by region
27%
29%
33%
35%
37%
39%
40%
41%
45%
46%
47%
47%
55%
55%
Career & succession planning
Entire HR function
Assessment/performance appraisal
Recruitment/selection
Employee communications
Training/development
Compensation
Leave
Stock options administration
Health & welfare benefits
Expatriate and relocation administration
Pensions administration
HRIS
Payroll
% who select
figure 31: HR shared services, by process, all respondents
research findings
Conducted by SharedXpertise in association with ADP [28]
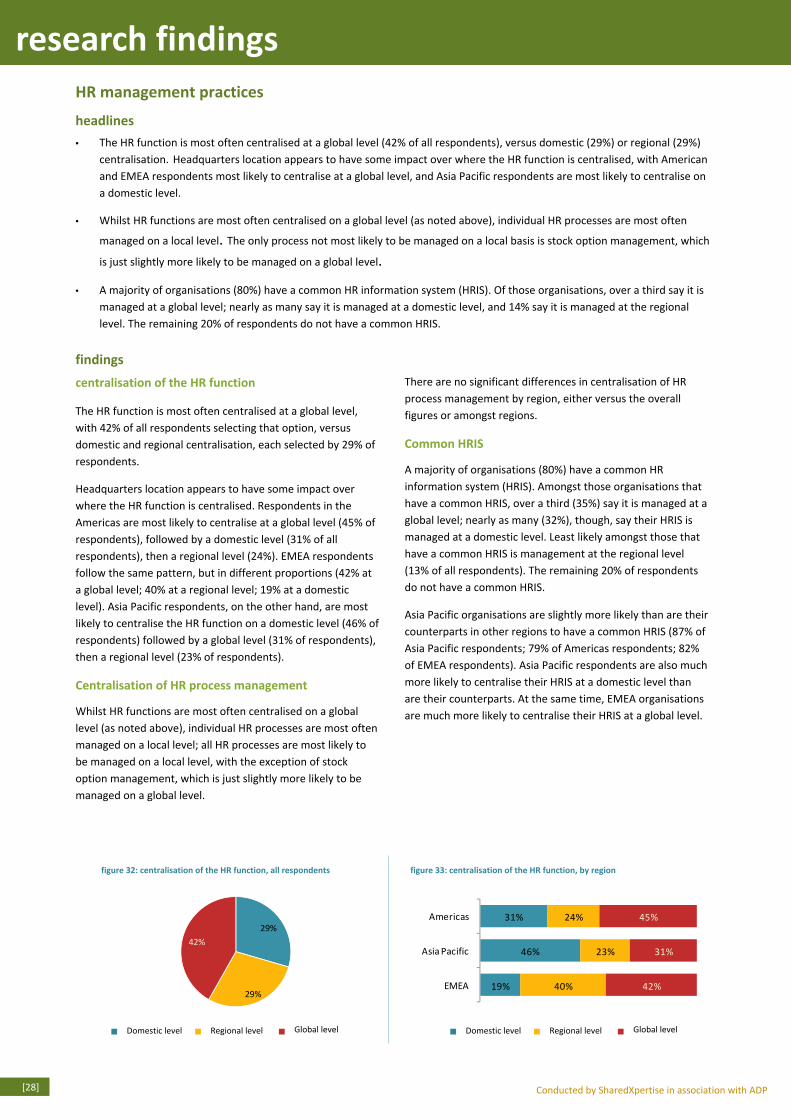
centralisation of the HR function
The HR function is most often centralised at a global level,
with 42% of all respondents selecting that option, versus
domestic and regional centralisation, each selected by 29% of
respondents.
Headquarters location appears to have some impact over
where the HR function is centralised. Respondents in the
Americas are most likely to centralise at a global level (45% of
respondents), followed by a domestic level (31% of all
respondents), then a regional level (24%). EMEA respondents
follow the same pattern, but in different proportions (42% at
a global level; 40% at a regional level; 19% at a domestic
level). Asia Pacific respondents, on the other hand, are most
likely to centralise the HR function on a domestic level (46% of
respondents) followed by a global level (31% of respondents),
then a regional level (23% of respondents).
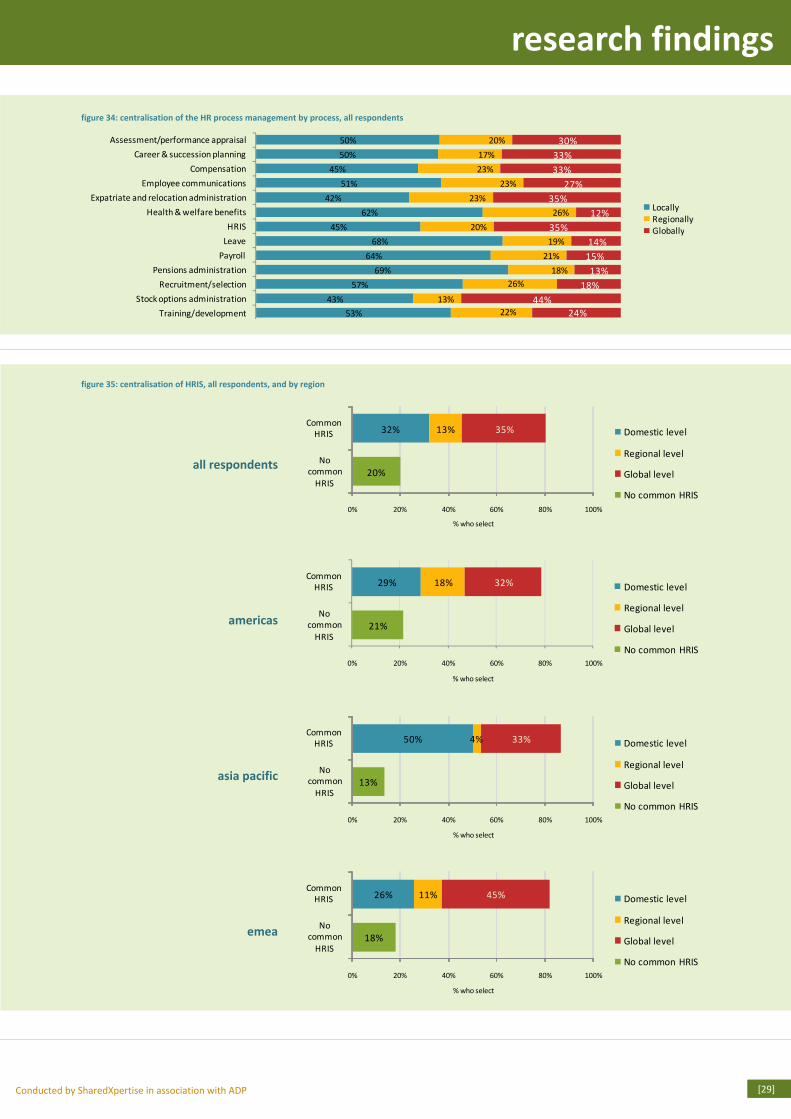
Centralisation of HR process management
Whilst HR functions are most often centralised on a global
level (as noted above), individual HR processes are most often
managed on a local level; all HR processes are most likely to
be managed on a local level, with the exception of stock
option management, which is just slightly more likely to be
managed on a global level.
There are no significant differences in centralisation of HR
process management by region, either versus the overall
figures or amongst regions.
Common HRIS
A majority of organisations (80%) have a common HR
information system (HRIS). Amongst those organisations that
have a common HRIS, over a third (35%) say it is managed at a
global level; nearly as many (32%), though, say their HRIS is
managed at a domestic level. Least likely amongst those that
have a common HRIS is management at the regional level
(13% of all respondents). The remaining 20% of respondents
do not have a common HRIS.
Asia Pacific organisations are slightly more likely than are their
counterparts in other regions to have a common HRIS (87% of
Asia Pacific respondents; 79% of Americas respondents; 82%
of EMEA respondents). Asia Pacific respondents are also much
more likely to centralise their HRIS at a domestic level than
are their counterparts. At the same time, EMEA organisations
are much more likely to centralise their HRIS at a global level.
HR management practices
• The HR function is most often centralised at a global level (42% of all respondents), versus domestic (29%) or regional (29%)
centralisation. Headquarters location appears to have some impact over where the HR function is centralised, with American
and EMEA respondents most likely to centralise at a global level, and Asia Pacific respondents are most likely to centralise on
a domestic level.
• Whilst HR functions are most often centralised on a global level (as noted above), individual HR processes are most often
managed on a local level. The only process not most likely to be managed on a local basis is stock option management, which
is just slightly more likely to be managed on a global level.
• A majority of organisations (80%) have a common HR information system (HRIS). Of those organisations, over a third say it is
managed at a global level; nearly as many say it is managed at a domestic level, and 14% say it is managed at the regional
level. The remaining 20% of respondents do not have a common HRIS.
headlines
findings
29%
29%
42%
19%
46%
31%
40%
23%
24%
42%
31%
45%
EMEA
Asia Pacific
Americas
Domestic level Regional level Global level
figure 32: centralisation of the HR function, all respondents figure 33: centralisation of the HR function, by region
Domestic level Regional level Global level
Conducted by SharedXpertise in association with ADP
research findings
[29]
53%
43%
57%
69%
64%
68%
45%
62%
42%
51%
45%
50%
50%
22%
13%
26%
18%
21%
19%
20%
26%
23%
23%
23%
17%
20%
24%
44%
18%
13%
15%
14%
35%
12%
35%
27%
33%
33%
30%
Training/development
Stock options administration
Recruitment/selection
Pensions administration
Payroll
Leave
HRIS
Health & welfare benefits
Expatriate and relocation administration
Employee communications
Compensation
Career & succession planning
Assessment/performance appraisal
Locally
Regionally
Globally
figure 34: centralisation of the HR process management by process, all respondents
32% 13% 35%
20%
0% 20% 40% 60% 80% 100%
No
common
HRIS
Common
HRIS
% who select
Domestic level
Regional level
Global level
No common HRIS
26% 11% 45%
18%
0% 20% 40% 60% 80% 100%
No
common
HRIS
Common
HRIS
% who select
Domestic level
Regional level
Global level
No common HRIS
50% 4% 33%
13%
0% 20% 40% 60% 80% 100%
No
common
HRIS
Common
HRIS
% who select
Domestic level
Regional level
Global level
No common HRIS
29% 18% 32%
21%
0% 20% 40% 60% 80% 100%
No
common
HRIS
Common
HRIS
% who select
Domestic level
Regional level
Global level
No common HRIS
figure 35: centralisation of HRIS, all respondents, and by region
americas
all respondents
asia pacific
emea
about the survey participants
Conducted by SharedXpertise in association with ADP [30]
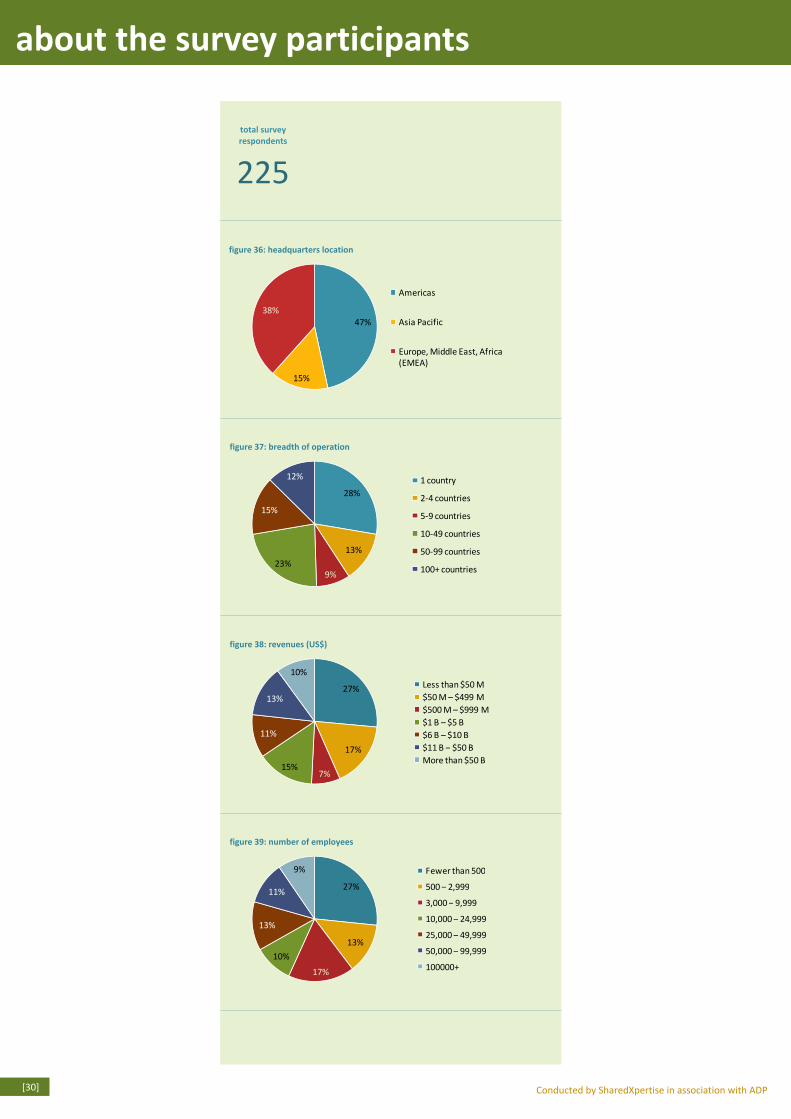
total survey
respondents
225
47%
15%
38%
Americas
Asia Pacific
Europe, Middle East, Africa
(EMEA)
28%
13%
9%23%
15%
12% 1 country
2-4 countries
5-9 countries
10-49 countries
50-99 countries
100+ countries
27%
17%
7%15%
11%
13%
10%
Less than $50 M
$50 M – $499 M
$500 M – $999 M
$1 B – $5 B
$6 B – $10 B
$11 B – $50 B
More than $50 B
27%
13%
17%
10%
13%
11%
9% Fewer than 500
500 – 2,999
3,000 – 9,999
10,000 – 24,999
25,000 – 49,999
50,000 – 99,999
100000+
figure 36: headquarters location
figure 37: breadth of operation
figure 38: revenues (US$)
figure 39: number of employees
Conducted by SharedXpertise in association with ADP
about the survey participants
[31]
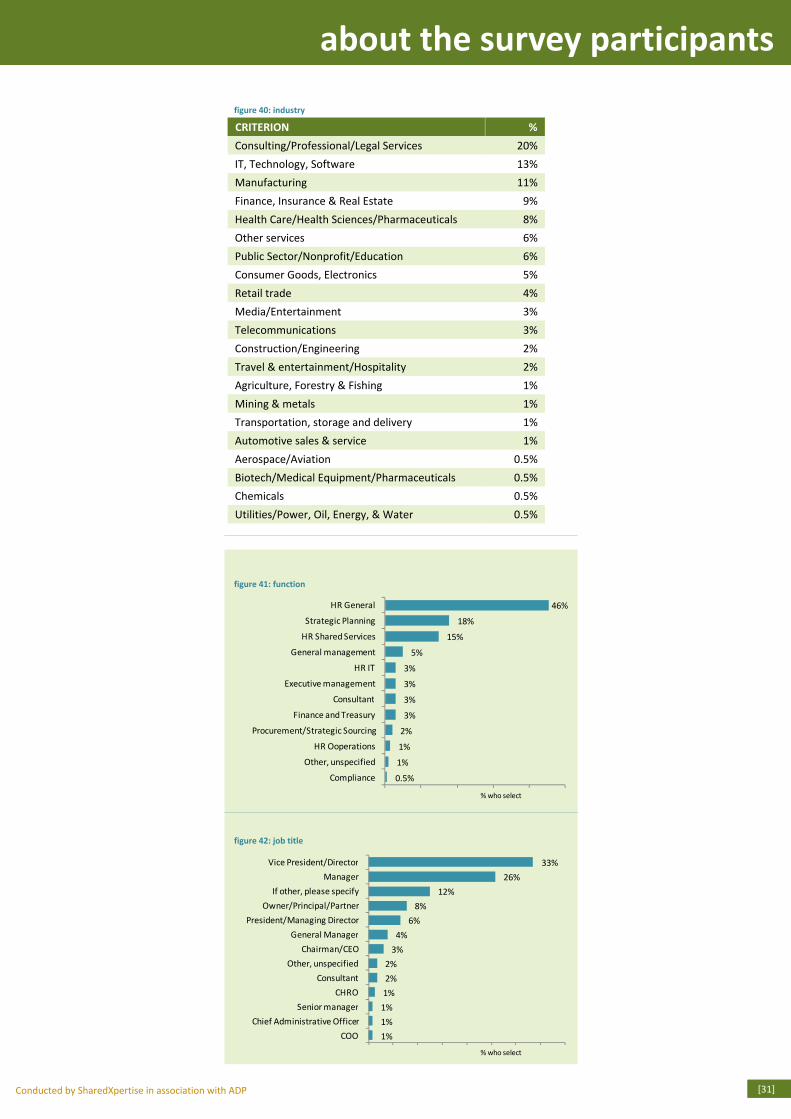
CRITERION %
Consulting/Professional/Legal Services 20%
IT, Technology, Software 13%
Manufacturing 11%
Finance, Insurance & Real Estate 9%
Health Care/Health Sciences/Pharmaceuticals 8%
Other services 6%
Public Sector/Nonprofit/Education 6%
Consumer Goods, Electronics 5%
Retail trade 4%
Media/Entertainment 3%
Telecommunications 3%
Construction/Engineering 2%
Travel & entertainment/Hospitality 2%
Agriculture, Forestry & Fishing 1%
Mining & metals 1%
Transportation, storage and delivery 1%
Automotive sales & service 1%
Aerospace/Aviation 0.5%
Biotech/Medical Equipment/Pharmaceuticals 0.5%
Chemicals 0.5%
Utilities/Power, Oil, Energy, & Water 0.5%
figure 40: industry
0.5%
1%
1%
2%
3%
3%
3%
3%
5%
15%
18%
46%
Compliance
Other, unspecified
HR Ooperations
Procurement/Strategic Sourcing
Finance and Treasury
Consultant
Executive management
HR IT
General management
HR Shared Services
Strategic Planning
HR General
% who select
1%
1%
1%
1%
2%
2%
3%
4%
6%
8%
12%
26%
33%
COO
Chief Administrative Officer
Senior manager
CHRO
Consultant
Other, unspecified
Chairman/CEO
General Manager
President/Managing Director
Owner/Principal/Partner
If other, please specify
Manager
Vice President/Director
% who select
figure 41: function
figure 42: job title
about the research sponsors
Conducted by SharedXpertise in association with ADP [32]
ADP
Who We Are
Automatic Data Processing, Inc. (Nasdaq: ADP), with nearly
$9 billion in revenue and about 550,000 clients, is one of the
world’s largest providers of business outsourcing solutions.
Leveraging over 60 years of experience, ADP offers a wide
range of HR, payroll, tax and benefits administration
solutions from a single source. ADP’s easy-to-use solutions
for employers provide superior value to companies of all
types and sizes. ADP is also a leading provider of integrated
computing solutions to auto, truck, motorcycle, marine and
recreational vehicle dealers throughout the world.
What We Do
ADP Employer Services, part of ADP, Inc., serves clients in
more than 60 countries worldwide. As a leading provider of
HR services, ADP Employer Services’ offerings – from basic
payroll processing to being your payroll and personnel
administration department – are fully compliant with
languages, currencies, social regulations, and adapt
seamlessly to companies’ structural and business needs.
With its suite of HRO solutions, ADP is well positioned to
serve the needs of multinational companies that are looking
for outsourcing services from one source.
More Information
Additional information on ADP at: www.adp.com.
SharedXpertise
Who We Are
SharedXpertise is a leading provider of forums, media and
summits that develop professional practices in corporate
responsibility, HR and financial management. SharedXpertise’s
goal is to provide its readers, attendees and members with
data, industry trends, best practices and networking
opportunities to excel in their professional endeavors, and to
help expand knowledge, improve business practices and foster
the responsible globalization of business.
What We Do
SharedXpertise produces a variety of strategic, highly
interactive conferences and webinars for executives, managers
and practitioners in the HR and financial services
transformation and process outsourcing, and corporate
responsibility communities.
Through its research programs, SharedXpertise acts to improve
the practice of HR, financial management and corporate
responsibility by researching, overseeing and accelerating the
development and adoption of effective industry standards and
practices. As part of this process, the SharedXpertise gathers
broad-based input from across industries and works to develop
lasting industry consensus and to arrive at conclusions that
balance the various commercial interests of all participants.
More Information
To learn more, please visit www.sharedxpertise.com.

notes
Conducted by SharedXpertise in association with ADP
about the survey participants
[31]
CRITERION % Consulting/Professional/Legal Services 20% IT, Technology, Software 13% Manufacturing 11% Finance, Insurance & Real Estate 9% Health Care/Health Sciences/Pharmaceuticals 8% Other services 6% Public Sector/Nonprofit/Education 6% Consumer Goods, Electronics 5% Retail trade 4% Media/Entertainment 3% Telecommunications 3% Construction/Engineering 2% Travel & entertainment/Hospitality 2% Agriculture, Forestry & Fishing 1% Mining & metals 1% Transportation, storage and delivery 1% Automotive sales & service 1% Aerospace/Aviation 0.5% Biotech/Medical Equipment/Pharmaceuticals 0.5% Chemicals 0.5% Utilities/Power, Oil, Energy, & Water 0.5%
figure 40: industry
0.5%
1%
1%
2%
3%
3%
3%
3%
5%
15%
18%
46%
Compliance
Other, unspecified
HR Ooperations
Procurement/Strategic Sourcing
Finance and Treasury
Consultant
Executive management
HR IT
General management
HR Shared Services
Strategic Planning
HR General
% who select
1%1%1%1%2%2%
3%4%
6%8%
12%26%
33%
COOChief Administrative Officer
Senior managerCHRO
ConsultantOther, unspecified
Chairman/CEOGeneral Manager
President/Managing DirectorOwner/Principal/Partner
If other, please specifyManager
Vice President/Director
% who select
figure 41: function
figure 42: job title
[33]

notesabout the research sponsors
Conducted by SharedXpertise in association with ADP [32]
ADP
Who We Are
Automatic Data Processing, Inc. (Nasdaq: ADP), with nearly $9 billion in revenue and about 550,000 clients, is one of the world’s largest providers of business outsourcing solutions. Leveraging over 60 years of experience, ADP offers a wide range of HR, payroll, tax and benefits administration solutions from a single source. ADP’s easy-to-use solutions for employers provide superior value to companies of all types and sizes. ADP is also a leading provider of integrated computing solutions to auto, truck, motorcycle, marine and recreational vehicle dealers throughout the world.
What We Do
ADP Employer Services, part of ADP, Inc., serves clients in more than 60 countries worldwide. As a leading provider of HR services, ADP Employer Services’ offerings – from basic payroll processing to being your payroll and personnel administration department – are fully compliant with languages, currencies, social regulations, and adapt seamlessly to companies’ structural and business needs. With its suite of HRO solutions, ADP is well positioned to serve the needs of multinational companies that are looking for outsourcing services from one source.
More Information
Additional information on ADP at: www.adp.com.
SharedXpertise
Who We Are
SharedXpertise is a leading provider of forums, media and summits that develop professional practices in corporate responsibility, HR and financial management. SharedXpertise’s goal is to provide its readers, attendees and members with data, industry trends, best practices and networking opportunities to excel in their professional endeavors, and to help expand knowledge, improve business practices and foster the responsible globalization of business.
What We Do
SharedXpertise produces a variety of strategic, highly interactive conferences and webinars for executives, managers and practitioners in the HR and financial services transformation and process outsourcing, and corporate responsibility communities.
Through its research programs, SharedXpertise acts to improve the practice of HR, financial management and corporate responsibility by researching, overseeing and accelerating the development and adoption of effective industry standards and practices. As part of this process, the SharedXpertise gathers broad-based input from across industries and works to develop lasting industry consensus and to arrive at conclusions that balance the various commercial interests of all participants.
More Information
To learn more, please visit www.sharedxpertise.com.
[34]