Embed Size (px)
Citation preview

Global Health 101
Richard Skolnik
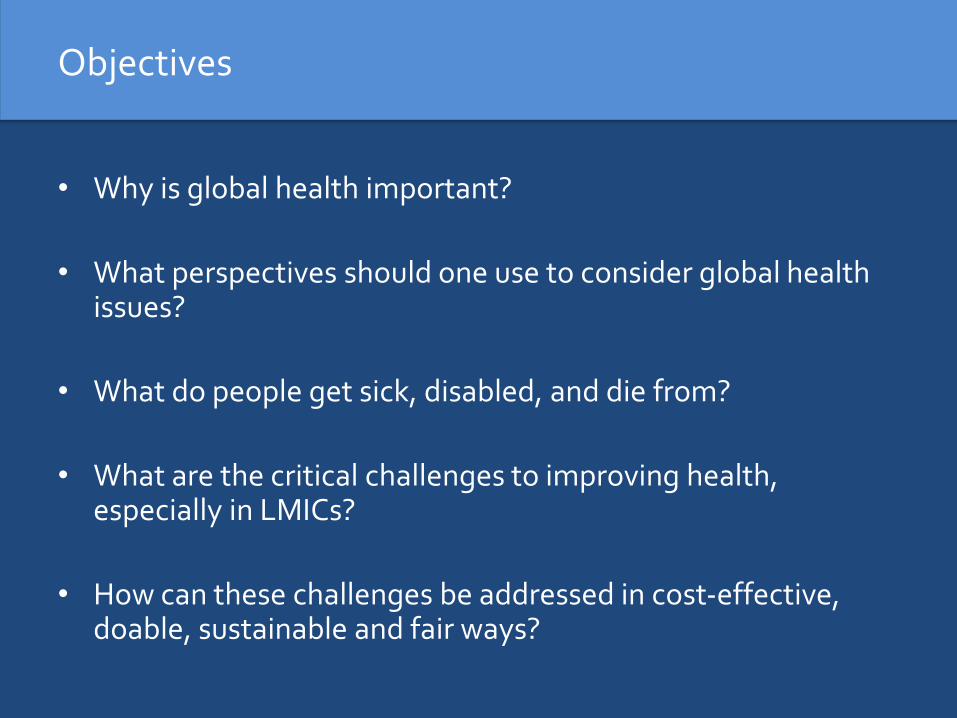
Objectives
• Why is global health important?
• What perspectives should one use to consider global health issues?
• What do people get sick, disabled, and die from?
• What are the critical challenges to improving health, especially in LMICs?
• How can these challenges be addressed in cost-effective, doable, sustainable and fair ways?

• The health of anyone, anywhere is the health of everyone, everywhere
• There has been some important progress in improving health
• There remain, however, substantial unfinished and emerging agendas
• Substantial equity issues also remain
• A large share of deaths and DALYS are preventable by addressing a small number of risk factors
• LMICs must now address intersectoral issues and establish effective and efficient UHC as fast as possible
Main Messages

Why is Global Health Important?
• Ethical dimensions
• Impacts on the productivity of individuals and countries
• Links with economic and social development
• Implications for global security and freedom
• Huge expenditures by people and governments
• Lack of respect for boundaries – the health of anyone,
anywhere is the health of everyone, everywhere

Guiding Principles for Considering Global Health
• Think like a Minister of Finance who believes in Human Capital
• If you only have $100, how will you spend it to maximize your people’s health?
• In LICs, how will you bury old people instead of young people, make the transition as fast as possible, and do it at the least cost?
• In HICs, how will you help people live long and healthy lives?
• Always question your fundamental assumptions
• HOW you spend money is more important than HOW MUCH you spend
THE HEALTH OF THE WORLD AN OVERVIEW

Some Good News
INCREASE IN GLOBAL LIFE EXPECTANCY FROM 1960 TO 201342%
FEWER UNDER-5 DEATHS IN 2013 THAN IN 199050%
FEWER NEW HIV CASES EACH YEAR THAN IN THE MID- TO LATE-1990s
1.2 MILLION
FEWER TB DEATHS PER YEAR IN HIV-NEGATIVE INDIVIDUALS FROM 1990 TO 2013
500,000
FEWER MATERNAL DEATHS IN 2015 THAN IN 199044%
DECREASE IN MALARIA MORTALITY RATES AMONG UNDER-5 CHILDREN SINCE 2000
53%
CHILDREN HAVE BEEN IMMUNIZED AGAINST POLIO SINCE 1988, WITH ONLY 100 TOTAL CASES IN 2015
2.5BILLION
REDUCTION OF GUINEA WORM CASES FROM 1986 TO 2015, NEAR ERADICATION
99.9%
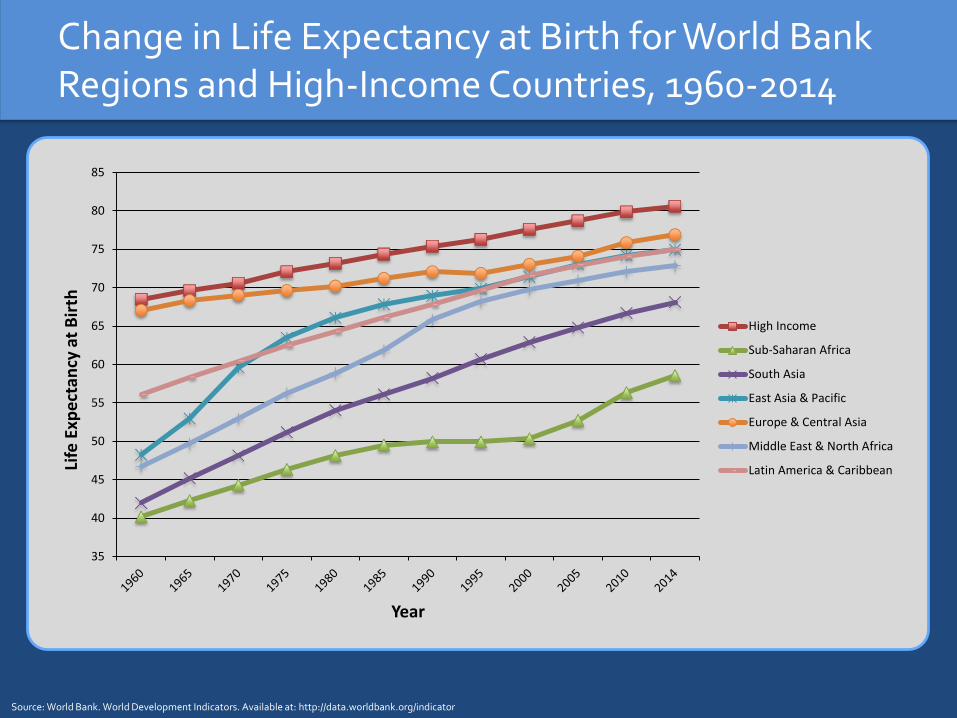
Change in Life Expectancy at Birth for World Bank Regions and High-Income Countries, 1960-2014
Source: World Bank. World Development Indicators. Available at: http://data.worldbank.org/indicator
35
40
45
50
55
60
65
70
75
80
85
Life
Exp
ect
ancy
at
Bir
th
Year
High Income
Sub-Saharan Africa
South Asia
East Asia & Pacific
Europe & Central Asia
Middle East & North Africa
Latin America & Caribbean

Declines in Under-Five Child Mortality, by World Bank Region, 1990-2015
Source: World Bank. World Development Indicators. Available at: http://data.worldbank.org/indicator
0
20
40
60
80
100
120
140
160
180
200
1990 2015
De
ath
s p
er
1,0
00
Liv
e B
irth
s
Year
High Income
Sub-Saharan Africa
South Asia
East Asia & Pacific
Europe & Central Asia
Middle East & North Africa
Latin America & Caribbean

Some Less Good News
UNDER-5 CHILD DEATHS IN 20136.3
MILLION
SHARE OF CHILD DEATHS RELATED TO UNDERNUTRITION
45%
AIDS DEATHS IN 20131.5
MILLION
NEW ADULT HIV INFECTIONS IN 20132.1
MILLION
TB DEATHS IN 20131.5
MILLION
MALARIA DEATHS IN 2013584,000
MATERNAL DEATHS IN 2013289,000
PEOPLE INFECTED WITH SOIL-TRANSMITTED HELMINTHS
~ 2BILLION

Snapshot of Global Health Status: Key Health Status Indicators
• Life expectancy
• Maternal mortality ratio
• Neonatal mortality rate
• Infant mortality rate
• Under-five mortality
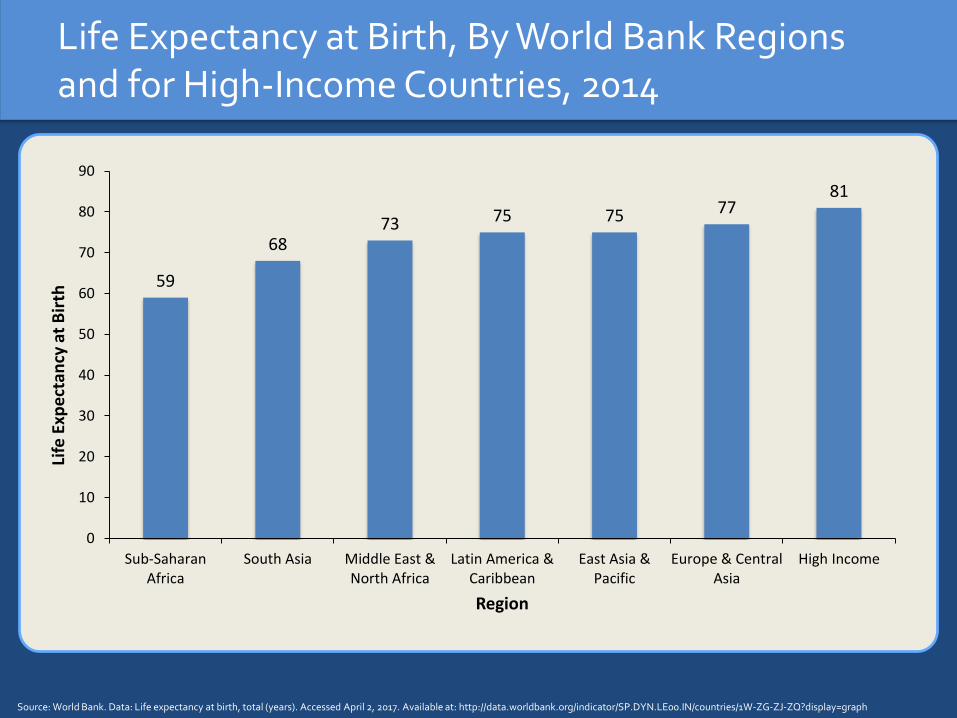
Life Expectancy at Birth, By World Bank Regions and for High-Income Countries, 2014
Source: World Bank. Data: Life expectancy at birth, total (years). Accessed April 2, 2017. Available at: http://data.worldbank.org/indicator/SP.DYN.LE00.IN/countries/1W-ZG-ZJ-ZQ?display=graph
59
6873 75 75 77
81
0
10
20
30
40
50
60
70
80
90
Sub-SaharanAfrica
South Asia Middle East &North Africa
Latin America &Caribbean
East Asia &Pacific
Europe & CentralAsia
High Income
Life
Exp
ect
ancy
at
Bir
th
Region
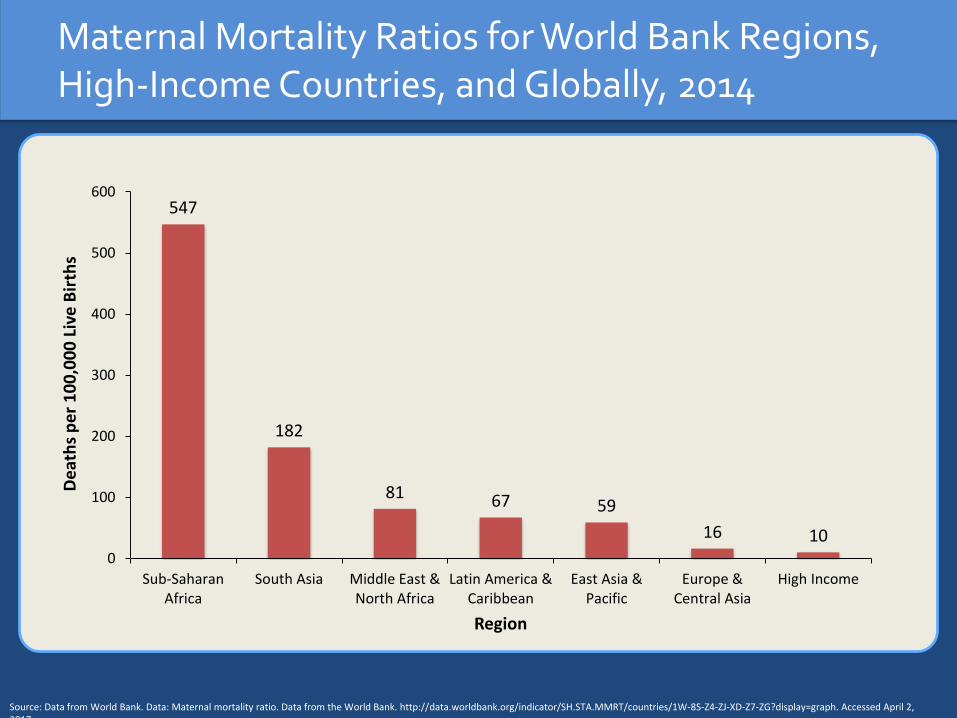
Maternal Mortality Ratios for World Bank Regions, High-Income Countries, and Globally, 2014
Source: Data from World Bank. Data: Maternal mortality ratio. Data from the World Bank. http://data.worldbank.org/indicator/SH.STA.MMRT/countries/1W-8S-Z4-ZJ-XD-Z7-ZG?display=graph. Accessed April 2, 2017.
547
182
81 67 59
16 100
100
200
300
400
500
600
Sub-SaharanAfrica
South Asia Middle East &North Africa
Latin America &Caribbean
East Asia &Pacific
Europe &Central Asia
High Income
De
ath
s p
er
10
0,0
00
Liv
e B
irth
s
Region

Neonatal Mortality Rates for World Bank Regions,High-Income Countries, and Globally, 2015
Source: Data from the World Bank. World Development Indicators: Mortality. http://data.worldbank.org/indicator/SH.DYN.NMRT/countries/Z4-ZJ-8S-ZG-Z7-ZQ-XD?display=graph. Accessed April 2, 2017.
3029
13
9 9
6
3
0
5
10
15
20
25
30
35
South Asia Sub-SaharanAfrica
Middle East &North Africa
East Asia &Pacific
Latin America &Caribbean
Europe & CentralAsia
High Income
De
ath
s p
er
10
00
Liv
e B
irth
s
Region

Infant Mortality Rates for World Bank Regions,High-Income Countries, and Globally, 2015
Source: Data from the World Bank. World Development Indicators: Mortality. http://data.worldbank.org/indicator/SH.DYN.NMRT/countries/Z4-ZJ-8S-ZG-Z7-ZQ-XD?display=graph. Accessed April 2, 2017
56
42
20
15 14
10
5
0
10
20
30
40
50
60
Sub-SaharanAfrica
South Asia Middle East &North Africa
East Asia &Pacific
Latin America &Caribbean
Europe & CentralAsia
High Income
De
ath
s p
er
10
00
Liv
e B
irth
s
Region
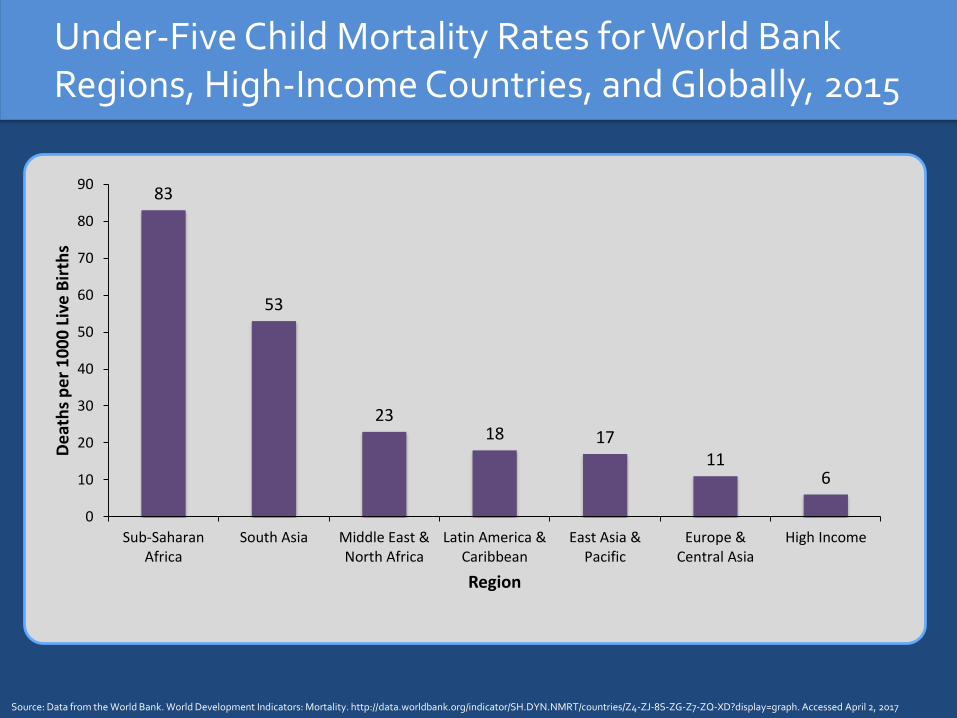
Under-Five Child Mortality Rates for World Bank Regions, High-Income Countries, and Globally, 2015
Source: Data from the World Bank. World Development Indicators: Mortality. http://data.worldbank.org/indicator/SH.DYN.NMRT/countries/Z4-ZJ-8S-ZG-Z7-ZQ-XD?display=graph. Accessed April 2, 2017
83
53
2318 17
116
0
10
20
30
40
50
60
70
80
90
Sub-SaharanAfrica
South Asia Middle East &North Africa
Latin America &Caribbean
East Asia &Pacific
Europe &Central Asia
High Income
De
ath
s p
er
10
00
Liv
e B
irth
s
Region
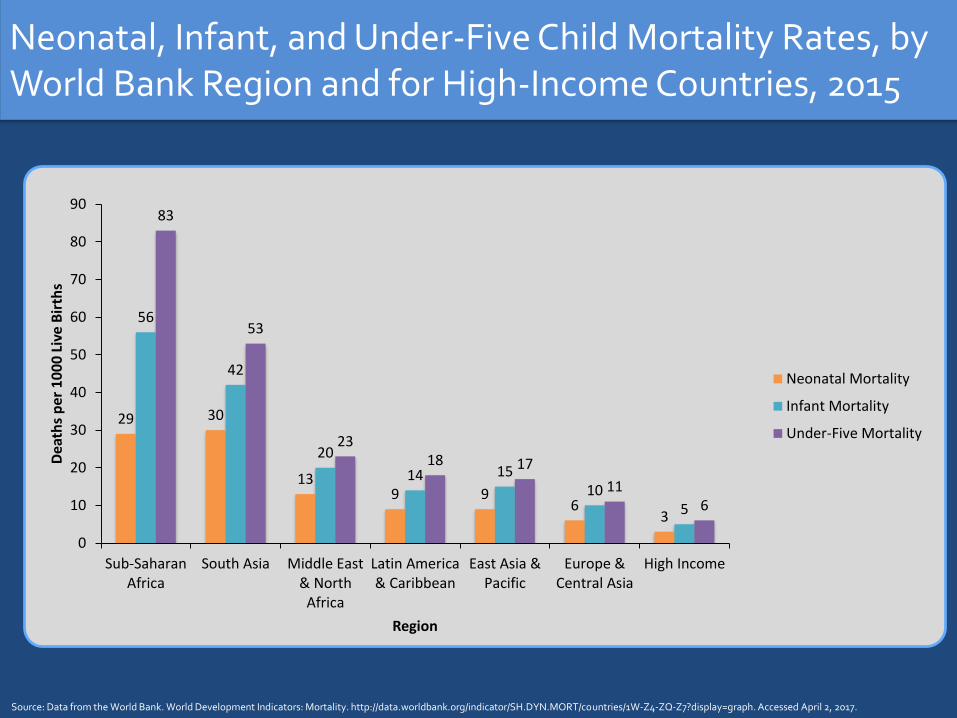
Neonatal, Infant, and Under-Five Child Mortality Rates, by World Bank Region and for High-Income Countries, 2015
Source: Data from the World Bank. World Development Indicators: Mortality. http://data.worldbank.org/indicator/SH.DYN.MORT/countries/1W-Z4-ZQ-Z7?display=graph. Accessed April 2, 2017.
29 30
139 9
63
56
42
20
14 1510
5
83
53
2318 17
116
0
10
20
30
40
50
60
70
80
90
Sub-SaharanAfrica
South Asia Middle East& North
Africa
Latin America& Caribbean
East Asia &Pacific
Europe &Central Asia
High Income
Dea
ths
per
10
00
Liv
e B
irth
s
Region
Neonatal Mortality
Infant Mortality
Under-Five Mortality
BURDEN OF DISEASE
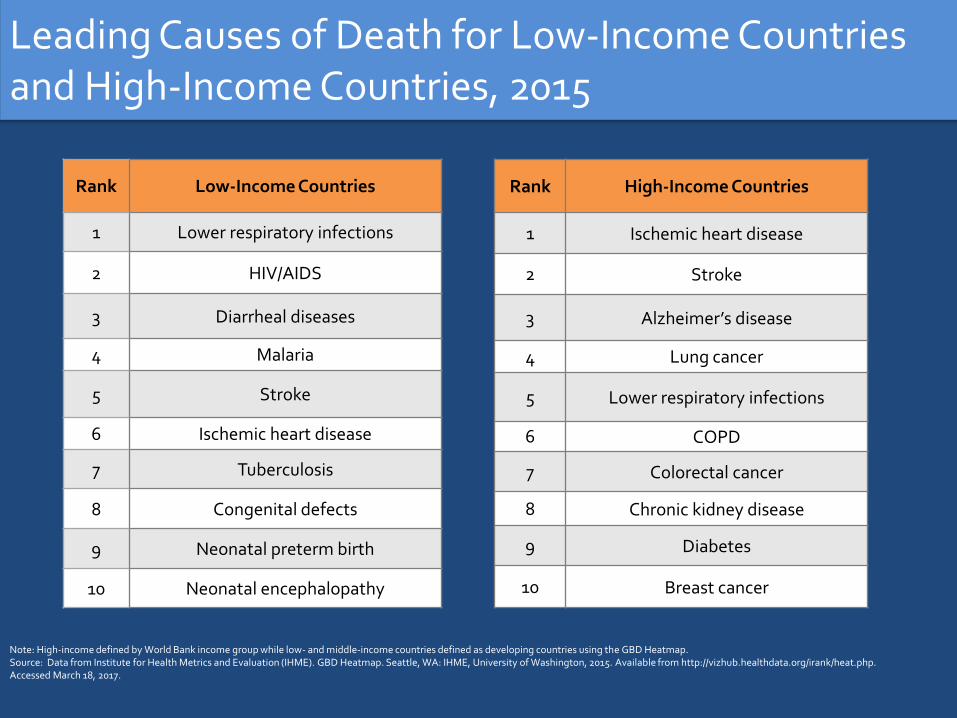
Leading Causes of Death for Low-Income Countries and High-Income Countries, 2015
Rank Low-Income Countries
1 Lower respiratory infections
2 HIV/AIDS
3 Diarrheal diseases
4 Malaria
5 Stroke
6 Ischemic heart disease
7 Tuberculosis
8 Congenital defects
9 Neonatal preterm birth
10 Neonatal encephalopathy
Rank High-Income Countries
1 Ischemic heart disease
2 Stroke
3 Alzheimer’s disease
4 Lung cancer
5 Lower respiratory infections
6 COPD
7 Colorectal cancer
8 Chronic kidney disease
9 Diabetes
10 Breast cancer
Note: High-income defined by World Bank income group while low- and middle-income countries defined as developing countries using the GBD Heatmap. Source: Data from Institute for Health Metrics and Evaluation (IHME). GBD Heatmap. Seattle, WA: IHME, University of Washington, 2015. Available from http://vizhub.healthdata.org/irank/heat.php. Accessed March 18, 2017.
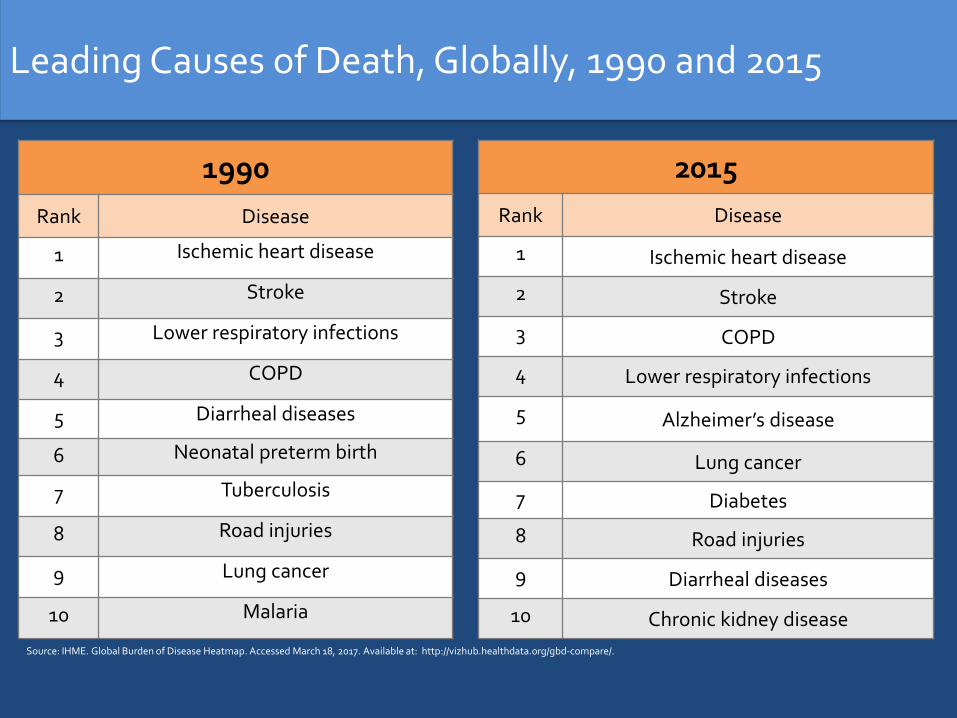
Leading Causes of Death, Globally, 1990 and 2015
1990
Rank Disease
1 Ischemic heart disease
2 Stroke
3 Lower respiratory infections
4 COPD
5 Diarrheal diseases
6 Neonatal preterm birth
7 Tuberculosis
8 Road injuries
9 Lung cancer
10 Malaria
2015
Rank Disease
1 Ischemic heart disease
2 Stroke
3 COPD
4 Lower respiratory infections
5 Alzheimer’s disease
6 Lung cancer
7 Diabetes
8 Road injuries
9 Diarrheal diseases
10 Chronic kidney disease
Source: IHME. Global Burden of Disease Heatmap. Accessed March 18, 2017. Available at: http://vizhub.healthdata.org/gbd-compare/.
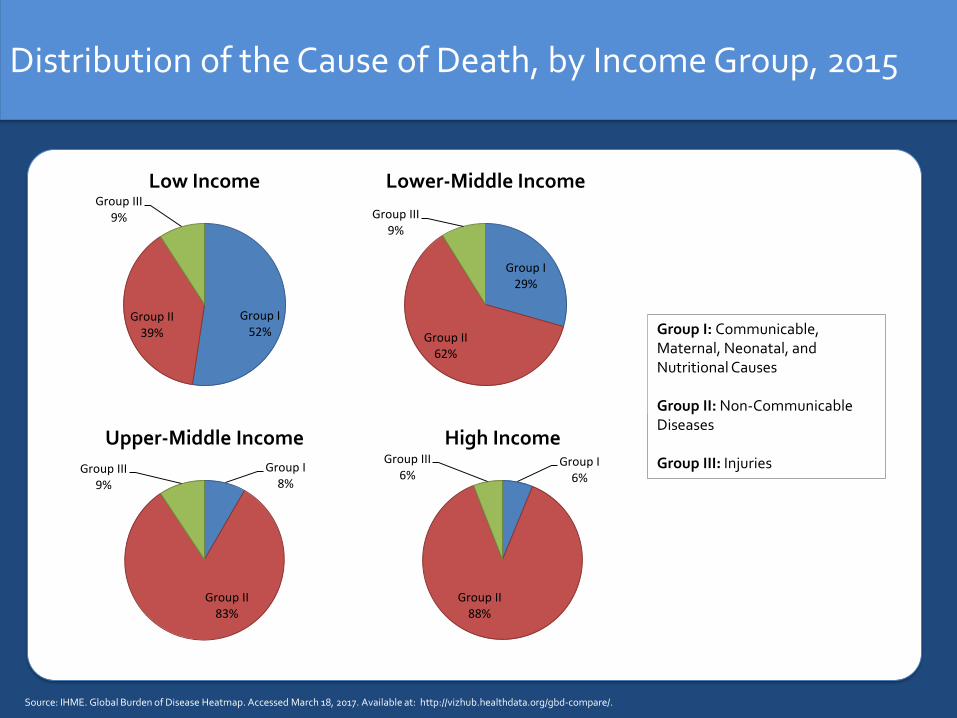
Distribution of the Cause of Death, by Income Group, 2015
Source: IHME. Global Burden of Disease Heatmap. Accessed March 18, 2017. Available at: http://vizhub.healthdata.org/gbd-compare/.
Group I52%
Group II39%
Group III9%
Low Income
Group I8%
Group II83%
Group III9%
Upper-Middle IncomeGroup I
6%
Group II88%
Group III6%
High Income
Group I: Communicable, Maternal, Neonatal, and Nutritional Causes
Group II: Non-Communicable Diseases
Group III: Injuries
Group I29%
Group II62%
Group III9%
Lower-Middle Income
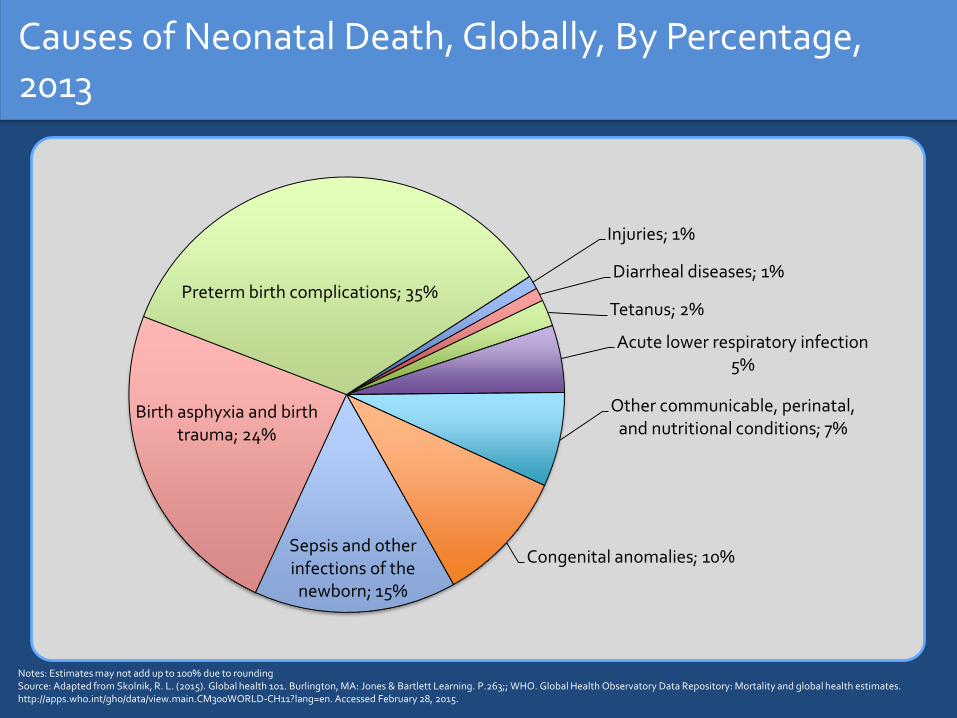
Causes of Neonatal Death, Globally, By Percentage, 2013
Injuries; 1%
Diarrheal diseases; 1%
Tetanus; 2%
Acute lower respiratory infection5%
Other communicable, perinatal, and nutritional conditions; 7%
Congenital anomalies; 10%Sepsis and other infections of the
newborn; 15%
Birth asphyxia and birth trauma; 24%
Preterm birth complications; 35%
Notes: Estimates may not add up to 100% due to roundingSource: Adapted from Skolnik, R. L. (2015). Global health 101. Burlington, MA: Jones & Bartlett Learning. P.263;; WHO. Global Health Observatory Data Repository: Mortality and global health estimates. http://apps.who.int/gho/data/view.main.CM300WORLD-CH11?lang=en. Accessed February 28, 2015.

Causes of Post-Neonatal Under-Five Child Death (1-59mos), By Percentage, 2013
Pertussis; 2%
Birth asphyxia and birth trauma; 2%
HIV/AIDS; 3%
Measles; 3%
Prematurity; 4%
Meningitis/encephalitis; 4%
Congenital anomalies; 5%
Other noncommunicablediseases; 7%
Injuries; 9%Other communicable,
perinatal, and nutritional conditions; 10%
Malaria; 13%
Diarrheal diseases; 16%
Lower respiratory infections; 23%
Notes: Estimates may not add up to 100% due to roundingSource: Adapted from Skolnik, R. L. (2015). Global health 101. Burlington, MA: Jones & Bartlett Learning. P.263;; WHO. Global Health Observatory Data Repository: Mortality and global health estimates. http://apps.who.int/gho/data/view.main.CM300WORLD-CH11?lang=en. Accessed February 28, 2015.

Leading Causes of DALYs for Low-Income Countries and High-Income Countries, 2015
Rank Low-Income Countries
1 Lower respiratory infections
2 Malaria
3 HIV/AIDS
4 Diarrheal diseases
5 Neonatal encephalopathy
6 Congenital defects
7 Neonatal preterm birth
8 Neonatal sepsis
9 Protein-energy malnutrition
10 Meningitis
Rank High-Income Countries
1 Ischemic heart disease
2 Low back & neck pain
3 Sense organ diseases
4 Stroke
5 Lung cancer
6 Diabetes
7 Depressive disorders
8 Alzheimer’s disease
9 COPD
10 Skin diseases
Note: High-income defined by World Bank income group while low- and middle-income countries defined as developing countries using the GBD Heatmap. Source: Data from Institute for Health Metrics and Evaluation (IHME). GBD Heatmap. Seattle, WA: IHME, University of Washington, 2013. Available from http://vizhub.healthdata.org/irank/heat.php. Accessed March 18, 2017.
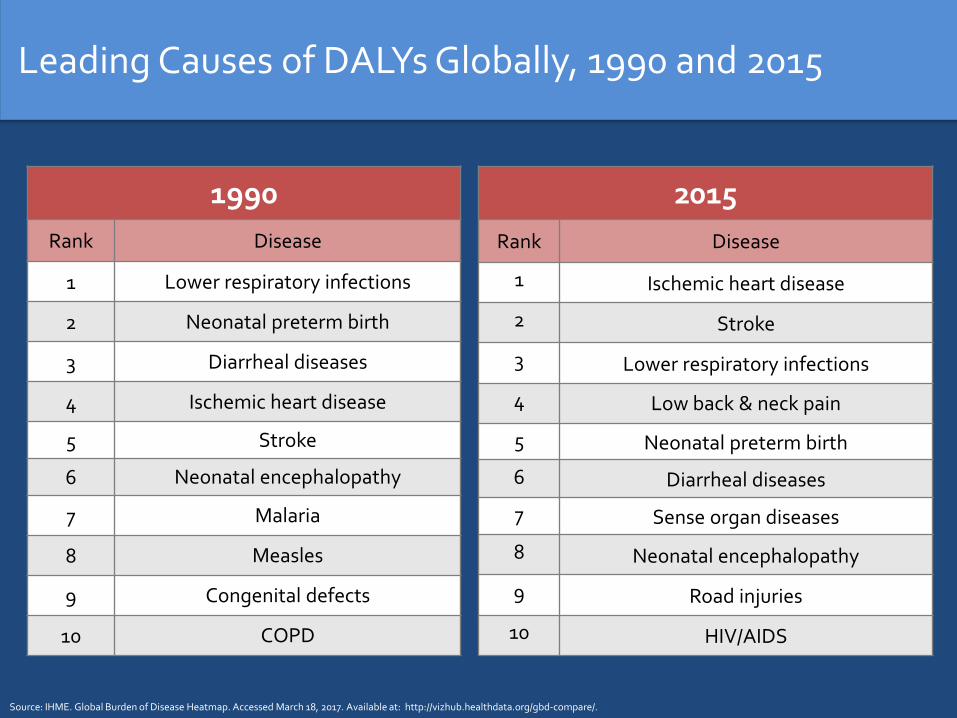
Leading Causes of DALYs Globally, 1990 and 2015
1990
Rank Disease
1 Lower respiratory infections
2 Neonatal preterm birth
3 Diarrheal diseases
4 Ischemic heart disease
5 Stroke
6 Neonatal encephalopathy
7 Malaria
8 Measles
9 Congenital defects
10 COPD
2015
Rank Disease
1 Ischemic heart disease
2 Stroke
3 Lower respiratory infections
4 Low back & neck pain
5 Neonatal preterm birth
6 Diarrheal diseases
7 Sense organ diseases
8 Neonatal encephalopathy
9 Road injuries
10 HIV/AIDS
Source: IHME. Global Burden of Disease Heatmap. Accessed March 18, 2017. Available at: http://vizhub.healthdata.org/gbd-compare/.
RISK FACTORS
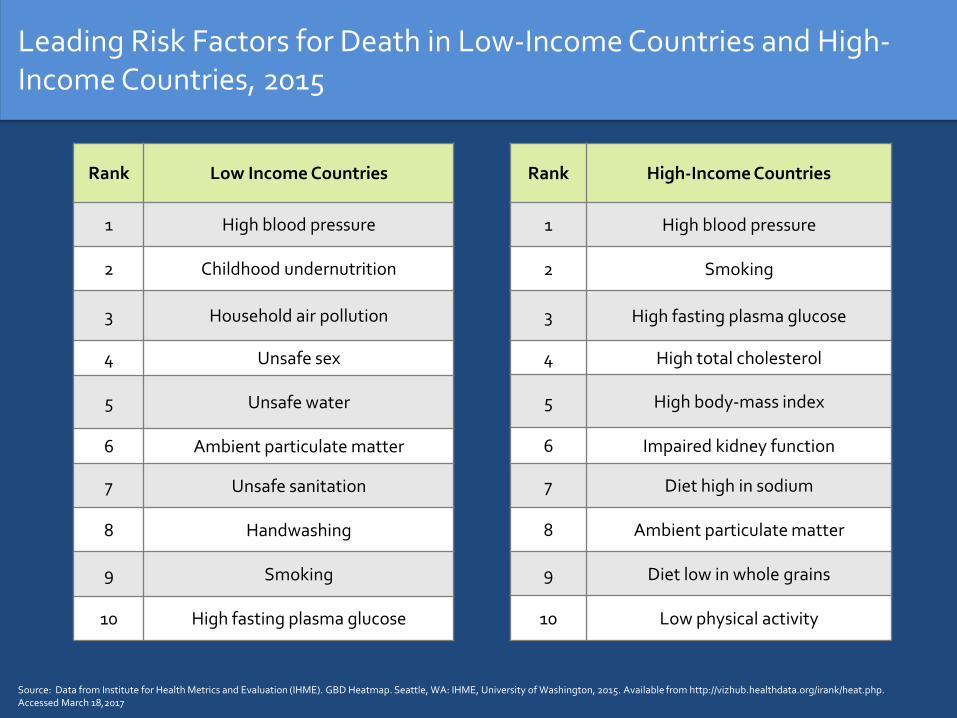
Leading Risk Factors for Death in Low-Income Countries and High-Income Countries, 2015
Rank Low Income Countries
1 High blood pressure
2 Childhood undernutrition
3 Household air pollution
4 Unsafe sex
5 Unsafe water
6 Ambient particulate matter
7 Unsafe sanitation
8 Handwashing
9 Smoking
10 High fasting plasma glucose
Rank High-Income Countries
1 High blood pressure
2 Smoking
3 High fasting plasma glucose
4 High total cholesterol
5 High body-mass index
6 Impaired kidney function
7 Diet high in sodium
8 Ambient particulate matter
9 Diet low in whole grains
10 Low physical activity
Source: Data from Institute for Health Metrics and Evaluation (IHME). GBD Heatmap. Seattle, WA: IHME, University of Washington, 2015. Available from http://vizhub.healthdata.org/irank/heat.php. Accessed March 18,2017

Leading Risk Factors for Deaths, Globally, 1990 and 2015
1990
Rank Risk Factor
1 High blood pressure
2 Smoking
3 Childhood undernutrition
4 Ambient particulate matter
5 Household air pollution
6 High total cholesterol
7 High fasting plasma glucose
8 High sodium
9 High body-mass index
10 Unsafe water
2015
Rank Risk Factor
1 High blood pressure
2 Smoking
3 High fasting plasma glucose
4 High total cholesterol
5Ambient particulate matter
6 Diet high in sodium
7 High body-mass index
8 Diet low in whole grains
9 Diet low in fruit
10 Household air pollution
Source: IHME. Global Burden of Disease Heatmap. Accessed August 18, 2016. Available at: http://vizhub.healthdata.org/gbd-compare/.
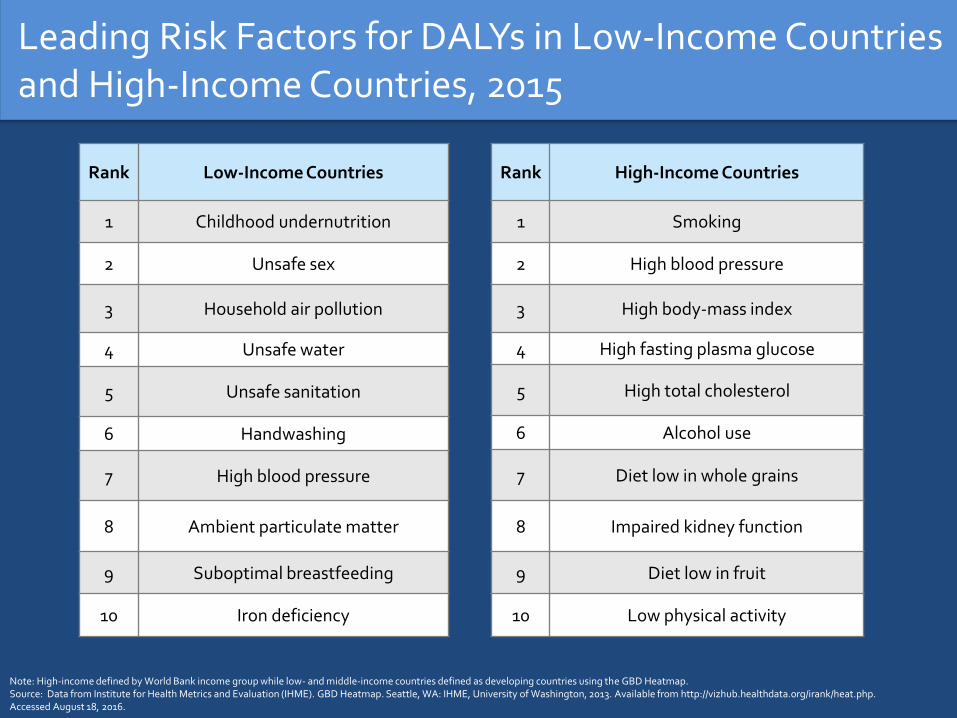
Leading Risk Factors for DALYs in Low-Income Countries and High-Income Countries, 2015
Rank Low-Income Countries
1 Childhood undernutrition
2 Unsafe sex
3 Household air pollution
4 Unsafe water
5 Unsafe sanitation
6 Handwashing
7 High blood pressure
8 Ambient particulate matter
9 Suboptimal breastfeeding
10 Iron deficiency
Rank High-Income Countries
1 Smoking
2 High blood pressure
3 High body-mass index
4 High fasting plasma glucose
5 High total cholesterol
6 Alcohol use
7 Diet low in whole grains
8 Impaired kidney function
9 Diet low in fruit
10 Low physical activity
Note: High-income defined by World Bank income group while low- and middle-income countries defined as developing countries using the GBD Heatmap. Source: Data from Institute for Health Metrics and Evaluation (IHME). GBD Heatmap. Seattle, WA: IHME, University of Washington, 2013. Available from http://vizhub.healthdata.org/irank/heat.php. Accessed August 18, 2016.

Leading Risk Factors for DALYs, 1990 and 2015
Rank 1990
Risk Factor
1 Childhood undernutrition
2 Unsafe water
3 High blood pressure
4 Household air pollution
5 Smoking
6 Ambient particulate matter
7 Unsafe sanitation
8 Suboptimal breastfeeding
9 Handwashing
10 High fasting plasma glucose
Rank 2015
Risk Factor
1 High blood pressure
2 Smoking
3 High fasting plasma glucose
4 High body-mass index
5 Childhood undernutrition
6 Ambient particulate matter
7 High total cholesterol
8 Household air pollution
9 Alcohol use
10 Diet high in sodium
Source: IHME. Global Burden of Disease Heatmap. Accessed March 18, 2017. Available at: http://vizhub.healthdata.org/gbd-compare/.
HEALTH EQUITY
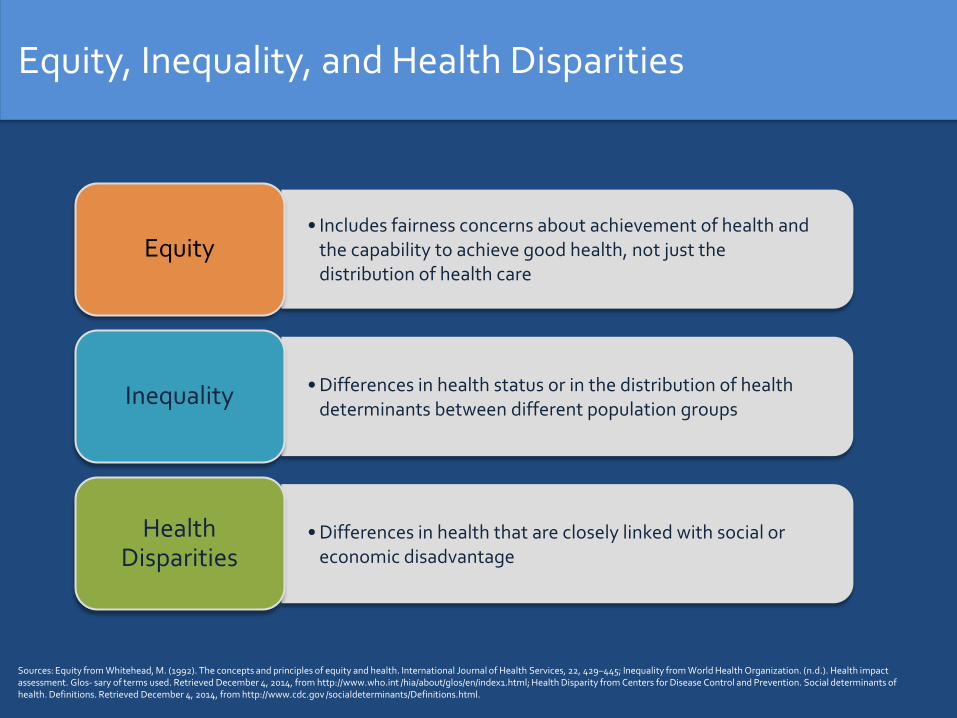
Equity, Inequality, and Health Disparities
• Includes fairness concerns about achievement of health and the capability to achieve good health, not just the distribution of health care
Equity
• Differences in health status or in the distribution of health determinants between different population groups
Inequality
• Differences in health that are closely linked with social or economic disadvantage
Health Disparities
Sources: Equity from Whitehead, M. (1992). The concepts and principles of equity and health. International Journal of Health Services, 22, 429–445; Inequality from World Health Organization. (n.d.). Health impact assessment. Glos- sary of terms used. Retrieved December 4, 2014, from http://www.who.int /hia/about/glos/en/index1.html; Health Disparity from Centers for Disease Control and Prevention. Social determinants of health. Definitions. Retrieved December 4, 2014, from http://www.cdc.gov /socialdeterminants/Definitions.html.
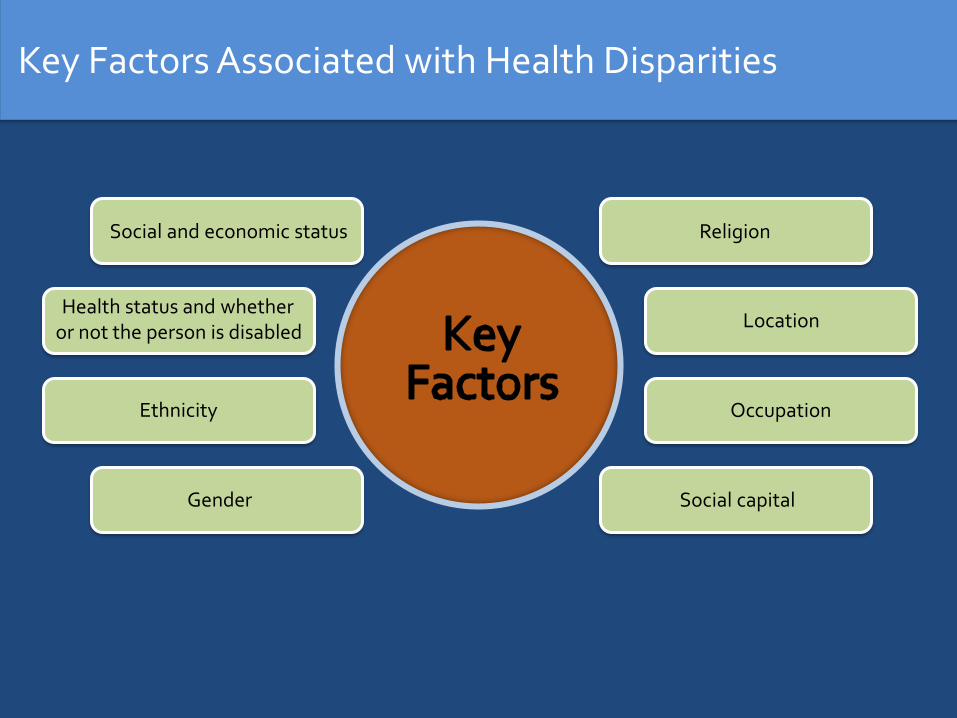
Key Factors Associated with Health Disparities
Health status and whether or not the person is disabled
Social and economic status
Ethnicity
Gender
Location
Religion
Occupation
Social capital
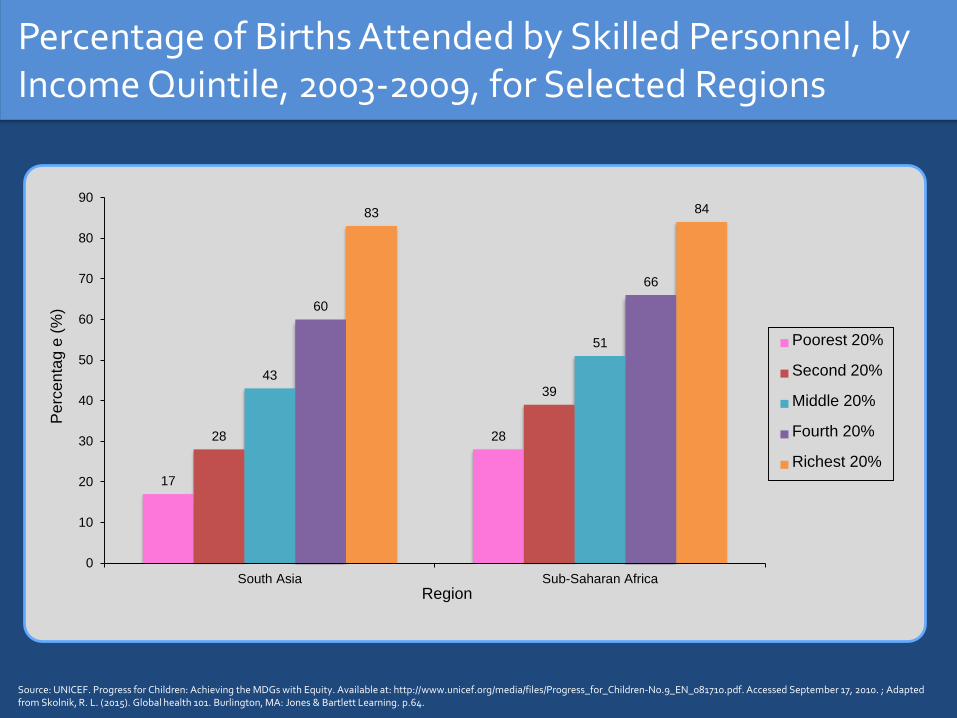
Percentage of Births Attended by Skilled Personnel, by Income Quintile, 2003-2009, for Selected Regions
17
2828
39
43
51
60
66
83 84
0
10
20
30
40
50
60
70
80
90
South Asia Sub-Saharan Africa
Pe
rcen
tag e
(%
)
Region
Poorest 20%
Second 20%
Middle 20%
Fourth 20%
Richest 20%
Source: UNICEF. Progress for Children: Achieving the MDGs with Equity. Available at: http://www.unicef.org/media/files/Progress_for_Children-No.9_EN_081710.pdf. Accessed September 17, 2010. ; Adapted from Skolnik, R. L. (2015). Global health 101. Burlington, MA: Jones & Bartlett Learning. p.64.
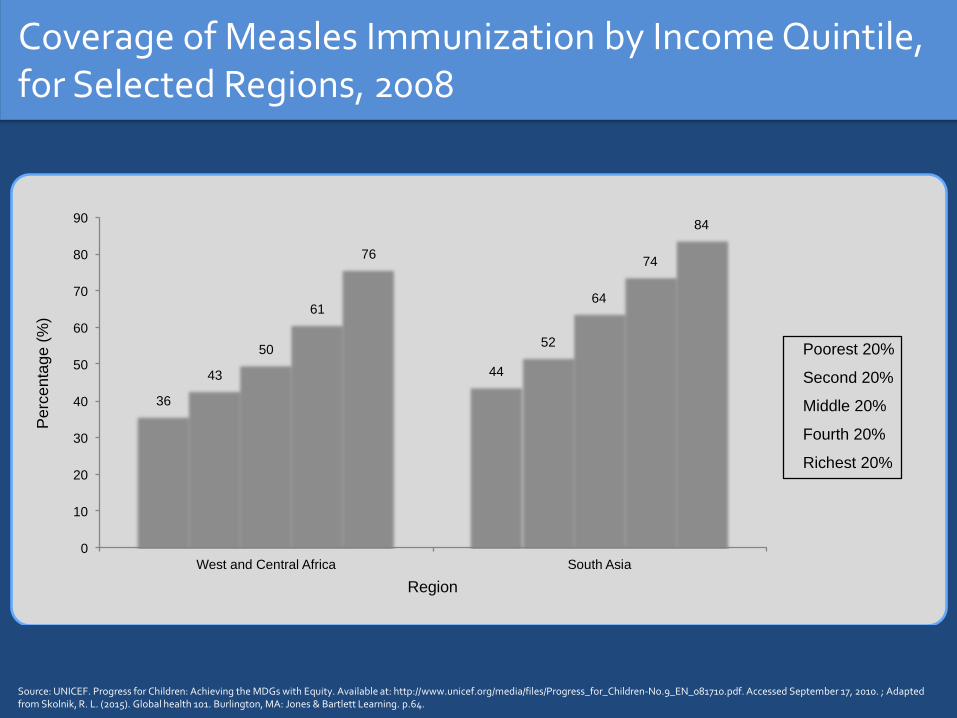
Coverage of Measles Immunization by Income Quintile, for Selected Regions, 2008
Source: UNICEF. Progress for Children: Achieving the MDGs with Equity. Available at: http://www.unicef.org/media/files/Progress_for_Children-No.9_EN_081710.pdf. Accessed September 17, 2010. ; Adapted from Skolnik, R. L. (2015). Global health 101. Burlington, MA: Jones & Bartlett Learning. p.64.
36
44 43
52 50
64 61
74 76
84
0
10
20
30
40
50
60
70
80
90
West and Central Africa South Asia
Perc
enta
ge
(%
)
Region
Poorest 20%
Second 20%
Middle 20%
Fourth 20%
Richest 20%
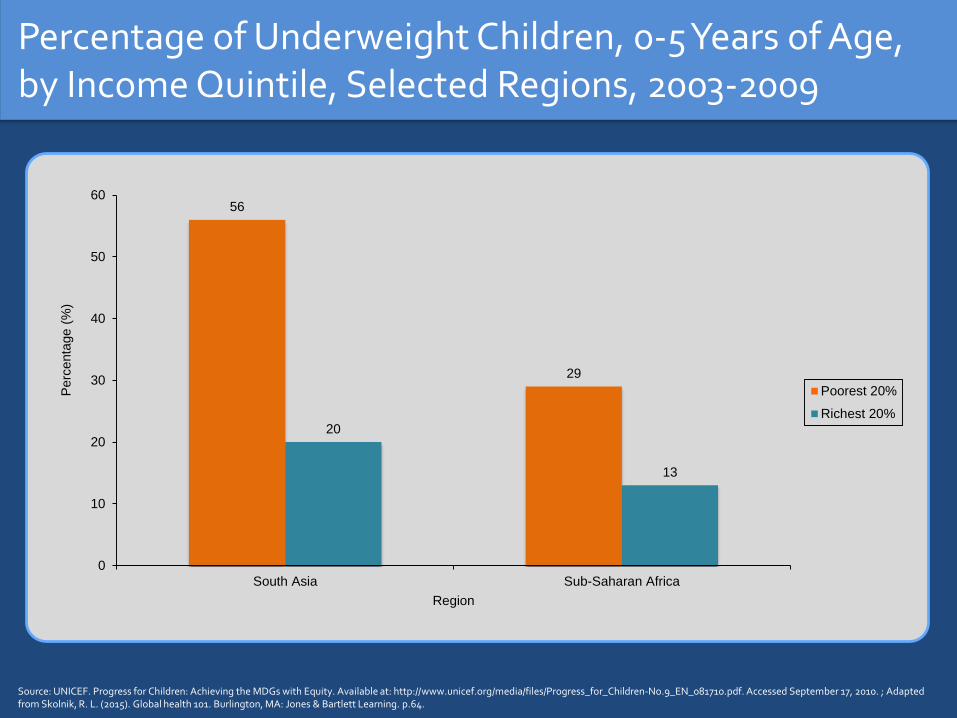
Percentage of Underweight Children, 0-5 Years of Age, by Income Quintile, Selected Regions, 2003-2009
56
29
20
13
0
10
20
30
40
50
60
South Asia Sub-Saharan Africa
Perc
enta
ge (
%)
Region
Poorest 20%
Richest 20%
Source: UNICEF. Progress for Children: Achieving the MDGs with Equity. Available at: http://www.unicef.org/media/files/Progress_for_Children-No.9_EN_081710.pdf. Accessed September 17, 2010. ; Adapted from Skolnik, R. L. (2015). Global health 101. Burlington, MA: Jones & Bartlett Learning. p.64.
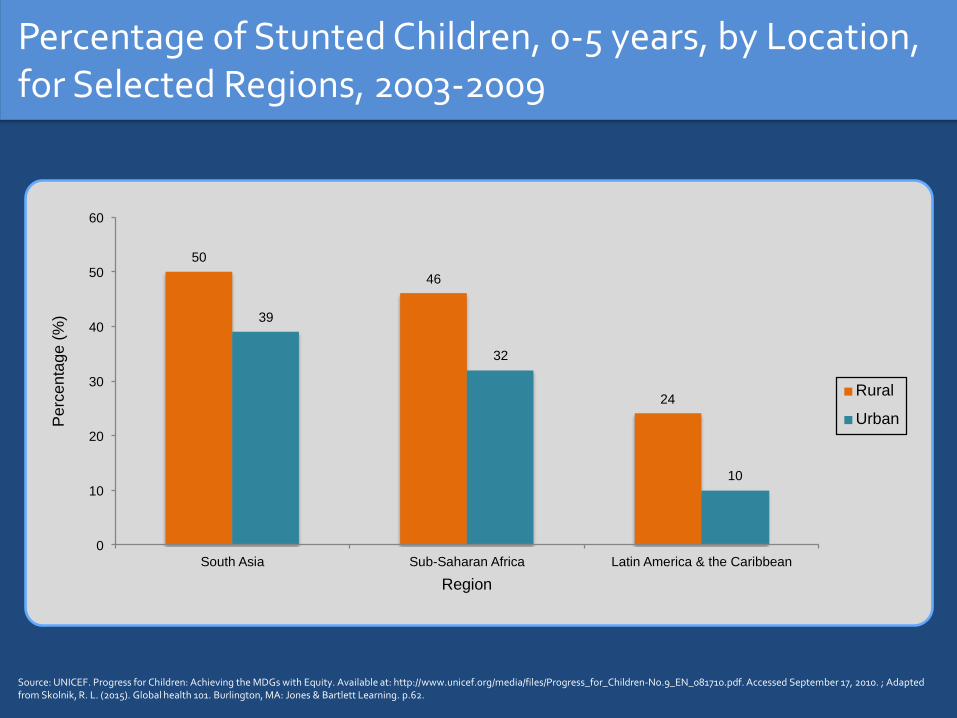
Percentage of Stunted Children, 0-5 years, by Location, for Selected Regions, 2003-2009
50
46
24
39
32
10
0
10
20
30
40
50
60
South Asia Sub-Saharan Africa Latin America & the Caribbean
Perc
enta
ge
(%
)
Region
Rural
Urban
Source: UNICEF. Progress for Children: Achieving the MDGs with Equity. Available at: http://www.unicef.org/media/files/Progress_for_Children-No.9_EN_081710.pdf. Accessed September 17, 2010. ; Adapted from Skolnik, R. L. (2015). Global health 101. Burlington, MA: Jones & Bartlett Learning. p.62.

Percentage of Women 15-49, Married or in Union, Who Are Using Contraception, by Location, for World Bank Regions, 2003-2009
79
70
56
50
18
78 78
66
61
31
0
10
20
30
40
50
60
70
80
90
East Asia & the Pacific Latin America & the
Caribbean
Middle East & North
Africa
South Asia Sub-Saharan Africa
Perc
enta
ge (
%)
Region
Rural
Urban
Source: UNICEF. Progress for Children: Achieving the MDGs with Equity. Available at: http://www.unicef.org/media/files/Progress_for_Children-No.9_EN_081710.pdf. Accessed September 17, 2010. ; Adapted from Skolnik, R. L. (2015). Global health 101. Burlington, MA: Jones & Bartlett Learning. p.62.
HEALTH SYSTEMS OVERVIEW

WHO Health System Framework
The WHO Health System Framework
System Building Blocks
Service delivery
Health workforce
Information
Medical products, vaccines, & technologies
Financing
Leadership/governance
Access
Coverage
Quality Safety
Improved health (level & equity)
Responsiveness
Social & financial risk protection
Improved efficiency
Overall Goals/Outcomes
Adapted from: World Health Organization. Everybody’s business: Strengthening health systems to improve health outcomes: WHO’s framework for action. Geneva: World Health Organization; 2007.
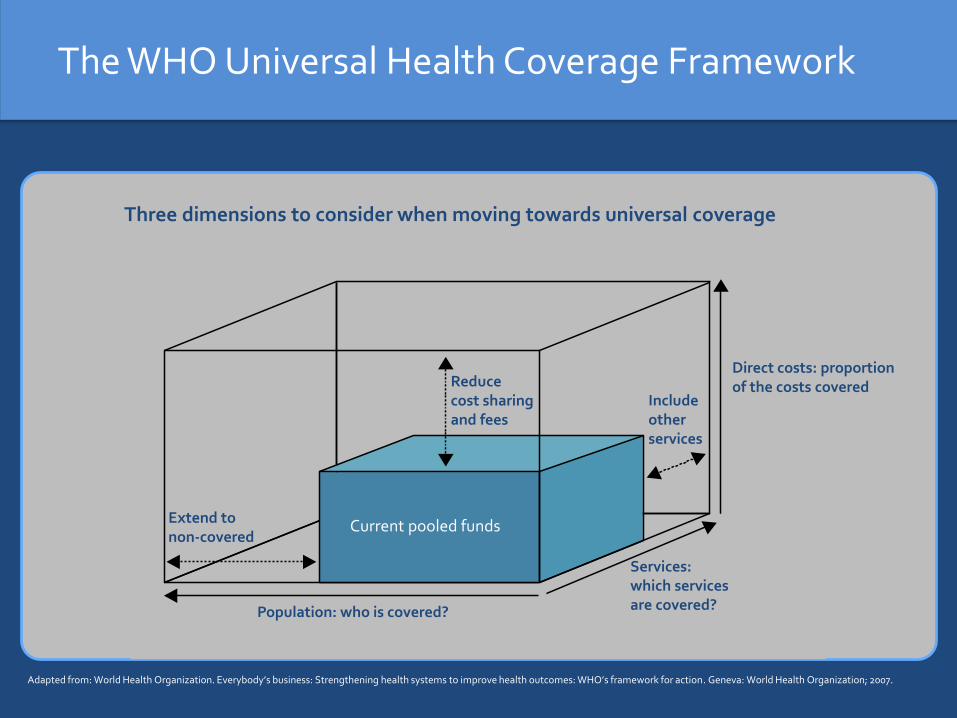
The WHO Universal Health Coverage Framework
f
Three dimensions to consider when moving towards universal coverage
Extend to non-covered
Reduce cost sharing and fees
Include other services
Services: which services are covered?
Direct costs: proportion of the costs covered
Population: who is covered?
Current pooled funds
Adapted from: World Health Organization. Everybody’s business: Strengthening health systems to improve health outcomes: WHO’s framework for action. Geneva: World Health Organization; 2007.

Many Countries Pursuing Reforms at Various Stages
Source: Presentation by Gina Langamarsino. “Universal Health Coverage – What’s all the “buzz” about?” R4D. February 12, 2012.
Kenya Ethiopia Uganda Zambia Sierra Leone
Liberia Mali Nepal Senegal
China
India
Nigeria
Tanzania
Cambodia Yemen Lao PDR
Ghana Indonesia South Africa Bolivia Morocco
Namibia Turkey
Vietnam Egypt Jordan
The Philippines Mexico Costa Rica Rwanda Peru
Colombia Chile Estonia Kyrgyz Republic Thailand
Brazil Argentina Korea Taiwan Tunisia
<30
%30
-60
%>
60
%
Per
cen
tag
e o
f p
op
ula
tio
n c
ove
red
Early Middle Advanced
Phase of implementation*
* All countries have made a political commitment to pursuing reforms through passing legislation, etc.
ADDRESSING CRITICAL CHALLENGES
Critical Challenges
• Key intersectoral issues
• Weak health systems and the lack of universal health coverage
• Health disparities
• The unfinished agenda
• Noncommunicable diseases
• Risks
• Other public goods

Key Intersectoral Issues
• Water, sanitation, and hygiene
• Tobacco
• Overnutrition/obesity
• Girls’ Education

Addressing Key Intersectoral Issues
• Promote handwashing and increase access to clean water
• MPower package on tobacco and related package on alcohol
• Tax food and beverages high in sugar
• Cash transfers for girls’ education
Key Health Systems Issues
• Enhance basic functions
• Strengthen workforce
• Improve effectiveness and efficiency
• Move toward universal coverage
Addressing Key Health Systems Issues
• Task-shifting
• Contracting in & contracting out
• Results based financing (RBF)
• Cash transfers (CCTs)
• Phase implementation
Key Challenges in Inequality and Inequity
• Health status
• Access to health services
• Coverage of health services
• Protection from financial risks because of health costs
• The extent to which the approach to financing health is fair
• The distribution of health benefits
Addressing Inequality and Inequity
• Measure
• Focus on marginalized groups
• Evaluate from an equity perspective

The Unfinished Agenda: Key Maternal Health Challenges
• Gender inequalities
• Child marriage
• Delaying age of first birth
• Access to contraception
• Complications during childbirth, such as maternal deathand morbidity

Addressing Maternal Health
• Improve nutrition of adolescent girls
• Community-based interventions aimed at delaying age at marriage and first birth
• Improve access to culturally appropriate modern contraceptives & education on three-year birth intervals
• Promote skilled attendants at delivery
• Increase access and adherence to prenatal care: including micronutrient supplementation, monitoring of hypertension & diabetes, & tetanus vaccination
• Ensure emergency obstetric care available
• Improve follow-up of post-partum care & counseling

The Unfinished Agenda: Key Neonatal Health Challenges
• Nutritional status of mother
• Low birthweight
• Prematurity
• Child caring practices
• Deliveries attended by skilled birthing attendants
Addressing Neonatal Health
• Ensure healthy mothers, who are immunized against tetanus
• Ensure attended delivery with emergency care available
• Promote keeping the baby warm
• Increase awareness of the benefits of kangaroo mother care
• Monitor vaccination
• Promote immediate and exclusive breastfeeding on a local and societal level
• Implement community-based diagnosis & treatment of pneumonia
• Train community health workers on referral for emergency care if needed for sepsis, etc.
The Unfinished Agenda: Key Child Health Challenges
• Maternal health & neonatal health interventions
• Exclusive breastfeeding for six months and hygienic introduction of a diverse complementary diet
• Mother to child transmission of HIV
• Malaria
• Vaccine preventable diseases
• Hygienic introduction of a diverse complementary diet
• Diarrheal diseases
• Micronutrient deficiencies
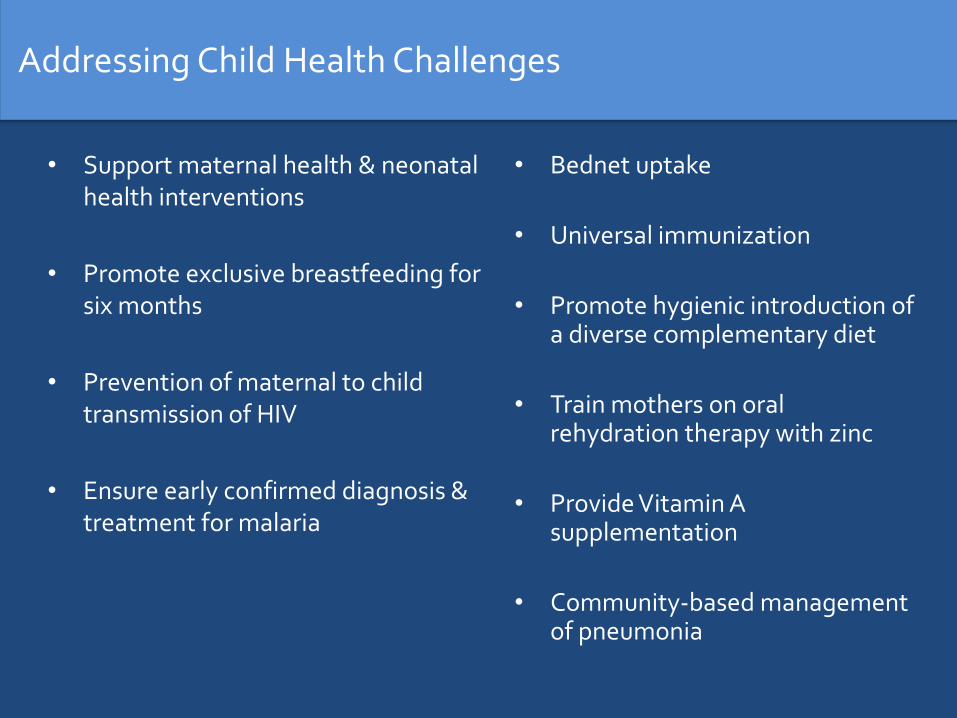
Addressing Child Health Challenges
• Support maternal health & neonatal health interventions
• Promote exclusive breastfeeding for six months
• Prevention of maternal to child transmission of HIV
• Ensure early confirmed diagnosis & treatment for malaria
• Bednet uptake
• Universal immunization
• Promote hygienic introduction of a diverse complementary diet
• Train mothers on oral rehydration therapy with zinc
• Provide Vitamin A supplementation
• Community-based management of pneumonia
The Unfinished Agenda: Key Challenges in Communicable Diseases
• HIV
• TB
• Malaria
• NTDS
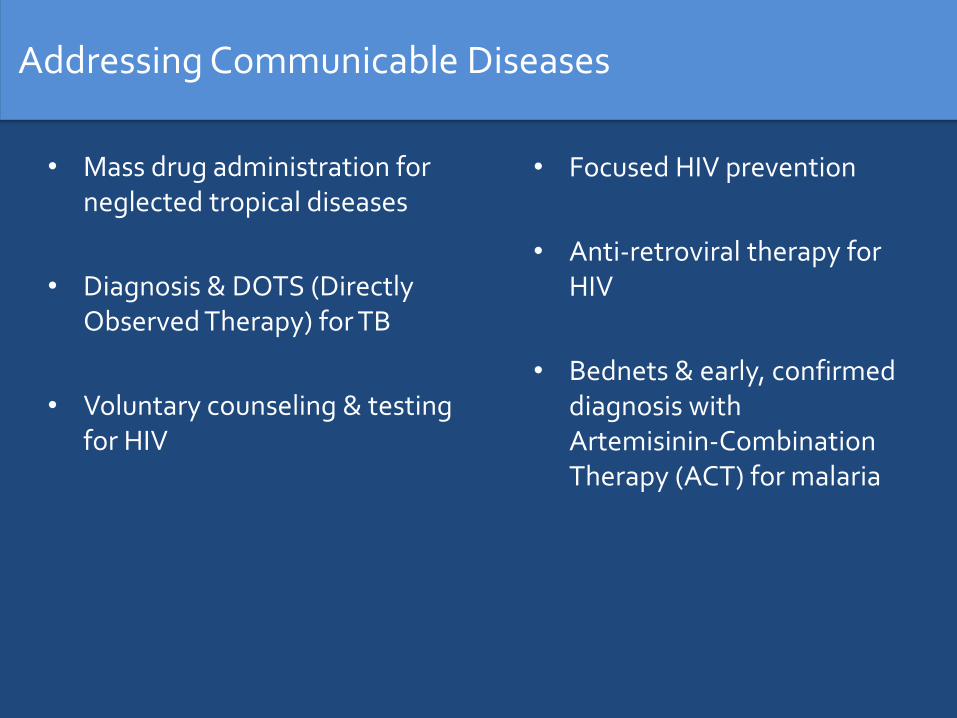
Addressing Communicable Diseases
• Mass drug administration for neglected tropical diseases
• Diagnosis & DOTS (Directly Observed Therapy) for TB
• Voluntary counseling & testing for HIV
• Focused HIV prevention
• Anti-retroviral therapy for HIV
• Bednets & early, confirmed diagnosis with Artemisinin-Combination Therapy (ACT) for malaria

Key Challenges in Noncommunicable Diseases
• Tobacco
• Alcohol
• Eating Behaviors
• Physical Activity
• Cancer Vaccines

Addressing Noncommunicable Diseases
• The mPower package on tobacco
• Analogous measures on alcohol
• Enable healthier foods & more exercise
• Treat to reduce cholesterol
• Cancer Vaccines-Hep B and HPV
• Reduce salt consumption
• Aspirin for myocardial infarctions
• Treat hypertension
• Community-based approaches to diagnosis, psychosocial support, & treatment of mental disorders
Key Challenges in Preventing Epidemics and Antimicrobial Resistance
• Disease surveillance
• Surveillance of anti-microbial resistance
• Strengthened laboratory capacity
• Ability to respond nationally to emerging and re-emerging infections and anti-microbial resistance
• Rational use of pharmaceuticals

Preventing Epidemics and the Spread of Antimicrobial Resistance
• Have procedures in place beforehand
• Have mechanisms in place to mobilize quickly
• Engage local communities
• Raise awareness of the public of potential threats

Key Challenges in Public Goods
• The need for new diagnostics, drugs, & vaccines
• Gaps in cross-cutting surveillance
• The need for rapid response to disease outbreaks
• Financial gaps for countries with limited fiscal space
Addressing Public Goods
• Global collaboration
• Implementing push and pull interventions for product development
• Public-private partnerships
• Innovative financing mechanisms

Putting it All Together
• Achieve UHC
• Align Platforms for Service Delivery
• Implement Intersectoral and Fiscal Measures
Main Messages
• The health of anyone, anywhere is the health of everyone, everywhere
• There has been some important progress
• There remains, however, a substantial unfinished agenda and an emerging agenda
• Substantial equity issues also remain
• A large share of deaths and DALYS are preventable by addressing a small number of risk factors
• The issue now is to address intersectoral issues and move as fast as possible to addressing key issues through effective and efficient UHC
Thanks
• Lindsey Hiebert
• Rachel Wilkinson
• Rachel Skolnik Light
• Sarah Walker
• Rachel Strodel
Also, special thanks to Coursera for allowing the repurposing of many slides from my new course, Global
Health 101