Embed Size (px)
Citation preview

ICES m ar. Sei. Sym p., 195: 316-325. 1992
Global greenhouse effects, multi-decadal wind trends, and potential impacts on coastal pelagic fish populations
Andrew Bakun
Bakun, A. 1992. Global greenhouse effects, multi-decadal wind trends, and potential impacts on coastal pelagic fish populations. - ICES mar. Sei. Symp., 195: 316-325.
Potential linkage of long-term trends in sea surface windstress in the North Atlantic to global climate change is investigated. Seasonal and locational aspects of the trends appear to correspond to a proposed “greenhouse” mechanism. A potential artifact related to increasing frequency of anemometer measurements is addressed, and several types of information tending to substantiate the reality of the indicated trends are presented. Potential alterations in suitability of reproductive habitats of coastal pelagic fishes are suggested.
La liaison potentielle entre les tendances à long terme de la tension du vent de surface en mer et le changement global du climat est examinée. Les aspects saisonniers et locaux des tendances semblent correspondre à un mécanisme de type “effet de serre” . Un artefact potentiel dû à l’accroissement des fréquences des mesures anemo- métriques est abordé et plusieurs sources d ’information tendent à prouver la réalité des tendances présentées. Les altérations potentielles des zones de reproduction des espèces pélagiques côtières sont suggérées.
Andrew Bakun: Pacific Fisheries Environmental Group, N O A A /N M F S, Southwest Fisheries Science Center, PO Box 831, Monterey, California 93942, USA.
Introduction
The existence of interdecadal trends both in ocean characteristics (e.g. Dickson etal., 1988a) and in marine biological populations (e.g. Corton, 1990) has been well documented in the North Atlantic as well as in other regions of the world's oceans (e.g. Sharp and Csirke, 1983). For example, Dickson etal. (1988b) have pointed out a major long-term increase in northerly winds during spring and summer over the eastern North Atlantic and related that to important changes in biological populations in the region. Bakun (1990) showed that corresponding increases in wind have apparently also occurred in other eastern ocean boundary regions, and suggested a linkage to “global warming” (Schneider, 1990; Anon., 1990). The linkage to the progressive accumulation of anthropogenic greenhouse gases in the earth’s atmosphere is of great interest, introducing a powerful degree of predictability into important phenomena which have heretofore been unpredictable. It also carries an implication of rapid progressive extension of climatological trends beyond the range of historical experience and perhaps beyond the limits accounted for in biological “life style” adaptations.
On the other hand, other investigators (Ramage,
1987; Cardone et al., 1990) have pointed out that indications of long-term increases in winds over the oceans may be merely artifacts related to the monotonically increasing proportion of anemometer measurements to Beaufort estimates in the available distributions of maritime wind reports. Clearly, among the most important questions regarding long-period hydrobiological variability are: (1) Are the reported increasing trends in spring and summer winds over the coastal oceans real? (2) If real, are they linked to global climate change?
Linkage to resource dynamics - results from SARP
The Sardine-Anchovy Recruitment Project (SARP), the initial focal project of the Programme of Ocean Sciences in Relation to Living Resources (OSLR) which is co-sponsored by the Intergovernmental Oceanographic Commission and the Food and Agriculture Organization of the United Nations, has now been in existence for over six years (Anon., 1983; Anon., 1989). The small, pelagic-spawning, clupeoid fishes that are the focus of SARP comprise a major portion of the world's fisheries production. In addition, they constitute an
316
extremely important food base for other valuable fish species in many of the large marine ecosystems of the world. The SARP studies have tended to implicate three general types of factors which act in combination to produce favorable reproductive habitat: (1) enrichment of the food web via physical processes (upwelling, mixing, etc.); (2) opportunity for concentrated patch structure of food particles to accumulate (i.e. stability, lack of active turbulent mixing, and/or strong convergence in frontal structures); (3) availability of mechanisms promoting retention of reproductive products within the neritic habitat. All of these are substantially linked to wind intensity and pattern, but the relationships differ (in fact, in the case of factor types (1) and (2), the functional relationships to wind intensity tend to be in opposition). Accordingly, the three types of factors are mutually supportive only within special environmental configurations (Bakun, in press). Thus, greenhouse- related wind changes would seem capable of rearranging the geography of suitable spawning habitat, irrespective of any local temperature changes caused by direct greenhouse warming.
Mechanism for wind intensification
Bakun (1990) described a mechanism by which greenhouse-related amplification of heating during spring and summer intensifies the thermal low pressure cell over the coastal landmass. This leads to an enhanced onshore-offshore pressure gradient between this continental thermal “low” and the oceanic “high” offshore. The stronger pressure gradient induces strengthened alongshore geostrophic wind, causing enhanced offshore Ekman transport and amplified coastal upwelling on either side of a continent and in either the northern or southern hemisphere (Fig. 1). The increased upwelling and mixing implied by such a wind increase, by cooling the coastal ocean surface layers and further accentuating the ocean-continent temperature contrast, might constitute a positive feedback loop (Bakun, 1990) leading to further amplification of the effect.
Eastern sides of oceans are characterized by a much drier atmosphere than western sides. Since the most important greenhouse gas in the atmosphere is water vapor, the global accumulation of C 0 2, methane, chlorofluorocarbons, etc., will have a larger relative “greenhouse effect” along eastern ocean boundaries than in other ocean regions. Note that the Atlantic ocean-atmosphere system is much more subject to continental influence than is the Pacific system. Thus large- scale effects of such a process might be expected to be more immediately evident in the Atlantic.
Evidence from other regions
Bakun (1990) presented indications of substantial multi-
decadal increases in upwelling-producing wind stress off California, off Peru, off Morocco, and off the Iberian Peninsula. Roy (1990) indicated similar trends along much of the Northwest African Coast. Although the data are much more sparse, indications of corresponding increases also appear in the maritime report files from other important eastern ocean upwelling systems (e.g. off Chile and off South Africa, Fig. 2).
The multi-decadal upward trend is pronounced in the various series presented by Bakun (1990); however, a widespread tendency for the most rapid increases to be from the mid-1950s to the mid-1970s is evident. After this period the trends in widely separated regions, in both the northern and southern hemispheres and in both the Atlantic and Pacific, appear to level off, or even to “flip over” to negative trends (see also Roy (1990)).
An explanation of this “flip over” feature is not available at present. However, the Pacific system is known to have been in a state of somewhat elevated “El Nino” character since the mid-1970s. The waters of the Pacific Ocean constitute the greatest mass of the heat storage capacity on earth. Its atmosphere is only minimally subject to continental effects, and so is not nearly so strongly forced into seasonal climatic regularity as are the atmospheres of more continentally influenced oceans. The result is that the coupled ocean-atmosphere system of the Pacific “wanders” from year to year, in response to its own internal dynamics, to a much greater degree than do other regions of the globe. The most dramatic expression of this interyear variability of the Pacific system is the El Nino-Southern Oscillation (ENSO) phenomenon. Because the Pacific is so large, its effect is global. Accordingly, ENSO constitutes the dominant mode of short-term climatic variability throughout the world. Note that Inoue and O ’Brien(1987) have reported an apparent decrease in strength of the trade winds in the tropical Pacific during the late 1970s. It is reasonable to speculate that the interruption of the upward trends in the coastal upwelling systems in the mid-1970s may be a global response to internal variability in the Pacific ocean-atmosphere system, which may be superimposed on the proposed underlying longer-term greenhouse-related global increase.
Spring-summer trends in wind in the North Atlantic
In order to examine the situation in the North Atlantic, time series of monthly resultant windstress estimates were produced for the period at a number of locations (A through O, Fig. 3) according to the methodology of Bakun (1973). Components were resolved along the dominant directions (Fig. 3) of wind flow around the Subtropical Gyre during spring and summer, and averaged for the months of April through September for each year since 1946 (Fig. 4). Tests for linear trends were
317

N
C O A S T AH EATIN
<1 EK M A N
LruO ce an ic ; "H igh " ; Therm
"Low "
NORTHERNHEMISPHERE
UJ l
LnJ
SOUTHERNHEMISPHERE
Figure 1. Proposed mechanism. Increased seasonal heating due to atmospheric greenhouse effect increases temperature contrast between continental land mass and coastal ocean. The thermal low pressure cell in the continental interior is intensified, increasing the cross-shore pressure gradient between the spring-summer continental “Low” and the offshore oceanic “High” . This increased pressure gradient supports an intensified alongshore geostrophic wind directed such that, with respect to a person facing downwind low pressure would be on his left in the northern hemisphere and on his right in the southern hemisphere Correspondingly increased Ekman transport, directed 90° to the right of the wind in the northern hemisphere (to the left in the southern hemisphere), leads to enhanced coastal upwelling which may feed back as further enhanced land-sea temperature contrast. r
Chile (Coquimbo, Oct-Mar) South Africa (Cape Columbine, Oct-Mar)
1.0
.8
.6
. • o srV-
—L— Ë___ L_
1.2
1.0
.8
.6
45 50 55 60 65 70 75 80 85 90
' ■ 0 ÉT- -
3' °0 ■45 50 55 60 *65 70 75 80 85 90
Figure 2 Spring-summer (Oct-Mar) averages of monthly windstress estimates produced from areal summaries of maritime wind reports, (a) Chile (30°S to 37°S, from the coast to 75°W). (b) South Africa (32°S to 35°S, 16° to 18°E).

60
50
Vigo
40Cascais
30
20
.Tombouctou
10
80 70 60 50 40 30 20 10 0 10
Figure 3. The North Atlantic. Locations at which time series have been constructed are indicated by the symbols (identified by capital letters to correspond to the time series plots shown in Figs. 4, 6, and 7 and to the entries in Tables 1 to 3). Arrow symbols (A to O) indicate positions of time series of stress estimates and point in the direction toward which the components treated in Figure 4 and Table 1 have been resolved. Circular symbols (P to S) indicate positions of atmospheric pressure time series treated in Figure 6 and Table 2.
performed (Table 1): (1) for the entire period, (2) for the period 1958-1973 of particularly rapid increases in several systems examined by Bakun (1990), and (3) for the period since 1973.
On the western side of the Atlantic the long-term (1946-1990) trend toward increasing alongshore wind- stress is highly significant at Cape Hatteras (A). The trend remains positive but becomes progressively weaker northward along the North American continental boundary (B, C), where the orientation of the coast is such that the perpendicular inland direction becomes increasingly northward, thus tending to oppose continental heating in the interior relative to the ocean area. Along the northern limb of the Gyre, where direct
contact with a continental landmass is lost, the trend actually turns negative (D, E). Approaching the European continent, the negative trend diminishes to be nearly “flat” at the French coastal location (F). However, on the relatively meridional coast of the Iberian Peninsula (G, H, I) a strong, highly significant increasing trend is evident. The increase is particularly pronounced at the central location (H) where the “temperature contrast” effect of the Iberian landmass would tend to act most directly. Near the separation between the European and African continents, where the configuration of a “continental interior” is somewhat complicated by the presence of the Mediterranean Sea, etc., the increasing trend disappears (J). Note that a similar
319

ErratumHydrobiological Variability in the ICES Area, 1980-1989 ICES mar. Sei. Symp., 195: 316-325
Bakun, A. Global greenhouse effects, multi-decadal wind trends, and potential
impacts on coastal pelagic fish populations
It is regretted that, because of a printing error, Figure 3 on page 319 of the
above volum e was reproduced w ithout the coastline.An amended page is printed on the reverse of this sheet for insertion at
the appropriate point.
R. R. Dickson
Editor-in-Chief

60
50
i Vigo
40
I. -()■
30
20
.B am ako
10
Figure 3. The North Atlantic. Locations at which time series have been constructed are indicated by the symbols (identified by capital letters to correspond to the time series plots shown in Figs. 4, 6, and 7 and to the entries in Tables 1 to 3). Arrow symbols (A to O) indicate positions of time series of stress estimates and point in the direction toward which the components treated in Figure 4 and Table 1 have been resolved. Circular symbols (P to S) indicate positions of atmospheric pressure time series treated in Figure 6 and Table 2.
performed (Table 1): (1) for the entire period, (2) for the period 1958-1973 of particularly rapid increases in several systems examined by Bakun (1990), and (3) for the period since 1973.
On the western side of the Atlantic the long-term (1946-1990) trend toward increasing alongshore wind- stress is highly significant at Cape Hatteras (A). The trend remains positive but becomes progressively weaker northward along the North American continental boundary (B, C), where the orientation of the coast is such that the perpendicular inland direction becomes increasingly northward, thus tending to oppose continental heating in the interior relative to the ocean area. Along the northern limb of the Gyre, where direct
contact with a continental landmass is lost, the trend actually turns negative (D, E). Approaching the European continent, the negative trend diminishes to be nearly “flat” at the French coastal location (F). However, on the relatively meridional coast of the Iberian Peninsula (G, H , I) a strong, highly significant increasing trend is evident. The increase is particularly pronounced at the central location (H) where the “temperature contrast” effect of the Iberian landmass would tend to act most directly. Near the separation between the European and African continents, where the configuration of a “continental interior” is somewhat complicated by the presence of the Mediterranean Sea, e tc ., the increasing trend disappears (J). Note that a similar
319
A. Cape Hatteras
■ ° a °^ 0 n J V ' ■ J a -
0. •' Q □ □ - ° ; a& b0D « ö 0 ' Q
1-------------1------------- i------------ 1-------------1-------------1------------
F. Belle île.15 - 0 □
.10 .ej l a 0
Q \ °. P . d. 'T .20Û
o ?
.05 0 00 , ° _ Ç . er V 0 ° ° ;1 n
•• O : 15 ?. : \ p. Q^ J U l p - ____ i _ 5 j* _ ^ ^ _
.00
05S
□
D
° ' * y v °ai P û i i ö , , , , , ,
. I u
.00
•to ^ p & û . n - : 5 • : o _ ö : □ o
' ■ / b ? “ ? 6 ■' a
4 5 5 0 5 5 60 6 5 7 0 7 5 8 0 8 5 9 0 4 5 5 0 5 5 6 0 6 5 7 0 7 5 8 0 8 5 9 0
B. Georges Bank G. Cabo Finisterre.30 P. .40 O
.30
.20
.10i.: -0 -
^ oa- J_______ I____2 _ l _______ L_
q .9 o □•(30 i . Jr-
■ i I I_______ I
4 5 5 0 5 5 6 0 6 5 7 0 7 5 8 0 8 5 9 0 4 5 5 0 5 5 6 0 6 5 7 0 7 5 8 0 8 5 9 0
C. Sable Island Bank.50
■40-.*. 3 0
.20
.10
- * y - r - ' . r r * * "o Q : q û -J O O
i J_______ i_______ i_______ I—
4 5 5 0 5 5 6 0 6 5 7 0 7 5 8 0 8 5 9 0
H. Nazare
- -er • . -------- - z r b~-, —D«- ° : 0
°n 0 •’ ' •' QQd °- ° , o 9 ,
45 50 55 60 65 70 75 8 0 85 90
D. Flemish Cap
0 • _D0 . n
.24 5 5 0 5 5 6 0 6 5 7 0 7 5 8 0 * 8 5 9 0
I. Cabo Säo Vicente
o 9 D.
jj Ï V -B. ~5 o' i, D : 50 b 0‘
□ Q
‘ V " ■ r öo q-
□ 04 5 5 0 5 5 6 0 6 5 7 0 7 5 8 0 8 5 9 0
E. Westerlies1.0
.8
.6
. 4
-:~°w 1 dq° : P :.
h .a : p1* T 't>■i ° ? a,°i
4 5 5 0 5 5 6 0 6 5 7 0 7 5 8 0 8 5 9 0
J . Casablanca1 2 r
1.0 -
• i O à q ° . P H H ° a Q■- 0— — — -L öa _____ p ø.Qiv ■ ■a n ^ '
4 5 5 0 5 5 6 0 6 5 7 0 7 5 8 0 8 5 9 0
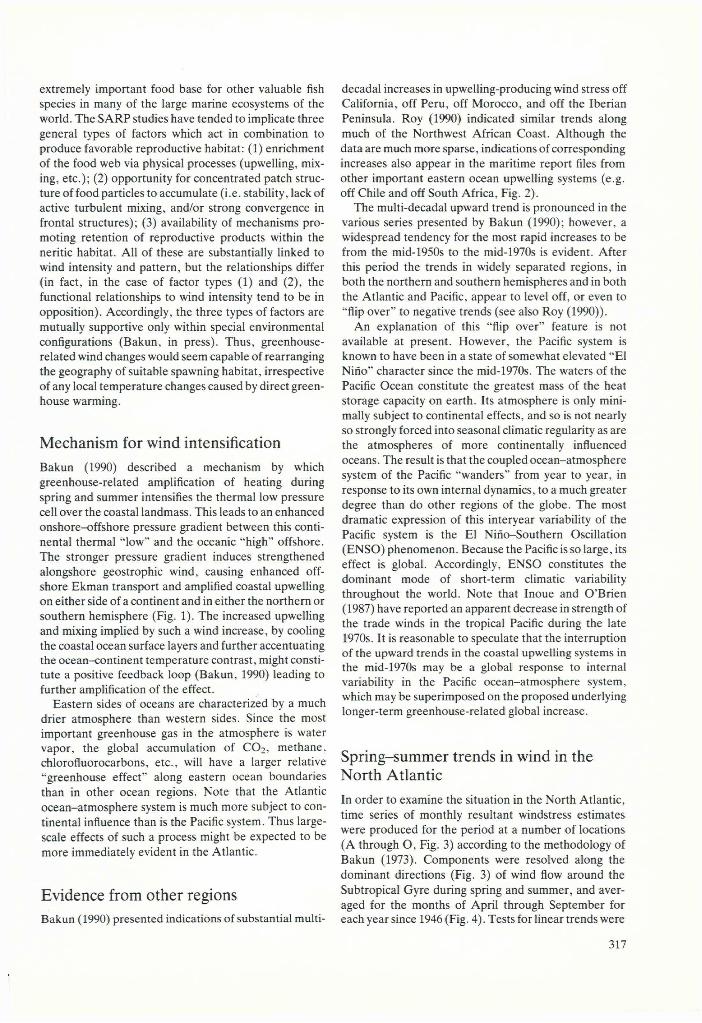
Figure 4. Time series of spring-summer (Oct-M ar) averages of monthly resultant windstress estimates (dyne cm-2) at locations indicated in Figure 3. The long-term mean of each series is indicated by the horizontal line of short dashes. The linear trend, fitted by least squares, is indicated by the line of longer dashes.
disappearance of the increasing trend off western North America occurs off the Baja California Peninsula, where the Gulf of California occupies what would be the “continental interior” (Bakun, 1990). The long-term increasing trend reappears strongly to the south along the African coast (K through O), where first the Sahara Desert and then the African savanna lands occupy the “interior” .
The global pattern of steepening of the trend in the period 1958-1973 followed by a leveling off or reversal in the later period 1973-present, apparent in the series presented by Bakun (1990) and also by Roy (1990), is
evident in many of these series (see columns located to the right in Table 1).
Are the trends real?
The bulk of the available wind reports in the historical files are Beaufort estimates rather than anemometer measurements. These estimates, which are based on visual effects of winds on the sea surface, are “raised” to reflect a 10 m “mast height” reference using standard conversion tables. However, since the 1950s, the fraction of anemometer measurements in the marine report
320

K. Cap Sim2 .5 D
2.0
1.5
1.0
ü ;-\a- u
.0^ - Ù - - ôb.
. 5 . _
° n ° ö q c■ a w
00
J_____ I ^ P l ___ _ l_____ I_____ L_
4 5 5 0 5 5 6 0 6 5 7 0 7 5 8 0 8 5 9 0
L. Cap Juby
2.5
2.0
1.5
1.0
cr " o " o.p
Li 1 i i i i i
4 5 5 0 5 5 6 0 6 5 7 0 7 5 8 0 8 5 9 0
M. Cabo Bojador3-0 r .o
a- 9 ?„• :2 .5 - *
2.0
1.5
1.0
: ù 0.0- f~ j, JJ
4 5 5 0 5 5 60 6 5 7 0 7 5 8 0 8 5 9 0
N. Cap Blanc3.0 -
2.5 -
2.0 -
1.5 ■=_ - p 2
1 0 - ,
45 50
• o Ooet1
r . - - -°n
qg.° I _ L_
45 50 55 60 65 70 75 80 85 90
O. Cap Vert1.4
1.2
1.0Q0" “D *
1200
1000
8 0 0
6 0 0
4 0 0
200
0
A N E M O M E T E R :
N O T IN D IC ATED □
IN D IC A TE D ■
a.
_J---------------------- L_
5 0 5 5 6 0 6 5 7 0 7 5 8 0
AN EM O M E TE R :
N O T IN D IC A TE D □
IN D IC ATED A- - A
M .ft***/.b . p"q ■ , y,rj5.'_i■>f-+si'nrö
................... . .'.û ?.............. . -Bl*' ”À ....... ;...#1.....?' V J %:
,:a.......... \ o
50 55 60 65 70 75 80
1.0
.9
.8
7
6
.5
4
50 55 60 65 70 75 80
4 5 5 0 5 5 6 0 6 5 7 0 7 5 8 0 8 5 9 0
files has been increasing (Ramage, 1987). It appears that the majority of ship’s anemometers are actually installed at greater heights above the sea surface than the 10 m standard height to which the Beaufort estimates are calibrated (Cardone et al., 1990). This would cause an overestimate of the wind at 10 m which would lead to a corresponding overestimate of the sea-surface stress. Thus there may be an artificial increasing trend in wind speeds inferred from the maritime data files.
For example, Whysall et al. (1987) report an apparent strengthening of zonal winds of about 1 m sec-1 from 1961 to 1983 over a large region of the tropical Pacific Ocean. However, Wright (1988) and Posmentier et al. (1989) conclude that such a trend is inconsistent with a lack of evidence of corresponding changes in sea-surface
Figure 5. Time series constructed from samples of maritime reports (from within 5° areal quadrangles indicated in Figure 3 by fine dashed lines off the Iberian Peninsula) which have been “split” according to the “measured or estimated” indicator in the report format, (a) Numbers of available reports per month in the northeastern quadrangle (off Vigo), (b) April to September means of windstress estimates (dyne cm“ 2) in the northeastern quadrangle. Shorter heavy dashes indicate the linear trend of the anemometer-based series. Longer heavy dashes and fine dotted line indicate the linear trend of the Beaufort estimate-based series over the same 1964-1979, and the longer 1948-1979, periods respectively, (c) April to September means of windstress estimates in the southeastern quadrangle (off Cascais).
temperature and sea-level patterns and therefore must be spurious. Note that in upwelling regions, the “anemometer effect” would be amplified because the particularly stable lower atmosphere in these regions would cause larger differences between the wind directly at the sea surface, which is reflected in a Beaufort estimate, and the wind at mast height which would be measured by an anemometer. (Moreover, it is possible that even the historical series of analyzed fields of atmospheric pressure could be effected. In most analysis schemes, both in the recent objective computer-based methodologies and in the earlier subjective manual methodologies, some
321

Table 1. Trends in April-September averages of monthly resultant stress components oriented as indicated in Figure 2. (Bold numbers: slope of the linear trend line, dyne cm -2 yr_ I . In parentheses: correlation with a pure linear trend. Significance: * = p < 0.05; ** = p < 0.01. Indicated significance levels not adjusted for residual autocorrelation.)
1946-1990 1958-1973 1973-1990
A. Cape Hatteras 0.0028 (0.72)** 0.0018 (0.28) 0.0001 (0.01)B. Georges Bank 0.0007 (0.14) 0.0014 (0.21) -0 .0050 (0.33)C. Sable Island 0.0014 (0.21) 0.0066(0.56)** -0 .0030 (0.15)D. Flemish Cap -0 .0024 (0.24) 0.0048 (0.30) 0.0028(0.13)E. Westerlies -0 .0074 (0.56)** -0 .0106 (0.42)* 0.0007 (0.04)F. Belle Isle -0 .0010 (0.01) 0.0001 (0.01) -0 .0042 (0.53)G. Cabo Finisterre 0.0034(0.50)** 0.0049 (0.39) -0 .0001 (0.00)H. Nazare 0.0073 (0.54)** 0.0167 (0.62)** -0 .0161 (0.57)I. Cabo San Vicente 0.0037(0.38)** 0.0044 (0.23) -0 .0098 (0.42)J. Casablanca -0 .0027 (0.19) -0.0209(0.60)** 0.0197 (0.70)K. Cap Sim 0.0134 (0.39)** -0.0061 (0.08) 0.0394(0.56)L. Cap Juby 0.0160(0.44)** 0.0287 (0.31) -0 .0188 (0.39)M. Cabo Bojador 0.0144 (0.37)** 0.0389 (0.40) -0 .0480(0 .71)N. Cap Blanc 0.0182(0.45)** 0.0465(0.51)* -0 .0709 (0.89)O. Cap Vert 0.0124 (0.69)** 0.0033 (0.24) 0.0043 (0.22)
a. Bermuda-Azores High - 30N, 40W26.0 h
25.0
24.0
23.0
22.0
"F ° - _ .a- — - o- -, ? »V >‘ 5-
45 50 55 60 65 70 75 80 85 90
b . Icelandic Low - 63N, 20W
»
so =° °i . .. - t j — - r t r - a - - -
' '• ° : ; I * % 6 0 :0 ■ **'
a I_____ I_____ LÛ____I_____ I_____ I-------- 1-------- 1------
45 50 55 60 65 70 75 80 85 90
C. North America - 47N, 71W (Quebec)
16.0
15.0
14.0
13.0
■ O n • a ; . à
° . 13 : : ^ ■ ■ a rr A“T —o —- -en“D_ _0 d\
45 50 55 60 65 70 75 80 85 90
d . North Africa - 16N, 3W (Tombouctou)
— Q«_ o o —
w -r - a - »-a. ...................“ o' — ®SQw BO
4 5 50 55 60 65 70 75 80 85 90
Figure 6. Spring-summer (Apr-Sep) time series of atmospheric pressure (mb-1000), produced at locations P to S indicated in Figure 3 from large-scale analyzed pressure fields (source: US Navy, Fleet Numerical Oceanography Center).
provision has been made to ensure that the synoptic pressure gradients reflect a reasonable dynamic balance with contemporaneous wind reports.)
M easured versus estimated time series
In the coded data record format in which the maritime reports are archived, there is one space which is coded “blank” if the wind report is a Beaufort estimate and “zero” if it is an anemometer measurement. However, there is no allowance for missing information, which apparently would be coded “blank” . Thus it is likely that some anemometer measurements may be mistaken for Beaufort estimates in the files. There is also the possibility of erroneous codes in certain of the source decks (Cardone etal., 1990).
When the available report file is divided according to the “measured or estimated” indicator, it is clear that the proportion of anemometer measurements has indeed increased in the North Atlantic area since the early 1960s (Fig. 5a). But when separate time series are produced from the split samples, both the measured and estimated windstress time series tend to separately corroborate the upward trend (examples are shown for two separate areas in Figures 5b and c). Note that after about 1968, when there began to be substantial numbers of reports in the measured series, the year to year fluctuations, as well as the upward trend, tend to be "mirrored” in both the measured and estimated time series. However, the estimates in the measured series tend to be consistently higher than in the estimated series. Thus the indication is that there is an “anemometer effect” that may indeed account for a minor increasing trend in wind series produced from maritime wind reports, but that this accounts for only a fraction of the increasing trend off the Iberian Peninsula (and assumedly in other regions of equal or stronger indicated trend).
322
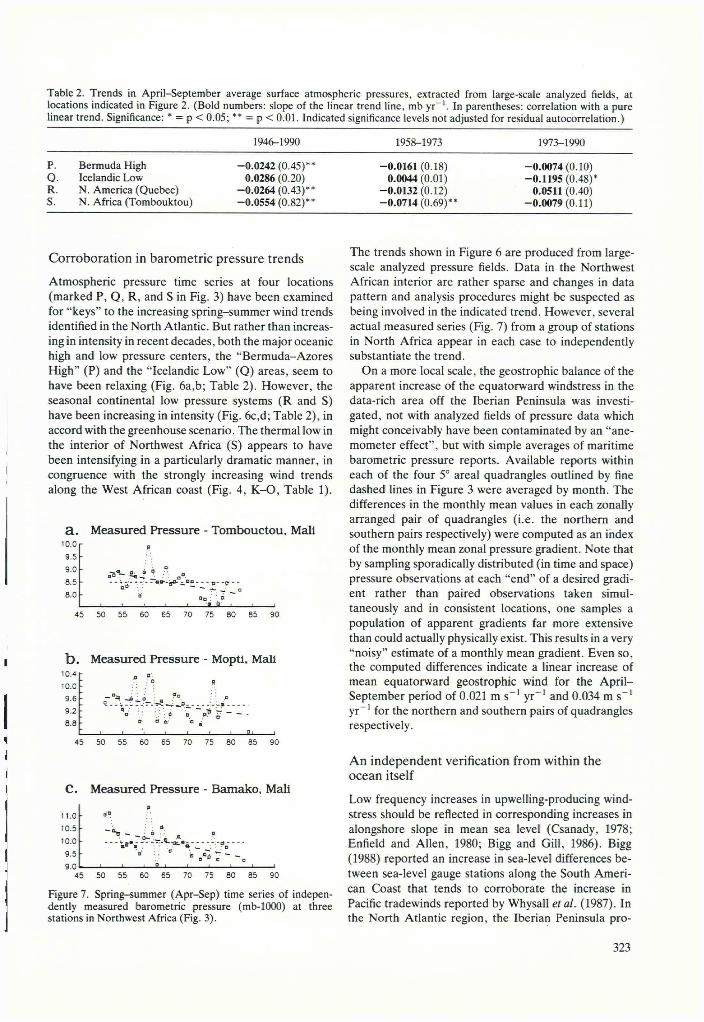
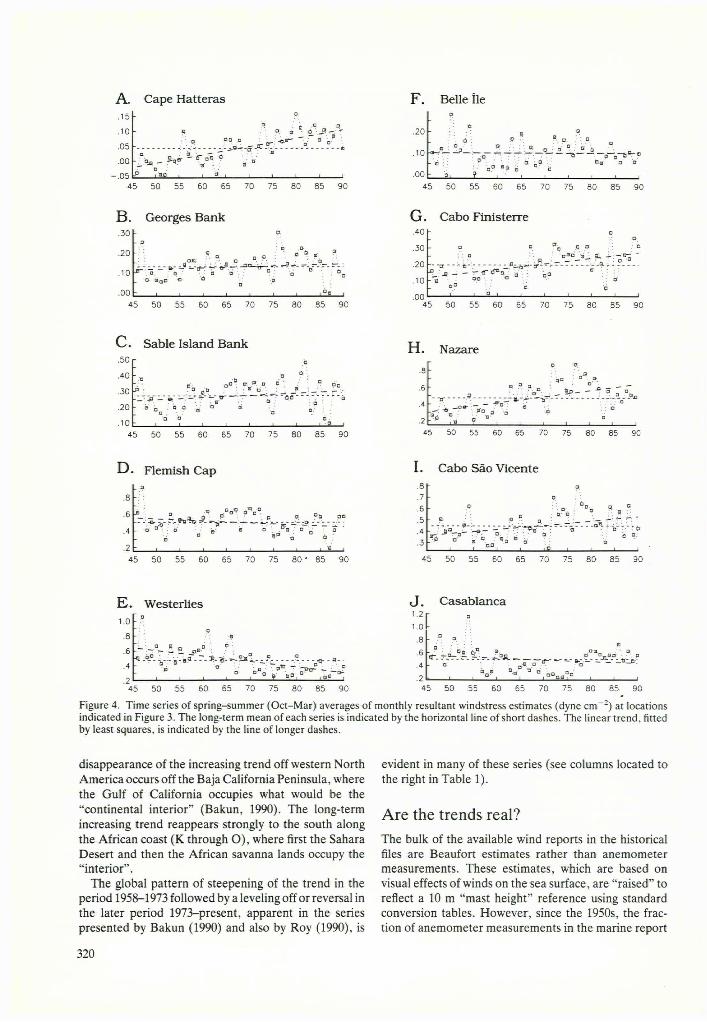
Table 2. Trends in April-September average surface atmospheric pressures, extracted from large-scale analyzed fields, at locations indicated in Figure 2. (Bold numbers: slope of the linear trend line, mb yr“ 1. In parentheses: correlation with a pure linear trend. Significance: * = p < 0.05; ** = p < 0.01. Indicated significance levels not adjusted for residual autocorrelation.)
1946-1990 1958-1973 1973-1990
P. Bermuda High -0 .0242 (0.45)** -0.0161 (0.18) -0 .0074 (0.10)Q. Icelandic Low 0.0286 (0.20) 0.0044 (0.01) -0.1195(0.48)*R. N. America (Quebec) -0.0264(0.43)** -0 .0132 (0.12) 0.0511 (0.40)S. N. Africa (Tombouktou) -0 .0554 (0.82)** -0.0714(0.69)** -0 .0079 (0.11)
Corroboration in barometric pressure trends
Atmospheric pressure time series at four locations (marked P, Q, R, and S in Fig. 3) have been examined for “keys” to the increasing spring-summer wind trends identified in the North Atlantic. But rather than increasing in intensity in recent decades, both the major oceanic high and low pressure centers, the “Bermuda-Azores High” (P) and the “Icelandic Low" (Q) areas, seem to have been relaxing (Fig. 6a,b; Table 2). However, the seasonal continental low pressure systems (R and S) have been increasing in intensity (Fig. 6c,d; Table 2), in accord with the greenhouse scenario. The thermal low in the interior of Northwest Africa (S) appears to have been intensifying in a particularly dramatic manner, in congruence with the strongly increasing wind trends along the West African coast (Fig. 4, K -O , Table 1).
a . Measured Pressure - Tombouctou, Mali10 .° r g
9 .5 -
9-°" .V- S,,» ' °5 . 5 .
Ù- □
8-0 - -___ i____ i__ i___ i____i__J_£ i____ i___ i
45 50 55 60 65 70 75 80 85 90
b . Measured Pressure - Mopti, Mali
“ . a ■ tr8.8 - 0 *■ * D o
I_____i i_____'i i i i i g j_______i4 5 50 55 60 65 70 75 8 0 85 90
C. Measured Pressure - Bamako, Malip.
11 .o ■ ■ c
9.5 ■ » ; : o ~ -9 . 0 i , - L - . - j — 0 i i i i i -i
45 50 55 60 65 70 75 80 85 90
Figure 7. Spring-summer (Apr-Sep) time series of independently measured barometric pressure (mb-1000) at three stations in Northwest Africa (Fig. 3).
The trends shown in Figure 6 are produced from large- scale analyzed pressure fields. Data in the Northwest African interior are rather sparse and changes in data pattern and analysis procedures might be suspected as being involved in the indicated trend. However, several actual measured series (Fig. 7) from a group of stations in North Africa appear in each case to independently substantiate the trend.
On a more local scale, the geostrophic balance of the apparent increase of the equatorward windstress in the data-rich area off the Iberian Peninsula was investigated, not with analyzed fields of pressure data which might conceivably have been contaminated by an “anemometer effect” , but with simple averages of maritime barometric pressure reports. Available reports within each of the four 5° areal quadrangles outlined by fine dashed lines in Figure 3 were averaged by month. The differences in the monthly mean values in each zonally arranged pair of quadrangles (i.e. the northern and southern pairs respectively) were computed as an index of the monthly mean zonal pressure gradient. Note that by sampling sporadically distributed (in time and space) pressure observations at each “end” of a desired gradient rather than paired observations taken simultaneously and in consistent locations, one samples a population of apparent gradients far more extensive than could actually physically exist. This results in a very “noisy” estimate of a monthly mean gradient. Even so, the computed differences indicate a linear increase of mean equatorward geostrophic wind for the A pril- September period of 0.021 m s-1 yr-1 and 0.034 m s-1 yr~1 for the northern and southern pairs of quadrangles respectively.
A n independent verification from within the ocean itself
Low frequency increases in upwelling-producing wind- stress should be reflected in corresponding increases in alongshore slope in mean sea level (Csanady, 1978; Enfield and Allen, 1980; Bigg and Gill, 1986). Bigg(1988) reported an increase in sea-level differences between sea-level gauge stations along the South American Coast that tends to corroborate the increase in Pacific tradewinds reported by Whysall etal. (1987). In the North Atlantic region, the Iberian Peninsula pro-
323
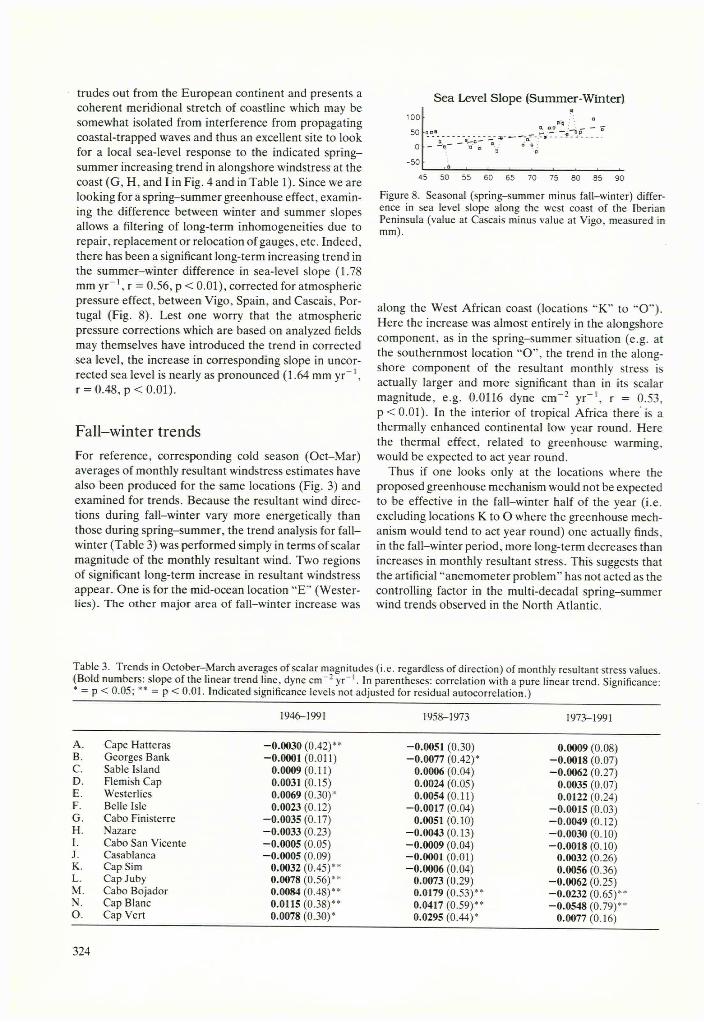
trudes out from the European continent and presents a coherent meridional stretch of coastline which may be somewhat isolated from interference from propagating coastal-trapped waves and thus an excellent site to look for a local sea-level response to the indicated spring- summer increasing trend in alongshore windstress at the coast (G, H , and I in Fig. 4 and in Table 1). Since we are looking for a spring-summer greenhouse effect, examining the difference between winter and summer slopes allows a filtering of long-term inhomogeneities due to repair, replacement or relocation of gauges, etc. Indeed, there has been a significant long-term increasing trend in the summer-winter difference in sea-level slope (1.78 mm yr-1 , r = 0.56, p < 0.01), corrected for atmospheric pressure effect, between Vigo, Spain, and Cascais, Portugal (Fig. 8). Lest one worry that the atmospheric pressure corrections which are based on analyzed fields may themselves have introduced the trend in corrected sea level, the increase in corresponding slope in uncorrected sea level is nearly as pronounced (1.64 mm yr-1 , r = 0.48, p < 0.01).
Fall-winter trends
For reference, corresponding cold season (Oct-Mar) averages of monthly resultant windstress estimates have also been produced for the same locations (Fig. 3) and examined for trends. Because the resultant wind directions during fall-winter vary more energetically than those during spring-summer. the trend analysis for fall- winter (Table 3) was performed simply in terms of scalar magnitude of the monthly resultant wind. Two regions of significant long-term increase in resultant windstress appear. One is for the mid-ocean location “E ” (Westerlies). The other major area of fall-winter increase was
Sea Level Slope (Summer-Winter)100
50
0
45 5 0 55 60 65 70 75 80 85 90
Figure 8. Seasonal (spring-summer minus fall-winter) difference in sea level slope along the west coast of the Iberian Peninsula (value at Cascais minus value at Vigo, measured in mm).
along the West African coast (locations “K” to “O ”). Here the increase was almost entirely in the alongshore component, as in the spring-summer situation (e.g. at the southernmost location “O ”, the trend in the alongshore component of the resultant monthly stress is actually larger and more significant than in its scalar magnitude, e.g. 0.0116 dyne cm-2 yr“ 1, r = 0.53, p < 0 .0 1 ) . In the interior of tropical Africa there is a thermally enhanced continental low year round. Here the thermal effect, related to greenhouse warming, would be expected to act year round.
Thus if one looks only at the locations where the proposed greenhouse mechanism would not be expected to be effective in the fall-winter half of the year (i.e. excluding locations K to O where the greenhouse mechanism would tend to act year round) one actually finds, in the fall-winter period, more long-term decreases than increases in monthly resultant stress. This suggests that the artificial “anemometer problem” has not acted as the controlling factor in the multi-decadal spring-summer wind trends observed in the North Atlantic.
Table 3. Trends in October-March averages of scalar magnitudes (i.e. regardless of direction) of monthly resultant stress values. (Bold numbers: slope of the linear trend line, dyne cm “ 2 yr“ 1. In parentheses: correlation with a pure linear trend. Significance: * = p < 0.05; ** = p < 0.01. Indicated significance levels not adjusted for residual autocorrelation.)
1946-1991 1958-1973 1973-1991
A. Cape Hatteras -0.0030(0.42)** -0.0051 (0.30) 0.0009 (0.08)B. Georges Bank -0.0001 (0.011) -0 .0077 (0.42)* -0 .0018 (0.07)C. Sable Island 0.0009(0.11) 0.0006 (0.04) -0 .0062 (0.27)D. Flemish Cap 0.0031 (0.15) 0.0024 (0.05) 0.0035 (0.07)E. Westerlies 0.0069 (0.30)* 0.0054 (0.11) 0.0122 (0.24)F. Belle Isle 0.0023(0.12) -0 .0017 (0.04) -0 .0015 (0.03)G. Cabo Finisterre -0 .0035 (0.17) 0.0051 (0.10) -0 .0049(0 .12)H. Nazare -0 .0033 (0.23) -0 .0043(0 .13) -0 .0030 (0.10)I. Cabo San Vicente -0 .0005 (0.05) -0 .0009 (0.04) —0.0018 (0.10)J. Casablanca -0 .0005 (0.09) -0.0001 (0.01) 0.0032 (0.26)K. Cap Sim 0.0032 (0.45)** -0 .0006 (0.04) 0.0056 (0.36)L. Cap Juby 0.0078 (0.56)** 0.0073 (0.29) -0 .0062 (0.25)M. Cabo Bojador 0.0084 (0.48)** 0.0179 (0.53)** -0 .0232 (0.65)**N. Cap Blanc 0.0115(0.38)** 0.0417(0.59)** -0 .0548 (0.79)**O. Cap Vert 0.0078 (0.30)* 0.0295 (0.44)* 0.0077 (0.16)
324

Concluding remark: basin-scale relaxation versus intensification at the continental-ocean boundary
Simulations of “enhanced C 0 2” scenarios using general circulation models (GCMs) have indicated that greenhouse warming of the lower atmosphere should be intensified toward higher latitudes (Manabe and Weth- erald, 1980). In such a case, the global-scale latitudinal temperature gradient, as well as the intensity of the circulation tending to dissipate this gradient, should decrease. However, seasonal temperature contrasts between coastal ocean regions and the adjacent continental landmasses would be intensified. This would tend to feed back into strengthened coastal wind systems (Bakun, 1990). In this paper it has been noted that, during the spring-summer warming season at least, the major oceanic pressure systems of the Atlantic (the Bermuda-Azores High and the Icelandic Low) have indeed become less intense over the past several decades. Likewise, it has been noted that the continental “thermal” low pressure systems appear to have intensified, as have the associated coastal ocean wind systems. It will be this interaction of seasonally intensified “land boundary” effects with the expected relaxation of global-scale circulation that should determine, in each local instance, the particular wind-related effects of climate change on marine ecosystem processes and populations.
ReferencesAnon. 1983. Workshop on the IREP Component of the IOC
Programme on Ocean Science in Relation to Living Resources (OSLR). IOC Workshop Rep. 65. Intergovernmental Oceanographic Commission, Unesco, Paris. 51 pp.
Anon. 1989. Second IOC Workshop on Sardine Anchovy Recruitment Project (SARP) in the Southwest Atlantic. IOC Workshop Rep. 33. Intergovernmental Occanographic Commission, Unesco, Paris. 51 pp.
Anon. 1990. The Intergovernmental Panel on Climate Change.US Dept. Commerce. 358 pp.
Bakun, A. 1973. Coastal upwelling indices, west coast of North America, 1946-71. NO AA Tech. Rep. NMFS SSRF-671. 103 pp.
Bakun, A. 1990. Global climatc change and intensification of coastal ocean upwelling. Science, 247: 198-201.
Bakun, A. (in press). The California Current, Bcngucla Cur
rent, and Southwestern Atlantic Shelf Ecosystems: a comparative approach to identifying factors regulating biomass yields. In Stress mitigation and preservation of large marine ecosystems. Ed. by K. Sherman, L. M. Alexander, and B. Gold. Am. Assoc. Adv. Sei.
Bigg. G. R. 1988. Sea level and meridional wind trends along the South American coast. Trop. Ocean-Atmosphere Newsl., 43: 1-2.
Bigg. G. R., and Gill, A. E. 1986. The annual cycle of sea level in the eastern tropical Pacific. J. phys. Oceanogr., 16: 1055— 1061.
Cardone, V .J . , Greenwood, J. G., and Cane, M. A. 1990. On trends in historical marine wind data. J. Climate, 3: 113-127.
Corton, A. 1990. Long-term trends in the pelagic fish stocks of the North Sea and adjacent waters and their possible connection to hydrographic changes. Neth. J. Sea Res., 25:227-235.
Csanady, G. T. 1978. The arrested topographic wave. J. phys. Oceanogr., 8: 47-62.
Dickson, R. R., Kelly, P. M., Colebrook, J. M., Wooster, W. S., and Cushing, D. H. 1988a. North winds and production in the eastern North Atlantic. J. Plank. Res., 10: 151-169.
Dickson, R. R., Meincke, J ., Malmberg, S.-A., and Lee, A. J. 1988b. The “Great Salinity Anomaly” in the northern North Atlantic, 1968-1982. Prog. Oceanogr., 20(2): 103-151.
Enfield, D. B., and Allen, J. S. 1980. On the structure and dynamics of monthly mean sea level anomalies along the Pacific coast of North and South America. J. phys. Oceanogr., 10: 557-578.
Inouc, M., and O ’Brien, J. J. 1987. Trends in sea level in the western and central equatorial Pacific during 1974-1975 to 1981. J. Geophys. Res., 92: 5045-5051.
Manabe, S., and Wetheraid, R. T. 1980. On the distribution of climate change resulting from an increase in C 0 2 content of the atmosphere. J. Atmos. Sei., 37: 99-118.
Posmcntier, E. S., Cane, M. A., and Zebiak, S. 1989. Tropical Pacific climate trends since 1960. J. Climate, 2: 731-736.
Ramage, C. S. 1987. Secular change in reported surface wind speeds over the oceans. J. Climate Appl. M eteor., 26: 525- 528.
Roy, C. 1990. Réponses des stocks de poissons pélagiques à la dynamique des upwellings en Afrique de l'Ouest: analyse et modélisation. Thèse de Doctorat. Université de Bretagne Occidental, Brest, France. 147 pp.
Schneider, S. H. 1990. The global warming debate heats up: an analysis and perspective. Bull. Am. Meteor. Soc., 71: 1292- 1304.
Sharp, G. D., and Csirke, J. (Eds.) 1983. Proceedings of the Expert Consultation to Examine Changes in Abundance and Species Composition of Neritic Fish Resources. FAO Fish. Rep., 291(2,3). 1224 pp.
Whysall, K. D. B., Cooper, N. S., and Bigg, G. R. 1987. Long term changes in the tropical Pacific surface wind field. Nature, 327: 216-219.
Wright, P. B. 1988. On the reality of climatic changes of wind over the Pacific. J. Climatol., 8: 521-527.
325