Embed Size (px)
Citation preview

Global Gene Expression in Cyanobacterial Electron Transfer Mutants. George L. Weir IV and Kraig Short, co-authors
Dr. Toivo Kallas, Biology & Microbiology, faculty adviser University of Wisconsin Oshkosh. Oshkosh Scholar. Volume IV, November 2009.
pp. 17-27.
Copyright © 2009
University of Wisconsin Board of Regents
All rights reserved. No part of this journal may be reproduced in any form
without the permission of University of Wisconsin Oshkosh.
University of Wisconsin Oshkosh
Office of Grants and Faculty Development
800 Algoma Blvd.
Oshkosh, WI 54901
(920) 424-3215
www.uwosh.edu/grants
Page 17Oshkosh Scholar
Global Gene Expression in Cyanobacterial Electron Transfer Mutants
George L. Weir IV and Kraig Short, co-authorsDr. Toivo Kallas, Biology & Microbiology, faculty adviser
George Weir graduated from UW Oshkosh in August 2009 with a degree in microbiology. In 2006 he participated in the NSF-REU summer research program at UW Oshkosh where he became interested in biotechnology and genetics. He was accepted to the biology/microbiology graduate program at UW Oshkosh where he will continue to work with Dr. Kallas on photosynthesis and gene expression profiling in cyanobacteria.
Kraig Short graduated from UW Oshkosh in December 2008 with a degree in microbiology. His research under Dr. Kallas began in spring 2008 as part of a biotechnology class. Biofuels have always been of interest to him, and his undergraduate research has shown him the numerous ways to explore energy sources. Kraig plans to attend graduate school at UW Oshkosh in spring 2010.
Dr. Toivo Kallas is a professor of microbial genetics and biotechnology and director of the Proteomics and Functional Genomics Core Facility in the Department of Biology & Microbiology. He received his Ph.D. from the University of Oregon and postdoctoral training from the Institut Pasteur and University of California Berkeley. His research concerns photosynthetic energy conversion and adaptive mechanisms of microalgae.
AbstractIn photosynthesis, microalgae such as cyanobacteria capture enormous
amounts of solar energy and convert carbon dioxide (CO2) into biopolymers that support life on earth and hold great potential for production of carbon-neutral biofuels. The photosynthetic process involves electron transfer reactions mediated by reaction center and cytochrome bf protein complexes. The bf complex also functions in regulation of photosynthesis by mechanisms that are not fully understood. We used the marine cyanobacterium Synechococcus PCC 7002 and mutants with genetically altered cytochrome bf complexes to investigate the role of this complex in regulation of adaptive gene expression responses. Native and mutant Synechococcus cultures were grown in CO2-limited photosynthetic conditions, RNA molecules were extracted, and fluorescently labeled copies of these were hybridized to whole-genome microarrays (“gene chips”) to detect gene expression levels. Numerous genes were differentially expressed in the cytochrome bf mutants, illustrating the importance of the bf complex for gene regulation and adaptation. The research contributes to understanding the regulation of electron transport in globally important microalgae and to potential biofuels applications of these organisms.
Page 18 Oshkosh Scholar
IntroductionCyanobacteria, once known as blue-green algae (Greek = κυανός [kyanós]
meaning blue), account for ~50% of oceanic photosynthesis and overall ~25% globally (Partensky, Hess, & Vaulot, 1999). They have persisted on earth for ~3.5 billion years and are responsible for supplying the earth’s atmosphere with oxygen (O2). Cyanobacteria convert atmospheric carbon dioxide (CO2) into energy-rich biomass and produce oxygen as a byproduct in photosynthesis, requiring only simple inorganic nutrients (CO2, nitrogen, phosphorus, sulfur, and trace nutrients) for growth and survival. They are the evolutionary ancestors of plant chloroplasts and thus established photosynthesis as a novel and globally important mechanism for energy conversion that supports the abundant and vast biodiversity we see on our planet today (Grey, 1989).
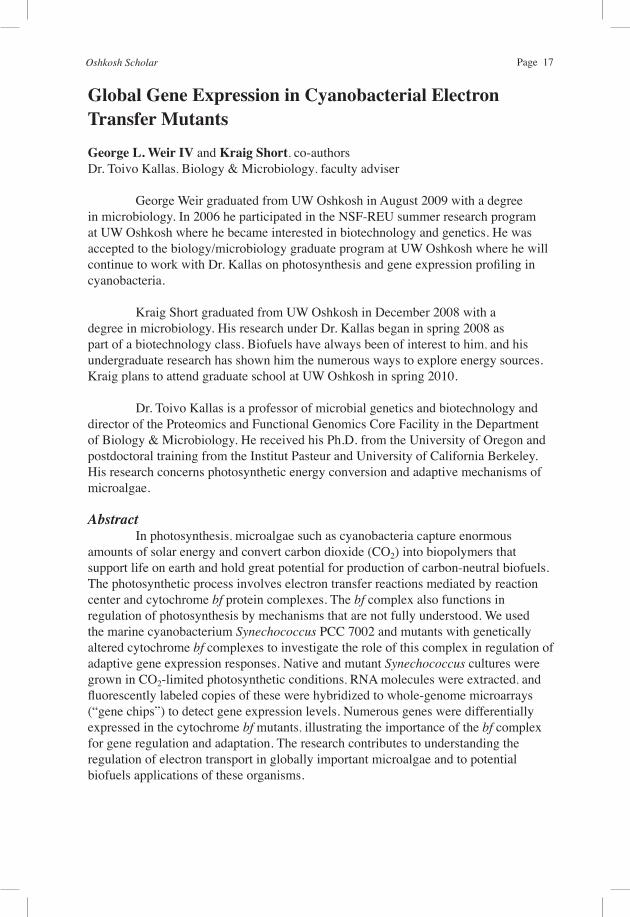
Figure 1Cytochrome bf Complex at the Crossroads of Photosynthesis and Respiration
Note. Photosystems II and I (PS II and PS I), plastoquinone pool (PQ pool), cytochrome bf complex (Cyt bf), the two plastoquinone binding sites of the bf complex (Qn and Qp), NAD(P)H dehydrogenase (NDH), succinate dehydrogenase (SDH), sulfide-quinone oxidoreductase (SQR), quinol oxidase (QOX), cytochrome oxidase (COX), cytochrome c6 (Cyt c6), ferredoxin (Fd), ferredoxin-NAD(P)H oxidoreductase (FNR), bidirectional hydrogenase (H2ase), hydrogen (H2), sunlight (lightning bolts), carbon dioxide (CO2), adenosine tri-phosphate (ATP), ribulose bisphosphate (RUBP), triose phosphates or glyceraldehyde-3-phosphate (triose). The dark region depicts the thylakoid membrane, and thick, light arrows indicate major electron transfer pathways.
The photosynthetic apparatus consists of photosystem II (PS II), photosystem I (PS I), and cytochrome (Cyt) bf protein complexes located within thylakoid membranes (see Figure 1). The light-harvesting phycobiliprotein (PBS) complexes (see Figure 2) capture sunlight, causing electrons to flow between the two photosystems via the plastoquinone pool (PQ pool) and Cyt bf complex (Blankenship, 2002). The electron
Page 19Oshkosh Scholar
transport chain between PS II and PS I consists of a series of oxidation/reduction (loss or gain of electrons) reactions, or “redox” reactions. Through such redox reactions, the Cyt bf complex generates a transmembrane gradient of hydrogen ions (H+ or protons) that drives adenosine triphosphate (ATP) synthesis to supply chemical energy for cellular processes (Kallas, 1994). Two electron transfer pathways occur within the cytochrome bf complex. Briefly, oxidation (loss of electrons), of plastoquinol from the PQ pool results in electron flow into both the high- and low-potential chains (see Figure 2). Mutations that impede electron transfer in either the high- or low-potential chains slow the turnover of the bf complex (Yan & Cramer, 2003; Nelson, Finazzi, Wang, Middleton-Zarka, Whitmarsh, & Kallas, 2005). However, impaired electron flow in the low-potential chain, as in our Synechococcus PetB-R214H mutant (Nelson et al.), results in electron transfer to O2 and production of damaging oxygen radicals (Horn, 2005).
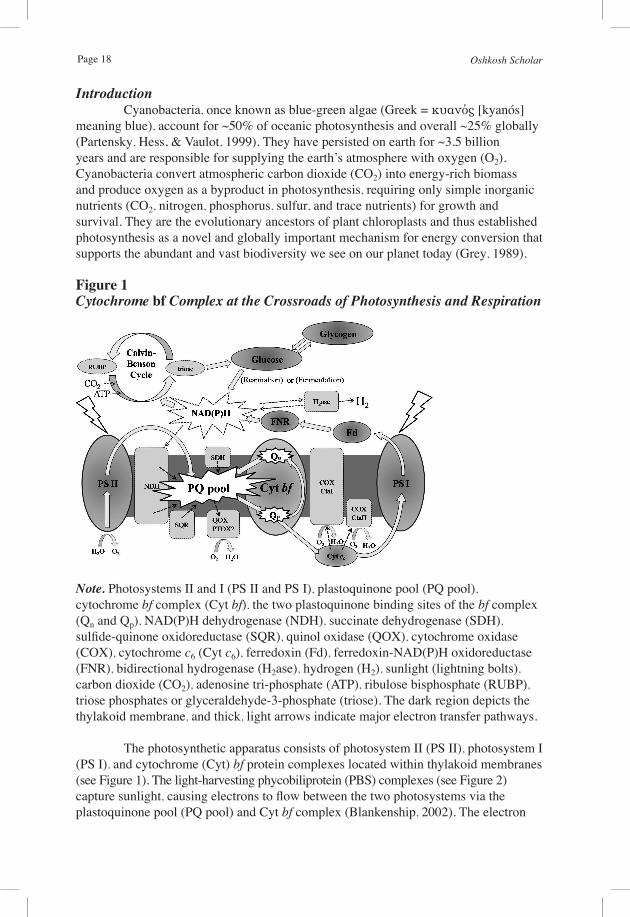
Figure 2Electron Transfer Pathways and Mutations of the Cytochrome bf Complex
Note. Rieske iron-sulfur protein (Fe-S), plastoquinol oxidation site (Qp), plastoquinone reduction site (Qn), cytochrome f (Cyt f), bL, bH, and cn hemes, phycobiliprotein light-harvesting proteins (PBS), ferredoxin (Fd), plastoquinone pool (PQ pool), plastoquinone sites of PS II (QA/QB). Dashed arrows indicate the Cyt bf high- and low-potential electron transfer pathways. PetC- 2G and PetB-R214H show the locations of these mutations in these pathways, and the black Xs show the sites of electron blockage. Arching dashed arrow illustrates the redistribution of PBS light-harvesting complexes mediated by redox-sensing and signaling by the Cyt bf complex.
The cytochrome bf complex also senses the redox level of electron transport and signals the redistribution of light-harvesting PBS proteins to adjust electron flow between PS II and PS I (Wollman, 2001) as illustrated in Figure 2. This regulation allows cyanobacteria to adjust their metabolism to changing environments. Moreover, the bf complex has been implicated in redox signaling of longer-term, adaptive gene expression events (Allen, 2004). In living organisms, the genetic information in deoxyribonucleic acid (DNA) is transcribed into messenger ribonucleic acid (mRNA)

Page 20 Oshkosh Scholar
and then translated into the proteins that perform most biological functions. Therefore, knowledge of transcription (gene expression) provides ways to understand and manipulate biological processes. The electron transport pathways in photosynthesis that allow cyanobacteria to adapt to different environments are poorly understood. Such knowledge will be important for understanding the intrinsic biology of cyanobacteria and for applications such as the development of hydrogen or triacyglycerol (biodiesel) biofuels production strategies. We used high-density microarrays (“gene chips”) and strains of the marine cyanobacterium Synechococcus PCC 7002 (Van Baalen, 1962) with genetically altered cytochrome bf complexes to investigate the hypothesis that the low- and high-potential chains of this complex play specific roles in signaling changes in gene expression. Mutants PetB-R214H (Nelson et al., 2005) and PetC1-D2G (Yan & Cramer, 2003) have impaired electron flow in the low- and high-potential chains, respectively. We show that perturbations of the cytochrome bf complex profoundly alter the expression levels of numerous genes.
MethodsCyanobacterial Strains and Culture Conditions
Strains of the unicellular, marine cyanobacterium Synechococcus 7002 were grown as described by Nelson et al. (2005). Mutant PetB-R214H has a mutation in the cytochrome bf low potential chain causing slower turnover of the bf complex, slower growth (Nelson et al.), and overproduction of oxygen radicals (Horn, 2005). Mutant PetC1- 2G (Yan & Cramer, 2003) has a mutation in the bf high-potential chain, also causing slower turnover of the complex, only somewhat slower growth relative to the wild type, and no increase in oxygen radical production.
RNA Isolation, Purification, and Quantification RNA molecules were extracted by a hot phenol method as in Brudler et al.
(2003) with modifications. The method relies on rapid cell harvest and quenching of metabolism followed by extractions with phenol and chloroform, phase separations, and alcohol precipitation to remove contaminating proteins. DNA was removed from the resulting “crude RNA” preparation by means of Ambion® Turbo DNA-free reagents. RNAs were quantified by UV absorbance measurements at 260 nm (A260) according to the formula 1.0 A260 = 33 µg RNA/mL.
Fluorescent Labeling and Dye IncorporationComplementary DNA (cDNA) copies of RNAs were synthesized by
reverse transcription (RT) from random primers and labeled with fluorescent tags by ChipShot™ Indirect Labeling reagents (Promega, Madison, WI). The RT reaction incorporated an aminoallyl uridine-5’-triphosphate (UTP) into the cDNA which was then covalently linked to Cy3 fluorescent dye. The frequencies of dye incorporation (FOI) and quantities of recovered cDNA were calculated by means of extinction coefficients for Cy3 dye at 550 nm and single-stranded DNA at 260 nm according to the manufacturer’s instructions. FOI ranged from ~14–29 pmol dye per ng cDNA.
High-Density Oligonucleotide Microarrays and cDNA Hybridizations Custom, 4-plex microarrays of Synechococcus 7002 were purchased from
Page 21Oshkosh Scholar
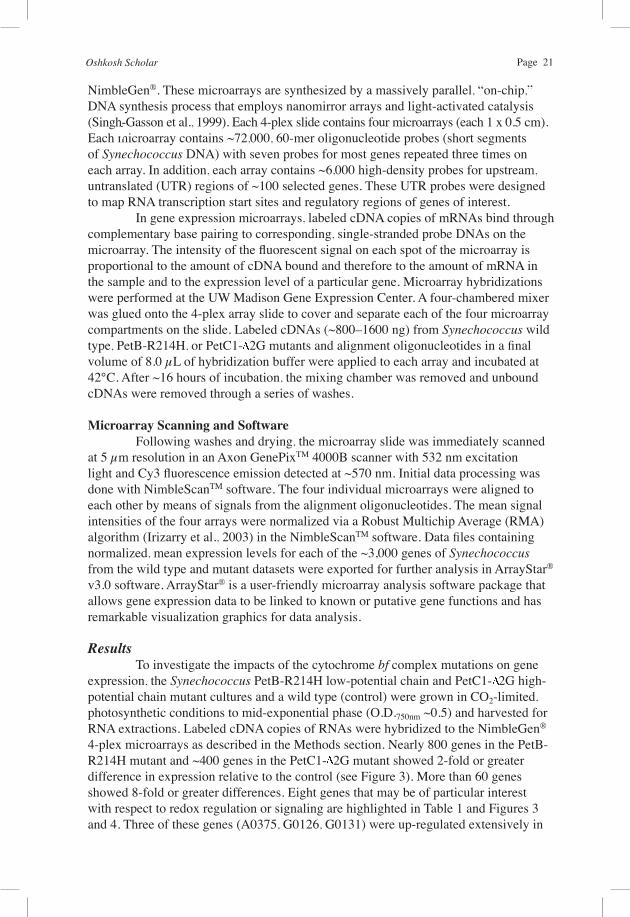
NimbleGen®. These microarrays are synthesized by a massively parallel, “on-chip,” DNA synthesis process that employs nanomirror arrays and light-activated catalysis (Singh-Gasson et al., 1999). Each 4-plex slide contains four microarrays (each 1 x 0.5 cm). Each microarray contains ~72,000, 60-mer oligonucleotide probes (short segments of Synechococcus DNA) with seven probes for most genes repeated three times on each array. In addition, each array contains ~6,000 high-density probes for upstream, untranslated (UTR) regions of ~100 selected genes. These UTR probes were designed to map RNA transcription start sites and regulatory regions of genes of interest.
In gene expression microarrays, labeled cDNA copies of mRNAs bind through complementary base pairing to corresponding, single-stranded probe DNAs on the microarray. The intensity of the fluorescent signal on each spot of the microarray is proportional to the amount of cDNA bound and therefore to the amount of mRNA in the sample and to the expression level of a particular gene. Microarray hybridizations were performed at the UW Madison Gene Expression Center. A four-chambered mixer was glued onto the 4-plex array slide to cover and separate each of the four microarray compartments on the slide. Labeled cDNAs (~800–1600 ng) from Synechococcus wild type, PetB-R214H, or PetC1- 2G mutants and alignment oligonucleotides in a final volume of 8.0 µL of hybridization buffer were applied to each array and incubated at 42°C. After ~16 hours of incubation, the mixing chamber was removed and unbound cDNAs were removed through a series of washes.
Microarray Scanning and Software
Following washes and drying, the microarray slide was immediately scanned at 5 µm resolution in an Axon GenePixTM 4000B scanner with 532 nm excitation light and Cy3 fluorescence emission detected at ~570 nm. Initial data processing was done with NimbleScanTM software. The four individual microarrays were aligned to each other by means of signals from the alignment oligonucleotides. The mean signal intensities of the four arrays were normalized via a Robust Multichip Average (RMA) algorithm (Irizarry et al., 2003) in the NimbleScanTM software. Data files containing normalized, mean expression levels for each of the ~3,000 genes of Synechococcus from the wild type and mutant datasets were exported for further analysis in ArrayStar® v3.0 software. ArrayStar® is a user-friendly microarray analysis software package that allows gene expression data to be linked to known or putative gene functions and has remarkable visualization graphics for data analysis.
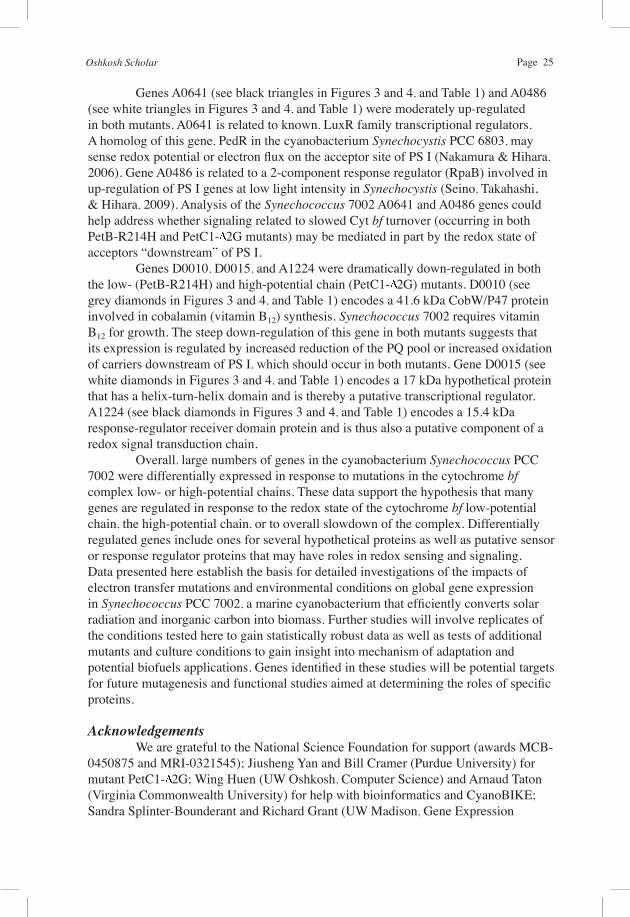
ResultsTo investigate the impacts of the cytochrome bf complex mutations on gene
expression, the Synechococcus PetB-R214H low-potential chain and PetC1- 2G high-potential chain mutant cultures and a wild type (control) were grown in CO2-limited, photosynthetic conditions to mid-exponential phase (O.D.750nm ~0.5) and harvested for RNA extractions. Labeled cDNA copies of RNAs were hybridized to the NimbleGen® 4-plex microarrays as described in the Methods section. Nearly 800 genes in the PetB-R214H mutant and ~400 genes in the PetC1- 2G mutant showed 2-fold or greater difference in expression relative to the control (see Figure 3). More than 60 genes showed 8-fold or greater differences. Eight genes that may be of particular interest with respect to redox regulation or signaling are highlighted in Table 1 and Figures 3 and 4. Three of these genes (A0375, G0126, G0131) were up-regulated extensively in

Page 22 Oshkosh Scholar
the PetB-R214H mutant and less so in PetC1- 2G (displayed in Figures 3 and 4, and Table 1 as circles). Two of these genes (A0486, A0641) were moderately up-regulated in both PetB-R214H and PetC1- 2G (displayed in Figures 3 and 4, and Table 1 as triangles). The final three genes (D0010, D0015, A1224) were significantly down-regulated in both PetB-R214H and PetC1- 2G (displayed in Figures 3 and 4, and Table 1 as diamonds). These data demonstrate that large numbers of genes were differentially expressed in response to perturbations either of the cytochrome bf complex low- and/or high-potential electron transport chains.
Figure 3Scatter Plot of Gene Expression Levels in Synechococcus PCC 7002 PetB-R214H vs. Wild Type
Note. The x- and y-axes represent log2 gene expression values in the wild typeand PetB-R214H cytochrome bf low-potential chain mutant, respectively. Each point represents 1 of the ~3,000 genes in the Synechococcus genome. Points outside of the solid lines show genes over- or under-expressed by ≥ 2-fold in PetB-R214H relative to the wild type control. The dotted line represents the best-fit line to all of the data points. Circles indicate selected genes described further in Table 1 and Figure 4 (the same gene symbols are used throughout).
Page 23Oshkosh Scholar
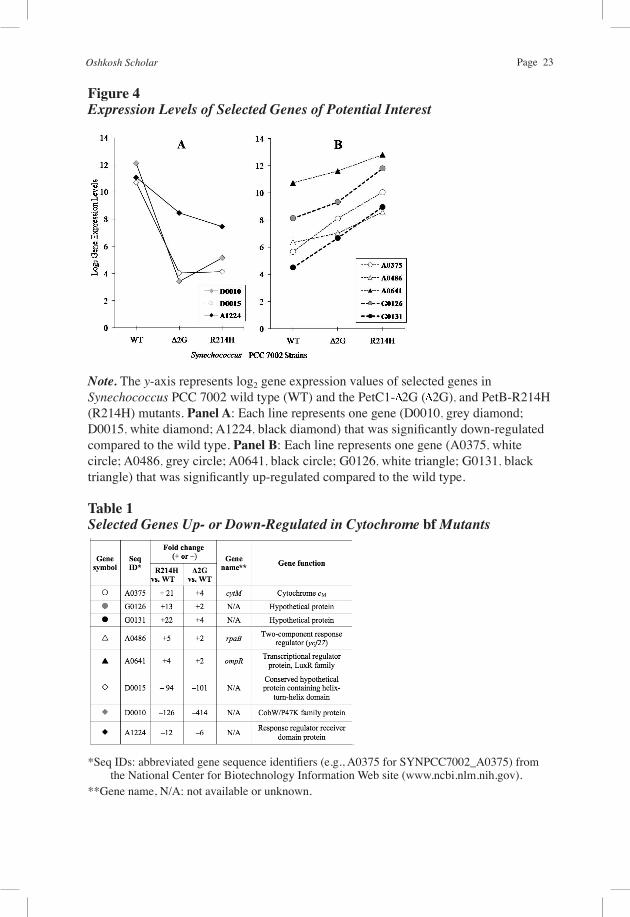
Figure 4Expression Levels of Selected Genes of Potential Interest
Note. The y-axis represents log2 gene expression values of selected genes inSynechococcus PCC 7002 wild type (WT) and the PetC1- 2G ( 2G), and PetB-R214H (R214H) mutants. Panel A: Each line represents one gene (D0010, grey diamond; D0015, white diamond; A1224, black diamond) that was significantly down-regulated compared to the wild type. Panel B: Each line represents one gene (A0375, white circle; A0486, grey circle; A0641, black circle; G0126, white triangle; G0131, black triangle) that was significantly up-regulated compared to the wild type.
Table 1Selected Genes Up- or Down-Regulated in Cytochrome bf Mutants
*Seq IDs: abbreviated gene sequence identifiers (e.g., A0375 for SYNPCC7002_A0375) from the National Center for Biotechnology Information Web site (www.ncbi.nlm.nih.gov).
**Gene name, N/A: not available or unknown.

Page 24 Oshkosh Scholar
Discussion and ConclusionsCyanobacteria flourish in diverse environments such as those of nutrient-
deprived oceans, of extreme high or low light intensity, extreme temperatures, under desiccation, or in dense, anaerobic mats (Johnson et al., 2006). Each environment requires adjustments in metabolism and gene expression activities. In plant and algal chloroplasts, the cytochrome bf complex signals the redox-dependent redistribution of light-harvesting proteins between the photosystems (Wollman, 2001) and has been implicated in redox-regulation of gene expression (Allen, 2004). However, many aspects of the signaling mechanisms and the role of the bf complex in gene regulation remain unclear. In the current study, mutants of the marine coastal cyanobacterium Synechococcus PCC 7002 with impaired electron flow in the cytochrome bf low- (PetB-R214H; Nelson et al., 2005) and high-potential chains (PetC1- 2G; Yan & Cramer, 2003) were used to investigate the impact of these domains on global gene expression. Data presented here show that perturbation of electron transfer in the bf complex altered the expression of numerous genes (see Figures 3 and 4, and Table 1). These data support the hypothesis that the bf complex and particularly its low-potential domain play important roles in redox-signaling of gene expression.
The PQ pool and cytochrome bf complex occupy central positions at the intersection of photosynthetic and respiratory electron transfer chains in cyanobacteria (see Figure 1). The PQ pool becomes reduced through the activity of PS II during photosynthesis and by NAD(P)H (NDH) and succinate dehydrogenases (SDH) during darkness (Kallas, 1994). Because cytochrome oxidases (COX; see Figure 1) of cyanobacteria have low activities, the PQ pool becomes reduced during dark incubation. Under these conditions, NAD(P)H levels rise and anaerobic fermentation pathways may become active, including that for hydrogen production. Detailed understanding of electron flow through these pathways and the regulatory events mediated by the PQ pool and cytochrome bf complex will be important for understanding the intrinsic biology of cyanobacteria and for development of biofuels applications (Hu et al., 2008).
Our preliminary high-density microarray gene expression data show that mutations in the cytochrome bf complex altered the expression of hundreds of genes, including many that respond uniquely to perturbations of the cytochrome bf low- or high-potential electron transfer chains. Nearly 800 genes in the PetB-R214H mutant and more than 400 in PetC1- 2G showed 2-fold or greater differences in expression relative to the wild type control. Sixty genes in PetB-R214H and 34 in PetC1- 2G showed 8-fold or greater differences. We selected eight of these as examples of genes that may be targets or components of redox signaling based on the current data (see Table 1 and Figure 4). Three of these genes were up-regulated in both mutants but substantially more so in PetB-R214H. Gene A0375 (see white circles in Figures 3 and 4, and Table 1) encodes a cryptic cytochrome (Cyt cM) protein and is widely distributed among cyanobacteria (Bialek et al., 2008). Cyt cM donates electrons to a cyanobacterial respiratory cytochrome oxidase in vitro, but otherwise its function is unknown (Bernroitner et al., 2009). G0131 and G0126 encode hypothetical, membrane-spanning proteins. G0131 (see black circles in Figures 3 and 4, and Table 1) and G0126 (see grey circles in Figures 3 and 4, and Table 1) specify 21.5 kDa and 26 kDa proteins, respectively. The functions of these are completely unknown, but membrane proteins have possible roles in energy transduction and/or signaling.
Page 25Oshkosh Scholar
Genes A0641 (see black triangles in Figures 3 and 4, and Table 1) and A0486 (see white triangles in Figures 3 and 4, and Table 1) were moderately up-regulated in both mutants. A0641 is related to known, LuxR family transcriptional regulators. A homolog of this gene, PedR in the cyanobacterium Synechocystis PCC 6803, may sense redox potential or electron flux on the acceptor site of PS I (Nakamura & Hihara, 2006). Gene A0486 is related to a 2-component response regulator (RpaB) involved in up-regulation of PS I genes at low light intensity in Synechocystis (Seino, Takahashi, & Hihara, 2009). Analysis of the Synechococcus 7002 A0641 and A0486 genes could help address whether signaling related to slowed Cyt bf turnover (occurring in both PetB-R214H and PetC1- 2G mutants) may be mediated in part by the redox state of acceptors “downstream” of PS I.
Genes D0010, D0015, and A1224 were dramatically down-regulated in both the low- (PetB-R214H) and high-potential chain (PetC1- 2G) mutants. D0010 (see grey diamonds in Figures 3 and 4, and Table 1) encodes a 41.6 kDa CobW/P47 protein involved in cobalamin (vitamin B12) synthesis. Synechococcus 7002 requires vitamin B12 for growth. The steep down-regulation of this gene in both mutants suggests that its expression is regulated by increased reduction of the PQ pool or increased oxidation of carriers downstream of PS I, which should occur in both mutants. Gene D0015 (see white diamonds in Figures 3 and 4, and Table 1) encodes a 17 kDa hypothetical protein that has a helix-turn-helix domain and is thereby a putative transcriptional regulator. A1224 (see black diamonds in Figures 3 and 4, and Table 1) encodes a 15.4 kDa response-regulator receiver domain protein and is thus also a putative component of a redox signal transduction chain.
Overall, large numbers of genes in the cyanobacterium Synechococcus PCC 7002 were differentially expressed in response to mutations in the cytochrome bf complex low- or high-potential chains. These data support the hypothesis that many genes are regulated in response to the redox state of the cytochrome bf low-potential chain, the high-potential chain, or to overall slowdown of the complex. Differentially regulated genes include ones for several hypothetical proteins as well as putative sensor or response regulator proteins that may have roles in redox sensing and signaling. Data presented here establish the basis for detailed investigations of the impacts of electron transfer mutations and environmental conditions on global gene expression in Synechococcus PCC 7002, a marine cyanobacterium that efficiently converts solar radiation and inorganic carbon into biomass. Further studies will involve replicates of the conditions tested here to gain statistically robust data as well as tests of additional mutants and culture conditions to gain insight into mechanism of adaptation and potential biofuels applications. Genes identified in these studies will be potential targets for future mutagenesis and functional studies aimed at determining the roles of specific proteins.
AcknowledgementsWe are grateful to the National Science Foundation for support (awards MCB-
0450875 and MRI-0321545); Jiusheng Yan and Bill Cramer (Purdue University) for mutant PetC1- 2G; Wing Huen (UW Oshkosh, Computer Science) and Arnaud Taton (Virginia Commonwealth University) for help with bioinformatics and CyanoBIKE; Sandra Splinter-Bounderant and Richard Grant (UW Madison, Gene Expression

Page 26 Oshkosh Scholar
Center) for help with NimbleGen® array hybridizations; Matt Nelson (UW Oshkosh) for help with cyanobacterial cultures and RNA isolation techniques; and Will Kovac and other UW Oshkosh Microbial Genetics Lab students from fall 2007–2008 for contributions to the project.
ReferencesAllen, J. F. (2004). Cytochrome b6f: Structure for signaling and vectorial metabolism. Trends in
Plant Science, 9, 130–137.
Bernroitner, M., Tangl, D., Lucini, C., Furtmuller, P. G., Peschek, G. A., & Obinger, C. (2009). Cyanobacterial cytochrome c(M): Probing its role as electron donor for Cu(A) of cytochrome c oxidase. Biochima et Biophysa Acta 1787, 3, 135–143.
Bialek, W., Nelson, M., Tamiola, K., Kallas, T., & Szczepaniak, A. (2008). Deeply branching c6-like cytochromes of cyanobacteria. Biochemistry, 47, 5515–5522.
Blankenship, R. E. (2002). Molecular mechanisms of photosystems. Oxford: Blackwell Science Ltd.
Brudler, R., Hitomi, K., Daiyasu, H., Toh, H., Kucho, K., Ishiura, M., Kanehisa, M., Roberts, V. A., Todo, T., Tainer, J. A., & Getzoff, E. D. (2003). Identification of a new cryptochrome class: Structure, function, and evolution. Molecular Cell, 11, 59–67.
Grey, M. W. (1989). The evolutionary origins of organelles. Trends in Genetics, 5, 294–299.
Horn, D. M. (2005). Superoxide production in the cytochrome bf complex of photosynthesis. Unpublished master’s thesis, University of Wisconsin Oshkosh.
Hu, Q., Sommerfeld, M., Jarvis, E., Ghirardi, M., Posewitz, M., Seibert, M., & Darzins, A. (2008). Microalgal triacylglycerols as feedstocks for biofuel production: Perspectives and advances. The Plant Journal, 54, 621–639.
Irizarry, R. A., Hobbs, B., Collin, F., Beazer-Barclay, Y. D., Antonellis, K. J., Scherf, U., & Speed, T. P. (2003). Exploration, normalization, and summaries of high density oligonucleotide array probe level data. Biostatistics, 4, 249–264.
Johnson, Z. I., Zinser, E. R., Coe, A., McNulty, N. P., Woodward, E. M., & Chisholm, S. W. (2006). Niche partitioning among Prochlorococcus ecotypes along ocean-scale environmental gradients. Science, 311, 1737–1740.
Kallas, T. (1994). The cytochrome b6f complex. In D. A. Bryant (Ed.) The Molecular Biology of the Cyanobacteria (pp. 259–317). The Netherlands, Dordrecht: Kluwer Academic Publishers.
Nakamura, K., & Hihara, Y. (2006). Photon flux density-dependent gene expression in Synechocystis sp. PCC 6803 is regulated by a small, redox-responsive, LuxR-type regulator. Journal of Biological Chemistry, 281, 36758–36766.
Nelson, M. E., Finazzi, G., Wang, Q. J., Middleton-Zarka, K. A., Whitmarsh, J., & Kallas, T. (2005). Cytochrome b6 arginine 214 of Synechococcus sp. PCC 7002, a key residue for quinone-reductase site function and turnover of the cytochrome bf complex. Journal of Biological Chemistry, 280, 10395–10402.
Partensky, F., Hess, W. R., & Vaulot, D. (1999). Prochlorococcus, a marine photosynthetic prokaryote of global significance. Microbiology Molecular Biology Review, 63, 106–127.

Page 27Oshkosh Scholar
Seino, Y., Takahashi, T., & Hihara, Y. (2009). The response regulator RpaB binds to the upstream element of photosystem I genes to work for positive regulation under low-light conditions in Synechocystis sp. PCC 6803. Journal of Bacteriology, 191, 1581–1586.
Singh-Gasson, S., Green, R. D., Yue, Y., Nelson, C., Blattner, F., Sussman, M. R., & Cerrina, F. (1999). Maskless fabrication of light-directed oligonucleotide microarrays using a digital micromirror array. Nature Biotechnology, 17, 974–978.
Van Baalen, C. (1962). Studies on marine blue-green algae. Botanica Marina, 4, 129–139.
Wollman, F. A. (2001). State transitions reveal the dynamics and flexibility of the photosynthetic apparatus. EMBO Journal, 20, 2623–2630.
Yan, J., & Cramer, W. A. (2003). Functional insensitivity of the cytochrome b6f complex to structure changes in the hinge region of the Rieske iron-sulfur protein. Journal of Biological Chemistry, 278, 20925–20933.