Embed Size (px)
Citation preview
Global gas report2018
SPECIAL EDITION

Global gas report 2018 D
Welcome to the World Gas Conference 2018 special edition of the Global Gas Report!
This report assesses the unique role natural gas plays in the global energy mix and the opportunity it offers to meet growing energy demand while reducing GHG emissions and improving urban air quality. Seizing this opportunity will require a concerted effort from the natural gas industry, policymakers, and other critical stakeholders, like the civil society and the financial community. A look back over 2017 suggests that the prospects for gas are very strong in view of a combination of increased supply, availability, and growing liquidity in the LNG market. China's clean air policies contributed to strong global consumption growth of 3.7% in 2017, more than double the average growth rate of the previous five years. Meanwhile, there are also rapid developments in renewable and low-carbon gas technologies, which offer opportunities to further reduce GHG emissions and to advance the global effort to address sustainability goals. However, there are specific levers that must be put to work in order for these opportunities to continue to materialize. In this report, we highlight the key growth opportunities for gas, particularly in non-OECD Asia and Africa, and conclude that ensuring competitiveness on price, access, and the environmental sustainability of gas remain crucial for the industry. Achieving that competitiveness will require a robust and fair valuation of the costs and benefits of various energy sources, appropriate regulation to safeguard air quality and the environment and planning and decision-making based on realistic assessments. We also invite you to consider our special feature on gas for cities, which illustrates the pivotal role gas plays in urban environments. Natural gas combines high heating intensity and efficiency with low emissions and virtually no pollution, and it can deliver energy for almost any use, from power to transport, and industry to homes. It can also do so at different scales, distributed or centralized. These qualities make it uniquely positioned to address the dual environmental challenges of localized air pollution and global climate change in urban environments. Given the continued trend towards urbanization, particularly in the developing world, this represents a key opportunity for gas demand growth. Overall, the report stresses the need for concerted efforts and dialogue – across the gas value chain and with stakeholders. That is the reason we have chosen to present this Global Gas Report at the IGU World Gas Conference, which uniquely brings all the parties together, providing for a great opportunity to start the conversation.
We hope you find this a useful resource.
Marco AlveràChief Executive Officer, Snam
David C. CarrollPresident, International Gas Union
Ivan MartenBCG Vice Chairman, Energy Practice
J. Robinson West
Managing Director, BCG Center for Energy Impact

Global gas report 2018 2
Natural gas is in the midst of a rapid growth phase. Since 2010, average global gas consumption has grown by 1.8% per year, making it the fastest growing energy source other than renewable power. In that time, the global gas industry has gone through a significant transformation, characterized by the North America shale boom, the rapid growth of LNG, and the development of new gas markets in Asia and the Middle East. This growth is as a result of the multiple benefits offered by gas as a clean, abundant, flexible, and cost-effective fuel.
Industry forecasts widely expect the rapid growth of gas to continue. The IEA and other leading forecasters project that gas consumption will grow by at least 1.6% per year over the coming decades. Among all fossil fuels, gas is the only energy source for which consumption is projected to grow in the long-run under all key scenarios, including the most aggressive low-carbon transition scenarios. As a result, gas is expected to overtake coal as the second leading source of energy by 2040.
Despite the positive recent developments and future outlook, gas has arguably not yet achieved the most optimistic growth projections. In particular, the share of gas in the global energy mix has remained virtually unchanged since 2010, with marginal growth only starting to be realized in 2017. This is due to challenges that gas faces in some markets based on its cost
competitiveness relative to other fuel sources, accessibility of secure supply, and debates about the role that gas can play in promoting environmental sustainability. To sustain rapid gas market growth and achieve the expectations of gas market share growth over the coming decades, three levers will be critical:
1. Cost Competitiveness: Improving the relative cost of gas to other energy sources through a combination of LNG cost efficiencies, pricing environmental externalities, and promotion of local gas production in markets around the world.
2. Security of Supply: Enabling gas supply security through the development of enhanced networks and infrastructure, more flexible commercial models, and new modular access-enabling technologies (e.g. FSRUs).
3. Sustainability: Promoting the environmental sustainability of gas as an instrument to reduce urban air pollution, by developing low carbon technologies for gas, integrating renewable gas sources into existing infrastructure, and limiting methane emissions.
Future gas growth is projected to be concentrated in several specific regions and sectors given overall primary energy demand growth, existing gas penetration, and policy. Leading regions for potential gas growth include: non-OECD Asia; the Middle East; and
Executive summary
Global gas report 2018 3
Executive summary
Africa. Meanwhile, the transport sector in North America and Global marine bunkering also offer high growth opportunities.
When considering the relative positioning of gas in these high growth potential regions and sectors, specific growth levers stand out as priorities to address:
• Non-OECD Asia – power and industry sectors: Enabling secure access to gas is critical given that midstream infrastructure is limited, or unavailable, today in many markets.
• Non-OECD Asia & Africa – all sectors: Enabling secure access to gas is critical given that midstream infrastructure is limited, or unavailable, today in many markets.
• OECD markets – all sectors: Using gas to enable aggressive climate change emissions targets will be key, specifically through technologies to reduce emissions through gas supply chains.
A critical enabler of global gas consumption growth across these regions and sectors will be to focus on its role in cities. Gas is uniquely advantageous as a fuel source in urban areas given its limited greenhouse gas (GHG) and local pollution emissions, high heat intensity - valuable for industrial and buildings applications, and the scalability of gas infrastructure. As a result, by 2040 more than 90% of the projected global gas growth is likely to come from cities.
Growing gas consumption in cities will require diverging approaches across cities in developing countries relative to cities in developed countries. In developing countries, gas infrastructure is critical to enable secure supply, requiring an estimated $35-55 billion per year of capital investment for gas transmission, distribution, and LNG infrastructure. In developed countries, the deployment of new technologies to sustain gas consumption will be critical in light of increasing efficiency and greater electrification. Implementing growth levers for gas globally and in cities specifically will require concerted actions from many different stakeholders. These include the development of new business models and technologies from gas industry participants, effective policies from governments, and sustained capital commitments from financial institutions. While the future of gas appears to be bright, it will require positive reinforcement.
This report assesses both recent trends in the global gas industry and the future factors that will shape it. The first section of the report evaluates how the global gas industry has developed to date and performed relative to key forecasts, while the second part considers what will be required for gas to achieve the full potential of future growth expectations. In part three, a special feature section focuses on “gas for cities”, highlighting the role that cities play in achieving gas consumption growth in the coming decades.
Global gas report 2018 4
Contents
Global gas report Introduction 5
1/ Recent trends in global gas 1. Key highlights from 2017 8
2. Recent trends in global gas 10
3. The future of gas to 2040 20
2/ Achieving the potential of global gas growth
4. Meeting gas demand forecasts 24
5. The role of policy in shaping the future of gas 37
Conclusion: Priorities for achieving gas growth 41
3/ Special Feature Gas for cities – A key enabler of global gas growth 44
Conclusion: Implications for the global gas industry 55
Global gas report 2018 5
Global gas report
Introduction
The world is in the midst of a series of rapidly evolving energy transitions. As these transitions play out in different ways across countries, economic sectors, and energy sources, one consistent theme around the world is the growth of natural gas.
Global gas report 2018 6
The world is in the midst of a series of rapidly evolving energy transitions. As these transitions play out in different ways across countries, economic sectors, and energy sources, one consistent theme around the world is the growth of natural gas. Among all fossil fuels, gas is the only energy source for which consumption is projected to grow in the long-run under all key scenarios, including the most aggressive low carbon-transition scenarios. This is due to the multiple benefits offered by gas as a clean, abundant, flexible, and cost-effective fuel.
Gas has already established a strong growth trajectory over the past decade. The US shale boom, rapid expansion of LNG infrastructure, and substantial market growth in the Middle East and Asia have all served to transform the global industry. Nevertheless, gas has arguably not yet achieved its most optimistic growth projections. In particular, the share of gas in the global energy mix has remained virtually unchanged since 2010, with marginal growth only starting to be achieved in 2017.
This report assesses both recent trends in the global gas industry and the future factors that will shape the industry. The first section of the report evaluates how the global gas industry has developed to date and performed relative to key forecasts, while the second section considers what will be required for gas to achieve the full potential of future growth expectations. A special feature addition to the 2018 report focuses on “gas for cities,” specifically highlighting the role that urban areas will play in achieving gas consumption growth in the coming decades.
The long-term potential for gas in the global energy mix remains strong. However, as this report argues, in order for that potential to be realized, a number of measures must be undertaken by the global gas industry and policymakers.
To ensure robust gas growth going forward, the global gas industry and policymakers must focus on three levers:
1. Cost Competitiveness: Improving the relative cost of gas to other energy sources through a combination of LNG cost efficiencies, pricing environmental externalities, and promotion of local gas production in markets around the world.
2. Security of Supply: Enabling gas supply security through the development of enhanced networks and infrastructure, more flexible commercial models, and new modular access-enabling technologies.
3. Sustainability: Promoting the environmental sustainability of gas through measures to reduce urban air pollution, develop low carbon technologies for gas, integrate renewable gas sources into existing infrastructure, and limit methane emissions.
Through 2030 global gas demand is expected to grow faster than for any other fossil fuel

Recent trends in global gas 1/

Global gas report 2018 8
Strong consumption growth
1. Global gas consumption experienced its strongest growth in over a decade. Preliminary data suggest 3.7% year-over-year (YOY) growth, double the average growth rate of 1.5% over the prior five years1.
2. Consumption growth was led by China. Driven by strong policy support for coal to gas switching in industry and buildings sectors to improve air quality, China accounted for >30% of global gas growth and nearly half of global LNG demand growth 2.
3. Consumption continued to increase in Europe (+30bcm in 2017, +83bcm since 2014). Growth was sustained
1
2
4
5
6
3
6
6
7 8
9
10Global consumption growth
Chinese consumption growth
Asian spot LNG price increase
European consumption growth
Russian production growth
New production ( Zohr)
New production (Australia LNG)
US production growth
Global LNG market liquidity Mozambique LNG FID
Flexible tech. (China-SSLNG)
9Flexible tech. (Malta & Turkey - FSRU)
First FLNG (Malaysia)
Global highlights
Top 10 global gas developments in 2017
by power consumption and industrial recovery, led by Italy with 4bcm growth (6%), Germany with 5bcm (6%), and the Netherlands around 3bcm (10%) 3.
4. High LNG demand matched rapid supply growth. This prompted an increase in LNG prices. On average, Asian spot LNG prices increased by $1.33 over 2016 prices and were sustained at more than $10/MMBtu through the winter 2017-18 season. This was despite substantial new LNG supply capacity (36bcma) 4, with Australia and the US delivering over 60% of the capacity growth.
1 IEA preliminary estimate2 China National Bureau of Statistics3 Cedigaz 2017 first estimates4 Bloomberg, Platts
+3.7% THE GROWTH RATE MORE THAN DOUBLED IN 2017, DRIVEN BY CHINA AND THE CONTINUING EUROPEAN RECOVERY
Global consumption growth
1. Key highlights from 2017
Global gas report 2018 9
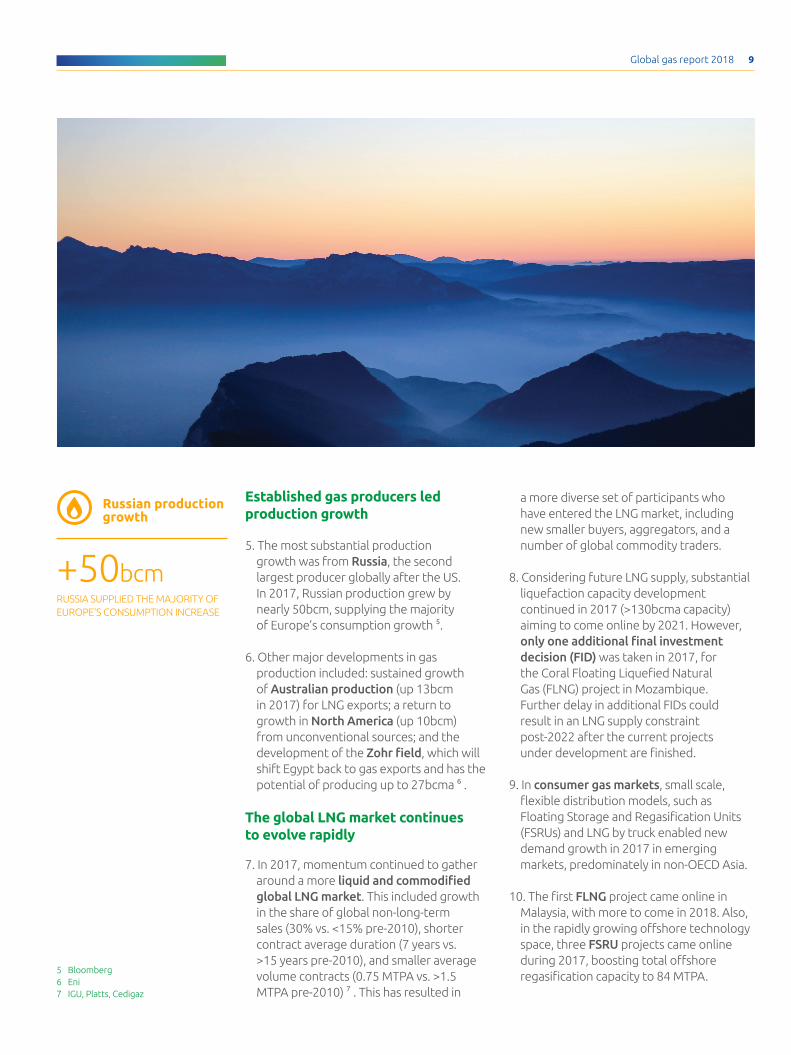
Established gas producers led production growth
5. The most substantial production growth was from Russia, the second largest producer globally after the US. In 2017, Russian production grew by nearly 50bcm, supplying the majority of Europe’s consumption growth 5.
6. Other major developments in gas production included: sustained growth of Australian production (up 13bcm in 2017) for LNG exports; a return to growth in North America (up 10bcm) from unconventional sources; and the development of the Zohr field, which will shift Egypt back to gas exports and has the potential of producing up to 27bcma 6 .
The global LNG market continues to evolve rapidly
7. In 2017, momentum continued to gather around a more liquid and commodified global LNG market. This included growth in the share of global non-long-term sales (30% vs. <15% pre-2010), shorter contract average duration (7 years vs. >15 years pre-2010), and smaller average volume contracts (0.75 MTPA vs. >1.5 MTPA pre-2010) 7 . This has resulted in
a more diverse set of participants who have entered the LNG market, including new smaller buyers, aggregators, and a number of global commodity traders.
8. Considering future LNG supply, substantial liquefaction capacity development continued in 2017 (>130bcma capacity) aiming to come online by 2021. However, only one additional final investment decision (FID) was taken in 2017, for the Coral Floating Liquefied Natural Gas (FLNG) project in Mozambique. Further delay in additional FIDs could result in an LNG supply constraint post-2022 after the current projects under development are finished.
9. In consumer gas markets, small scale, flexible distribution models, such as Floating Storage and Regasification Units (FSRUs) and LNG by truck enabled new demand growth in 2017 in emerging markets, predominately in non-OECD Asia.
10. The first FLNG project came online in Malaysia, with more to come in 2018. Also, in the rapidly growing offshore technology space, three FSRU projects came online during 2017, boosting total offshore regasification capacity to 84 MTPA.
5 Bloomberg6 Eni7 IGU, Platts, Cedigaz
+50bcm RUSSIA SUPPLIED THE MAJORITY OF EUROPE'S CONSUMPTION INCREASE
Russian production growth
Global gas report 2018 10
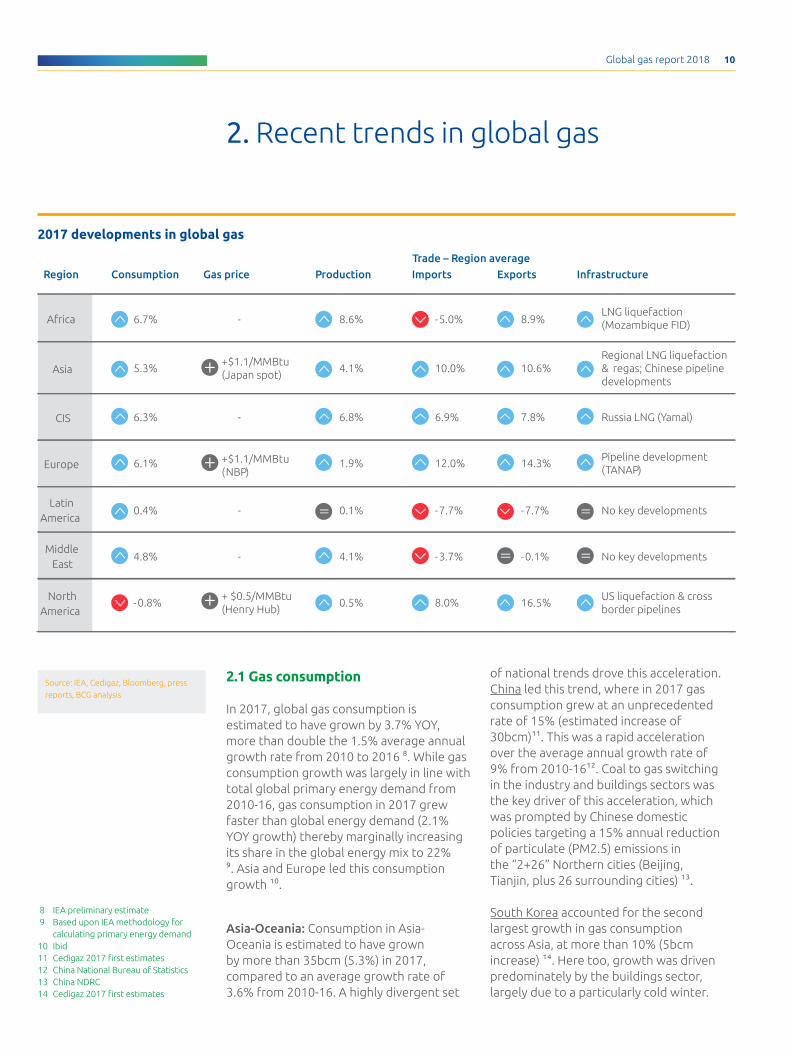
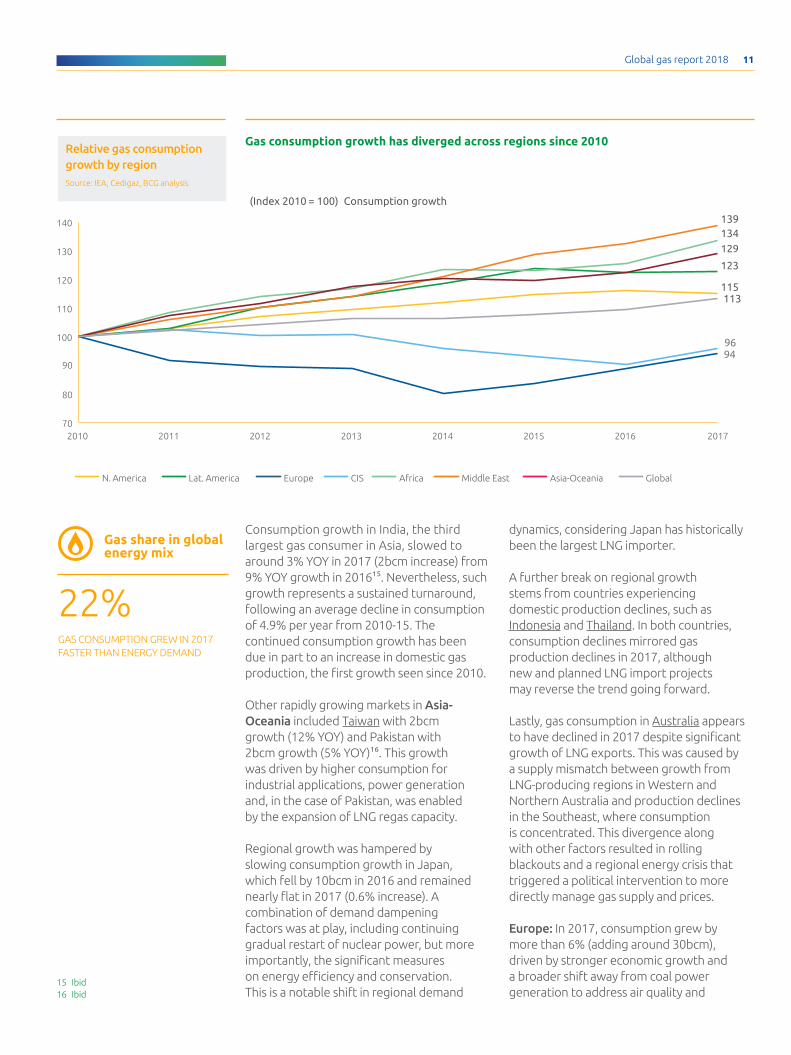
2.1 Gas consumption In 2017, global gas consumption is estimated to have grown by 3.7% YOY, more than double the 1.5% average annual growth rate from 2010 to 2016 8. While gas consumption growth was largely in line with total global primary energy demand from 2010-16, gas consumption in 2017 grew faster than global energy demand (2.1% YOY growth) thereby marginally increasing its share in the global energy mix to 22% 9. Asia and Europe led this consumption growth 10.
Asia-Oceania: Consumption in Asia-Oceania is estimated to have grown by more than 35bcm (5.3%) in 2017, compared to an average growth rate of 3.6% from 2010-16. A highly divergent set
8 IEA preliminary estimate 9 Based upon IEA methodology for
calculating primary energy demand10 Ibid11 Cedigaz 2017 first estimates12 China National Bureau of Statistics13 China NDRC14 Cedigaz 2017 first estimates
Region Consumption Gas price Production Imports Exports Infrastructure
• 6.7% - • 8.6% • -5.0% • 8.9%LNG liquefaction (Mozambique FID)
• 5.3% • 4.1% • 10.0% • 10.6%Regional LNG liquefaction & regas; Chinese pipeline developments
• 6.3% - • 6.8% • 6.9% • 7.8% • Russia LNG (Yamal)
• 6.1% • 1.9% • 12.0% • 14.3%• Pipeline development
(TANAP)
• 0.4% - • 0.1% • -7.7% • -7.7% • No key developments
• 4.8% - • 4.1% • -3.7% • -0.1% • No key developments
Africa
Asia
CIS
Europe
Latin America
Middle East
North America
• -0.8% • 0.5% • 8.0% • 16.5%• US liquefaction & cross
border pipelines
+$1.1/MMBtu (Japan spot)
• +$1.1/MMBtu (NBP)
+ $0.5/MMBtu (Henry Hub)
Trade – Region average
2017 developments in global gas
of national trends drove this acceleration. China led this trend, where in 2017 gas consumption grew at an unprecedented rate of 15% (estimated increase of 30bcm)11. This was a rapid acceleration over the average annual growth rate of 9% from 2010-1612. Coal to gas switching in the industry and buildings sectors was the key driver of this acceleration, which was prompted by Chinese domestic policies targeting a 15% annual reduction of particulate (PM2.5) emissions in the “2+26” Northern cities (Beijing, Tianjin, plus 26 surrounding cities) 13.
South Korea accounted for the second largest growth in gas consumption across Asia, at more than 10% (5bcm increase) 14. Here too, growth was driven predominately by the buildings sector, largely due to a particularly cold winter.
2. Recent trends in global gas
Source: IEA, Cedigaz, Bloomberg, press reports, BCG analysis
Global gas report 2018 11
Consumption growth in India, the third largest gas consumer in Asia, slowed to around 3% YOY in 2017 (2bcm increase) from 9% YOY growth in 201615. Nevertheless, such growth represents a sustained turnaround, following an average decline in consumption of 4.9% per year from 2010-15. The continued consumption growth has been due in part to an increase in domestic gas production, the first growth seen since 2010.
Other rapidly growing markets in Asia-Oceania included Taiwan with 2bcm growth (12% YOY) and Pakistan with 2bcm growth (5% YOY)16. This growth was driven by higher consumption for industrial applications, power generation and, in the case of Pakistan, was enabled by the expansion of LNG regas capacity.
Regional growth was hampered by slowing consumption growth in Japan, which fell by 10bcm in 2016 and remained nearly flat in 2017 (0.6% increase). A combination of demand dampening factors was at play, including continuing gradual restart of nuclear power, but more importantly, the significant measures on energy efficiency and conservation. This is a notable shift in regional demand
dynamics, considering Japan has historically been the largest LNG importer.
A further break on regional growth stems from countries experiencing domestic production declines, such as Indonesia and Thailand. In both countries, consumption declines mirrored gas production declines in 2017, although new and planned LNG import projects may reverse the trend going forward.
Lastly, gas consumption in Australia appears to have declined in 2017 despite significant growth of LNG exports. This was caused by a supply mismatch between growth from LNG-producing regions in Western and Northern Australia and production declines in the Southeast, where consumption is concentrated. This divergence along with other factors resulted in rolling blackouts and a regional energy crisis that triggered a political intervention to more directly manage gas supply and prices.
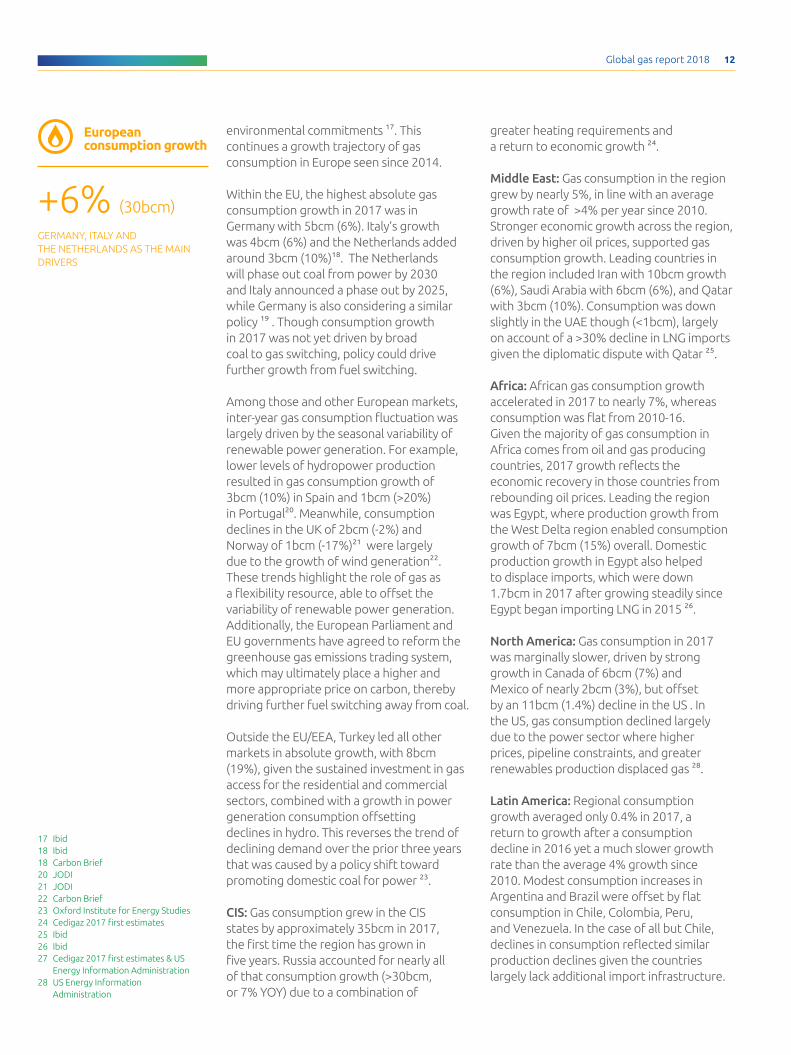
Europe: In 2017, consumption grew by more than 6% (adding around 30bcm), driven by stronger economic growth and a broader shift away from coal power generation to address air quality and
9496
2010 2012 2014 20162011 2013 2015 201770
80
90
100
110
120
130
140
Consumption growth (Index 2010 = 100)
115113
139134129
123
Middle EastAfrica GlobalAsia-OceaniaN. America Lat. America Europe CIS
Gas consumption growth has diverged across regions since 2010Relative gas consumption growth by regionSource: IEA, Cedigaz, BCG analysis
15 Ibid16 Ibid
22% GAS CONSUMPTION GREW IN 2017 FASTER THAN ENERGY DEMAND
Gas share in global energy mix
Global gas report 2018 12
environmental commitments 17. This continues a growth trajectory of gas consumption in Europe seen since 2014.
Within the EU, the highest absolute gas consumption growth in 2017 was in Germany with 5bcm (6%). Italy’s growth was 4bcm (6%) and the Netherlands added around 3bcm (10%)18. The Netherlands will phase out coal from power by 2030 and Italy announced a phase out by 2025, while Germany is also considering a similar policy 19 . Though consumption growth in 2017 was not yet driven by broad coal to gas switching, policy could drive further growth from fuel switching.
Among those and other European markets, inter-year gas consumption fluctuation was largely driven by the seasonal variability of renewable power generation. For example, lower levels of hydropower production resulted in gas consumption growth of 3bcm (10%) in Spain and 1bcm (>20%) in Portugal20. Meanwhile, consumption declines in the UK of 2bcm (-2%) and Norway of 1bcm (-17%)21 were largely due to the growth of wind generation22. These trends highlight the role of gas as a flexibility resource, able to offset the variability of renewable power generation. Additionally, the European Parliament and EU governments have agreed to reform the greenhouse gas emissions trading system, which may ultimately place a higher and more appropriate price on carbon, thereby driving further fuel switching away from coal.
Outside the EU/EEA, Turkey led all other markets in absolute growth, with 8bcm (19%), given the sustained investment in gas access for the residential and commercial sectors, combined with a growth in power generation consumption offsetting declines in hydro. This reverses the trend of declining demand over the prior three years that was caused by a policy shift toward promoting domestic coal for power 23.
CIS: Gas consumption grew in the CIS states by approximately 35bcm in 2017, the first time the region has grown in five years. Russia accounted for nearly all of that consumption growth (>30bcm, or 7% YOY) due to a combination of
greater heating requirements and a return to economic growth 24.
Middle East: Gas consumption in the region grew by nearly 5%, in line with an average growth rate of >4% per year since 2010. Stronger economic growth across the region, driven by higher oil prices, supported gas consumption growth. Leading countries in the region included Iran with 10bcm growth (6%), Saudi Arabia with 6bcm (6%), and Qatar with 3bcm (10%). Consumption was down slightly in the UAE though (<1bcm), largely on account of a >30% decline in LNG imports given the diplomatic dispute with Qatar 25.
Africa: African gas consumption growth accelerated in 2017 to nearly 7%, whereas consumption was flat from 2010-16. Given the majority of gas consumption in Africa comes from oil and gas producing countries, 2017 growth reflects the economic recovery in those countries from rebounding oil prices. Leading the region was Egypt, where production growth from the West Delta region enabled consumption growth of 7bcm (15%) overall. Domestic production growth in Egypt also helped to displace imports, which were down 1.7bcm in 2017 after growing steadily since Egypt began importing LNG in 2015 26.
North America: Gas consumption in 2017 was marginally slower, driven by strong growth in Canada of 6bcm (7%) and Mexico of nearly 2bcm (3%), but offset by an 11bcm (1.4%) decline in the US . In the US, gas consumption declined largely due to the power sector where higher prices, pipeline constraints, and greater renewables production displaced gas 28.
Latin America: Regional consumption growth averaged only 0.4% in 2017, a return to growth after a consumption decline in 2016 yet a much slower growth rate than the average 4% growth since 2010. Modest consumption increases in Argentina and Brazil were offset by flat consumption in Chile, Colombia, Peru, and Venezuela. In the case of all but Chile, declines in consumption reflected similar production declines given the countries largely lack additional import infrastructure.
17 Ibid18 Ibid18 Carbon Brief20 JODI21 JODI22 Carbon Brief23 Oxford Institute for Energy Studies24 Cedigaz 2017 first estimates25 Ibid26 Ibid27 Cedigaz 2017 first estimates & US
Energy Information Administration28 US Energy Information
Administration
+6% (30bcm) GERMANY, ITALY AND THE NETHERLANDS AS THE MAIN DRIVERS
European consumption growth

Global gas report 2018 13
Oil, Gas and Coal prices in major reference markets 2011-2017In 2017 gas prices rose in Europe and Asia vs. other fuelsSource: World Bank, Bloomberg, EIA, BCG analysis
North America Europe Asia
0
6
12
18
24
2018201620142012 20132011 2015 2017
$/MMBtu
HHWTI US Coal 1 2 3
0
6
12
18
24
201820142012 20162013 201720152011
$/MMBtu
Brent NBP Eur. Coal
0
6
12
18
24
2017201520132011 20182012 2014 2016
$/MMBtu
NEA Spot Asia CoalDubai
1. US coal price is Central Appalachia price, 2. Rotterdam index, 3. Australia coal
2.2 Gas prices Natural gas prices increased globally in 2017. Across global gas hubs and key indices, prices were up by $0.5-1/MMBtu: in Europe average spot prices were up $1.1/MMBtu (NBP), in Asia by $1.1/MMBtu (Japan spot LNG), and in North America by $0.5/MMBtu (Henry Hub). This was due, in part, to the increase in oil prices (driving up oil indexed gas prices), combined with stronger than expected LNG demand. Across the major global gas hubs, the US remained the cheapest, with an average spot price of $2.9/MMBtu in 2017, vs. $5.8/MMBtu in Europe, and $7.3/MMBtu in Asia29.
While average annual global gas prices rose for the first time in two years, the trend toward global price convergence continued in Europe and Asia. Spot prices showed similar patterns across the major markets for delivered LNG, both in terms of average price differential, and the impact of seasonality. Winter spot price increases were greater in Asia though given that rapid Chinese growth prompted greater spot purchases. Nonetheless, the growth of a more globalized LNG market with gas-on-gas pricing and spot trading has
been critical for promoting sustained price convergence across regions. In Europe, for example, over 60% of gas sold is priced on a gas-on-gas basis, compared with less than 10% in 2005; globally the share of gas-on-gas is now 45% vs. 31% in 200530.
The observed increase in natural gas prices reflected similar price increases for both oil and coal in 2017. While such a trend would be expected for oil given the continued impact of oil index pricing, the increase in coal prices was due in part to a cut in Chinese capacity, which helped to drive global coal prices higher for a second consecutive year.
Despite an increase in coal prices, without an appropriate price on carbon and other pollutants, gas still prices at a premium to coal on an energy basis around the world. In the US, the average premium of gas to coal has remained around 40% (or $1/MMBtu) over the past five years. In Europe and Asia, the gas to coal premium is higher, averaging $2.4/MMBtu and $2.7/MMBtu, respectively31. However, due to its higher thermal efficiency and lower capital costs in key applications, like power, gas is cheaper than coal on a levelized cost of energy
29 Bloomberg30 IGU Wholesale Gas Price Survey, 2017
$2.8/MMBTU (US)
$5.8/MMBTU (EU)
$7.3/MMBTU (ASIA)
UP ON 2017 $0.5-1/MMBTU VS 2016
Average 2017 natural gas prices
Global gas report 2018 14
basis in some markets (North America).
Looking ahead, term contract gas prices are continuing to rise in 2018 given higher oil prices and the continued prevalence of oil index pricing. This may increase the spread between spot and term volumes as the share of the former being priced on a gas-on-gas basis continues to increase. Yet, these spreads are also likely to be highly seasonal due to the variability of demand and lack of storage in Asia, a critical region for determining spot LNG prices. Storage will likely play a more significant role during periods of peak LNG demand.
2.2 Gas reserves and production
In 2017, gas production growth was greatest in Russia, which added approximately 50bcm (8% YOY)32. Nearly 20bcm of that was exported via pipeline to the EU, CIS markets, and Turkey. Additionally, Yamal LNG came online at the end of 2017 with the first commercial delivery in early 2018, which will sustain production and export growth going forward.
Across the Asia-Oceania region, Australia led all production growth in the region,
with similar production gains as in 2016 (13bcm or >27% YOY growth) given the development of multiple new LNG export projects 33. Chinese production also grew significantly (>10bcm or 8% YOY growth), mostly from greater draws on conventional resources. In SE Asia, Malaysia extended its production growth (up by 1bcm), but that was offset by declining production in several mature gas markets, including Indonesia and Thailand.
In North America, gas production increased marginally in 2017 (0.5%), recovering from a decline in 2016 that resulted from lower US associated gas production from oil projects. US gas production grew by 1% in 2017, entirely driven by greater unconventional output from a combination of the oil-led Permian basin and sustained production growth from the gas-rich Marcellus and Utica basins in the Appalachian region34. US and Canadian growth (5bcm and 3bcm, respectively) offset continued production declines in Mexico, which was down nearly 5bcm (15%) in 2017 35.
European gas production grew by 1.9% in 2017, due almost entirely to Norway. While Norwegian production rose by
29 Bloomberg30 IGU Wholesale Gas Price Survey, 201731 Bloomberg32 Bloomberg33 Cedigaz 2017 first estimates34 US Energy Information Administration35 Cedigaz 2017 first estimates
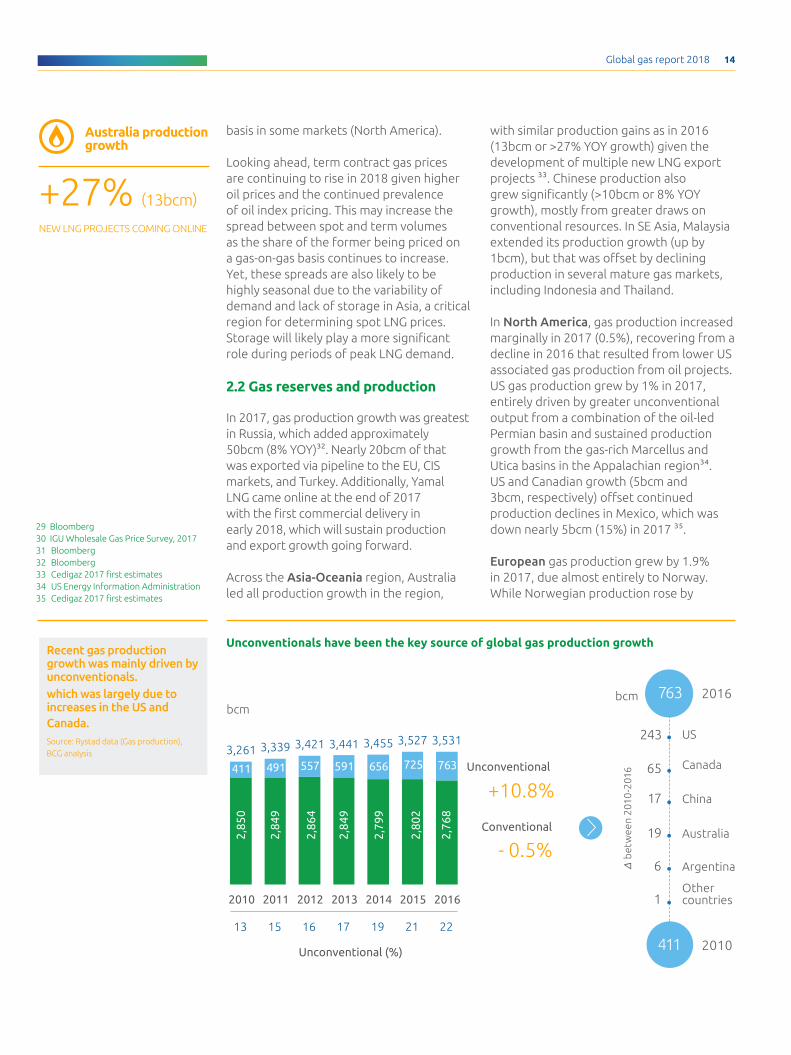
Unconventionals have been the key source of global gas production growthRecent gas production growth was mainly driven by unconventionals.which was largely due to increases in the US and Canada. Source: Rystad data (Gas production), BCG analysis
bcm
Othercountries
US
Argentina
bcm
Canada
Australia
China
1
243
6
65
19
17
bet
wee
n 20
10-2
016
411 2010
2016763
411 491 557 656 725 763
Conventional
- 0.5%
Unconventional
+10.8%
2016
3,531
! 2,76
8
2015
3,527
! 2,80
2
2014
3,455
! 2,79
9
2013
3,441
! 2,84
9
591
2012
3,421
! 2,86
4
2011
3,339
! 2,84
9
2010
3,261
! 2,85
0
13 15 16 19 21
Unconventional (%)
17 22
+27% (13bcm)
NEW LNG PROJECTS COMING ONLINE
Australia production growth
Global gas report 2018 15
Europe
Middle East
Africa
12.9
11.4 1.9
0.4
15.4
North America
Latin America
7.7
0.33.9
0.9
65.5
0.60.3
ReservesProduction
CIS
Asia Oceania
Middle East0.8
80.1
more than 10bcm (nearly 9%), production across the rest of Europe declined 36. This trend is in line with a nearly 4% average annual production decline since 2010 (excluding Norway). Given that many production assets are on their way to reaching end of life, both in the North Sea and onshore, the trend is expected to continue. The most notable recent development was the decision by the Dutch government to further restrict production in the Groningen field to nearly half (from 21.6 bcm to 12 bcm) after a 60% reduction in 2013 (from peak of 54 bcm), with an ultimate goal of shutting it down completely by 2030. Motivated by earthquake risks, this decision will materially limit production through 2018 and going forward.
In Africa, production grew by nearly 9% through 2017. Growth from Egypt (9bcm), Nigeria (4bcm), and Angola (4bcm) led in the region 37. The December 2017 start of production from the Zohr field in Egypt will sustain that growth, potentially increasing Egyptian production by a further 10bcma in 2018-19 38.
36 Ibid37 Ibid38 Bloomberg39 Cedigaz 2017 first estimates40 IEA World Energy Outlook 2011 and
2016
In Latin America, production was flat in 2017. Growth in unconventional gas production in Argentina from the Vaca Muerta region, as well as growth from Brazil, offset declines in conventional production across the region 39.
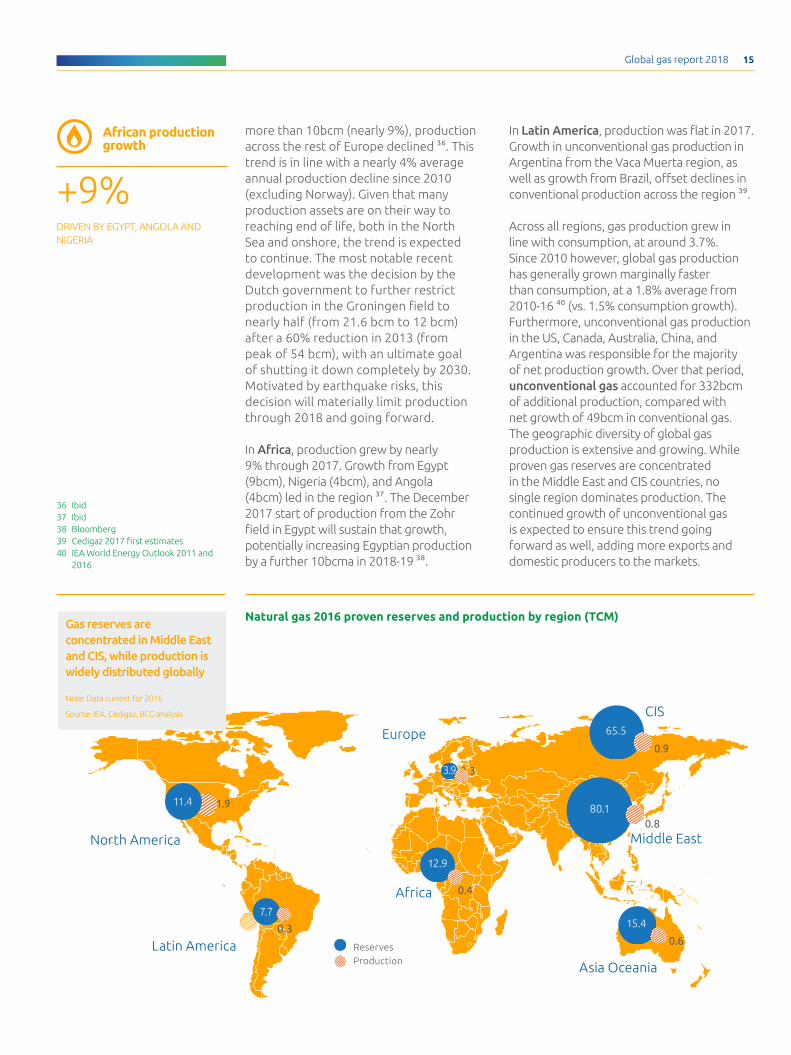
Across all regions, gas production grew in line with consumption, at around 3.7%. Since 2010 however, global gas production has generally grown marginally faster than consumption, at a 1.8% average from 2010-16 40 (vs. 1.5% consumption growth). Furthermore, unconventional gas production in the US, Canada, Australia, China, and Argentina was responsible for the majority of net production growth. Over that period, unconventional gas accounted for 332bcm of additional production, compared with net growth of 49bcm in conventional gas.The geographic diversity of global gas production is extensive and growing. While proven gas reserves are concentrated in the Middle East and CIS countries, no single region dominates production. The continued growth of unconventional gas is expected to ensure this trend going forward as well, adding more exports and domestic producers to the markets.
Natural gas 2016 proven reserves and production by region (TCM)Gas reserves are concentrated in Middle East and CIS, while production is widely distributed globally
Note: Data current for 2016
Source: IEA, Cedigaz, BCG analysis
+9%DRIVEN BY EGYPT, ANGOLA AND NIGERIA
African production growth
Global gas report 2018 16
41 Cedigaz 2017 first estimates & IEA42 IGU 2018 World LNG Report43 Ibid44 Columbia University Center for Energy Policy45 Includes in the order of LNG adoption: Kuwait, UAE, Thailand, Indonesia, Singapore,
Lithuania, Pakistan, Egypt, Poland, Jordan, Jamaica, and Malta. Additional new LNG importers may include Ghana, Albania, Croatia, Panama, and Vietnam.
46 Cedigaz 2017 first estimates47 Ibid48 IGU 2018 World LNG Report: Includes Cove Point, Cameron, Ichtys, Prelude,
Tangguh, Elba Island, Corpus Christie, Freeport, Coral, PNG, Indonesia, and Malaysia and additional capacity from Yamal, Wheatstone, and Sabine Pass.
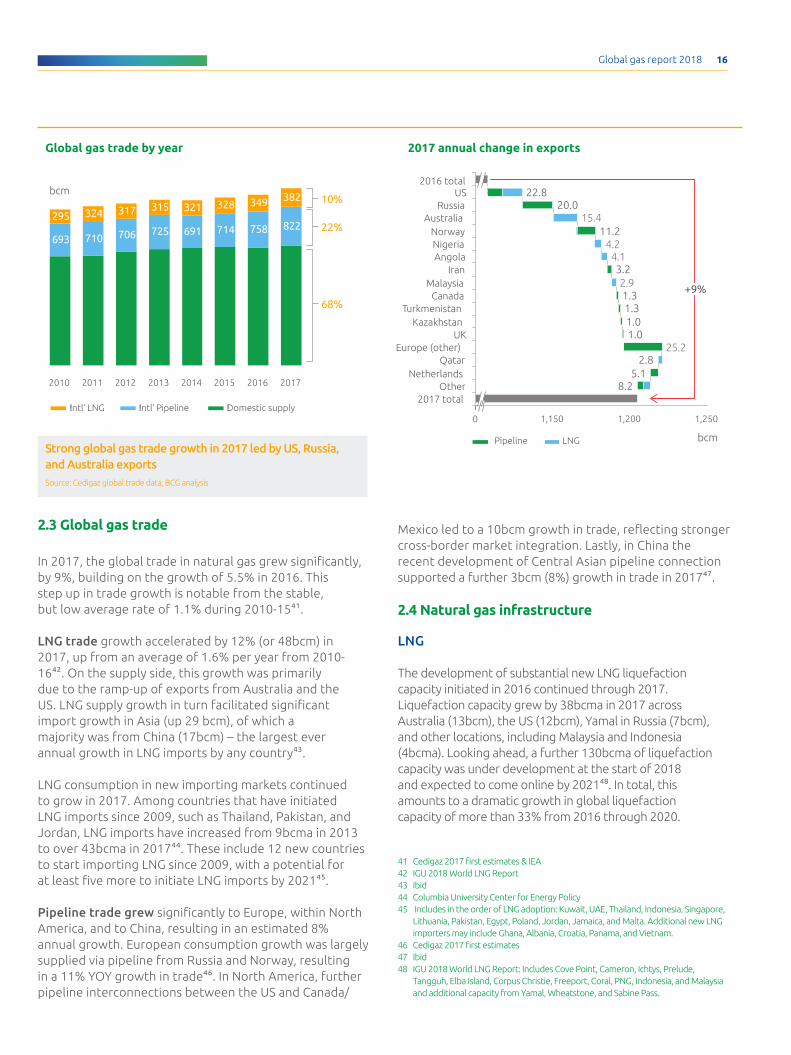
Global gas trade by year 2017 annual change in exports
Strong global gas trade growth in 2017 led by US, Russia, and Australia exportsSource: Cedigaz global trade data, BCG analysis
2.3 Global gas trade
In 2017, the global trade in natural gas grew significantly, by 9%, building on the growth of 5.5% in 2016. This step up in trade growth is notable from the stable, but low average rate of 1.1% during 2010-1541.
LNG trade growth accelerated by 12% (or 48bcm) in 2017, up from an average of 1.6% per year from 2010-1642. On the supply side, this growth was primarily due to the ramp-up of exports from Australia and the US. LNG supply growth in turn facilitated significant import growth in Asia (up 29 bcm), of which a majority was from China (17bcm) – the largest ever annual growth in LNG imports by any country43.
LNG consumption in new importing markets continued to grow in 2017. Among countries that have initiated LNG imports since 2009, such as Thailand, Pakistan, and Jordan, LNG imports have increased from 9bcma in 2013 to over 43bcma in 201744. These include 12 new countries to start importing LNG since 2009, with a potential for at least five more to initiate LNG imports by 202145.
Pipeline trade grew significantly to Europe, within North America, and to China, resulting in an estimated 8% annual growth. European consumption growth was largely supplied via pipeline from Russia and Norway, resulting in a 11% YOY growth in trade46. In North America, further pipeline interconnections between the US and Canada/
693 710 706 725 691 714 758 822295 324 317 315 321 328 349 382
2017201620152014
bcm
2013201220112010
!Domestic supply!Intl’ Pipeline!Intl’ LNG
25.2
2.9
4.14.2
15.4
1,2501,2001,1500
Norway 11.2Australia
Russia
Canada 1.3Malaysia
Iran 3.2Angola
Other2017 total
bcm
Turkmenistan1.0Kazakhstan1.0UK
Europe (other)2.8
Netherlands 5.18.2
Qatar
20.0
+9%
Nigeria
1.3
US 22.82016 total
LNGPipeline
68%
22%
10%
Mexico led to a 10bcm growth in trade, reflecting stronger cross-border market integration. Lastly, in China the recent development of Central Asian pipeline connection supported a further 3bcm (8%) growth in trade in 201747.
2.4 Natural gas infrastructure
LNG
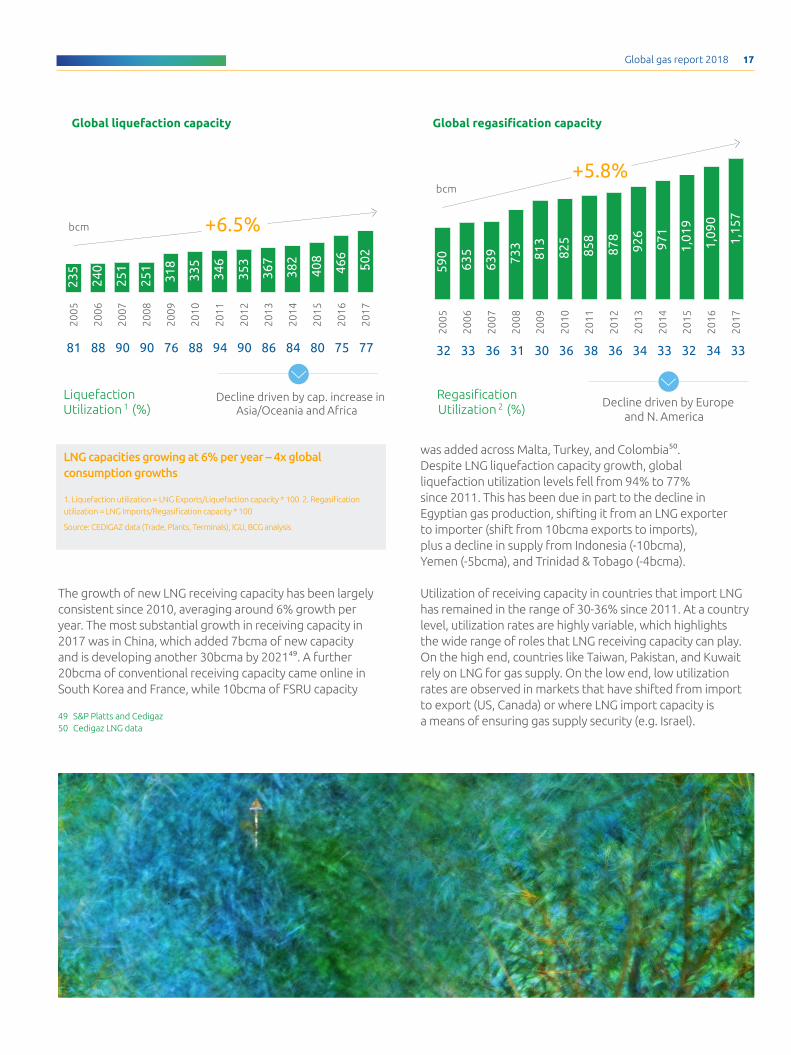
The development of substantial new LNG liquefaction capacity initiated in 2016 continued through 2017. Liquefaction capacity grew by 38bcma in 2017 across Australia (13bcm), the US (12bcm), Yamal in Russia (7bcm), and other locations, including Malaysia and Indonesia (4bcma). Looking ahead, a further 130bcma of liquefaction capacity was under development at the start of 2018 and expected to come online by 202148. In total, this amounts to a dramatic growth in global liquefaction capacity of more than 33% from 2016 through 2020.
Global gas report 2018 17
The growth of new LNG receiving capacity has been largely consistent since 2010, averaging around 6% growth per year. The most substantial growth in receiving capacity in 2017 was in China, which added 7bcma of new capacity and is developing another 30bcma by 202149. A further 20bcma of conventional receiving capacity came online in South Korea and France, while 10bcma of FSRU capacity
bcm
bcm
2009
318
2008
251
2007
251
2006
240
2005
235
+6.5%
2017
!502
2016
466
2015
408
2014
382
2013
367
2012
353
2011
346
2010
335 63
5
639
2005
2006
2016
1,09
0
2015
1,15
720
17
+5.8%
2007
2008
733
813
2010
2011
825
858
2009
2013
971
926
878
2014
2012
1,01
9
590
81
LiquefactionUtilization 1 (%)
90 94 90 84 8086 7590 76 8888 32
RegasificationUtilization 2 (%)
36 38 36 33 3234 3431 30 3633
Decline driven by cap. increase in Asia/Oceania and Africa
Decline driven by Europeand N. America
77 33
LNG capacities growing at 6% per year – 4x global consumption growths
1. Liquefaction utilization = LNG Exports/Liquefaction capacity * 100 2. Regasification utilization = LNG Imports/Regasification capacity * 100
Source: CEDIGAZ data (Trade, Plants, Terminals), IGU, BCG analysis
Global liquefaction capacity Global regasification capacity
was added across Malta, Turkey, and Colombia50. Despite LNG liquefaction capacity growth, global liquefaction utilization levels fell from 94% to 77% since 2011. This has been due in part to the decline in Egyptian gas production, shifting it from an LNG exporter to importer (shift from 10bcma exports to imports), plus a decline in supply from Indonesia (-10bcma), Yemen (-5bcma), and Trinidad & Tobago (-4bcma).
Utilization of receiving capacity in countries that import LNG has remained in the range of 30-36% since 2011. At a country level, utilization rates are highly variable, which highlights the wide range of roles that LNG receiving capacity can play. On the high end, countries like Taiwan, Pakistan, and Kuwait rely on LNG for gas supply. On the low end, low utilization rates are observed in markets that have shifted from import to export (US, Canada) or where LNG import capacity is a means of ensuring gas supply security (e.g. Israel). 49 S&P Platts and Cedigaz
50 Cedigaz LNG data

Global gas report 2018 18
Regasification utilization in 2016 (%)
Regasification utilization by region (%)
2005 2010 2016
Africa 0 0 72
Asia / Oceania 31 39 43
Europe 42 50 28
Latin America 14 49 35
Middle East 0 0 43
North America 34 11 4
Total 33 36 34
Decline in regas utilization since 2010 driven by Europe and US
1. Taiwan is running over capacity, forcing LNG plants to run above theoretical capacities. Two actions in progress; expansion of one of LNG plants, and building of 3rd terminal
Note: Regasification utilization = LNG Imports / Regasification capacity * 100
Source: CEDIGAZ data (CEDIGAZ trade, Plants, Terminals, Pipeline capacities) BCG analysis; IGU
Turk
ey
Taiw
an
Egyp
tP
akis
tan
8911
1
Kuw
ait
5962
66
Mex
ico
23
Bel
gium
28
Uni
ted
Sta
tes
Mal
aysi
aSo
uth
Ko
rea
23U
nite
d K
ingd
om
Swed
en
26
23 22Sp
ain
2222P
ort
ugal
15 14G
reec
e
11 10
Bra
zil
Isra
elC
anad
a
Net
herl
and
s
Pue
rto
Ric
o
!52
31
Do
min
ican
Rep
ublic
Sing
apo
re
40
Lith
uani
a
Arg
enti
na
Chi
na
Thai
land
Chi
le47
38It
aly
43Ja
pan
44
Ind
ia
45
!51
!58
40
!57
31
Fran
ce
Jord
an
72
Countries with pipeline and LNG supplyCountries with limited or no pipeline capacities
Global gas report 2018 19
International pipelines
Global cross-border pipeline capacity grew by 10% between 2010 and 2014 (190 bcma) and has not grown significantly since. The largest recent project was Europe’s Nordstream pipeline, which added 55 bcma of transmission capacity from Russia to Europe via Germany when it was completed in 2012. Asian pipeline capacity has also been expanded recently, with connections between China, Myanmar and Central Asia, especially Turkmenistan. This has added a further 40bcma to global transmission capacity. Other significant capacity additions since 2011 have included West Africa, with 5 bcma, and 10 bcma of extra capacity between Bolivia and Argentina51.
Looking forward, there are four major pipeline development initiatives underway globally. First, in North America, approximately 120bcma of pipeline capacity is either planned or under development between the US and Mexico and the US and Canada. Second, the Power of Siberia pipeline under development between Russia and China will add 40 bcma of import capacity to China in 2020. Third, components of TAPI pipeline are now under construction, which would link Turkmenistan, Afghanistan, Pakistan, and India with a capacity of over 30 bcma (although further political arrangements are required to fully complete it). Fourth, the Trans-Anatolian pipeline (TANAP), with up to 30 bcma of capacity through Turkey to Europe, is under construction and is expected to be completed by 2020, along with the Trans-Adriatic pipeline connecting supply through Greece to Italy.
Domestic storage and gas networks – implications on resilience
In late December 2017 and early January 2018, US energy resilience was tested with extremely cold weather, averaging more than 10 degrees Celsius below average across the US Midwest and Northeast. This extreme weather caused a sudden surge in energy demand, which gas played a key role in supplying. Gas increased its share in peak power generation by 28% on average across the US in under a week52. In total, gas supply
grew by 40% in less than two weeks during the cold snap, from an average of less than 100bcf/d in December to a peak of more than 140bcf/d in the first week of January.
The rapid supply response from gas was enabled by substantial storage capacity and pipeline infrastructure. Net gas withdrawals from storage totaled 359bcf in the first week of January 2018, a record in the US53. The substantial pipeline build out in the Appalachian region was another key enabler of supply resilience. In the PJM interconnection gas-fired power generation remained stable as other sources of consumption grew, all while spot prices increased from $2.35/MMBtu to $3.00/MMBtu54. Meanwhile, in New York and New England, pipeline constraints resulted in gas prices exceeding $20/MMBtu, diverting gas from power generation.
Simultaneous to the cold weather snap in North America, China experienced gas supply shortages in part due to limited gas storage capacity. As air quality policies drove rapid gas consumption growth, the combination of LNG import capacity, pipeline imports, and domestic production were not able to keep pace with that growth. Given gas storage amounts to less than 7bcm in China (3% of consumption), the network lacked supply resilience and flexibility in light of a demand strain55.
These examples highlight the importance of well-planned infrastructure investments to ensure the ability to take full advantage of the high flexibility and responsiveness of natural gas, maximizing the value of upstream and importing investments. As these assets require time to be developed, industry and policymakers in newly developing gas markets should pay as much attention to network infrastructure developments as they do to upstream and import capacity buildouts.
51 GlobalData pipeline database 52 US EIA53 Ibid54 Bloomberg55 Cedigaz gas storage data
120 bcmPIPELINE CAPACITY THAT IS PLANNED OR UNDER DEVELOPMENT
North America
Global gas report 2018 20
56 For example, the IEA New Policies Scenario specifically incorporates NDCs at a country level in its forecast
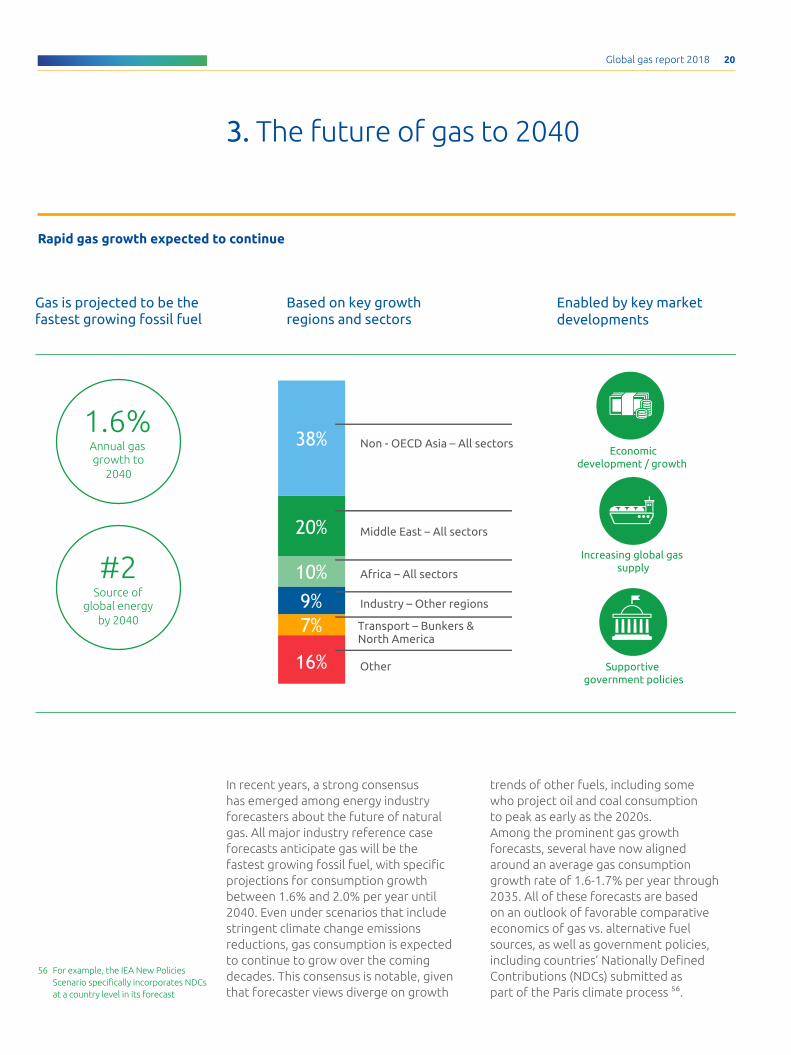
Rapid gas growth expected to continue
3. The future of gas to 2040
Economicdevelopment / growth
Increasing global gas supply
Supportive government policies
Gas is projected to be the fastest growing fossil fuel
Based on key growth regions and sectors
Enabled by key marketdevelopments
1.6%Annual gas growth to
2040
#2Source of
global energy by 2040
Other
Transport – Bunkers &North America
Industry – Other regions
Africa – All sectors
Middle East – All sectors
Non - OECD Asia – All sectors38%
20%
10%9%7%
16%
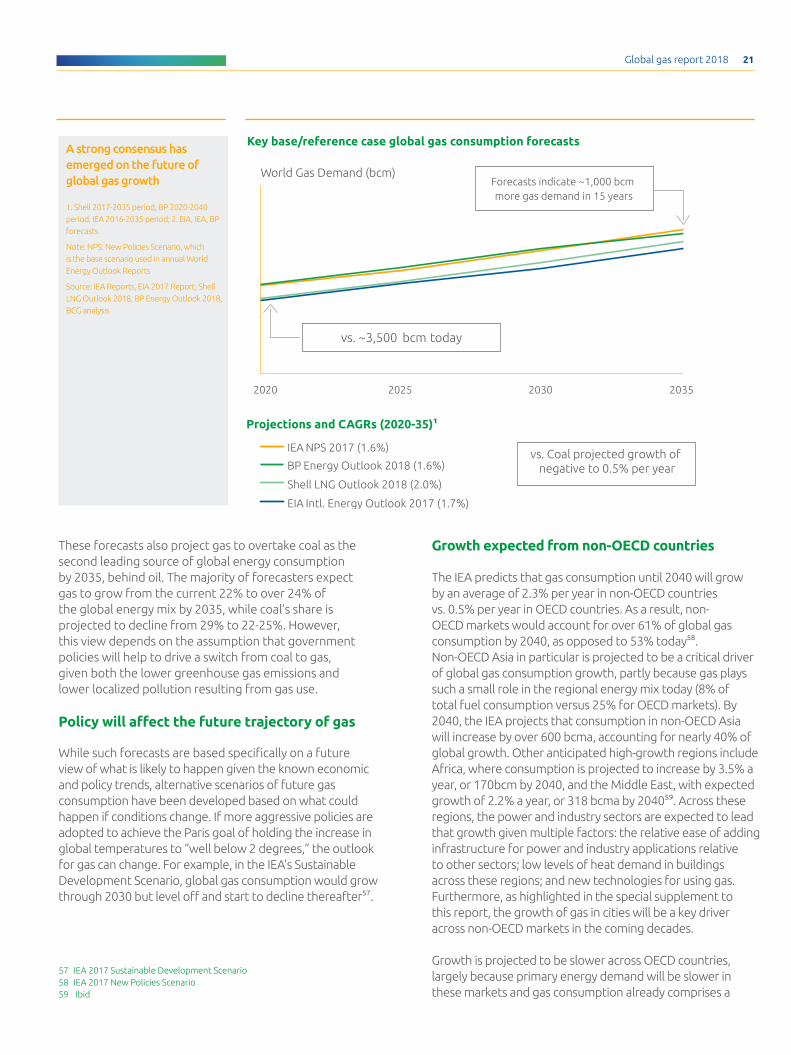
In recent years, a strong consensus has emerged among energy industry forecasters about the future of natural gas. All major industry reference case forecasts anticipate gas will be the fastest growing fossil fuel, with specific projections for consumption growth between 1.6% and 2.0% per year until 2040. Even under scenarios that include stringent climate change emissions reductions, gas consumption is expected to continue to grow over the coming decades. This consensus is notable, given that forecaster views diverge on growth
trends of other fuels, including some who project oil and coal consumption to peak as early as the 2020s.Among the prominent gas growth forecasts, several have now aligned around an average gas consumption growth rate of 1.6-1.7% per year through 2035. All of these forecasts are based on an outlook of favorable comparative economics of gas vs. alternative fuel sources, as well as government policies, including countries’ Nationally Defined Contributions (NDCs) submitted as part of the Paris climate process 56.
Global gas report 2018 21
2035203020252020
World Gas Demand (bcm)
IEA NPS 2017 (1.6%)
BP Energy Outlook 2018 (1.6%)
Shell LNG Outlook 2018 (2.0%)
EIA Intl. Energy Outlook 2017 (1.7%)
Forecasts indicate ~1,000 bcmmore gas demand in 15 years
vs. ~3,500 bcm today
vs. Coal projected growth of negative to 0.5% per year
Key base/reference case global gas consumption forecastsA strong consensus has emerged on the future of global gas growth
1. Shell 2017-2035 period, BP 2020-2040 period, IEA 2016-2035 period; 2. EIA, IEA, BP forecasts
Note: NPS: New Policies Scenario, which is the base scenario used in annual World Energy Outlook Reports
Source: IEA Reports, EIA 2017 Report, Shell LNG Outlook 2018, BP Energy Outlook 2018, BCG analysis
Projections and CAGRs (2020-35)1
These forecasts also project gas to overtake coal as the second leading source of global energy consumption by 2035, behind oil. The majority of forecasters expect gas to grow from the current 22% to over 24% of the global energy mix by 2035, while coal’s share is projected to decline from 29% to 22-25%. However, this view depends on the assumption that government policies will help to drive a switch from coal to gas, given both the lower greenhouse gas emissions and lower localized pollution resulting from gas use.
Policy will affect the future trajectory of gas
While such forecasts are based specifically on a future view of what is likely to happen given the known economic and policy trends, alternative scenarios of future gas consumption have been developed based on what could happen if conditions change. If more aggressive policies are adopted to achieve the Paris goal of holding the increase in global temperatures to “well below 2 degrees,” the outlook for gas can change. For example, in the IEA’s Sustainable Development Scenario, global gas consumption would grow through 2030 but level off and start to decline thereafter57.
Growth expected from non-OECD countries
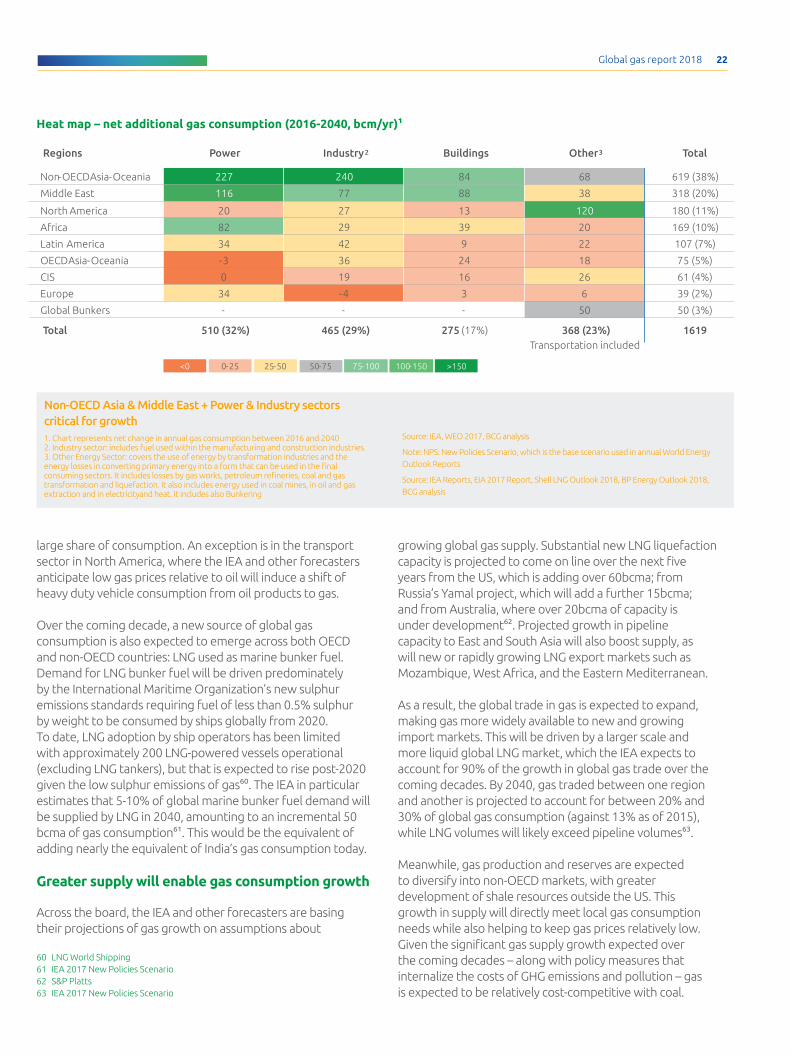
The IEA predicts that gas consumption until 2040 will grow by an average of 2.3% per year in non-OECD countries vs. 0.5% per year in OECD countries. As a result, non-OECD markets would account for over 61% of global gas consumption by 2040, as opposed to 53% today58.Non-OECD Asia in particular is projected to be a critical driver of global gas consumption growth, partly because gas plays such a small role in the regional energy mix today (8% of total fuel consumption versus 25% for OECD markets). By 2040, the IEA projects that consumption in non-OECD Asia will increase by over 600 bcma, accounting for nearly 40% of global growth. Other anticipated high-growth regions include Africa, where consumption is projected to increase by 3.5% a year, or 170bcm by 2040, and the Middle East, with expected growth of 2.2% a year, or 318 bcma by 204059. Across these regions, the power and industry sectors are expected to lead that growth given multiple factors: the relative ease of adding infrastructure for power and industry applications relative to other sectors; low levels of heat demand in buildings across these regions; and new technologies for using gas. Furthermore, as highlighted in the special supplement to this report, the growth of gas in cities will be a key driver across non-OECD markets in the coming decades.
Growth is projected to be slower across OECD countries, largely because primary energy demand will be slower in these markets and gas consumption already comprises a
57 IEA 2017 Sustainable Development Scenario58 IEA 2017 New Policies Scenario59 Ibid
Global gas report 2018 22
Heat map – net additional gas consumption (2016-2040, bcm/yr)1
Non-OECD Asia & Middle East + Power & Industry sectors critical for growth 1. Chart represents net change in annual gas consumption between 2016 and 20402. Industry sector: includes fuel used within the manufacturing and construction industries. 3. Other Energy Sector: covers the use of energy by transformation industries and the energy losses in converting primary energy into a form that can be used in the final consuming sectors. It includes losses by gas works, petroleum refineries, coal and gas transformation and liquefaction. It also includes energy used in coal mines, in oil and gas extraction and in electricityand heat. It includes also Bunkering
Source: IEA, WEO 2017, BCG analysis
Note: NPS: New Policies Scenario, which is the base scenario used in annual World Energy Outlook Reports
Source: IEA Reports, EIA 2017 Report, Shell LNG Outlook 2018, BP Energy Outlook 2018, BCG analysis
large share of consumption. An exception is in the transport sector in North America, where the IEA and other forecasters anticipate low gas prices relative to oil will induce a shift of heavy duty vehicle consumption from oil products to gas.
Over the coming decade, a new source of global gas consumption is also expected to emerge across both OECD and non-OECD countries: LNG used as marine bunker fuel. Demand for LNG bunker fuel will be driven predominately by the International Maritime Organization’s new sulphur emissions standards requiring fuel of less than 0.5% sulphur by weight to be consumed by ships globally from 2020. To date, LNG adoption by ship operators has been limited with approximately 200 LNG-powered vessels operational (excluding LNG tankers), but that is expected to rise post-2020 given the low sulphur emissions of gas60. The IEA in particular estimates that 5-10% of global marine bunker fuel demand will be supplied by LNG in 2040, amounting to an incremental 50 bcma of gas consumption61. This would be the equivalent of adding nearly the equivalent of India’s gas consumption today.
Greater supply will enable gas consumption growth
Across the board, the IEA and other forecasters are basing their projections of gas growth on assumptions about
growing global gas supply. Substantial new LNG liquefaction capacity is projected to come on line over the next five years from the US, which is adding over 60bcma; from Russia’s Yamal project, which will add a further 15bcma; and from Australia, where over 20bcma of capacity is under development62. Projected growth in pipeline capacity to East and South Asia will also boost supply, as will new or rapidly growing LNG export markets such as Mozambique, West Africa, and the Eastern Mediterranean.
As a result, the global trade in gas is expected to expand, making gas more widely available to new and growing import markets. This will be driven by a larger scale and more liquid global LNG market, which the IEA expects to account for 90% of the growth in global gas trade over the coming decades. By 2040, gas traded between one region and another is projected to account for between 20% and 30% of global gas consumption (against 13% as of 2015), while LNG volumes will likely exceed pipeline volumes63.
Meanwhile, gas production and reserves are expected to diversify into non-OECD markets, with greater development of shale resources outside the US. This growth in supply will directly meet local gas consumption needs while also helping to keep gas prices relatively low. Given the significant gas supply growth expected over the coming decades – along with policy measures that internalize the costs of GHG emissions and pollution – gas is expected to be relatively cost-competitive with coal.
Regions Power Industry2 Buildings Other3 Total
Non-OECD Asia-Oceania 227 240 84 68 619 (38%)
Middle East 116 77 88 38 318 (20%)
North America 20 27 13 120 180 (11%)
Africa 82 29 39 20 169 (10%)
Latin America 34 42 9 22 107 (7%)
OECD Asia-Oceania -3 36 24 18 75 (5%)
CIS 0 19 16 26 61 (4%)
Europe 34 -4 3 6 39 (2%)
Global Bunkers - - - 50 50 (3%)
Total 510 (32%) 465 (29%) 275 (17%) 368 (23%) 1619
0-25 75-100 100-150 >15025-50
Transportation included
<0 50-75
60 LNG World Shipping 61 IEA 2017 New Policies Scenario62 S&P Platts63 IEA 2017 New Policies Scenario

Achieving the potential of global gas growth2/

Global gas report 2018 24
4. Meeting gas demand forecasts
Requirements and measures to achieve global gas growth
1A. Reducing LNG
costs through the
supply chain
1B.Pricing
environmental
externalities
1C. Development
of local gas
production
2A. Expanding gas
pipeline and storage
infrastructure
2B. More flexible
LNG contracting
2C. Development of
new access-enabling
technologies
3A. Adoption of
local air pollution
policies
3B. Development & deployment
of low carbon technologies
for gas
3C. Addressing the
methane emissions
challenge
I G
GI
I
G
I G
I G I G I G
1. Cost competitiveness
2. Security of supply
3. Sustainability
Gov. action requiredIndustry action required
G
G
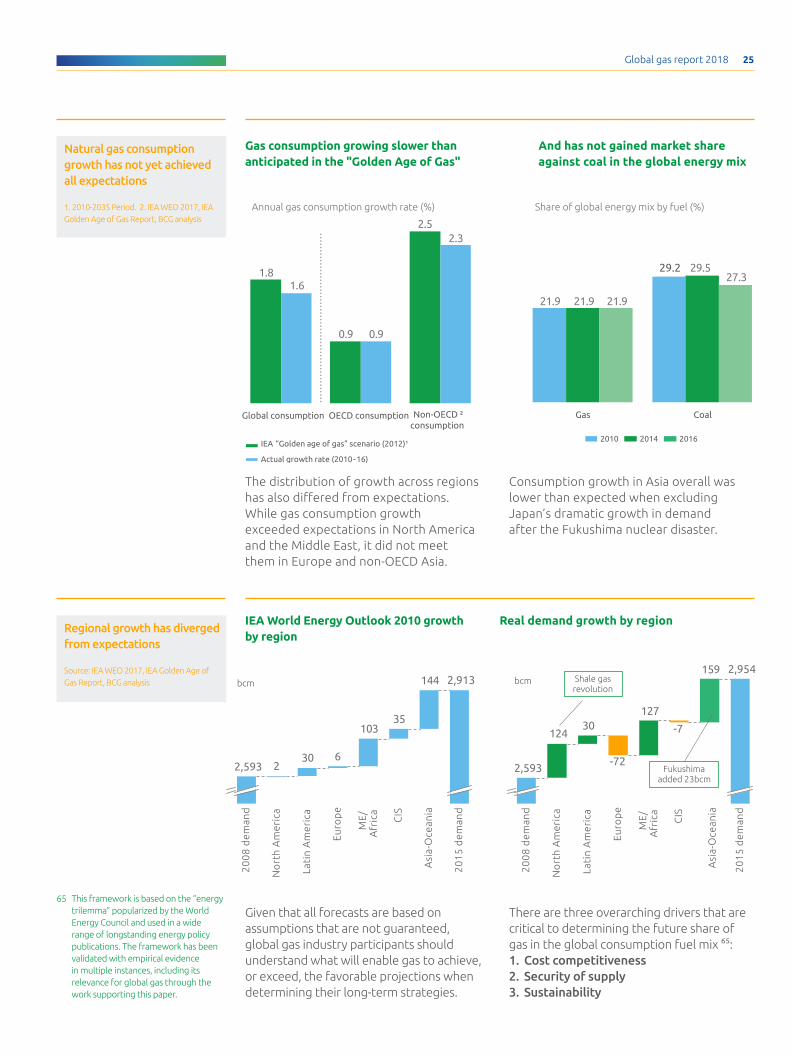
Following the first North American shale gas boom from 2007-2010, many energy market forecasters began to adopt much more aggressive views of future gas supply and demand growth. Among these, the IEA issued the “Golden Age of Gas” scenario in 2011, which made a case for gas potentially overtaking coal in global share as early as 203064.
Looking back, it is clear that global gas consumption growth has not been as even as anticipated. Demand grew slower than anticipated at an average of 1.6%, compared to projected rates of between 1.8% (“Golden Age”) and 2%. Moreover, while the share of gas in the global energy mix remained unchanged at around 22%, the share of coal continues to surpass it at 27%.
64 IEA 2011 World Energy Outlook, “Are we entering a golden age of gas?”
Global gas report 2018 25
The distribution of growth across regions has also differed from expectations. While gas consumption growth exceeded expectations in North America and the Middle East, it did not meet them in Europe and non-OECD Asia.
Given that all forecasts are based on assumptions that are not guaranteed, global gas industry participants should understand what will enable gas to achieve, or exceed, the favorable projections when determining their long-term strategies.
2.5
0.9
1.8
2.3
0.9
1.6
Global consumption OECD consumption Non-OECD ²consumption
Actual growth rate (2010-16)
IEA “Golden age of gas” scenario (2012)¹
21.9
29.5
21.9
27.3
21.9
Coal
29.2
Gas
20162010 2014
Annual gas consumption growth rate (%) Share of global energy mix by fuel (%)
144
35103
6302
20
08
dem
and
2,593
bcm 2,913
20
15
dem
and
ME
/A
fric
a
CIS
Asi
a-O
cean
ia
No
rth
Am
eric
a
Eu
rop
e
Lati
n A
mer
ica
159
12730
124
Asi
a-O
cean
ia
CIS
Lati
n A
mer
ica
-72
20
08
dem
and
2,593
20
15
dem
and
bcm
-7
ME
/A
fric
a
Eu
rop
e
No
rth
Am
eric
a
2,954Shale gas revolution
Fukushima added 23bcm
Natural gas consumption growth has not yet achieved all expectations
1. 2010-2035 Period. 2. IEA WEO 2017, IEA Golden Age of Gas Report, BCG analysis
Regional growth has diverged from expectations
Source: IEA WEO 2017, IEA Golden Age of Gas Report, BCG analysis
Gas consumption growing slower than anticipated in the "Golden Age of Gas"
IEA World Energy Outlook 2010 growth by region
And has not gained market share against coal in the global energy mix
Real demand growth by region
Consumption growth in Asia overall was lower than expected when excluding Japan’s dramatic growth in demand after the Fukushima nuclear disaster.
There are three overarching drivers that are critical to determining the future share of gas in the global consumption fuel mix 65:1. Cost competitiveness 2. Security of supply3. Sustainability
65 This framework is based on the “energy trilemma” popularized by the World Energy Council and used in a wide range of longstanding energy policy publications. The framework has been validated with empirical evidence in multiple instances, including its relevance for global gas through the work supporting this paper.
Global gas report 2018 26
The following section assesses the role of these three drivers across regions and sectors, drawing upon examples of where and how they have impacted gas market growth. In doing so, it identifies a number of future measures to overcoming barriers and answers the question of how the global gas industry can ensure future growth.
1. Cost competitiveness
Cost is a direct driver of market decisions about whether to consume gas and of government policies affecting gas consumption. The impact of a change in the relative cost of gas plays out differently in the short vs. long term, as well as across different economic sectors.
In the short run, fuel switching occurs when consumers have the ability to choose between fuels based on marginal costs. This is often the case for the power sector and some industrial applications where other fuels can be substituted for gas. In buildings or the transport sector, though, such fuel switching is impractical in the short run given the high cost of replacing equipment
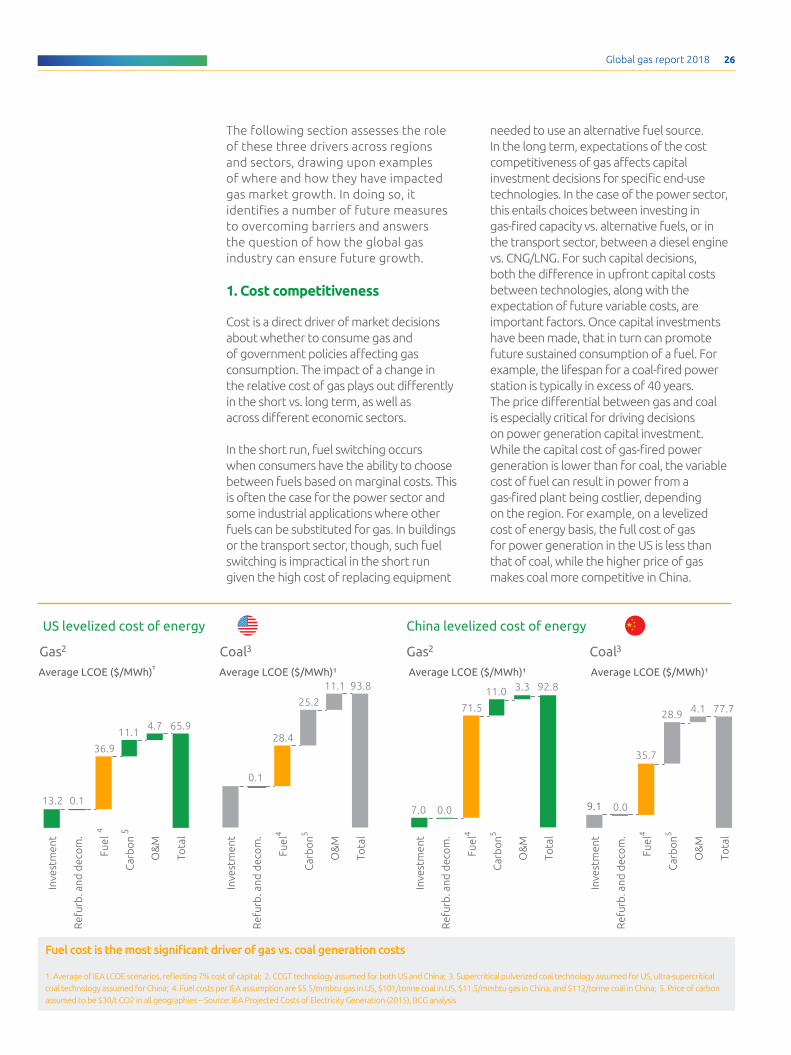
needed to use an alternative fuel source. In the long term, expectations of the cost competitiveness of gas affects capital investment decisions for specific end-use technologies. In the case of the power sector, this entails choices between investing in gas-fired capacity vs. alternative fuels, or in the transport sector, between a diesel engine vs. CNG/LNG. For such capital decisions, both the difference in upfront capital costs between technologies, along with the expectation of future variable costs, are important factors. Once capital investments have been made, that in turn can promote future sustained consumption of a fuel. For example, the lifespan for a coal-fired power station is typically in excess of 40 years.The price differential between gas and coal is especially critical for driving decisions on power generation capital investment. While the capital cost of gas-fired power generation is lower than for coal, the variable cost of fuel can result in power from a gas-fired plant being costlier, depending on the region. For example, on a levelized cost of energy basis, the full cost of gas for power generation in the US is less than that of coal, while the higher price of gas makes coal more competitive in China.
65.94.711.1
36.9
0.113.2
Ref
urb
. and
dec
om
.
Inve
stm
ent
Average LCOE ($/MWh)¹
Tota
l
O&
M
Car
bo
n5
Fuel
4
93.811.1
25.2
28.4
0.1
Average LCOE ($/MWh)¹
Tota
l
O&
M
Car
bo
n5
Fuel
4
Ref
urb
. and
dec
om
.
Inve
stm
ent
Gas2 Coal3
US levelized cost of energy
92.83.311.0
71.5
0.07.0
Average LCOE ($/MWh)¹
Tota
l
O&
M
Car
bo
n5
Fuel
4
Ref
urb
. and
dec
om
.
Inve
stm
ent
77.74.128.9
35.7
0.0
Tota
l
O&
M
Ref
urb
. and
dec
om
.
Inve
stm
ent
9.1
Car
bo
n5
Fuel
4
Average LCOE ($/MWh)¹
Gas2 Coal3
China levelized cost of energy
Fuel cost is the most significant driver of gas vs. coal generation costs
1. Average of IEA LCOE scenarios, reflecting 7% cost of capital; 2. CCGT technology assumed for both US and China; 3. Supercritical pulverized coal technology assumed for US, ultra-supercritical coal technology assumed for China; 4. Fuel costs per IEA assumption are $5.5/mmbtu gas in US, $101/tonne coal in US, $11.5/mmbtu gas in China, and $112/tonne coal in China; 5. Price of carbon assumed to be $30/t CO2 in all geographies – Source: IEA Projected Costs of Electricity Generation (2015), BCG analysis

Global gas report 2018 27
These dual short- and long-term effects also play out differently across regions. In Europe, there is ample spare thermal power generation capacity, thus fuel switching between plants accounts for shifts in gas consumption. In Asia, however, given the rapid growth of power demand, any expected cost differential will affect investment in future sources of power generation capacity. Thus, while coal has gained share in the energy mix vs. gas since 2010 in both Europe and Asia, the implications are different. In Europe, gains by coal represent a temporary shift based on marginal economics that can change with future prices, but in Asia it indicates a longer term, structural shift given the growth of coal is driven by the development of new coal power generation capacity. Thus the growth potential for gas over the long-run in Asia risks being limited by investment being made today in coal-generation capacity.
Expectations of future gas cost competitiveness also affect government energy policies, which then further impact gas availability and cost. In Asia, for example, the perception of LNG as a costly source of gas for power supply has slowed some governments from promoting the development of gas infrastructure. Given that gas faces the
-10%
!5%
15%
10%
0%
-5%
-15%20%10%5%0%-10%-20% -5%
Fra
Egy
Den
Cze
Col
Tai
Chi
Isr
Bul
!Bra!Bol!Belg
!Bel
Ban
!Bah
Aus
!Arg
Alg
Chi
Pak
Can
Oma
Nig
Net
Mex
2010 - 16 Chg. in gas share
2010 -16 Chg. in Coal share
Lib Kuw
Kaz
Jap
!ItaIran
Ire
!Vie
Ido
!Uzb
US
UK
UAE
!Ukr Tkm
Tur
Tun!Tri
Slo
SinSau
Rus
!Ven
!Por
Rom
SwiSpa
Sou
Tha
SyrPer
Phi
!Pol
Ind
Hun
Gre
Qat
North AmericaMiddle East
CIS
Europe
Asia-Oceania
Latin America
Africa
Coal gains share over Gas
Gas gains share over Coal
Coal has gained share vs. gas in some European and Asian countries
1. Countries with over 3 bcm gas demand in 2015 included in analysis
Source: Demand = IEA consumption data (Natural gas balance), Production = CEDIGAZ (CEDIGAZ-Prod.-Cons.-Infra.), Fuel shares = IEA (Consumption by Fuel), BCG analysis
greatest cost competitiveness challenge in Asia and Europe, there are three specific measures that can practically improve the cost competitiveness of gas on a sustained basis:
1A. Reducing LNG costs through the supply chain
To be cost competitive with coal in Asia, purely on the basis of marginal economics, a simple levelized cost of energy analysis suggests that gas imports would need to land at around $4 to $6 per MMBtu – roughly half of the cost today for many LNG contracts66. With new brownfield capacity additions in the US and other low-cost supply becoming available, spot volumes of LNG are now starting to price in this range during summer months. However, such prices are below capital cost recovery for some of the new major global greenfield LNG projects.
Reducing landed LNG costs will therefore depend on multiple innovations. Limiting liquefaction capital costs, in particular, will be essential given the significant cost inflation seen in recent years; capital costs of LNG liquefaction projects have grown from less than $500/t capacity to more than $1,500/t in some projects 67. Reducing these project costs will require a 66 BCG analysis

Global gas report 2018 28
1.5
1.0
2.0
1.0
1.5
Domestic midstream
Total
6.3
Regasification
0.80.5
Shipping
2.0
Liquefaction
2.7
Gathering & Pipeline
0.50.3
Gas supply
4.0
LNG manufacture & shippingCommodity price Landed costTransmission
11.5
combination of technological innovation, greater standardization, competition among suppliers, and lean process improvements in project development.
It will also be critical for the industry to achieve other efficiencies through the LNG supply chain. To start, improving capacity utilization of both liquefaction and regas facilities is a relatively simple measure to fully benefit from capital that has already been invested in LNG infrastructure. For LNG plant operations, further optimization measures can focus on LNG plant process improvements, effectively managing of plant downtime, and de-bottlenecking capacity. In LNG shipping, steps have included the development of a more liquid, traded LNG market which is helping to optimize routes. At the same time, newer and more efficient LNG vessels are helping to reduce charter rates.
1B. Pricing environmental externalities Relative to coal and oil products, gas offers the fundamental advantage of emitting significantly less greenhouse gas emissions and near zero local pollutants such as particulates, sulphur, and nitrogen oxide. However, this advantage only supports the economic case for gas if the externality costs of those emissions are priced or otherwise reflected through policy measures. Carbon pricing is one means of achieving that. To level the market price differential between coal and gas, a carbon price of at least $20/t
Asia delivered LNG – typical cost structure today ($/MMbtu)LNG supply costs to Asia today are >$6/MMbtu
Source: Bloomberg, IEA, BCG analysis
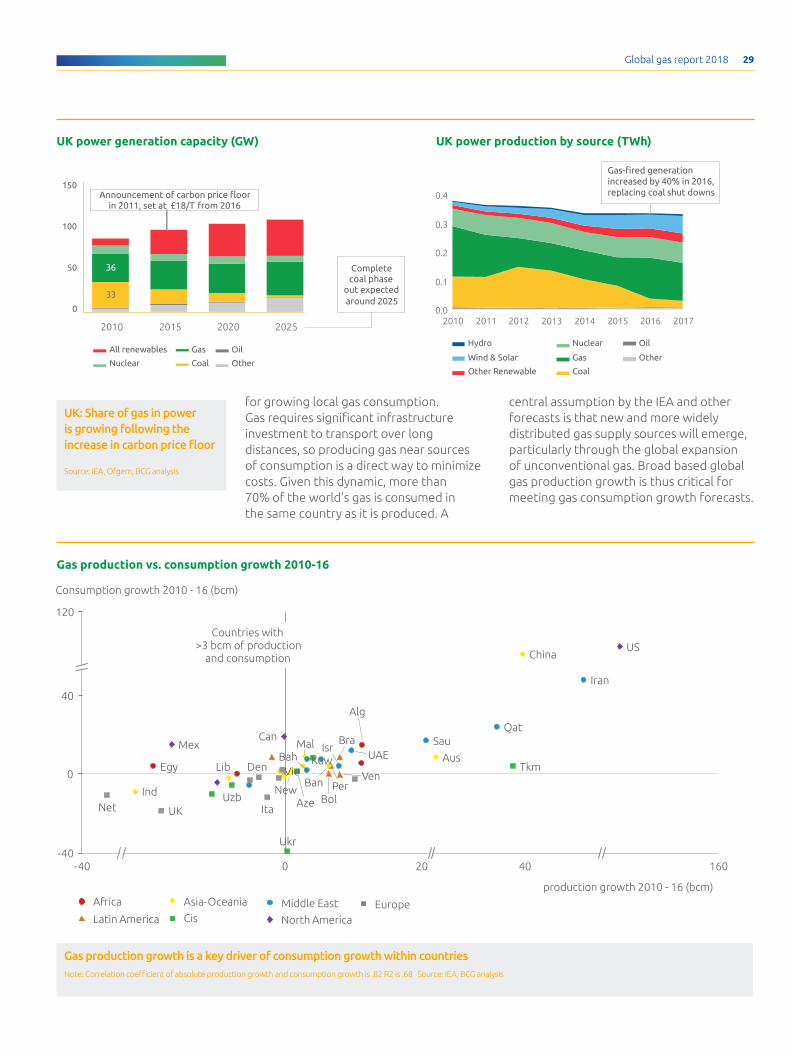
would be necessary in Europe, whereas in Asia that price would need to be $40/t68. The United Kingdom is a recent example of where such a policy was implemented to introduce a stable carbon price, and gas consumption grew significantly as a result. Announced in 2011, and reaffirmed in 2015, the UK government established a carbon price floor of $20/t of CO2. Once implemented fully from 2016, this resulted in gas becoming more cost competitive relative to coal when considering the total levelized cost of energy. In response, the operators of multiple coal-fired plants announced plans to close these plants or shift to gas-fired generation69. This specific policy initiative resulted in gas consumption growth of 12.6% for 2016, replacing reduced coal capacity in the power sector70.
Globally, 42 national governments have now announced or already implemented some form of carbon pricing measures, along with 25 subnational governments. In sum, these policies cover more than 20% of global greenhouse gas emissions. However, the average price of carbon under these policies is less than $10/t and only exceeds $20/t in six of these counties, all of which are in Europe . Thus, while carbon prices are not yet sufficient to drive broad fuel switching, policy mechanisms are beginning to be put in place or will be implemented to do so in the future.
1C. Development of local gas production Domestic gas production is a key lever
68 BCG analysis 69 A contributing factor to this was that
coal plants in the UK are on average older and less efficient than in other countries in Europe
70 Ofgem
+12.6% GAS CONSUMPTION GROWTH IN 2016 DUE TO CARBON PRICE FLOOR
Policy measure impact - UK
Global gas report 2018 29
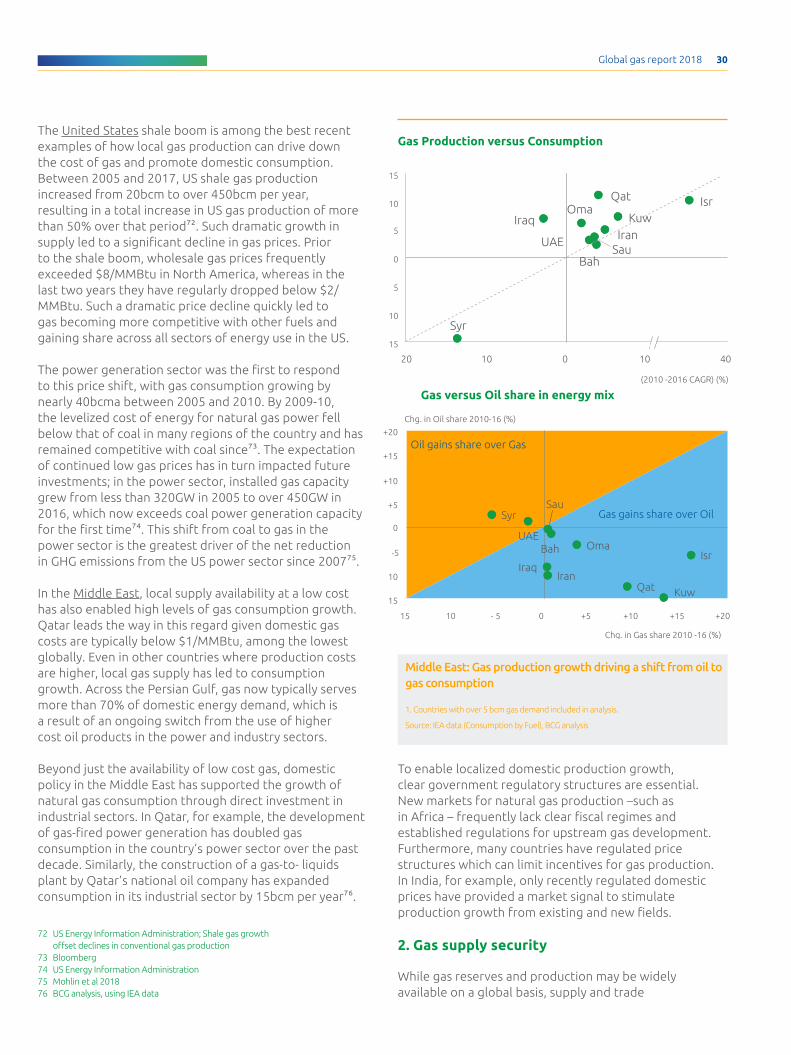
for growing local gas consumption. Gas requires significant infrastructure investment to transport over long distances, so producing gas near sources of consumption is a direct way to minimize costs. Given this dynamic, more than 70% of the world’s gas is consumed in the same country as it is produced. A
UK: Share of gas in power is growing following the increase in carbon price floor
Source: IEA, Ofgem, BCG analysis
36
33
202520202010 2015
Coal
Gas
Nuclear Other
OilAll renewables
0.2
0.3
0.4
0.1
0.020172010 201320122011 201620152014
Wind & Solar
Hydro Nuclear
Other Renewable
Oil
Coal
Gas Other
Announcement of carbon price floor in 2011, set at £18/T from 2016
Complete coal phase
out expected around 2025
Gas-fired generationincreased by 40% in 2016, replacing coal shut downs
100
0
50
150
central assumption by the IEA and other forecasts is that new and more widely distributed gas supply sources will emerge, particularly through the global expansion of unconventional gas. Broad based global gas production growth is thus critical for meeting gas consumption growth forecasts.
UK power generation capacity (GW) UK power production by source (TWh)
40
-4016040200-40
0
120
Vie Ven
Uzb
US
UK
UAETkm
Consumption growth 2010 - 16 (bcm)
production growth 2010 - 16 (bcm)
Ukr
Den
China
Per
QatSau
New
Net
Mex Mal
LibKuw
Isr
Iran
Ind
Egy
Can Bra
Bol
Ban
Bah
Aze
Aus
Alg
Ita
EuropeNorth America
Middle EastCis
Asia-Oceania
Latin America
Africa
Countries with >3 bcm of production
and consumption
Gas production vs. consumption growth 2010-16
Gas production growth is a key driver of consumption growth within countriesNote: Correlation coefficient of absolute production growth and consumption growth is .82 R2 is .68 Source: IEA, BCG analysis
Global gas report 2018 30
The United States shale boom is among the best recent examples of how local gas production can drive down the cost of gas and promote domestic consumption. Between 2005 and 2017, US shale gas production increased from 20bcm to over 450bcm per year, resulting in a total increase in US gas production of more than 50% over that period72. Such dramatic growth in supply led to a significant decline in gas prices. Prior to the shale boom, wholesale gas prices frequently exceeded $8/MMBtu in North America, whereas in the last two years they have regularly dropped below $2/MMBtu. Such a dramatic price decline quickly led to gas becoming more competitive with other fuels and gaining share across all sectors of energy use in the US.
The power generation sector was the first to respond to this price shift, with gas consumption growing by nearly 40bcma between 2005 and 2010. By 2009-10, the levelized cost of energy for natural gas power fell below that of coal in many regions of the country and has remained competitive with coal since73. The expectation of continued low gas prices has in turn impacted future investments; in the power sector, installed gas capacity grew from less than 320GW in 2005 to over 450GW in 2016, which now exceeds coal power generation capacity for the first time74. This shift from coal to gas in the power sector is the greatest driver of the net reduction in GHG emissions from the US power sector since 200775.
In the Middle East, local supply availability at a low cost has also enabled high levels of gas consumption growth. Qatar leads the way in this regard given domestic gas costs are typically below $1/MMBtu, among the lowest globally. Even in other countries where production costs are higher, local gas supply has led to consumption growth. Across the Persian Gulf, gas now typically serves more than 70% of domestic energy demand, which is a result of an ongoing switch from the use of higher cost oil products in the power and industry sectors.
Beyond just the availability of low cost gas, domestic policy in the Middle East has supported the growth of natural gas consumption through direct investment in industrial sectors. In Qatar, for example, the development of gas-fired power generation has doubled gas consumption in the country’s power sector over the past decade. Similarly, the construction of a gas-to- liquids plant by Qatar’s national oil company has expanded consumption in its industrial sector by 15bcm per year76.
72 US Energy Information Administration; Shale gas growth offset declines in conventional gas production
73 Bloomberg74 US Energy Information Administration75 Mohlin et al 201876 BCG analysis, using IEA data
15
+20+15+10+5
+15
+10
+5
0
-5
10
0- 51015
+20
Chg. in Gas share 2010 -16 (%)
Chg. in Oil share 2010-16 (%)
IranIraq
Bah
SyrSau
Qat
Oma
Kuw
Isr
UAE
10
5
15
20
5
10 40
10
010
15
0
Iran
IsrKuw
Bah
Iraq
Qat
Sau
Syr
Oma
UAE
(2010 -2016 CAGR) (%)
Oil gains share over Gas
Gas gains share over Oil
Gas Production versus Consumption
Gas versus Oil share in energy mix
Middle East: Gas production growth driving a shift from oil to gas consumption
1. Countries with over 5 bcm gas demand included in analysis.
Source: IEA data (Consumption by Fuel), BCG analysis
To enable localized domestic production growth, clear government regulatory structures are essential. New markets for natural gas production –such as in Africa – frequently lack clear fiscal regimes and established regulations for upstream gas development. Furthermore, many countries have regulated price structures which can limit incentives for gas production. In India, for example, only recently regulated domestic prices have provided a market signal to stimulate production growth from existing and new fields.
2. Gas supply security
While gas reserves and production may be widely available on a global basis, supply and trade
Global gas report 2018 31
77 GAIL78 Cedigaz
discontinuities combined with geopolitical concerns can limit access to gas in specific markets. In Asia, for example, geopolitical constraints have delayed the proposed TAPI (Turkmenistan-Afghanistan-Pakistan-India) and the Iran-Pakistan-India pipelines for decades, preventing the region from accessing substantial gas reserves from Central Asia. Meanwhile, diversification of supply sources in Europe has been a long-time energy policy goal and availability of LNG and increasing pipeline inter-connections are helping to achieve it today.
On a local level as well, even when gas is produced within a country, a lack of domestic infrastructure can constrain access and consumption. In Asia and Africa, this is a particular challenge given the limited or lack of natural gas networks in most countries. Nigeria has the largest gas reserves and the largest population in Africa, yet without infrastructure, its gas consumption is limited to a small number of power stations and industrial users. Also, there is currently no access to gas for buildings or small-scale industry.
Growing and diversifying gas infrastructure can promote flexible and reliable gas availability while improving supply security. The development and diversification of global LNG trade has played a key role in helping to advance the availability and security of gas supplies, especially with the advent of more flexible contracting and the availability of spot volumes. Meanwhile, the increasing development of small-scale flexible infrastructure, such as FSRUs, is also facilitating more modular and rapid deployment model of gas supply infrastructure.
When stable access to gas is available, that in turn can add greater security for a country’s energy sector overall. Once gas pipelines are built, they are highly resilient to weather or any other supply disruption. In power generation, gas plants have the ability to quickly ramp up and down generation capacity, making them the typical preferred choice for balancing variable grid demand. Thus, as wind and solar capacity are rapidly growing around the world, gas is playing a central
role in many markets for balancing the intermittency of power generation and ensuring electricity security of supply.
Considering what it necessary to promote supply security for gas on national and local level, a focus on three specific measures is critical:
2A. Gas pipeline and storage infrastructure
Sustained investment in domestic gas transmission and distribution networks is essential for continuing to expand access to gas in new cities and across different economic sectors. Europe and North America have developed extensive gas transmission and distribution grids over many decades, enabling access to gas in nearly all cities. In non-OECD markets, the development of gas pipelines will be critical for enabling growth as local gas infrastructure is often lacking. In India, for example, it is projected that domestic transmission capacity will need to increase by over 60% (from 16k km to over 26k km) by 2020 to make gas available to additional cities where gas distribution is planned77.
Gas storage infrastructure is another key component of supply security. In Europe and North America, substantial underground storage capacity is available, equivalent to between 15-25% of total annual gas consumption78. This plays a key role in managing seasonal variability in gas demand, in particular helping to stabilize prices in the winter when demand spikes. Over 90% of global gas storage capacity is concentrated in Europe and North America, making managing gas demand variability a particular challenge in other regions. In China, gas demand is becoming more seasonally variable as consumption grows in the buildings sector and a lack of storage infrastructure is in turn straining pipeline and LNG import capacities at peak periods.
+60% ADDITIONAL GAS TRANSMISSION CAPACITY REQUIRED BY 2020
Infrastructure development in India

Global gas report 2018 32
0 200 2,2002,000
168
Africa
271
41
41
2016 pipeline distance (km ,000)
North America
CIS
69
187Europe
Middle East
Latin America
2,004
0 10050 150
2016 storage (bcm)
Asia-Oceania
Middle East
Africa
Europe
CIS
North America
Latin America
0
16
144
113
7
116
0
89% 94%
Asia-Oceania
Total gas pipeline distance by region Underground storage capacity by region
Gas pipeline and storage infrastructure is concentrated in N. America & Europe
Source: Cedigaz, BCG analysis
Cross-border pipeline connections also play a role in enabling access to secure sources of gas supply. In Mexico for example, access to US gas has helped to transform the domestic energy landscape. Since 2010, pipeline capacity has nearly tripled from 3.6bcf/d to more than 10bcf/d, with a further 4bcf/d capacity under development or planned79. As a result, gas imports from the US have more than quadrupled from 10bcma to nearly 50bcma, helping to offset declining domestic production. This led to a reduction in wholesale prices from more than $8/MMBtu to under $5/MMBtu, and in turn drove an increase in total gas consumption of 10bcma over that period80.
As Mexican gas supply from the US has grown, only the power sector has seen material increases in consumption. Limited transmission capacity is constraining availability of low cost gas for use in buildings and industry and thus constraining new demand81. For example, one-third of Mexico’s population lives in states with no local gas distribution company82. Thus, well planned investments in infrastructure throughout the entire gas value chain will be critical to ensuring security of supply.
2B. Flexible LNG contracting
Growing LNG supply and trade are adding to the stable and secure gas supply around the
world. Countries whose negotiating power was previously constrained by limited supply options are now empowered with access to diverse alternatives that include a variety of LNG and, where applicable, pipeline sources.
A key remaining challenge in the LNG sector though is the rigidity of current LNG contracting and market structures. While the model of developing LNG as a "virtual pipeline" using long-term contracts and oil indexation helped to create market stability and manage risk for sellers and many large buyers, it does not necessarily promote a dynamic or flexible market.
There is a new group of smaller LNG buyers who are beginning to change these norms as they seek to diversify supply or manage variable demand. While LNG markets are beginning to change to reflect this, the change is slow and uneven. Despite the growth of spot traded LNG volumes and shorter contract lengths, the majority of the global LNG trade is still based on long-term contracts and oil index pricing still accounts for more than 70% of all LNG trade83. Plus, outside of Europe and the US, liquid physical or financial trading hubs for gas have yet to emerge.
Looking forward, the emergence of the US as an LNG exporter may help to accelerate the shift to more flexible LNG market structures.
79 US Energy Information Administration 80 International Energy Agency81 Columbia Center for Energy Policy82 INEGI83 IGU
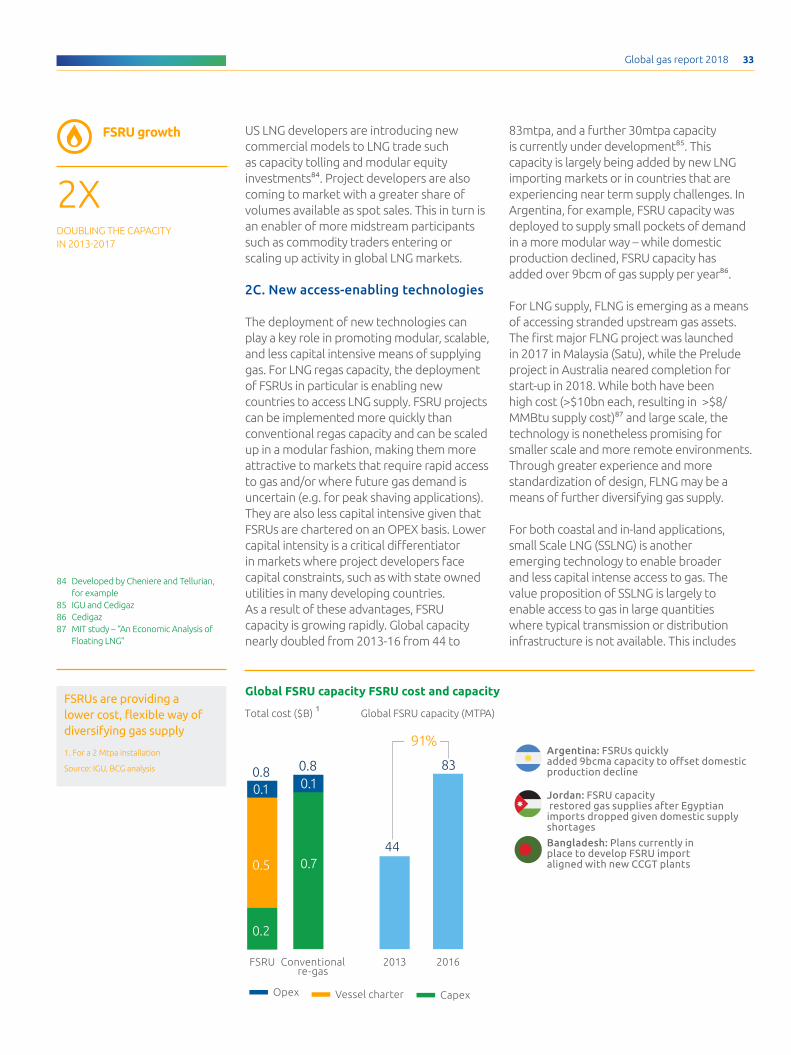
Global gas report 2018 33
US LNG developers are introducing new commercial models to LNG trade such as capacity tolling and modular equity investments84. Project developers are also coming to market with a greater share of volumes available as spot sales. This in turn is an enabler of more midstream participants such as commodity traders entering or scaling up activity in global LNG markets.
2C. New access-enabling technologies
The deployment of new technologies can play a key role in promoting modular, scalable, and less capital intensive means of supplying gas. For LNG regas capacity, the deployment of FSRUs in particular is enabling new countries to access LNG supply. FSRU projects can be implemented more quickly than conventional regas capacity and can be scaled up in a modular fashion, making them more attractive to markets that require rapid access to gas and/or where future gas demand is uncertain (e.g. for peak shaving applications). They are also less capital intensive given that FSRUs are chartered on an OPEX basis. Lower capital intensity is a critical differentiator in markets where project developers face capital constraints, such as with state owned utilities in many developing countries. As a result of these advantages, FSRU capacity is growing rapidly. Global capacity nearly doubled from 2013-16 from 44 to
84 Developed by Cheniere and Tellurian, for example
85 IGU and Cedigaz86 Cedigaz87 MIT study – “An Economic Analysis of
Floating LNG”
83mtpa, and a further 30mtpa capacity is currently under development85. This capacity is largely being added by new LNG importing markets or in countries that are experiencing near term supply challenges. In Argentina, for example, FSRU capacity was deployed to supply small pockets of demand in a more modular way – while domestic production declined, FSRU capacity has added over 9bcm of gas supply per year86.
For LNG supply, FLNG is emerging as a means of accessing stranded upstream gas assets. The first major FLNG project was launched in 2017 in Malaysia (Satu), while the Prelude project in Australia neared completion for start-up in 2018. While both have been high cost (>$10bn each, resulting in >$8/MMBtu supply cost)87 and large scale, the technology is nonetheless promising for smaller scale and more remote environments. Through greater experience and more standardization of design, FLNG may be a means of further diversifying gas supply.
For both coastal and in-land applications, small Scale LNG (SSLNG) is another emerging technology to enable broader and less capital intense access to gas. The value proposition of SSLNG is largely to enable access to gas in large quantities where typical transmission or distribution infrastructure is not available. This includes
Global FSRU capacity FSRU cost and capacity
91%
2013 2016
0.80.1 0.1
0.70.5
0.2
0.8
44
83
FSRU Conventionalre-gas
Argentina: FSRUs quickly added 9bcma capacity to offset domestic production decline
Jordan: FSRU capacity restored gas supplies after Egyptian imports dropped given domestic supply shortages
Bangladesh: Plans currently in place to develop FSRU import aligned with new CCGT plants
CapexOpex Vessel charter
Global FSRU capacity (MTPA)Total cost ($B) FSRUs are providing a lower cost, flexible way of diversifying gas supply
1. For a 2 Mtpa installation
Source: IGU, BCG analysis
2X DOUBLING THE CAPACITY IN 2013-2017
FSRU growth
Global gas report 2018 34
both secondary depots for the distribution of LNG as well as micro-liquefaction plants to manufacture LNG from a point in the gas grid and transport it elsewhere.
In Europe and North America, SSLNG facilities are beginning to be developed to support off-grid uses of gas, such as for small power generators and LNG for transport. China is the largest market for SSLNG to date, estimated to have more than 20mtpa of capacity 88. In China, SSLNG has been developed to enable gas access in regions where the national transmission network has not yet reached, with uses across all sectors. The exact cost structure of SSLNG in China is not completely clear given state-owned control through gas value chains, but if it is cost competitive or can soon become so, SSLNG may have broader applications across developing countries that currently lack gas infrastructure.
3. Sustainability
The environmental benefits of gas are clear and compelling, both for the local environment where gas is consumed and on a global scale. On a local level, gas produces virtually no sulphur dioxide and very low nitrogen dioxide emissions, which are detrimental to health, as well as being precursors to acid rain. Gas also emits almost zero airborne fine particulate matter (PM 2.5), which causes a range of human respiratory health problems and is a major contributor to premature death around the world89. Additionally, gas generates less than half the greenhouse gas (GHG) emissions on a per energy unit basis than coal and one-third fewer emissions than crude oil.
Nonetheless, gas is still a fossil fuel that directly contributes to greenhouse gas emissions, both through the release of CO2 when burned, and when methane is emitted directly. This presents specific sustainability challenges for the gas industry, both in the near- and long-term. In the near term, concerns over methane emissions can undermine the environmental case for gas. This concern has contributed to opposition to gas sector development and has emerged as a basis for specific government regulations across the gas supply chain, largely in North America and Europe. Canada, for instance, has recently introduced a full set of regulations around methane emissions.
In the longer term, the challenge for the gas sector will be to reduce its carbon intensity in line with future policies limiting economy-wide greenhouse gas emissions. Without pathways to reduce the future
carbon intensity of gas, future investments in gas may be hampered by concerns about its viability as the world moves towards more stringent emissions limits.
To capitalize on the environmental benefits of gas while mitigating challenges in the long term, three measures will be critical for the industry:
3A. Adoption of local air pollution policies
Air pollution is considered by the World Health Organization to be “the biggest environmental risk to health” globally. Among the contributions to local air pollution, coal is the worst given it is the least efficiently combusted fuel, followed closely by oil products. This problem is most acute in developing country cities but is present around the world. Even in the US, it is estimated that up to 50,000 people per year die prematurely because of particulates from power plant emissions. By comparison, 40,000 Americans die each year in car crashes90.
When factoring in the full environmental costs of local pollution from coal, the result is a doubling of its costs on a levelized cost of energy basis91. However, those complete costs are rarely reflected in the market economics of fuel costs. In many contexts, a more rapid and effective means of reducing emissions from coal and oil products has been to promote technology and infrastructure to shift demand to gas. In China for example, recent air pollution improvements were achieved through mandates for the direct switching of boilers from coal to gas. Meanwhile in the US, Europe, and cities around the world, the promotion of CNG for buses and trucks has been very successful in reducing diesel generated pollution92.
3B. Low carbon technologies for gas
To strengthen the long-term sustainability of gas in the global energy mix, multiple technologies are being developed with the potential to achieve zero or even negative GHG emissions through gas networks. These include:
• Biomethane: Converting waste products or other renewable feedstock to methane and integrating supply into gas grids.
• Power-to-gas: The use of surplus renewable generation capacity to develop synthetic fuels – such as hydrogen – to balance intermittency.
• Carbon capture and storage (CCS): The post combustion capture of CO2 from gas, combined with permanent underground storage.
The success of any or all of these technologies would have a significant impact on reducing the carbon intensity of gas, thereby securing a role in the energy mix despite whatever
89 IGU90 WHO91 Caiazzo et al, “Air pollution and early deaths in the United
States”, Atmospheric Environment, 201392 University of Texas, Austin – Full Cost of Electricity initiative
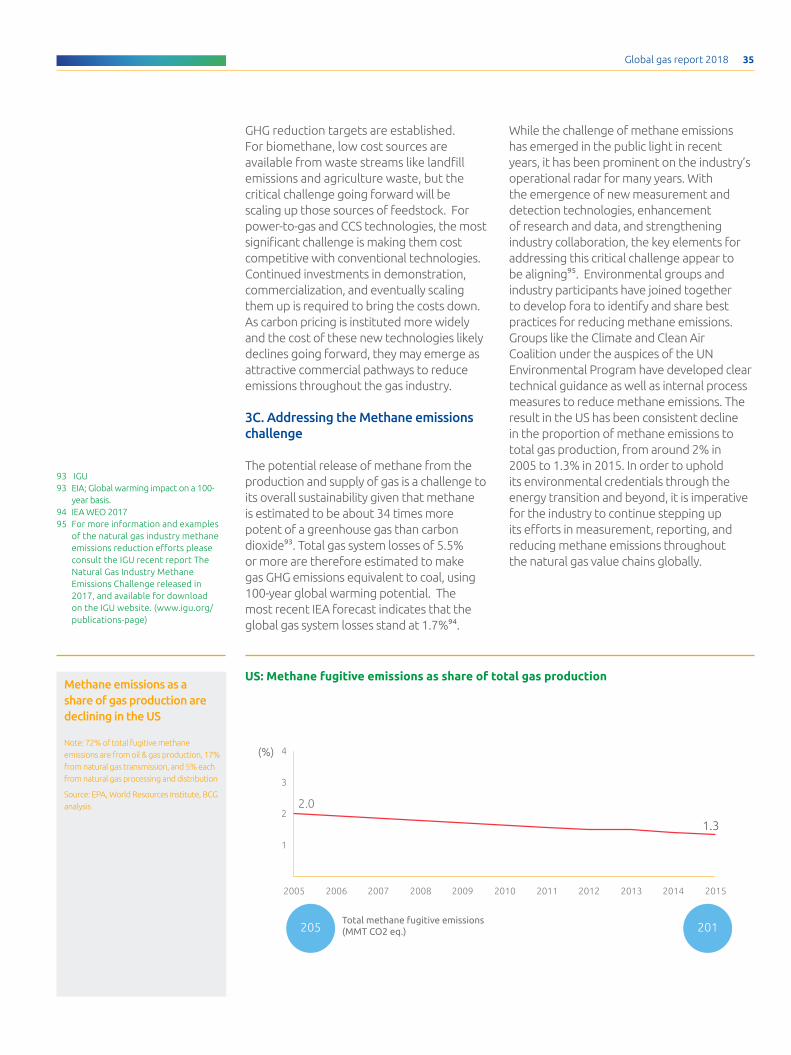
Global gas report 2018 35
GHG reduction targets are established. For biomethane, low cost sources are available from waste streams like landfill emissions and agriculture waste, but the critical challenge going forward will be scaling up those sources of feedstock. For power-to-gas and CCS technologies, the most significant challenge is making them cost competitive with conventional technologies. Continued investments in demonstration, commercialization, and eventually scaling them up is required to bring the costs down. As carbon pricing is instituted more widely and the cost of these new technologies likely declines going forward, they may emerge as attractive commercial pathways to reduce emissions throughout the gas industry.
3C. Addressing the Methane emissions challenge
The potential release of methane from the production and supply of gas is a challenge to its overall sustainability given that methane is estimated to be about 34 times more potent of a greenhouse gas than carbon dioxide93. Total gas system losses of 5.5% or more are therefore estimated to make gas GHG emissions equivalent to coal, using 100-year global warming potential. The most recent IEA forecast indicates that the global gas system losses stand at 1.7%94.
While the challenge of methane emissions has emerged in the public light in recent years, it has been prominent on the industry’s operational radar for many years. With the emergence of new measurement and detection technologies, enhancement of research and data, and strengthening industry collaboration, the key elements for addressing this critical challenge appear to be aligning95. Environmental groups and industry participants have joined together to develop fora to identify and share best practices for reducing methane emissions. Groups like the Climate and Clean Air Coalition under the auspices of the UN Environmental Program have developed clear technical guidance as well as internal process measures to reduce methane emissions. The result in the US has been consistent decline in the proportion of methane emissions to total gas production, from around 2% in 2005 to 1.3% in 2015. In order to uphold its environmental credentials through the energy transition and beyond, it is imperative for the industry to continue stepping up its efforts in measurement, reporting, and reducing methane emissions throughout the natural gas value chains globally.
93 IGU 93 EIA; Global warming impact on a 100-
year basis. 94 IEA WEO 201795 For more information and examples
of the natural gas industry methane emissions reduction efforts please consult the IGU recent report The Natural Gas Industry Methane Emissions Challenge released in 2017, and available for download on the IGU website. (www.igu.org/publications-page)
Methane emissions as a share of gas production are declining in the US
Note: 72% of total fugitive methane emissions are from oil & gas production, 17% from natural gas transmission, and 5% each from natural gas processing and distribution
Source: EPA, World Resources Institute, BCG analysis 2.0
205 201
1
2
3
4
2005 2006 2007 2008 2009 2010 2011 2012 2013 2014 2015
(%)
1.3
Total methane fugitive emissions (MMT CO2 eq.)
US: Methane fugitive emissions as share of total gas production

Global gas report 2018 36
NEW TECHNOLOGIES TO IMPROVE THE SUSTAINABILITY OF GAS
Biogas and Biomethane
Biomethane is a potentially efficient path to decarbonising the power sector as it is programmable and storable, and can exploit existing transport, storage and power generation infrastructure.
Biomethane reduces CO2 emissions to neutrality or potentially even reaches negative emissions because it utilizes feedstock that would have otherwise released methane into the atmosphere, and its use is compatible with CCS (see below). The V UNFCCC Report on ClimateChange has emphasized the potential role that the capture of biogenic CO2 could have in the long run as a carbon negative measure (BECCS - Bioenergy with carbon capture and storage).
Biogas is produced via the biological breakdown of organic material (including urban and agricultural waste and animal biomass). This can then be upgraded to biomethane by removing CO2 through a number of methods. The resulting fuel is almost identical to fossil-derived natural gas and can be used interchangeably. Biomethane is still at an early stage of development, although biogas plants have seen strong growth in Europe, driven by favourable policy environments in Italy, Sweden and Germany. Early estimates for its potential availability, using assumptions coherent with the protection of the food supply chain range, suggest the technology could have a material impact on supply dynamics. For example, in Italy the potential production of biomethane is up to 8bcma by 2030.
The cost structure of biomethane is currently not competitive with fossil-derived natural gas, but may be competitive with solar and wind renewables when considering the cost of intermittency/storagei. Potential avenues for cost reduction of biomethane production include the introduction of substainable cover crops feedstock, the increasing production from by-products and sewage, the standardization of anaerobic digestion plants and the development of new technologies for small size upgrading plantsii.
Power to gas
This technology envisages using synthetic gas to store excess electricity production from intermittent renewable sources such as wind and solar.
The process involves the use of electricity surpluses to split water into hydrogen and oxygen. Hydrogen can then be combined with carbon dioxide to convert the two gases to methane. The methane may then be fed into the natural gas grid and storage facilities.
Power-to-gas may be integrated in the process to upgrade biogas into biomethane, which results in surplus CO2 which can be mixed with the hydrogen produced through electrolysis.
Carbon Capture and Storage Carbon capture and storage (CCS) has long been considered a potential solution to emissions from all fossil fuels. The technology is relatively simple in concept, entailing the capture of greenhouse gas emissions from a point source and long term storage in underground reservoirs
However, the applied demonstration of the technology has been slow and difficult to achieve on a material scale. Currently there are 15 operational projects globally processing 30MnT/CO2 per year, but this is a small portion of the potential that would be required for material mitigation impact.
Ultimately cost would need to come down by about half to make this technology competitive; whereas costs are presently $60-70/t of CO2 for CCS, they would need to be in the order of $20-30/t to be competitive with other abatement approaches.
There are also some constraints with the availability of storage structures and the fact that offshore locations are more socially acceptable.
i http://www.neon-energie.de/Hirth-Ueckerdt-Edenhofer-2015-Integration-Costs-Revisited-Framework-Wind-Solar-Variability.pdf
ii https://www.consorziobiogas.it/wp-content/uploads/2017/05/LA-BIOGAS-REFINERY-ENG-2017-FINAL.pdf
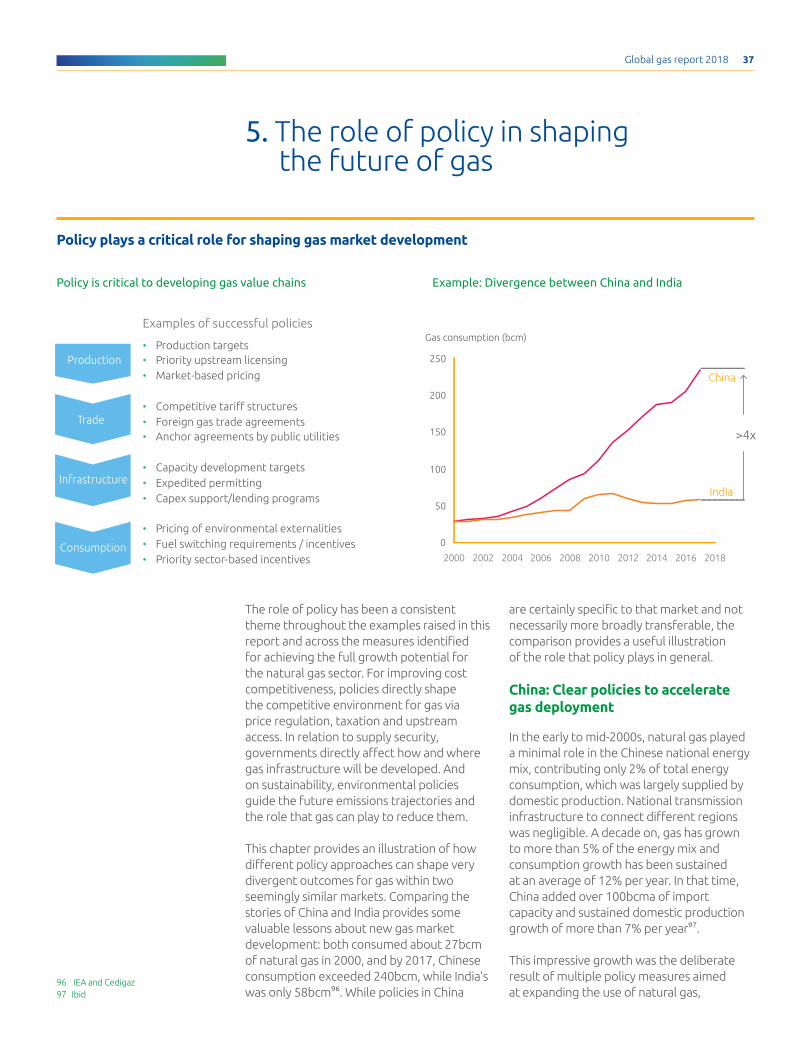
Global gas report 2018 37
5. The role of policy in shaping the future of gas
Trade
Production
Infrastructure
Consumption
• Production targets• Priority upstream licensing•
•
Market-based pricing
Competitive tariff structures• Foreign gas trade agreements• Anchor agreements by public utilities
• Capacity development targets• Expedited permitting• Capex support/lending programs
• Pricing of environmental externalities• Fuel switching requirements / incentives• Priority sector-based incentives
Examples of successful policies
2000 2002 2004 2006 2008 2010 2012 2014 2016 2018
250
0
150
200
100
50
>4x
India
Gas consumption (bcm)
China
The role of policy has been a consistent theme throughout the examples raised in this report and across the measures identified for achieving the full growth potential for the natural gas sector. For improving cost competitiveness, policies directly shape the competitive environment for gas via price regulation, taxation and upstream access. In relation to supply security, governments directly affect how and where gas infrastructure will be developed. And on sustainability, environmental policies guide the future emissions trajectories and the role that gas can play to reduce them.
This chapter provides an illustration of how different policy approaches can shape very divergent outcomes for gas within two seemingly similar markets. Comparing the stories of China and India provides some valuable lessons about new gas market development: both consumed about 27bcm of natural gas in 2000, and by 2017, Chinese consumption exceeded 240bcm, while India’s was only 58bcm96. While policies in China
Policy plays a critical role for shaping gas market development
Policy is critical to developing gas value chains Example: Divergence between China and India
are certainly specific to that market and not necessarily more broadly transferable, the comparison provides a useful illustration of the role that policy plays in general. China: Clear policies to accelerate gas deployment
In the early to mid-2000s, natural gas played a minimal role in the Chinese national energy mix, contributing only 2% of total energy consumption, which was largely supplied by domestic production. National transmission infrastructure to connect different regions was negligible. A decade on, gas has grown to more than 5% of the energy mix and consumption growth has been sustained at an average of 12% per year. In that time, China added over 100bcma of import capacity and sustained domestic production growth of more than 7% per year97.
This impressive growth was the deliberate result of multiple policy measures aimed at expanding the use of natural gas,
96 IEA and Cedigaz97 Ibid

Global gas report 2018 38
223 163 117
lb Co2 / MMBtu
Coal Oil Natural Gas
Coal Oil Natural Gas
lb Co2 / MMBtu
Burning 1 unit of
lb Co2 / MMBtu
Carbon content for different fossil fuelsNatural gas with the lowest carbon per energy content of all fossil fuels.Of the three fossil fuels (coal, oil, and naturals gas)• Coal has the highest
carbon intensity.• Natural gas has the lowest
carbon intensity. Note: Carbon intensity of fuel is the amount of carbon dioxide (CO2) emitted for each unit of energy produced.Coal's CO2 emissions figure is an average of Anthracite, Bituminous, Subbituminous, Lignite, and Coke. OIl CO2 emissions figure is an average of Propane, Butane, Home Heating and Diesel Fuel, Kerosene, Gasoline, Residual Heating Fuel, Jet Fuel, Aviation Gas, and Petroleum coke.
Source: EIA.
primarily to reduce urban air pollution. Specifically, the Chinese government has set the goal that gas should be 10% of the domestic energy mix by 2020.
To spur growth, the Chinese government first focused on establishing supply availability and security, through both domestic production and imports. To achieve domestic production growth, the Chinese government prioritized specific regions and utilized its state-owned oil and gas companies to develop the sector, while also more recently opening the sector to investment from international oil companies.
In order to expand imports, China has recently struck supply deals and developed pipelines with Myanmar, Russia, and Turkmenistan, which have added over 40 bcma of supply capacity to date with a further 40 bcma under development. China has also increased LNG import capacity by around 70 bcma since 2010, with a further 20 bcma planned through 2020. The development of the LNG import capacity has coincided with significantly greater supply availability as Qatar and Australia quickly have become China's largest suppliers98.
Meanwhile, the Chinese government has
adopted a broad set of policies designed to improve the cost competitiveness of gas and otherwise to spur consumption growth. The government provides preferred access for natural gas on a cost-plus pricing basis to urban gas networks, which in turn supply residential and commercial customers as well as the transport sector. For gas-powered vehicles, the price of natural gas is set relative to diesel specifically in order to incentivize adoption99.
In other sectors where it is difficult to ensure cost competitiveness through policy, the Chinese government is implementing complementary measures to increase gas adoption. In the buildings and residential sectors, for example, targets are set on a national level for conversion of coal boilers to gas, then are translated to local targets, which in turn are used to directly mandate fuel switching among industrial and metropolitan users (e.g. for district heating). In the power sector, the latest five-year plan directly mandated the development of 44GW of additional gas generation capacity through state-owned enterprises.
Underpinning the Chinese government support for gas sector development has been a general emphasis on the role of gas
98 Cedigaz99 University of Texas Energy Institute
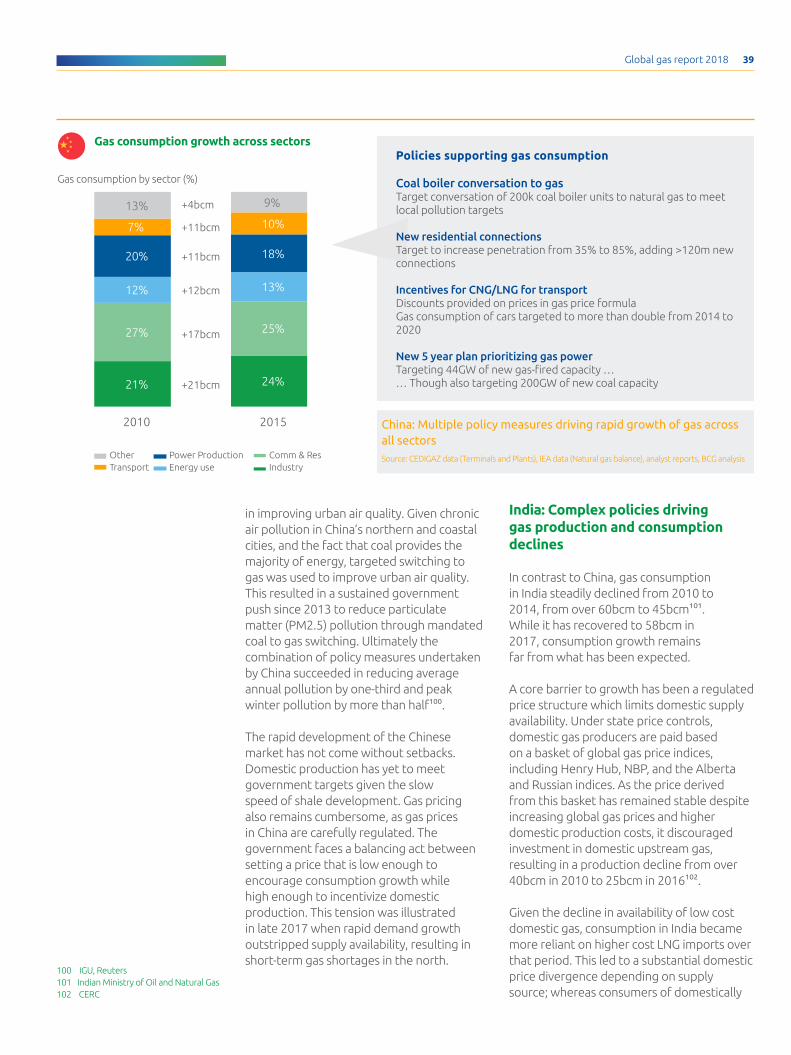
Global gas report 2018 39
in improving urban air quality. Given chronic air pollution in China’s northern and coastal cities, and the fact that coal provides the majority of energy, targeted switching to gas was used to improve urban air quality. This resulted in a sustained government push since 2013 to reduce particulate matter (PM2.5) pollution through mandated coal to gas switching. Ultimately the combination of policy measures undertaken by China succeeded in reducing average annual pollution by one-third and peak winter pollution by more than half100.
The rapid development of the Chinese market has not come without setbacks. Domestic production has yet to meet government targets given the slow speed of shale development. Gas pricing also remains cumbersome, as gas prices in China are carefully regulated. The government faces a balancing act between setting a price that is low enough to encourage consumption growth while high enough to incentivize domestic production. This tension was illustrated in late 2017 when rapid demand growth outstripped supply availability, resulting in short-term gas shortages in the north.
100 IGU, Reuters101 Indian Ministry of Oil and Natural Gas102 CERC
Policies supporting gas consumption
Coal boiler conversation to gasTarget conversation of 200k coal boiler units to natural gas to meet local pollution targets
New residential connectionsTarget to increase penetration from 35% to 85%, adding >120m new connections
Incentives for CNG/LNG for transportDiscounts provided on prices in gas price formulaGas consumption of cars targeted to more than double from 2014 to 2020
New 5 year plan prioritizing gas powerTargeting 44GW of new gas-fired capacity …… Though also targeting 200GW of new coal capacity
Gas consumption growth across sectors
Gas consumption by sector (%)
21% 24%
27% 25%
12% 13%
20% 18%
10%7%
9%13%
2010 2015
Comm & ResEnergy usePower Production
TransportOther
Industry
+21bcm
+17bcm
+12bcm
+11bcm
+11bcm
+4bcm
India: Complex policies driving gas production and consumption declines
In contrast to China, gas consumption in India steadily declined from 2010 to 2014, from over 60bcm to 45bcm101. While it has recovered to 58bcm in 2017, consumption growth remains far from what has been expected.
A core barrier to growth has been a regulated price structure which limits domestic supply availability. Under state price controls, domestic gas producers are paid based on a basket of global gas price indices, including Henry Hub, NBP, and the Alberta and Russian indices. As the price derived from this basket has remained stable despite increasing global gas prices and higher domestic production costs, it discouraged investment in domestic upstream gas, resulting in a production decline from over 40bcm in 2010 to 25bcm in 2016102.
Given the decline in availability of low cost domestic gas, consumption in India became more reliant on higher cost LNG imports over that period. This led to a substantial domestic price divergence depending on supply source; whereas consumers of domestically
China: Multiple policy measures driving rapid growth of gas across all sectors Source: CEDIGAZ data (Terminals and Plants), IEA data (Natural gas balance), analyst reports, BCG analysis
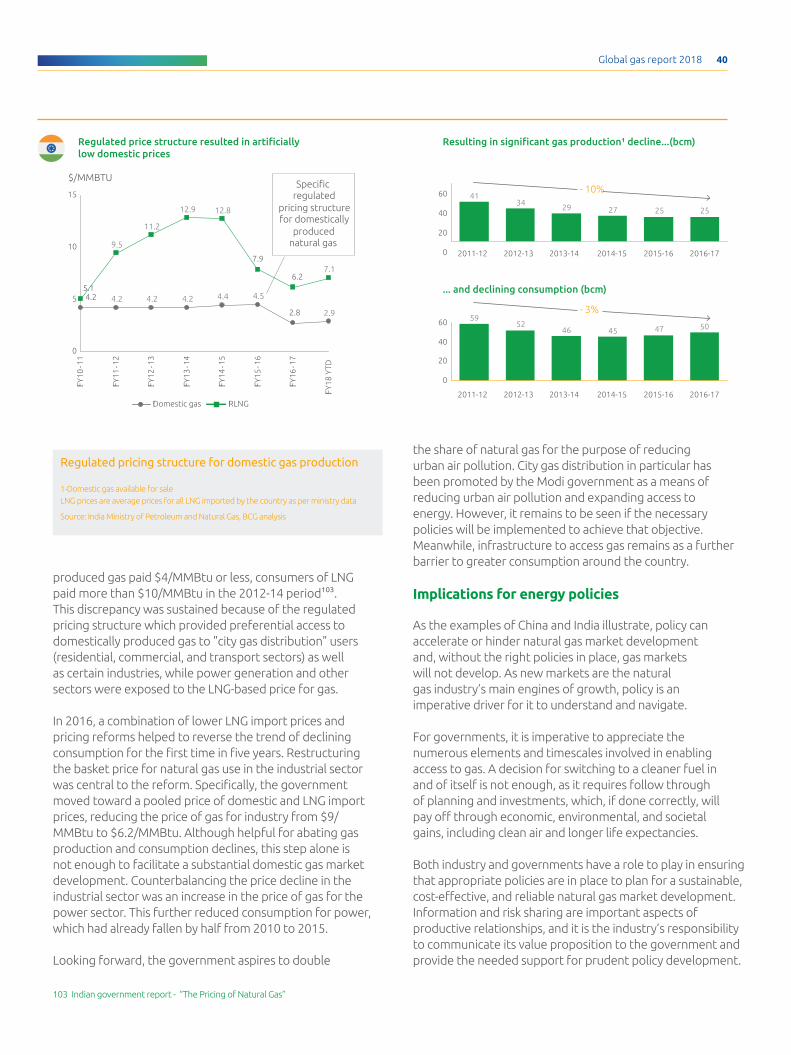
Global gas report 2018 40
produced gas paid $4/MMBtu or less, consumers of LNG paid more than $10/MMBtu in the 2012-14 period103. This discrepancy was sustained because of the regulated pricing structure which provided preferential access to domestically produced gas to "city gas distribution" users (residential, commercial, and transport sectors) as well as certain industries, while power generation and other sectors were exposed to the LNG-based price for gas.
In 2016, a combination of lower LNG import prices and pricing reforms helped to reverse the trend of declining consumption for the first time in five years. Restructuring the basket price for natural gas use in the industrial sector was central to the reform. Specifically, the government moved toward a pooled price of domestic and LNG import prices, reducing the price of gas for industry from $9/MMBtu to $6.2/MMBtu. Although helpful for abating gas production and consumption declines, this step alone is not enough to facilitate a substantial domestic gas market development. Counterbalancing the price decline in the industrial sector was an increase in the price of gas for the power sector. This further reduced consumption for power, which had already fallen by half from 2010 to 2015.
Looking forward, the government aspires to double
103 Indian government report - “The Pricing of Natural Gas”
2.9
4.54.44.24.24.2
7.1
12.812.9
11.2
9.5
5
0
10
15
$/MMBTU
!FY18
YTD
!FY16
-17
6.2
2.8
!FY15
-16
7.9
!FY14
-15
!FY13
-14
!FY12
-13
!FY11
-12
!FY10
-11
5.14.2
!RLNG!Domestic gas
2525272934
4160
40
20
0 2011-12 2012-13 2013-14 2014-15 2015-16 2016-17
2011-12 2012-13 2013-14 2014-15 2015-16 2016-17
5047454652
5960
40
20
0
- 3%
Specific regulated
pricing structure for domestically
produced natural gas
- 10%
... and declining consumption (bcm)
Resulting in significant gas production¹ decline...(bcm) Regulated price structure resulted in artificially low domestic prices
Regulated pricing structure for domestic gas production
1-Domestic gas available for saleLNG prices are average prices for all LNG imported by the country as per ministry data
Source: India Ministry of Petroleum and Natural Gas, BCG analysis
the share of natural gas for the purpose of reducing urban air pollution. City gas distribution in particular has been promoted by the Modi government as a means of reducing urban air pollution and expanding access to energy. However, it remains to be seen if the necessary policies will be implemented to achieve that objective. Meanwhile, infrastructure to access gas remains as a further barrier to greater consumption around the country.
Implications for energy policies
As the examples of China and India illustrate, policy can accelerate or hinder natural gas market development and, without the right policies in place, gas markets will not develop. As new markets are the natural gas industry’s main engines of growth, policy is an imperative driver for it to understand and navigate.
For governments, it is imperative to appreciate the numerous elements and timescales involved in enabling access to gas. A decision for switching to a cleaner fuel in and of itself is not enough, as it requires follow through of planning and investments, which, if done correctly, will pay off through economic, environmental, and societal gains, including clean air and longer life expectancies.
Both industry and governments have a role to play in ensuring that appropriate policies are in place to plan for a sustainable, cost-effective, and reliable natural gas market development. Information and risk sharing are important aspects of productive relationships, and it is the industry’s responsibility to communicate its value proposition to the government and provide the needed support for prudent policy development.

Global gas report 2018 41
Conclusion: Priorities for achieving gas growth
Required measures to achieve gas growth expectations
Regions 1. Cost competitiveness 2. Security of supply 3. Sustainability
AfricaImproving competitiveness vs. coal in some countries
Supply infrastructure critical for expanding gas access
Low emissions from
gas can improve carbon
intensity of the systemAsia
Improving competitiveness vs. coal across the region
Supply infrastructure critical for expanding gas access
Latin AmericaImproving competitiveness vs. coal
in some countriesSupply infrastructure critical for
expanding gas access
Middle East Local production ensures low cost and security of supply
EuropeEnsuring sustained competitiveness vs. coal and renewables
Diversified supply key for managing geopolitical concerns
Low carbon applications needed for long term carbon targets
North America Low cost from domestic shale gas
Expanding infrastructure to access
gas for transport
Low carbon applications
needed for long term
carbon targets
Critical for achieving gas growth High priority for gas growth Low/ Medium priority for gas gowth
The future of gas appears to be bright. Future forecasts and recent trends in global gas both indicate a strong growth trajectory for gas continuing over the coming decades.
However, implementing the specific drivers of gas consumption growth laid out in this report will be essential to realizing this future. Recent global gas trends indicate that challenges to continued growth may emerge based on the cost competitiveness of gas, achieving widespread secure access to gas, and ensuring its role in enabling sustainability over the long run. Thus, securing the future role of gas in the global energy mix will require further steps to address these challenges.
When considering where the greatest projected growth of gas consumption is expected to occur in the coming decades, the need for the specific levers of cost competitiveness, security of supply, and sustainability stand out in differentiated ways. Priority measures critical in the coming years will include:
• Non-OECD Asia – power and industry sectors: The key challenge is improving the cost competitiveness of gas, particularly by reducing costs through LNG supply chains, leveling the playing field of gas against coal on the basis of environmental externalities, and stimulating greater gas production within high growth potential markets.
Global gas report 2018 42
Gas prices in Asia are among the highest globally, which will continue to present a challenge to consumption growth unless the underlying cost structure and relative pricing to coal is addressed.
• Non-OECD Asia & Africa – all sectors: Promoting secure access to gas will be critical through the development of gas infrastructure, such as LNG regas capacity, transmission networks, and local distribution. Deploying flexible and low capital technologies such as FSRUs or SSLNG will be key to rapidly scaling up this infrastructure.
• North America transport sector & Global bunker fuel: Extending secure access to gas will require the deployment of new technologies and infrastructure to ensure gas is available as a fueling option and that consumers have access to relevant CNG/LNG engine technologies.
• OECD markets – all sectors: Using gas to enable sustainability goals will be key to sustaining gas growth. This will require technological innovation to develop cost effective means of reducing GHG emissions from gas throughout supply chains in both the near and long term.
Implementing these measures will enable gas to overcome potential barriers to growth, but will require concerted actions from many different kinds of stakeholders. Among gas industry participants, it will require innovation of business models and technologies. From governments, it will require the implementation of effective policy measures. From investors and financial institutions, it will require substantial capital investment. Finally, across all stakeholder groups, it will require active engagement and collaboration.

Special Feature3/
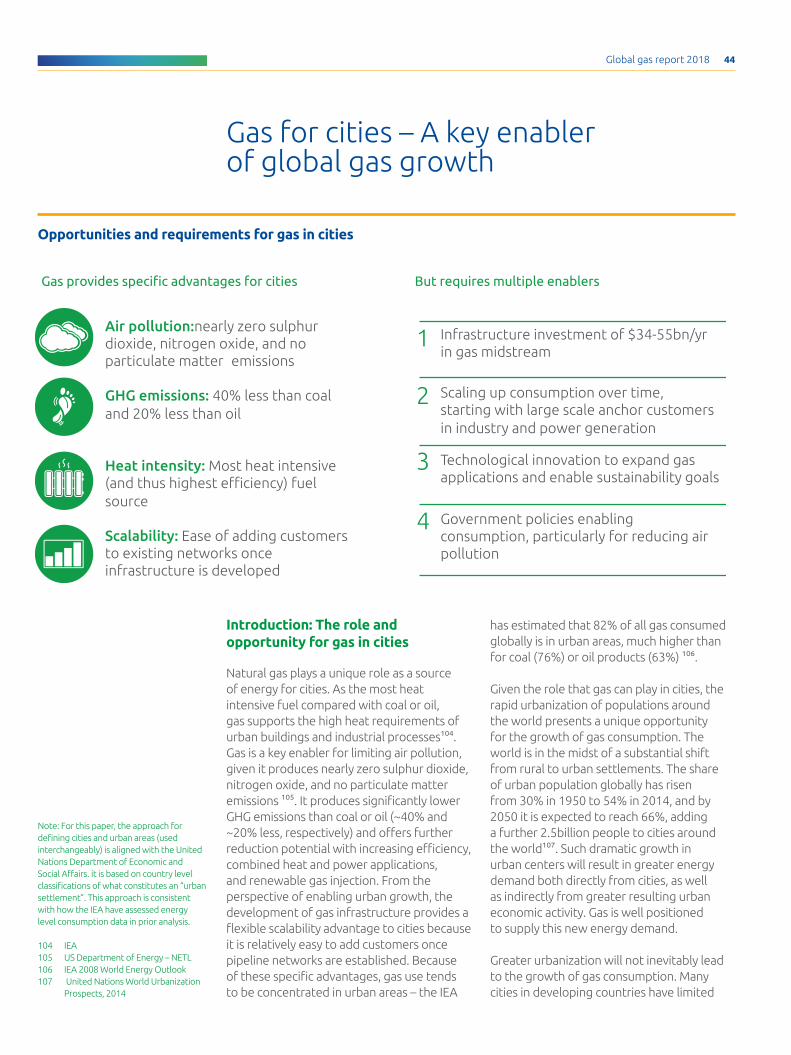
Global gas report 2018 44
Gas for cities – A key enabler of global gas growth
Infrastructure investment of $34-55bn/yrin gas midstream
Scaling up consumption over time, starting with large scale anchor customers in industry and power generation
Technological innovation to expand gas applications and enable sustainability goals
Government policies enabling consumption, particularly for reducing air pollution
1
2
3
4
Air pollution:nearly zero sulphur dioxide, nitrogen oxide, and no particulate matter emissions
GHG emissions: 40% less than coal and 20% less than oil
Heat intensity: Most heat intensive (and thus highest efficiency) fuel source
Scalability: Ease of adding customers to existing networks once infrastructure is developed
Gas provides specific advantages for cities But requires multiple enablers
Opportunities and requirements for gas in cities
Introduction: The role and opportunity for gas in cities
Natural gas plays a unique role as a source of energy for cities. As the most heat intensive fuel compared with coal or oil, gas supports the high heat requirements of urban buildings and industrial processes104. Gas is a key enabler for limiting air pollution, given it produces nearly zero sulphur dioxide, nitrogen oxide, and no particulate matter emissions 105. It produces significantly lower GHG emissions than coal or oil (~40% and ~20% less, respectively) and offers further reduction potential with increasing efficiency, combined heat and power applications, and renewable gas injection. From the perspective of enabling urban growth, the development of gas infrastructure provides a flexible scalability advantage to cities because it is relatively easy to add customers once pipeline networks are established. Because of these specific advantages, gas use tends to be concentrated in urban areas – the IEA
has estimated that 82% of all gas consumed globally is in urban areas, much higher than for coal (76%) or oil products (63%) 106.
Given the role that gas can play in cities, the rapid urbanization of populations around the world presents a unique opportunity for the growth of gas consumption. The world is in the midst of a substantial shift from rural to urban settlements. The share of urban population globally has risen from 30% in 1950 to 54% in 2014, and by 2050 it is expected to reach 66%, adding a further 2.5billion people to cities around the world107. Such dramatic growth in urban centers will result in greater energy demand both directly from cities, as well as indirectly from greater resulting urban economic activity. Gas is well positioned to supply this new energy demand.
Greater urbanization will not inevitably lead to the growth of gas consumption. Many cities in developing countries have limited
Note: For this paper, the approach for defining cities and urban areas (used interchangeably) is aligned with the United Nations Department of Economic and Social Affairs. it is based on country level classifications of what constitutes an “urban settlement”. This approach is consistent with how the IEA have assessed energy level consumption data in prior analysis.
104 IEA 105 US Department of Energy – NETL106 IEA 2008 World Energy Outlook107 United Nations World Urbanization
Prospects, 2014
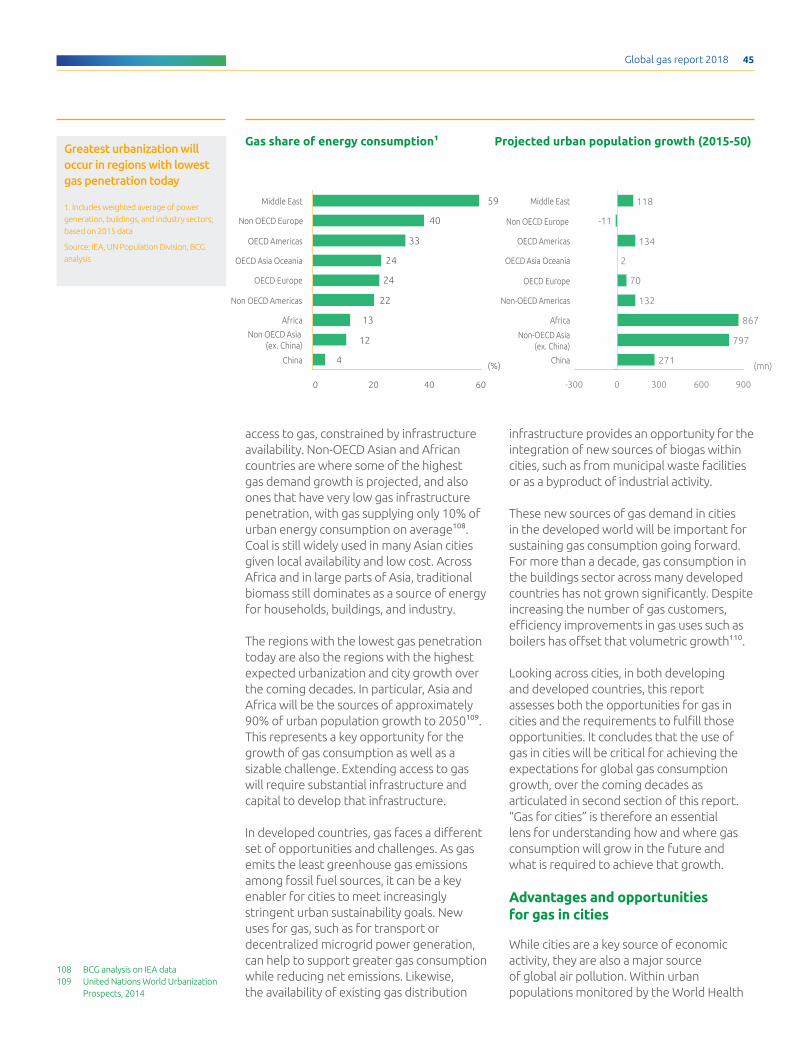
Global gas report 2018 45
access to gas, constrained by infrastructure availability. Non-OECD Asian and African countries are where some of the highest gas demand growth is projected, and also ones that have very low gas infrastructure penetration, with gas supplying only 10% of urban energy consumption on average108. Coal is still widely used in many Asian cities given local availability and low cost. Across Africa and in large parts of Asia, traditional biomass still dominates as a source of energy for households, buildings, and industry.
The regions with the lowest gas penetration today are also the regions with the highest expected urbanization and city growth over the coming decades. In particular, Asia and Africa will be the sources of approximately 90% of urban population growth to 2050109. This represents a key opportunity for the growth of gas consumption as well as a sizable challenge. Extending access to gas will require substantial infrastructure and capital to develop that infrastructure.
In developed countries, gas faces a different set of opportunities and challenges. As gas emits the least greenhouse gas emissions among fossil fuel sources, it can be a key enabler for cities to meet increasingly stringent urban sustainability goals. New uses for gas, such as for transport or decentralized microgrid power generation, can help to support greater gas consumption while reducing net emissions. Likewise, the availability of existing gas distribution
108 BCG analysis on IEA data109 United Nations World Urbanization
Prospects, 2014
60400 20
22
40
59
OECD Asia Oceania
4
12
13
33
24
24
China
OECD Europe
(%)
OECD Americas
Non OECD Europe
Middle East
Non OECD Americas
Africa
Non OECD Asia(ex. China)
271
797
867
132
70
2
134
-11
118
-300 0 300 600 900
OECD Europe
Non-OECD Americas
Africa
OECD Americas
(mn)
Middle East
Non OECD Europe
OECD Asia Oceania
Non-OECD Asia(ex. China)
China
Gas share of energy consumption1 Projected urban population growth (2015-50) Greatest urbanization will occur in regions with lowest gas penetration today
1. Includes weighted average of power generation, buildings, and industry sectors; based on 2015 data
Source: IEA, UN Population Division, BCG analysis
infrastructure provides an opportunity for the integration of new sources of biogas within cities, such as from municipal waste facilities or as a byproduct of industrial activity.
These new sources of gas demand in cities in the developed world will be important for sustaining gas consumption going forward. For more than a decade, gas consumption in the buildings sector across many developed countries has not grown significantly. Despite increasing the number of gas customers, efficiency improvements in gas uses such as boilers has offset that volumetric growth110.
Looking across cities, in both developing and developed countries, this report assesses both the opportunities for gas in cities and the requirements to fulfill those opportunities. It concludes that the use of gas in cities will be critical for achieving the expectations for global gas consumption growth, over the coming decades as articulated in second section of this report. “Gas for cities” is therefore an essential lens for understanding how and where gas consumption will grow in the future and what is required to achieve that growth.
Advantages and opportunities for gas in cities
While cities are a key source of economic activity, they are also a major source of global air pollution. Within urban populations monitored by the World Health
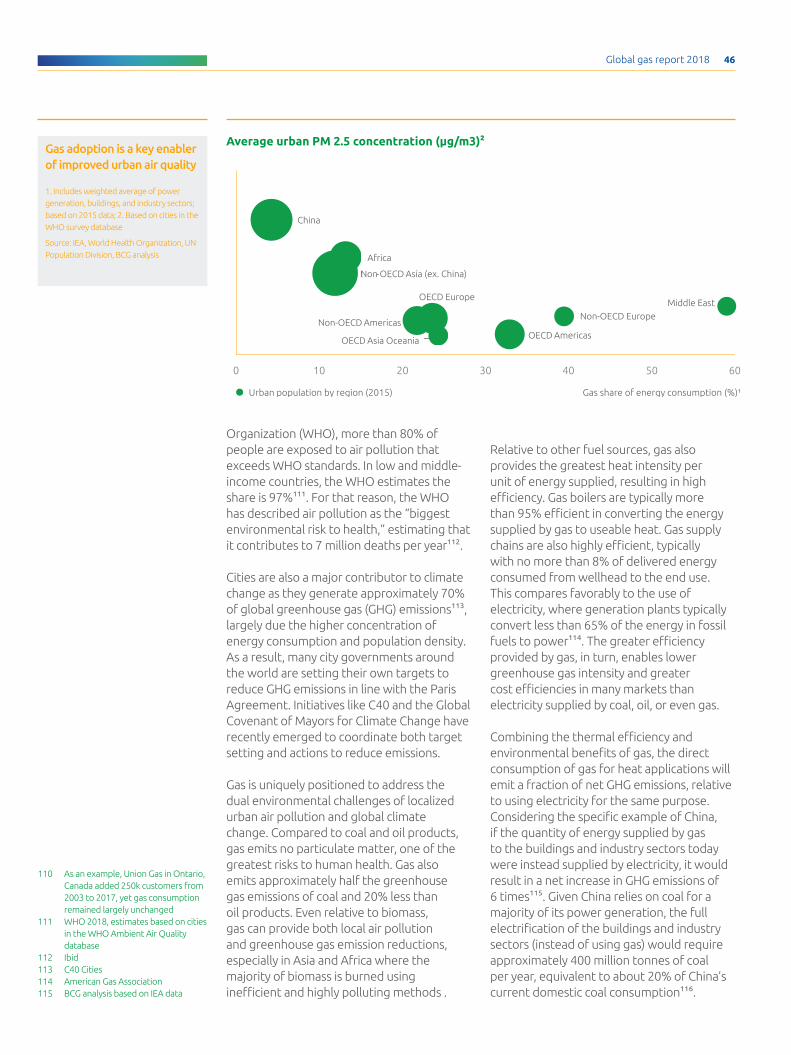
Global gas report 2018 46
0 10 20 30 40 50 60
Gas share of energy consumption (%)¹
Africa
China
Average urban PM 2.5 concentration ( g/m3)2
Middle East
Non-OECD Americas
!Non-OECD Asia (ex. China)
Non-OECD Europe
OECD AmericasOECD Asia Oceania
OECD Europe
Urban population by region (2015)
110 As an example, Union Gas in Ontario, Canada added 250k customers from 2003 to 2017, yet gas consumption remained largely unchanged
111 WHO 2018, estimates based on cities in the WHO Ambient Air Quality database
112 Ibid113 C40 Cities114 American Gas Association115 BCG analysis based on IEA data
Average urban PM 2.5 concentration (µg/m3)2 Gas adoption is a key enabler of improved urban air quality
1. Includes weighted average of power generation, buildings, and industry sectors; based on 2015 data; 2. Based on cities in the WHO survey database
Source: IEA, World Health Organization, UN Population Division, BCG analysis
Organization (WHO), more than 80% of people are exposed to air pollution that exceeds WHO standards. In low and middle-income countries, the WHO estimates the share is 97%111. For that reason, the WHO has described air pollution as the “biggest environmental risk to health,” estimating that it contributes to 7 million deaths per year112.
Cities are also a major contributor to climate change as they generate approximately 70% of global greenhouse gas (GHG) emissions113, largely due the higher concentration of energy consumption and population density. As a result, many city governments around the world are setting their own targets to reduce GHG emissions in line with the Paris Agreement. Initiatives like C40 and the Global Covenant of Mayors for Climate Change have recently emerged to coordinate both target setting and actions to reduce emissions.
Gas is uniquely positioned to address the dual environmental challenges of localized urban air pollution and global climate change. Compared to coal and oil products, gas emits no particulate matter, one of the greatest risks to human health. Gas also emits approximately half the greenhouse gas emissions of coal and 20% less than oil products. Even relative to biomass, gas can provide both local air pollution and greenhouse gas emission reductions, especially in Asia and Africa where the majority of biomass is burned using inefficient and highly polluting methods .
Relative to other fuel sources, gas also provides the greatest heat intensity per unit of energy supplied, resulting in high efficiency. Gas boilers are typically more than 95% efficient in converting the energy supplied by gas to useable heat. Gas supply chains are also highly efficient, typically with no more than 8% of delivered energy consumed from wellhead to the end use. This compares favorably to the use of electricity, where generation plants typically convert less than 65% of the energy in fossil fuels to power114. The greater efficiency provided by gas, in turn, enables lower greenhouse gas intensity and greater cost efficiencies in many markets than electricity supplied by coal, oil, or even gas.
Combining the thermal efficiency and environmental benefits of gas, the direct consumption of gas for heat applications will emit a fraction of net GHG emissions, relative to using electricity for the same purpose. Considering the specific example of China, if the quantity of energy supplied by gas to the buildings and industry sectors today were instead supplied by electricity, it would result in a net increase in GHG emissions of 6 times115. Given China relies on coal for a majority of its power generation, the full electrification of the buildings and industry sectors (instead of using gas) would require approximately 400 million tonnes of coal per year, equivalent to about 20% of China’s current domestic coal consumption116.
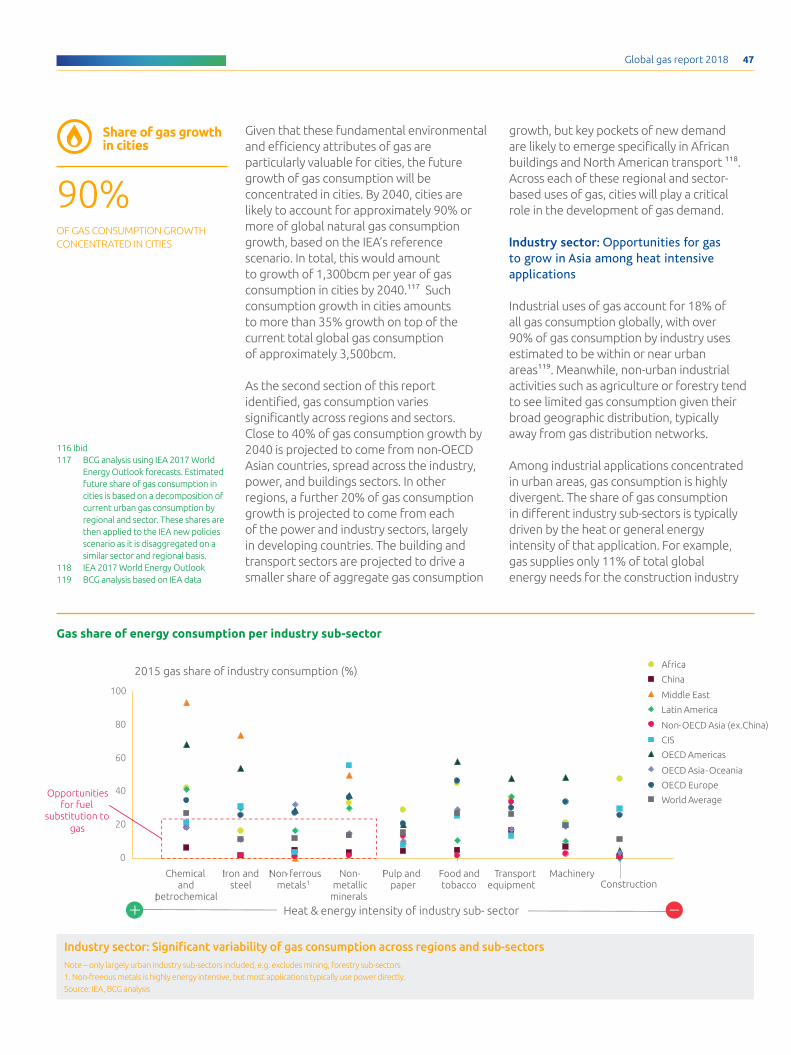
Global gas report 2018 47
Given that these fundamental environmental and efficiency attributes of gas are particularly valuable for cities, the future growth of gas consumption will be concentrated in cities. By 2040, cities are likely to account for approximately 90% or more of global natural gas consumption growth, based on the IEA’s reference scenario. In total, this would amount to growth of 1,300bcm per year of gas consumption in cities by 2040.117 Such consumption growth in cities amounts to more than 35% growth on top of the current total global gas consumption of approximately 3,500bcm.
As the second section of this report identified, gas consumption varies significantly across regions and sectors. Close to 40% of gas consumption growth by 2040 is projected to come from non-OECD Asian countries, spread across the industry, power, and buildings sectors. In other regions, a further 20% of gas consumption growth is projected to come from each of the power and industry sectors, largely in developing countries. The building and transport sectors are projected to drive a smaller share of aggregate gas consumption
growth, but key pockets of new demand are likely to emerge specifically in African buildings and North American transport 118. Across each of these regional and sector-based uses of gas, cities will play a critical role in the development of gas demand.
Industry sector: Opportunities for gas to grow in Asia among heat intensive applications
Industrial uses of gas account for 18% of all gas consumption globally, with over 90% of gas consumption by industry uses estimated to be within or near urban areas119. Meanwhile, non-urban industrial activities such as agriculture or forestry tend to see limited gas consumption given their broad geographic distribution, typically away from gas distribution networks.
Among industrial applications concentrated in urban areas, gas consumption is highly divergent. The share of gas consumption in different industry sub-sectors is typically driven by the heat or general energy intensity of that application. For example, gas supplies only 11% of total global energy needs for the construction industry
116 Ibid117 BCG analysis using IEA 2017 World
Energy Outlook forecasts. Estimated future share of gas consumption in cities is based on a decomposition of current urban gas consumption by regional and sector. These shares are then applied to the IEA new policies scenario as it is disaggregated on a similar sector and regional basis.
118 IEA 2017 World Energy Outlook119 BCG analysis based on IEA data
Heat & energy intensity of industry sub- sector
0
20
40
60
80
100
!Pulp and paper
Food andtobacco
!Iron andsteel
Non-metallic
minerals
!Non-ferrousmetals1
Chemical and
!petrochemical
Transportequipment
Machinery
2015 gas share of industry consumption (%)
Construction
Africa
China
Middle East
Latin America
Non-OECD Asia (ex.China)
CIS
OECD Americas
OECD Asia-Oceania
OECD Europe
World AverageOpportunities
for fuel substitution to
gas
Gas share of energy consumption per industry sub-sector
Industry sector: Significant variability of gas consumption across regions and sub-sectorsNote – only largely urban industry sub-sectors included, e.g. excludes mining, forestry sub-sectors1. Non-freeous metals is highly energy intensive, but most applications typically use power directly.Source: IEA, BCG analysis
90% OF GAS CONSUMPTION GROWTH CONCENTRATED IN CITIES
Share of gas growth in cities
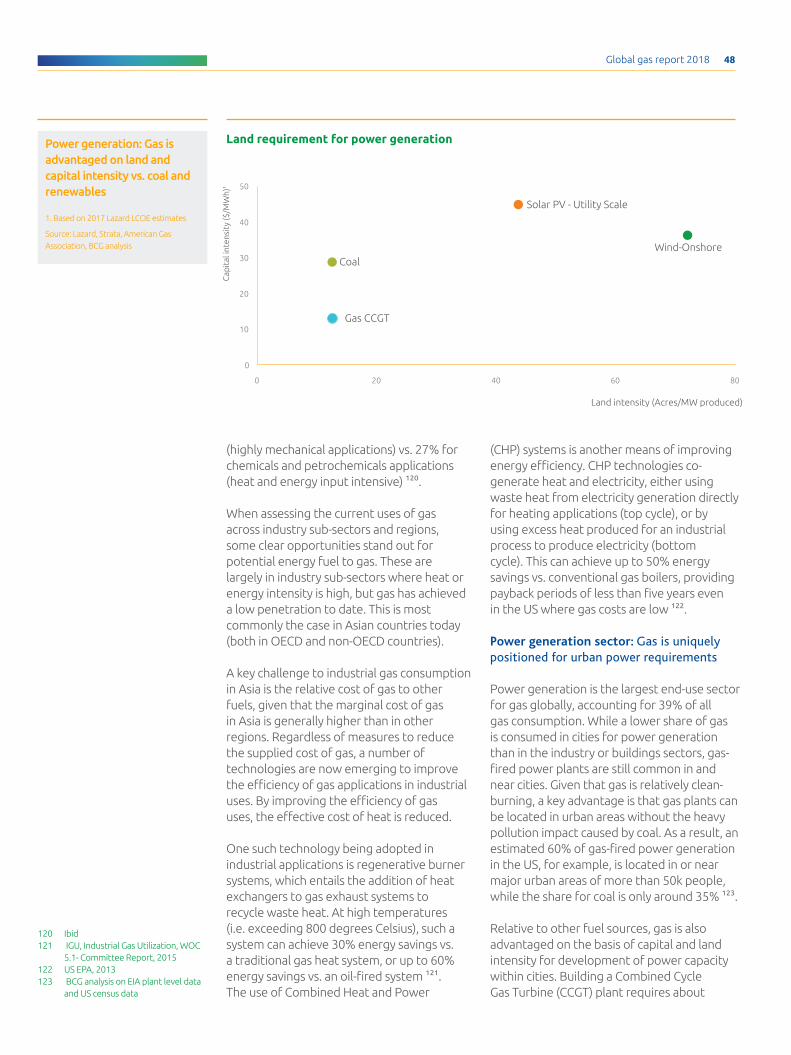
Global gas report 2018 48
Land requirement for power generation
(highly mechanical applications) vs. 27% for chemicals and petrochemicals applications (heat and energy input intensive) 120.
When assessing the current uses of gas across industry sub-sectors and regions, some clear opportunities stand out for potential energy fuel to gas. These are largely in industry sub-sectors where heat or energy intensity is high, but gas has achieved a low penetration to date. This is most commonly the case in Asian countries today (both in OECD and non-OECD countries).
A key challenge to industrial gas consumption in Asia is the relative cost of gas to other fuels, given that the marginal cost of gas in Asia is generally higher than in other regions. Regardless of measures to reduce the supplied cost of gas, a number of technologies are now emerging to improve the efficiency of gas applications in industrial uses. By improving the efficiency of gas uses, the effective cost of heat is reduced.
One such technology being adopted in industrial applications is regenerative burner systems, which entails the addition of heat exchangers to gas exhaust systems to recycle waste heat. At high temperatures (i.e. exceeding 800 degrees Celsius), such a system can achieve 30% energy savings vs. a traditional gas heat system, or up to 60% energy savings vs. an oil-fired system 121. The use of Combined Heat and Power
0
10
20
30
40
50
0 20 40 60 80
Solar PV - Utility Scale
Wind-OnshoreCoal
Gas CCGT
Cap
ital
inte
nsit
y ($
/MW
h)
Land intensity (Acres/MW produced)
Power generation: Gas is advantaged on land and capital intensity vs. coal and renewables
1. Based on 2017 Lazard LCOE estimates
Source: Lazard, Strata, American Gas Association, BCG analysis
(CHP) systems is another means of improving energy efficiency. CHP technologies co-generate heat and electricity, either using waste heat from electricity generation directly for heating applications (top cycle), or by using excess heat produced for an industrial process to produce electricity (bottom cycle). This can achieve up to 50% energy savings vs. conventional gas boilers, providing payback periods of less than five years even in the US where gas costs are low 122.
Power generation sector: Gas is uniquely positioned for urban power requirements
Power generation is the largest end-use sector for gas globally, accounting for 39% of all gas consumption. While a lower share of gas is consumed in cities for power generation than in the industry or buildings sectors, gas-fired power plants are still common in and near cities. Given that gas is relatively clean-burning, a key advantage is that gas plants can be located in urban areas without the heavy pollution impact caused by coal. As a result, an estimated 60% of gas-fired power generation in the US, for example, is located in or near major urban areas of more than 50k people, while the share for coal is only around 35% 123.
Relative to other fuel sources, gas is also advantaged on the basis of capital and land intensity for development of power capacity within cities. Building a Combined Cycle Gas Turbine (CCGT) plant requires about
120 Ibid121 IGU, Industrial Gas Utilization, WOC
5.1- Committee Report, 2015122 US EPA, 2013123 BCG analysis on EIA plant level data
and US census data
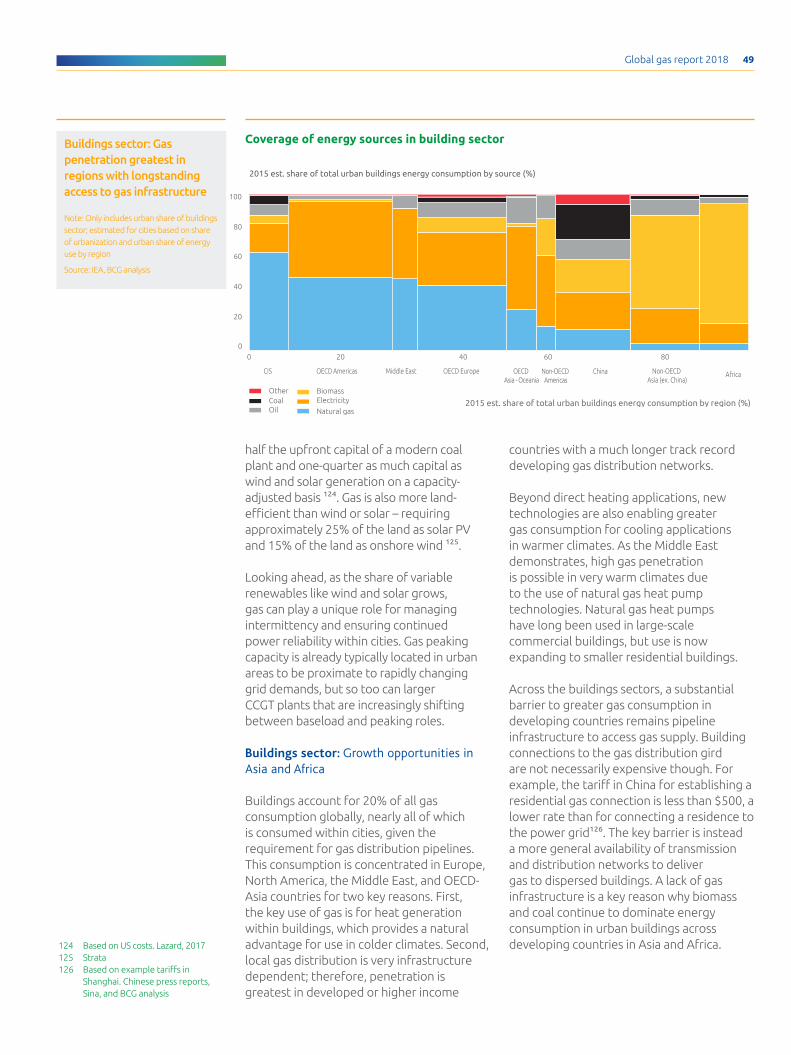
Global gas report 2018 49
half the upfront capital of a modern coal plant and one-quarter as much capital as wind and solar generation on a capacity-adjusted basis 124. Gas is also more land-efficient than wind or solar – requiring approximately 25% of the land as solar PV and 15% of the land as onshore wind 125.
Looking ahead, as the share of variable renewables like wind and solar grows, gas can play a unique role for managing intermittency and ensuring continued power reliability within cities. Gas peaking capacity is already typically located in urban areas to be proximate to rapidly changing grid demands, but so too can larger CCGT plants that are increasingly shifting between baseload and peaking roles.
Buildings sector: Growth opportunities in Asia and Africa
Buildings account for 20% of all gas consumption globally, nearly all of which is consumed within cities, given the requirement for gas distribution pipelines. This consumption is concentrated in Europe, North America, the Middle East, and OECD-Asia countries for two key reasons. First, the key use of gas is for heat generation within buildings, which provides a natural advantage for use in colder climates. Second, local gas distribution is very infrastructure dependent; therefore, penetration is greatest in developed or higher income
countries with a much longer track record developing gas distribution networks.
Beyond direct heating applications, new technologies are also enabling greater gas consumption for cooling applications in warmer climates. As the Middle East demonstrates, high gas penetration is possible in very warm climates due to the use of natural gas heat pump technologies. Natural gas heat pumps have long been used in large-scale commercial buildings, but use is now expanding to smaller residential buildings.
Across the buildings sectors, a substantial barrier to greater gas consumption in developing countries remains pipeline infrastructure to access gas supply. Building connections to the gas distribution gird are not necessarily expensive though. For example, the tariff in China for establishing a residential gas connection is less than $500, a lower rate than for connecting a residence to the power grid126. The key barrier is instead a more general availability of transmission and distribution networks to deliver gas to dispersed buildings. A lack of gas infrastructure is a key reason why biomass and coal continue to dominate energy consumption in urban buildings across developing countries in Asia and Africa.
Coverage of energy sources in building sector
20 8040 60
AfricaNon-OECD Asia (ex. China)
Middle East
2015 est. share of total urban buildings energy consumption by region (%)
OECD AmericasCIS OECD Europe ChinaOECD Asia - Oceania
Non-OECD Americas
Natural gas
ElectricityBiomass
OilCoalOther
2015 est. share of total urban buildings energy consumption by source (%)
0
100
80
60
0
20
40
Buildings sector: Gas penetration greatest in regions with longstanding access to gas infrastructure
Note: Only includes urban share of buildings sector; estimated for cities based on share of urbanization and urban share of energy use by region
Source: IEA, BCG analysis
124 Based on US costs. Lazard, 2017 125 Strata 126 Based on example tariffs in
Shanghai. Chinese press reports, Sina, and BCG analysis
Global gas report 2018 50
127 Based on example tariffs in Shanghai. Chinese press reports, Sina, and BCG analysis
128 NGVA Europe
Transport sector: A targeted sustainability lever in some cities
The transport sector plays a very niche role for overall gas consumption. Only 1% of global gas consumption is used for transport, with gas providing 2% of overall energy used in the sector. Approximately 90% of this consumption is for road transport in the form of CNG or LNG, which, in turn, is largely used within cities.
Despite low use globally, gas plays a prominent role for transport in some specific cities and in specific applications. Typically, urban air pollution challenges are a motivator for national or local governments to invest in gas transport infrastructure or incentivize gas adoption over diesel. In China and India, for example, gas consumption in transport is rapidly growing given public programs to incentivize and fuel switching as a means of improving air quality. Meanwhile, in Europe and North America, many cities have supported the adoption of gas for heavy duty fleet vehicles like buses or garbage trucks. However, as gas uses for urban transport increases, it requires the development of new refueling infrastructure. In Italy, for example, nearly 1,100 natural gas refueling stations are currently used for 880k natural gas vehicles127.
Requirements for gas in cities
This report identified three key drivers for enabling gas growth on a global scale: 1) Cost competitiveness; 2) Security of supply; and 3) Sustainability. Of these, cost
competitiveness is a consistent requirement for the adoption of gas in cities around the world. For developing countries, though, security of supply at the city level is an essential requirement given the lack of access in many countries today. In developed country cities, sustainability is a more critical driver, particularly measures that deploy gas as a means of helping to achieve general urban sustainability goals.
Developing country cities – infrastructure to provide secure access to gas
Non-OECD Asia is expected to account for nearly half of global natural gas demand growth through 2040, given a combination of high primary energy demand growth and low penetration of gas today. When considering urbanization trends along with the ongoing challenge of urban air pollution, Asian cities will therefore be the critical context for the growth of gas.
Yet, access to gas in cities is limited today across most developing countries, particularly in Asia. China has led the way in solving this challenge over the past 20 years with gas access now available in 55 cities, totaling 285 million customers128. However, access remains low by global standards given a population of more than 1.2 billion and more than 140 cities with more than a million people. In India, progress has been made setting up concessions for gas given more than 35 cities now have a gas local distribution company. However, the number of actual gas connections are very limited - only 3.9 million gas connections
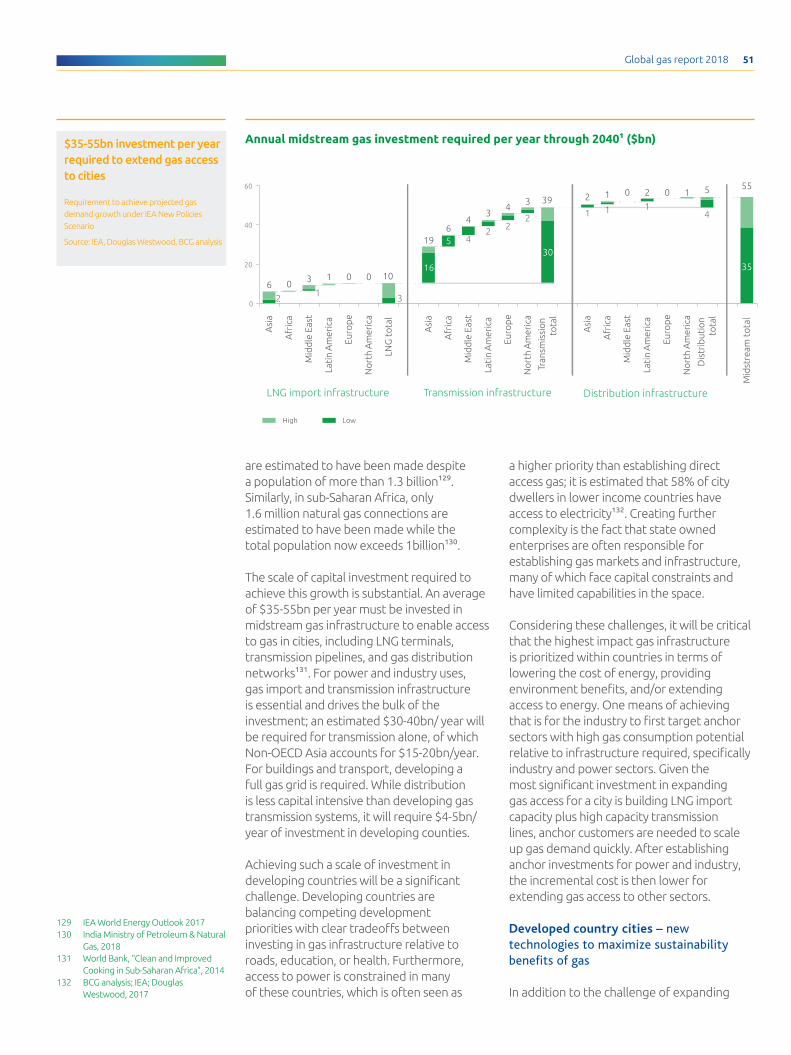
Global gas report 2018 51
are estimated to have been made despite a population of more than 1.3 billion129. Similarly, in sub-Saharan Africa, only 1.6 million natural gas connections are estimated to have been made while the total population now exceeds 1billion130.
The scale of capital investment required to achieve this growth is substantial. An average of $35-55bn per year must be invested in midstream gas infrastructure to enable access to gas in cities, including LNG terminals, transmission pipelines, and gas distribution networks131. For power and industry uses, gas import and transmission infrastructure is essential and drives the bulk of the investment; an estimated $30-40bn/ year will be required for transmission alone, of which Non-OECD Asia accounts for $15-20bn/year. For buildings and transport, developing a full gas grid is required. While distribution is less capital intensive than developing gas transmission systems, it will require $4-5bn/year of investment in developing counties.
Achieving such a scale of investment in developing countries will be a significant challenge. Developing countries are balancing competing development priorities with clear tradeoffs between investing in gas infrastructure relative to roads, education, or health. Furthermore, access to power is constrained in many of these countries, which is often seen as
Annual midstream gas investment required per year through 20401 ($bn)
5
16
0
20
40
60
Euro
pe
0
60
Lati
n A
mer
ica
1
Mid
dle
Eas
t
3
1A
fric
a0
Asi
a
2
1
Tran
smis
sio
nto
tal
30
No
rth
Am
eric
a
4
4
Afr
ica
6
Mid
stre
am t
ota
l
35
Dis
trib
utio
nto
tal
4
2
No
rth
Am
eric
a
Annual midstream gas investment required per year through 2040 ($bn)¹
2
Lati
n A
mer
ica
34
2
Mid
dle
Eas
t
1
3
No
rth
Am
eric
a
0
Euro
pe
Lati
n A
mer
ica
2
1
Mid
dle
Eas
t
Asi
a
19
LNG
to
tal
0
Afr
ica
1
1
Asi
a
3
2
Euro
pe
LNG import infrastructure Transmission infrastructure Distribution infrastructure
10
39
555
High Low
$35-55bn investment per year required to extend gas access to cities
Requirement to achieve projected gas demand growth under IEA New Policies Scenario
Source: IEA, Douglas Westwood, BCG analysis
a higher priority than establishing direct access gas; it is estimated that 58% of city dwellers in lower income countries have access to electricity132. Creating further complexity is the fact that state owned enterprises are often responsible for establishing gas markets and infrastructure, many of which face capital constraints and have limited capabilities in the space.
Considering these challenges, it will be critical that the highest impact gas infrastructure is prioritized within countries in terms of lowering the cost of energy, providing environment benefits, and/or extending access to energy. One means of achieving that is for the industry to first target anchor sectors with high gas consumption potential relative to infrastructure required, specifically industry and power sectors. Given the most significant investment in expanding gas access for a city is building LNG import capacity plus high capacity transmission lines, anchor customers are needed to scale up gas demand quickly. After establishing anchor investments for power and industry, the incremental cost is then lower for extending gas access to other sectors.
Developed country cities – new technologies to maximize sustainability benefits of gas
In addition to the challenge of expanding
129 IEA World Energy Outlook 2017130 India Ministry of Petroleum & Natural
Gas, 2018131 World Bank, “Clean and Improved
Cooking in Sub-Saharan Africa”, 2014132 BCG analysis; IEA; Douglas
Westwood, 2017
Global gas report 2018 52
gas infrastructure in developing countries, gas use in cities in the OECD is expected to plateau and decline in some sectors driven by a continued increase in efficiency and growth in the electrification of buildings. As these developments evolve, it will be critical to deploy new technologies for gas to sustain gas consumption in existing distribution networks. In turn, these new gas technologies can help to enable even lower carbon pathways for cities that adopt them.
Distributed microgrids with gas-fired generation is one emerging technology with potential for growing the use of gas in developed country cities. Microgrids are increasingly being adopted for a range of distributed or self-contained applications such as small or remote communities, military bases, or universities. Often, they serve as a means of deploying community or small-scale renewables while still providing the resilience of a traditional power gird. Gas can play a key role in these microgrid developments through the use of gas micro turbines, which provide flexible backup power that is cleaner and lower cost than traditional diesel backup generators. It also carries a significant air quality advantage over the traditional diesel generator backup options.
Small-scale carbon capture and storage and/or utilization (CCS/CCU) technologies are an emerging, potential means of extending gas access in cities. With an increasing price of carbon as well as tax credits available for CCS/CCU applications in
many markets, economic incentives are now increasingly available to potentially make CCS/CCU commercially viable. In particular, commercial utilization technologies such as carbon fiber manufacturing or CO2 use in chemical processes are emerging as high value sources of potential CO2 use. The development of an integrated carbon capture and utilization value chains would be a long-term solution to sustain gas use in urban industrial applications while also achieving aggressive climate objectives.
Success stories – expanding access to gas in cities
The following examples highlight how and why three specific cities scaled up gas consumption and what they learned about the challenges, impacts, and keys to success from the adoption of gas.
Beijing, ChinaFor many years, Beijing had among the worst urban air quality in the world due to its dramatic economic and rapid population growth, topography, and local climate. In 2013, the central government began to take more decisive action to limit pollution, including setting hard targets for reducing air pollutants like PM2.5 by the end of 2017.
In 2016, the government followed up with the “2+26” policy, aimed at reducing PM2.5 emissions by 15% in the remaining year, across Beijing, Tianjin, and 26 other northern
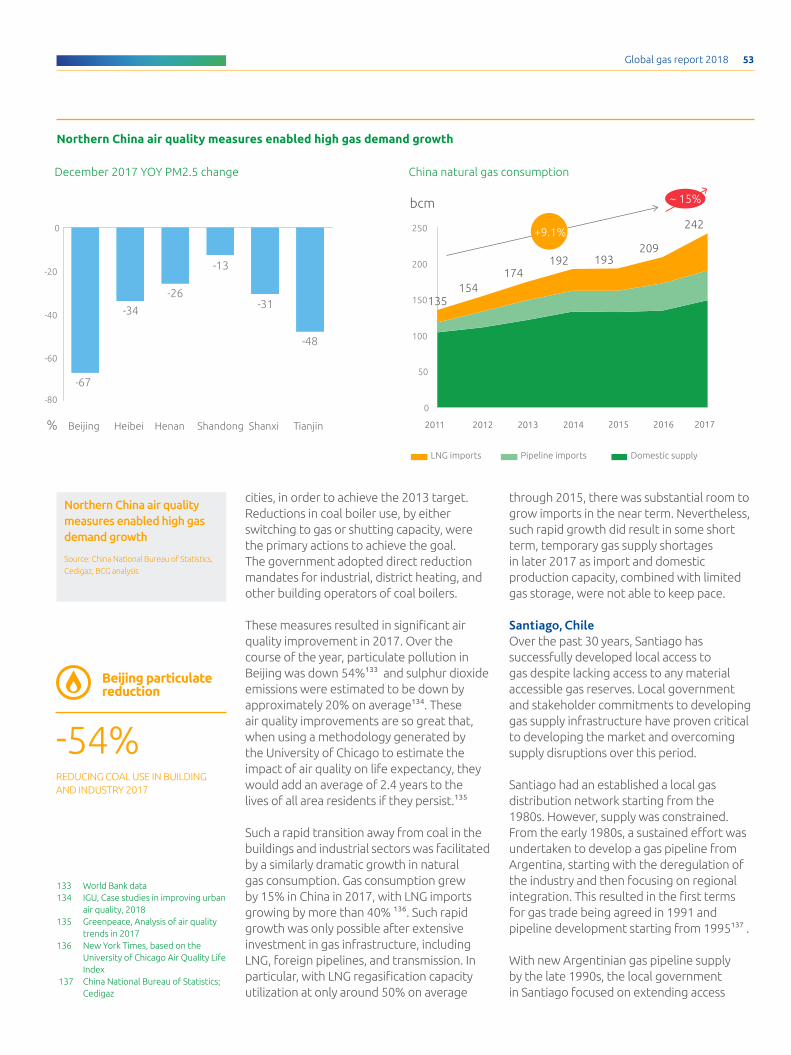
Global gas report 2018 53
cities, in order to achieve the 2013 target. Reductions in coal boiler use, by either switching to gas or shutting capacity, were the primary actions to achieve the goal. The government adopted direct reduction mandates for industrial, district heating, and other building operators of coal boilers.
These measures resulted in significant air quality improvement in 2017. Over the course of the year, particulate pollution in Beijing was down 54%133 and sulphur dioxide emissions were estimated to be down by approximately 20% on average134. These air quality improvements are so great that, when using a methodology generated by the University of Chicago to estimate the impact of air quality on life expectancy, they would add an average of 2.4 years to the lives of all area residents if they persist.135
Such a rapid transition away from coal in the buildings and industrial sectors was facilitated by a similarly dramatic growth in natural gas consumption. Gas consumption grew by 15% in China in 2017, with LNG imports growing by more than 40% 136. Such rapid growth was only possible after extensive investment in gas infrastructure, including LNG, foreign pipelines, and transmission. In particular, with LNG regasification capacity utilization at only around 50% on average
Northern China air quality measures enabled high gas demand growth
-48
-31
-13
-26
-34
-67
-80
-60
-40
-20
0
HenanHeibei Shandong Shanxi Tianjin% Beijing
0
50
100
150
200
250
bcm
135
242
2015 2016
192
~ 15%
209
2014 2017
193
2011 2012
174
2013
154
Pipeline importsLNG imports Domestic supply
December 2017 YOY PM2.5 change China natural gas consumption
+9.1%
Northern China air quality measures enabled high gas demand growth
Source: China National Bureau of Statistics, Cedigaz, BCG analysis
through 2015, there was substantial room to grow imports in the near term. Nevertheless, such rapid growth did result in some short term, temporary gas supply shortages in later 2017 as import and domestic production capacity, combined with limited gas storage, were not able to keep pace.
Santiago, ChileOver the past 30 years, Santiago has successfully developed local access to gas despite lacking access to any material accessible gas reserves. Local government and stakeholder commitments to developing gas supply infrastructure have proven critical to developing the market and overcoming supply disruptions over this period.
Santiago had an established a local gas distribution network starting from the 1980s. However, supply was constrained. From the early 1980s, a sustained effort was undertaken to develop a gas pipeline from Argentina, starting with the deregulation of the industry and then focusing on regional integration. This resulted in the first terms for gas trade being agreed in 1991 and pipeline development starting from 1995137 .
With new Argentinian gas pipeline supply by the late 1990s, the local government in Santiago focused on extending access
133 World Bank data 134 IGU, Case studies in improving urban
air quality, 2018135 Greenpeace, Analysis of air quality
trends in 2017136 New York Times, based on the
University of Chicago Air Quality Life Index
137 China National Bureau of Statistics; Cedigaz
-54% REDUCING COAL USE IN BUILDING AND INDUSTRY 2017
Beijing particulate reduction

Global gas report 2018 54
to gas to industrial customers, along with implementing enabling policies to limit particulate and sulphur pollution. From 1989 to 2004, gas consumption in the city nearly doubled, while PM2.5 pollution dropped by half138.
However, starting in the early 2000s, gas supply from Argentina became constrained due to domestic Argentinian political and economic challenges. As a result, the Santiago government and Metrogas, the local distribution company, shifted focus to the development of an LNG import terminal. By 2009, the Quintero LNG terminal was online, bringing together a consortium of partners to utilize the gas for power generation, industrial applications, and local distribution within Santiago. The example of Santiago thus demonstrates the critical nature of long term, sustained infrastructure investment for enabling access to gas in cities.
Mumbai, India: Gujarat state in India has been the center of the domestic natural gas industry from its start in the 1970s. Strategically positioned relative to early upstream gas supply, Gujarat was also a key source for gas demand given its high degree of industrial activity. Thus, as gas production began to scale up in the 1980s and 1990s, Gujarat became an early source of gas infrastructure development in terms of pipelines and end use sources such as fertilizer plants, petrochemical plants, and gas-fired power generation.
In this context of growing regional gas supply and infrastructure, Mumbai in neighboring Maharashtra state became an early candidate
for extending access gas access to cities in India. As the largest Indian city and with increasing air pollution challenges, one of India’s first City Gas Distribution (CGD) concessions was granted to Mahanagar Gas in 1995 to develop a gas network and distribute gas within Mumabi.
As a consortium of Gail (the state-owned gas infrastructure company), the Maharashtra state government, and BG Group (since acquired by Shell), Mahanagar Gas was a pioneer of the CGD model of developing pipeline gas connections to homes and small scale industrial users as well as deploying CNG for transport. Given the involvement of state owned entities, in some ways Mahanagar Gas has been an extension of government policy targeting ways to deploy gas to reduce air pollution. Such a role of executing policy objectives was further established by the 2014 Indian gas law which provides the lowest cost source of gas to CGD customers. Mahanagar Gas now has the second largest customer base in India among CGD concessions, with connections to 1 million households. While the share of the total pipeline gas connection rates in Mumbai is only 39% – low by global standards – it is among the highest penetration rates of cities in India139. In turn, this access to gas has been instrumental in reducing local uses of highly polluting biomass. The case of Mumbai demonstrates the impact of deploying gas first for industry and power applications, then extending infrastructure to cities over time.
138 “Investment in Natural Gas Pipeline in the Southern Cone of Latin America”, World Bank, 1999
139 Ibid140 India Ministry of Petroleum &
Natural Gas
Global gas report 2018 55
Conclusion: Implications for the global gas industry
Considering the opportunities and requirements for gas within cities along with the examples of cities where gas has been deployed successfully, several lessons and implications stand out for the global gas industry:
First, infrastructure investment is essential to realize the potential for gas in cities across developing countries. Achieving the IEA’s established growth trajectory for gas will take $35-55bn of sustained investment per year in gas midstream, largely in Asia. To maximize the impact of this investment, a focus on core or anchor sources of gas demand such as power generation and large industrial customers can help.
Second, timelines are long for the development of city gas. It takes sustained investment and focus to develop supply, local distribution infrastructure, and customers for gas. The common point across Beijing, Santiago, and Mumbai is that a period of at least 20-30 years is required for specific city gas opportunities to be fully realized.
Third, new technological innovation will be critical for ensuring there are new and relevant applications for gas in cities going forward, particularly in developed countries. While gas is relatively advantaged vs. electricity on a heat, efficiency, and reliability basis, further innovation can improve on it. Technologies for building and industrial applications such as natural gas heat pumps, gas microgrids, and industrial CCS can help to further improve the sustainability impacts of gas and extend access to gas in new ways.
Finally, policy measures are critical enablers for extending access to gas in cities, particularly relating to urban air pollution. The environmental benefits relative to other fuel sources is perhaps the greatest comparative advantage of gas, but as the example of Beijing demonstrates, the right policies must be established for those benefits to be realized.
Snam, a European leader in the construction and integrated management of natural gas infrastructure, operates and develops Europe’s largest, most accessible pipeline network (more than 40,000 km), the largest storage infrastructure (19bcm capacity) and one of the first LNG terminals built in Europe. Its investments aim to facilitate the European Energy Union network integration and to promote natural gas as a key pillar of a sustainable energy mix. With its 3,000 people, Snam is active in natural gas transportation, storage and regasification. It also operates, through associated companies, in Austria (TAG, GCA), France (Teréga), United Kingdom (Interconnector UK) and is shareholder of the TAP pipeline.
Press OfficeT. +39 02 [email protected]
Investor RelationsT. +39 02 [email protected]
@Snam
www.snam.it
The International Gas Union (IGU) was founded in 1931. It is a worldwide non-profit organisation registered in Vevey, Switzerland with the Secretariat currently located in Barcelona, Spain.The mission of IGU is to advocate gas as an integral part of a sustainable global energy system, and to promote the political, technical and economic progress of the gas industry. The more than 150 members of IGU are associations and corporations of the gas industry representing over 97% of the global gas market. The working organisation of IGU covers the complete value of gas chain from exploration and production, transmission via pipelines and liquefied natural gas (LNG) as well as distribution and combustion of gas at the point of use.IGU encourages international trade in gas by supporting non-discriminatory policies and sound contracting principles and practices, promoting development of technologies which add to the environmental benefits of gas and further enhance safe production, transmission, distribution and utilisation of gas.IGU has the vision of being the most influential, effective and independent non-profit organisation, serving as the spokesperson for the gas industry worldwide.
IGU SecretariatT. + 34 93 412 97 [email protected]
www.igu.org
The Boston Consulting Group (BCG) is a global management consulting firm and the world’s leading advisor on business strategy. We partner with clients from the private, public, and not-forprofit sectors in all regions to identify their highest-value opportunities, address their most critical challenges, and transform their enterprises. Our customized approach combines deep insight into the dynamics of companies and markets with close collaboration at all levels of the client organization. This ensures that our clients achieve sustainable competitive advantage, build more capable organizations, and secure lasting results. Founded in 1963, BCG is a private company with offices in more than 90 cities in 50 countries.
Emanuele BelsitoPartner & Managing Director Milan
Alex DewarSenior Manager - Center for Energy ImpactWashington, DC
Ivan Marten Senior Partner & Managing DirectorVice Chairman, Energy PracticeMadrid
www.bcg.com
Design: Inarea Strategic Design


Global gas report 2018 B