Embed Size (px)
Citation preview
Author NAB FX Strategy team
© National Australia Bank Limited ABN 12 004 044 937 AFSL and Australian Credit Licence 230686 1
In this issue
USD: Secular downtrend 2 AUD: Drivers turn down 3 NZD: Headwinds ahead 4 EUR: Impulsive 5 GBP: Transition key 6 JPY: Still last cab to leave 7 CB Policy Monitor 9 PPP Estimates 10 Flow and BIS charts 11
FX Views in a Tweet
Key Currency Themes • The USD depreciation trend has gathered momentum in 2018 with key support
levels breached. Interest rate considerations are seen coming back to support, but not fully reverse, the USD downtrend. The DXY decline has much further to run.
• The inverse USD/commodity price correlation has driven most of the AUD/USD appreciation since December. Risk sentiment and rates considerations can now bring AUD down, but we make some small upward adjustment to our forecast track.
• Near-term NZD projections have been revised higher, thanks to the bearish sentiment overhanging the USD, but our year-end target is unchanged at 0.70.
• The FX market is exploring EUR/USD upside for a new range top; we suggest to the 1.26-1.28 area in H1, higher still in H2.
• A GBP-supportive Brexit transition deal is under threat with UK cabinet divisions being laid bare. Pressure from business will likely mean a satisfactory deal comes about; we lift our GBP forecasts despite the worsening political backdrop.
• The BoJ remains committed to its accommodative policy, but JPY forecasts revised up to reflect the pull from secular USD and JPY forces.
• China has allowed USD/CNY to almost fully reflect the broader USD trend, necessitating downward adjustments to our CNY forecast.
AUD/USD and DXY since early mid-December
USD Index Turn in risk sentiment, renewing attention on higher US yields, allows for minor reversal of downtrend Dye looks cast for secular USD downtrend after key
levels break but losses to be more selective
AUD/USD Prior tailwinds from USD/commodities and positive risk sentiment temporarily turn headwinds Yield spreads, softer commodities and less supportive
risk backdrop to pull AUD lower
NZD/USD Uncertain, with USD in driving seat; Downside vulnerability if risk appetite lurches down further Lower yield spreads and headwinds from lower risk
appetite
EUR/USD USD reversal allows for consolidation/minor reversal of recent strong gains Ongoing strong EZ economic performance and likely
shift in ECB messaging to drive us toward 1.30
GBP/USD Highly uncertain amid UK cabinet warfare and so fate of transition deal/soft Brexit optimism Premised on business imperative for 'no change for
now' transition winning out and eventual soft Brexit
USD/JPY Upside near term as long as the low 2012 trend line support holds and bout of risk aversion is averted Higher US yield environment offset by view BoJ will
allow yields to follow, structural gravitational pull
USD/CNY The RMB index has scope to outperform the DXY in a soft USD environment A stable RMB index is an integral ingredient for
macro and financial sector reforms to progress
Near term view (next few weeks) Longer term view (6-12 months)
0.745
0.755
0.765
0.775
0.785
0.795
0.805
0.815
0.82586
87
88
89
90
91
92
93
94
95
11-Dec 15-Dec 22-Dec 29-Dec 06-Jan 12-Jan 19-Jan 25-Jan 01-FebSource: Bloomberg, National Australia Bank
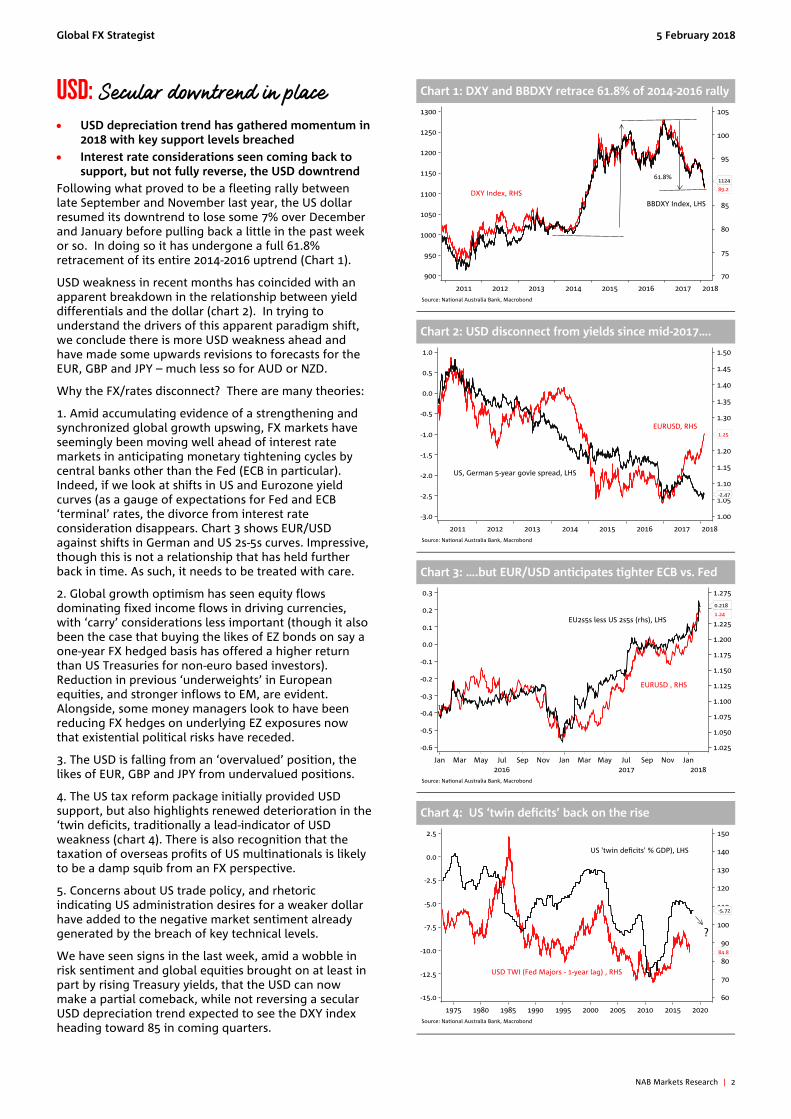
DXY - lhs Year starts with more broad based USD weakness despite rising US bond yields and strong US data; focus on central banks elsewhere
Trump imposes tariffs on washing machines, solar panels
AUD - rhs
Strong AU retail sales
AU employment +35k but unemployment 5.5% from 5.4%
Mnuchin: "obviously a weaker USD is good for us"
AU Q4 CPI weaker than expected
Postive risk sentiment, rising commodity prices, counter further AU-US spread compression, supporting AUD
"Risk-off" as stocks tank, yields rise after strong US wages data
5 February 2018
GLOBAL FX STRATEGIST
Global FX Strategist 5 February 2018
NAB Markets Research | 2
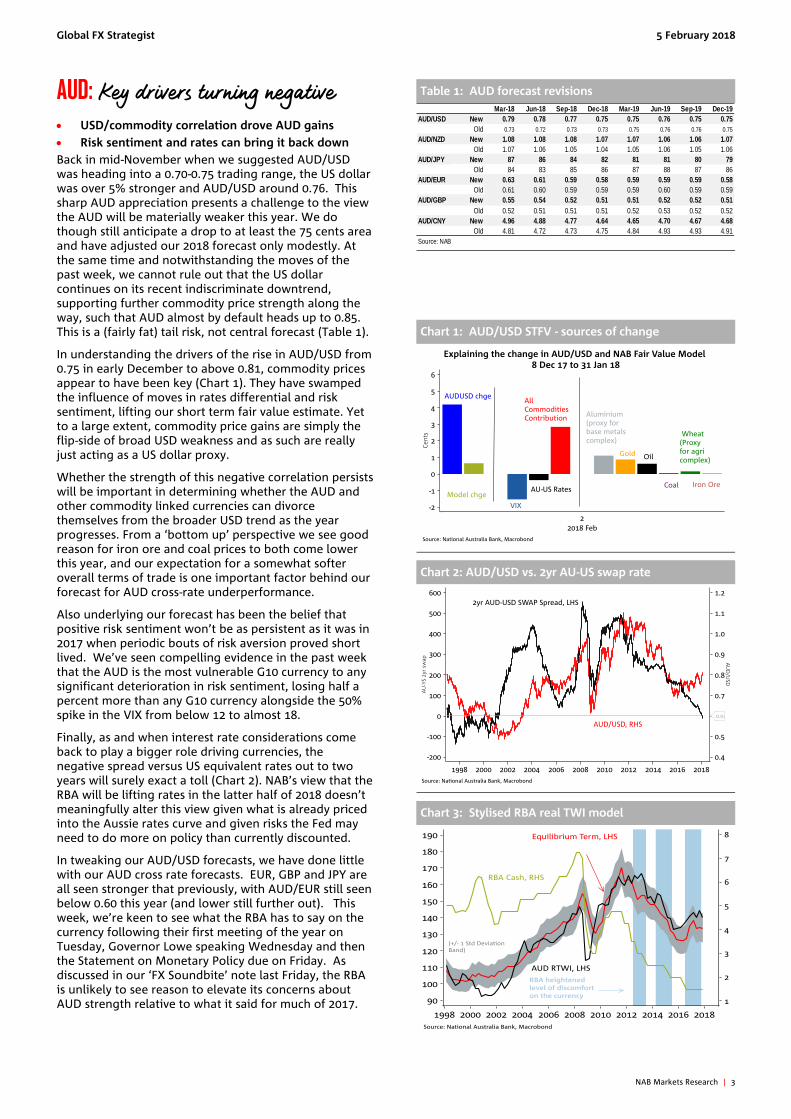
USD: Secular downtrend in place • USD depreciation trend has gathered momentum in
2018 with key support levels breached • Interest rate considerations seen coming back to
support, but not fully reverse, the USD downtrend Following what proved to be a fleeting rally between late September and November last year, the US dollar resumed its downtrend to lose some 7% over December and January before pulling back a little in the past week or so. In doing so it has undergone a full 61.8% retracement of its entire 2014-2016 uptrend (Chart 1).
USD weakness in recent months has coincided with an apparent breakdown in the relationship between yield differentials and the dollar (chart 2). In trying to understand the drivers of this apparent paradigm shift, we conclude there is more USD weakness ahead and have made some upwards revisions to forecasts for the EUR, GBP and JPY – much less so for AUD or NZD.
Why the FX/rates disconnect? There are many theories:
1. Amid accumulating evidence of a strengthening and synchronized global growth upswing, FX markets have seemingly been moving well ahead of interest rate markets in anticipating monetary tightening cycles by central banks other than the Fed (ECB in particular). Indeed, if we look at shifts in US and Eurozone yield curves (as a gauge of expectations for Fed and ECB ‘terminal’ rates, the divorce from interest rate consideration disappears. Chart 3 shows EUR/USD against shifts in German and US 2s-5s curves. Impressive, though this is not a relationship that has held further back in time. As such, it needs to be treated with care.
2. Global growth optimism has seen equity flows dominating fixed income flows in driving currencies, with ‘carry’ considerations less important (though it also been the case that buying the likes of EZ bonds on say a one-year FX hedged basis has offered a higher return than US Treasuries for non-euro based investors). Reduction in previous ‘underweights’ in European equities, and stronger inflows to EM, are evident. Alongside, some money managers look to have been reducing FX hedges on underlying EZ exposures now that existential political risks have receded.
3. The USD is falling from an ‘overvalued’ position, the likes of EUR, GBP and JPY from undervalued positions.
4. The US tax reform package initially provided USD support, but also highlights renewed deterioration in the ‘twin deficits, traditionally a lead-indicator of USD weakness (chart 4). There is also recognition that the taxation of overseas profits of US multinationals is likely to be a damp squib from an FX perspective.
5. Concerns about US trade policy, and rhetoric indicating US administration desires for a weaker dollar have added to the negative market sentiment already generated by the breach of key technical levels.
We have seen signs in the last week, amid a wobble in risk sentiment and global equities brought on at least in part by rising Treasury yields, that the USD can now make a partial comeback, while not reversing a secular USD depreciation trend expected to see the DXY index heading toward 85 in coming quarters.
Chart 1: DXY and BBDXY retrace 61.8% of 2014-2016 rally
Chart 2: USD disconnect from yields since mid-2017….
Chart 3: ….but EUR/USD anticipates tighter ECB vs. Fed
Chart 4: US ‘twin deficits’ back on the rise
Global FX Strategist 5 February 2018
NAB Markets Research | 3
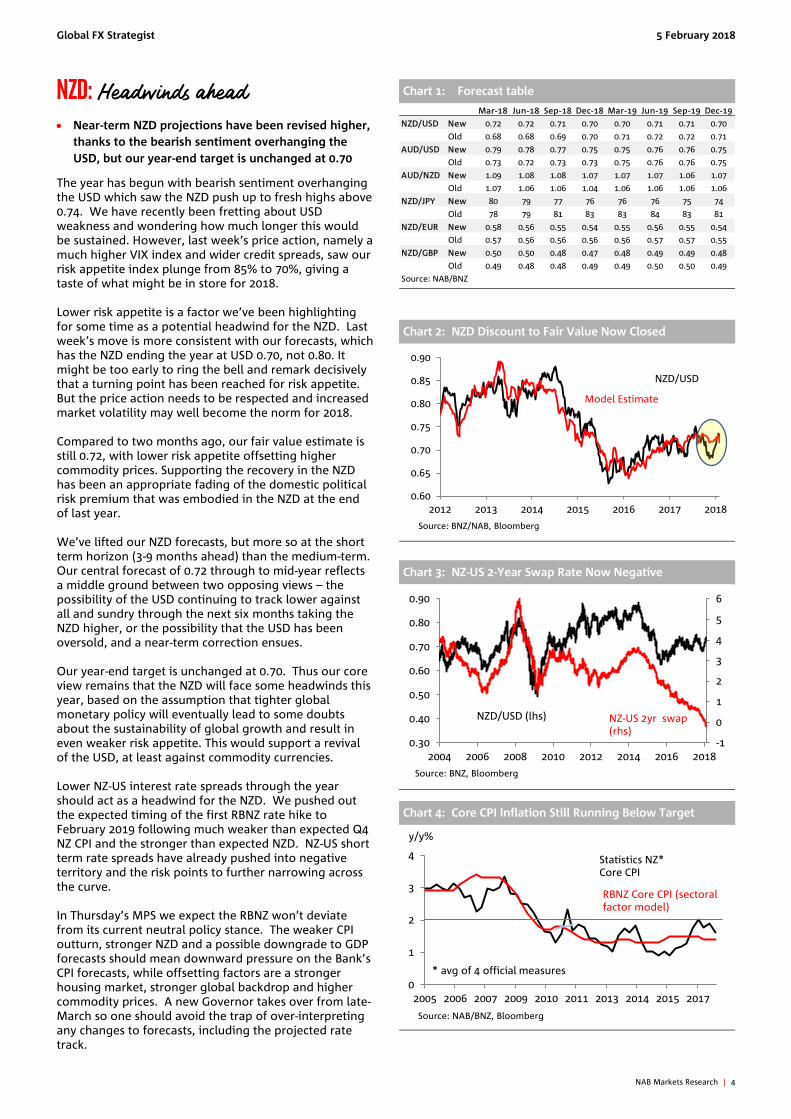
AUD: Key drivers turning negative • USD/commodity correlation drove AUD gains • Risk sentiment and rates can bring it back down Back in mid-November when we suggested AUD/USD was heading into a 0.70-0.75 trading range, the US dollar was over 5% stronger and AUD/USD around 0.76. This sharp AUD appreciation presents a challenge to the view the AUD will be materially weaker this year. We do though still anticipate a drop to at least the 75 cents area and have adjusted our 2018 forecast only modestly. At the same time and notwithstanding the moves of the past week, we cannot rule out that the US dollar continues on its recent indiscriminate downtrend, supporting further commodity price strength along the way, such that AUD almost by default heads up to 0.85. This is a (fairly fat) tail risk, not central forecast (Table 1).
In understanding the drivers of the rise in AUD/USD from 0.75 in early December to above 0.81, commodity prices appear to have been key (Chart 1). They have swamped the influence of moves in rates differential and risk sentiment, lifting our short term fair value estimate. Yet to a large extent, commodity price gains are simply the flip-side of broad USD weakness and as such are really just acting as a US dollar proxy.
Whether the strength of this negative correlation persists will be important in determining whether the AUD and other commodity linked currencies can divorce themselves from the broader USD trend as the year progresses. From a ‘bottom up’ perspective we see good reason for iron ore and coal prices to both come lower this year, and our expectation for a somewhat softer overall terms of trade is one important factor behind our forecast for AUD cross-rate underperformance.
Also underlying our forecast has been the belief that positive risk sentiment won’t be as persistent as it was in 2017 when periodic bouts of risk aversion proved short lived. We’ve seen compelling evidence in the past week that the AUD is the most vulnerable G10 currency to any significant deterioration in risk sentiment, losing half a percent more than any G10 currency alongside the 50% spike in the VIX from below 12 to almost 18.
Finally, as and when interest rate considerations come back to play a bigger role driving currencies, the negative spread versus US equivalent rates out to two years will surely exact a toll (Chart 2). NAB’s view that the RBA will be lifting rates in the latter half of 2018 doesn’t meaningfully alter this view given what is already priced into the Aussie rates curve and given risks the Fed may need to do more on policy than currently discounted.
In tweaking our AUD/USD forecasts, we have done little with our AUD cross rate forecasts. EUR, GBP and JPY are all seen stronger that previously, with AUD/EUR still seen below 0.60 this year (and lower still further out). This week, we’re keen to see what the RBA has to say on the currency following their first meeting of the year on Tuesday, Governor Lowe speaking Wednesday and then the Statement on Monetary Policy due on Friday. As discussed in our ‘FX Soundbite’ note last Friday, the RBA is unlikely to see reason to elevate its concerns about AUD strength relative to what it said for much of 2017.
Table 1: AUD forecast revisions
Chart 1: AUD/USD STFV - sources of change
Chart 2: AUD/USD vs. 2yr AU-US swap rate
Chart 3: Stylised RBA real TWI model
Mar-18 Jun-18 Sep-18 Dec-18 Mar-19 Jun-19 Sep-19 Dec-19AUD/USD New 0.79 0.78 0.77 0.75 0.75 0.76 0.75 0.75
Old 0.73 0.72 0.73 0.73 0.75 0.76 0.76 0.75AUD/NZD New 1.08 1.08 1.08 1.07 1.07 1.06 1.06 1.07
Old 1.07 1.06 1.05 1.04 1.05 1.06 1.05 1.06AUD/JPY New 87 86 84 82 81 81 80 79
Old 84 83 85 86 87 88 87 86AUD/EUR New 0.63 0.61 0.59 0.58 0.59 0.59 0.59 0.58
Old 0.61 0.60 0.59 0.59 0.59 0.60 0.59 0.59AUD/GBP New 0.55 0.54 0.52 0.51 0.51 0.52 0.52 0.51
Old 0.52 0.51 0.51 0.51 0.52 0.53 0.52 0.52AUD/CNY New 4.96 4.88 4.77 4.64 4.65 4.70 4.67 4.68
Old 4.81 4.72 4.73 4.75 4.84 4.93 4.93 4.91Source: NAB
Global FX Strategist 5 February 2018
NAB Markets Research | 4
NZD: Headwinds ahead • Near-term NZD projections have been revised higher,
thanks to the bearish sentiment overhanging the USD, but our year-end target is unchanged at 0.70
The year has begun with bearish sentiment overhanging the USD which saw the NZD push up to fresh highs above 0.74. We have recently been fretting about USD weakness and wondering how much longer this would be sustained. However, last week’s price action, namely a much higher VIX index and wider credit spreads, saw our risk appetite index plunge from 85% to 70%, giving a taste of what might be in store for 2018. Lower risk appetite is a factor we’ve been highlighting for some time as a potential headwind for the NZD. Last week’s move is more consistent with our forecasts, which has the NZD ending the year at USD 0.70, not 0.80. It might be too early to ring the bell and remark decisively that a turning point has been reached for risk appetite. But the price action needs to be respected and increased market volatility may well become the norm for 2018. Compared to two months ago, our fair value estimate is still 0.72, with lower risk appetite offsetting higher commodity prices. Supporting the recovery in the NZD has been an appropriate fading of the domestic political risk premium that was embodied in the NZD at the end of last year. We’ve lifted our NZD forecasts, but more so at the short term horizon (3-9 months ahead) than the medium-term. Our central forecast of 0.72 through to mid-year reflects a middle ground between two opposing views – the possibility of the USD continuing to track lower against all and sundry through the next six months taking the NZD higher, or the possibility that the USD has been oversold, and a near-term correction ensues. Our year-end target is unchanged at 0.70. Thus our core view remains that the NZD will face some headwinds this year, based on the assumption that tighter global monetary policy will eventually lead to some doubts about the sustainability of global growth and result in even weaker risk appetite. This would support a revival of the USD, at least against commodity currencies. Lower NZ-US interest rate spreads through the year should act as a headwind for the NZD. We pushed out the expected timing of the first RBNZ rate hike to February 2019 following much weaker than expected Q4 NZ CPI and the stronger than expected NZD. NZ-US short term rate spreads have already pushed into negative territory and the risk points to further narrowing across the curve. In Thursday’s MPS we expect the RBNZ won’t deviate from its current neutral policy stance. The weaker CPI outturn, stronger NZD and a possible downgrade to GDP forecasts should mean downward pressure on the Bank’s CPI forecasts, while offsetting factors are a stronger housing market, stronger global backdrop and higher commodity prices. A new Governor takes over from late-March so one should avoid the trap of over-interpreting any changes to forecasts, including the projected rate track.
Chart 1: Forecast table
Chart 2: NZD Discount to Fair Value Now Closed
Chart 3: NZ-US 2-Year Swap Rate Now Negative
Chart 4: Core CPI Inflation Still Running Below Target
Mar-18 Jun-18 Sep-18 Dec-18 Mar-19 Jun-19 Sep-19 Dec-19
NZD/USD New 0.72 0.72 0.71 0.70 0.70 0.71 0.71 0.70
Old 0.68 0.68 0.69 0.70 0.71 0.72 0.72 0.71
AUD/USD New 0.79 0.78 0.77 0.75 0.75 0.76 0.76 0.75
Old 0.73 0.72 0.73 0.73 0.75 0.76 0.76 0.75
AUD/NZD New 1.09 1.08 1.08 1.07 1.07 1.07 1.06 1.07
Old 1.07 1.06 1.06 1.04 1.06 1.06 1.06 1.06
NZD/JPY New 80 79 77 76 76 76 75 74
Old 78 79 81 83 83 84 83 81
NZD/EUR New 0.58 0.56 0.55 0.54 0.55 0.56 0.55 0.54
Old 0.57 0.56 0.56 0.56 0.56 0.57 0.57 0.55
NZD/GBP New 0.50 0.50 0.48 0.47 0.48 0.49 0.49 0.48
Old 0.49 0.48 0.48 0.49 0.49 0.50 0.50 0.49
Source: NAB/BNZ
0.60
0.65
0.70
0.75
0.80
0.85
0.90
2012 2013 2014 2015 2016 2017 2018
Source: BNZ/NAB, Bloomberg
NZD/USD
Model Estimate
-1
0
1
2
3
4
5
6
0.30
0.40
0.50
0.60
0.70
0.80
0.90
2004 2006 2008 2010 2012 2014 2016 2018
Source: BNZ, Bloomberg
NZD/USD (lhs) NZ-US 2yr swap(rhs)
0
1
2
3
4
2005 2006 2007 2009 2010 2011 2013 2014 2015 2017
Source: NAB/BNZ, Bloomberg
Statistics NZ* Core CPI
RBNZ Core CPI (sectoral factor model)
y/y%
* avg of 4 official measures
Global FX Strategist 5 February 2018
NAB Markets Research | 5
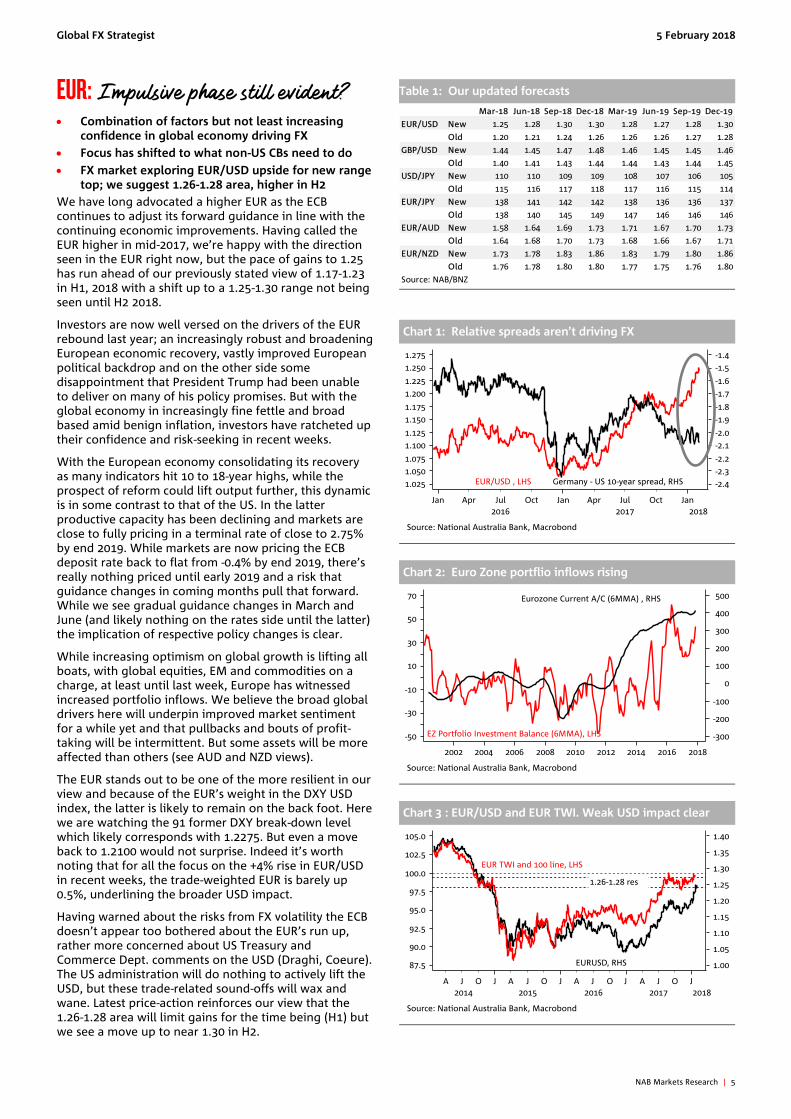
EUR: Impulsive phase still evident? • Combination of factors but not least increasing
confidence in global economy driving FX • Focus has shifted to what non-US CBs need to do • FX market exploring EUR/USD upside for new range
top; we suggest 1.26-1.28 area, higher in H2 We have long advocated a higher EUR as the ECB continues to adjust its forward guidance in line with the continuing economic improvements. Having called the EUR higher in mid-2017, we’re happy with the direction seen in the EUR right now, but the pace of gains to 1.25 has run ahead of our previously stated view of 1.17-1.23 in H1, 2018 with a shift up to a 1.25-1.30 range not being seen until H2 2018.
Investors are now well versed on the drivers of the EUR rebound last year; an increasingly robust and broadening European economic recovery, vastly improved European political backdrop and on the other side some disappointment that President Trump had been unable to deliver on many of his policy promises. But with the global economy in increasingly fine fettle and broad based amid benign inflation, investors have ratcheted up their confidence and risk-seeking in recent weeks.
With the European economy consolidating its recovery as many indicators hit 10 to 18-year highs, while the prospect of reform could lift output further, this dynamic is in some contrast to that of the US. In the latter productive capacity has been declining and markets are close to fully pricing in a terminal rate of close to 2.75% by end 2019. While markets are now pricing the ECB deposit rate back to flat from -0.4% by end 2019, there’s really nothing priced until early 2019 and a risk that guidance changes in coming months pull that forward. While we see gradual guidance changes in March and June (and likely nothing on the rates side until the latter) the implication of respective policy changes is clear.
While increasing optimism on global growth is lifting all boats, with global equities, EM and commodities on a charge, at least until last week, Europe has witnessed increased portfolio inflows. We believe the broad global drivers here will underpin improved market sentiment for a while yet and that pullbacks and bouts of profit-taking will be intermittent. But some assets will be more affected than others (see AUD and NZD views).
The EUR stands out to be one of the more resilient in our view and because of the EUR’s weight in the DXY USD index, the latter is likely to remain on the back foot. Here we are watching the 91 former DXY break-down level which likely corresponds with 1.2275. But even a move back to 1.2100 would not surprise. Indeed it’s worth noting that for all the focus on the +4% rise in EUR/USD in recent weeks, the trade-weighted EUR is barely up 0.5%, underlining the broader USD impact.
Having warned about the risks from FX volatility the ECB doesn’t appear too bothered about the EUR’s run up, rather more concerned about US Treasury and Commerce Dept. comments on the USD (Draghi, Coeure). The US administration will do nothing to actively lift the USD, but these trade-related sound-offs will wax and wane. Latest price-action reinforces our view that the 1.26-1.28 area will limit gains for the time being (H1) but we see a move up to near 1.30 in H2.
Table 1: Our updated forecasts
Chart 1: Relative spreads aren’t driving FX
Chart 2: Euro Zone portflio inflows rising
Chart 3 : EUR/USD and EUR TWI. Weak USD impact clear
Mar-18 Jun-18 Sep-18 Dec-18 Mar-19 Jun-19 Sep-19 Dec-19
EUR/USD New 1.25 1.28 1.30 1.30 1.28 1.27 1.28 1.30
Old 1.20 1.21 1.24 1.26 1.26 1.26 1.27 1.28
GBP/USD New 1.44 1.45 1.47 1.48 1.46 1.45 1.45 1.46
Old 1.40 1.41 1.43 1.44 1.44 1.43 1.44 1.45
USD/JPY New 110 110 109 109 108 107 106 105
Old 115 116 117 118 117 116 115 114
EUR/JPY New 138 141 142 142 138 136 136 137
Old 138 140 145 149 147 146 146 146
EUR/AUD New 1.58 1.64 1.69 1.73 1.71 1.67 1.70 1.73
Old 1.64 1.68 1.70 1.73 1.68 1.66 1.67 1.71
EUR/NZD New 1.73 1.78 1.83 1.86 1.83 1.79 1.80 1.86
Old 1.76 1.78 1.80 1.80 1.77 1.75 1.76 1.80
Source: NAB/BNZ
Global FX Strategist 5 February 2018
NAB Markets Research | 6
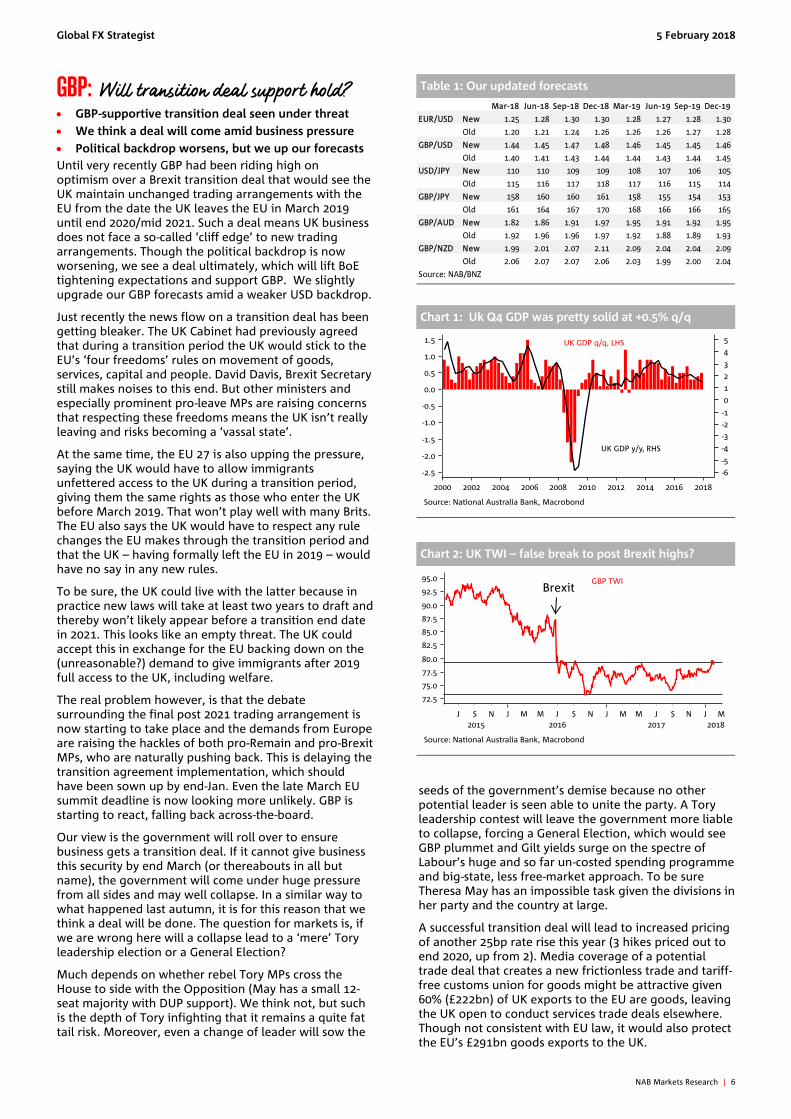
GBP: Will transition deal support hold? • GBP-supportive transition deal seen under threat • We think a deal will come amid business pressure • Political backdrop worsens, but we up our forecasts Until very recently GBP had been riding high on optimism over a Brexit transition deal that would see the UK maintain unchanged trading arrangements with the EU from the date the UK leaves the EU in March 2019 until end 2020/mid 2021. Such a deal means UK business does not face a so-called ‘cliff edge’ to new trading arrangements. Though the political backdrop is now worsening, we see a deal ultimately, which will lift BoE tightening expectations and support GBP. We slightly upgrade our GBP forecasts amid a weaker USD backdrop.
Just recently the news flow on a transition deal has been getting bleaker. The UK Cabinet had previously agreed that during a transition period the UK would stick to the EU’s ‘four freedoms’ rules on movement of goods, services, capital and people. David Davis, Brexit Secretary still makes noises to this end. But other ministers and especially prominent pro-leave MPs are raising concerns that respecting these freedoms means the UK isn’t really leaving and risks becoming a ‘vassal state’.
At the same time, the EU 27 is also upping the pressure, saying the UK would have to allow immigrants unfettered access to the UK during a transition period, giving them the same rights as those who enter the UK before March 2019. That won’t play well with many Brits. The EU also says the UK would have to respect any rule changes the EU makes through the transition period and that the UK – having formally left the EU in 2019 – would have no say in any new rules.
To be sure, the UK could live with the latter because in practice new laws will take at least two years to draft and thereby won’t likely appear before a transition end date in 2021. This looks like an empty threat. The UK could accept this in exchange for the EU backing down on the (unreasonable?) demand to give immigrants after 2019 full access to the UK, including welfare.
The real problem however, is that the debate surrounding the final post 2021 trading arrangement is now starting to take place and the demands from Europe are raising the hackles of both pro-Remain and pro-Brexit MPs, who are naturally pushing back. This is delaying the transition agreement implementation, which should have been sown up by end-Jan. Even the late March EU summit deadline is now looking more unlikely. GBP is starting to react, falling back across-the-board.
Our view is the government will roll over to ensure business gets a transition deal. If it cannot give business this security by end March (or thereabouts in all but name), the government will come under huge pressure from all sides and may well collapse. In a similar way to what happened last autumn, it is for this reason that we think a deal will be done. The question for markets is, if we are wrong here will a collapse lead to a ‘mere’ Tory leadership election or a General Election?
Much depends on whether rebel Tory MPs cross the House to side with the Opposition (May has a small 12-seat majority with DUP support). We think not, but such is the depth of Tory infighting that it remains a quite fat tail risk. Moreover, even a change of leader will sow the
seeds of the government’s demise because no other potential leader is seen able to unite the party. A Tory leadership contest will leave the government more liable to collapse, forcing a General Election, which would see GBP plummet and Gilt yields surge on the spectre of Labour’s huge and so far un-costed spending programme and big-state, less free-market approach. To be sure Theresa May has an impossible task given the divisions in her party and the country at large.
A successful transition deal will lead to increased pricing of another 25bp rate rise this year (3 hikes priced out to end 2020, up from 2). Media coverage of a potential trade deal that creates a new frictionless trade and tariff-free customs union for goods might be attractive given 60% (£222bn) of UK exports to the EU are goods, leaving the UK open to conduct services trade deals elsewhere. Though not consistent with EU law, it would also protect the EU’s £291bn goods exports to the UK.
Table 1: Our updated forecasts
Chart 1: Uk Q4 GDP was pretty solid at +0.5% q/q
Chart 2: UK TWI – false break to post Brexit highs?
Mar-18 Jun-18 Sep-18 Dec-18 Mar-19 Jun-19 Sep-19 Dec-19
EUR/USD New 1.25 1.28 1.30 1.30 1.28 1.27 1.28 1.30
Old 1.20 1.21 1.24 1.26 1.26 1.26 1.27 1.28
GBP/USD New 1.44 1.45 1.47 1.48 1.46 1.45 1.45 1.46
Old 1.40 1.41 1.43 1.44 1.44 1.43 1.44 1.45
USD/JPY New 110 110 109 109 108 107 106 105
Old 115 116 117 118 117 116 115 114
GBP/JPY New 158 160 160 161 158 155 154 153
Old 161 164 167 170 168 166 166 165
GBP/AUD New 1.82 1.86 1.91 1.97 1.95 1.91 1.92 1.95
Old 1.92 1.96 1.96 1.97 1.92 1.88 1.89 1.93
GBP/NZD New 1.99 2.01 2.07 2.11 2.09 2.04 2.04 2.09
Old 2.06 2.07 2.07 2.06 2.03 1.99 2.00 2.04
Source: NAB/BNZ
Brexit
Global FX Strategist 5 February 2018
NAB Markets Research | 7
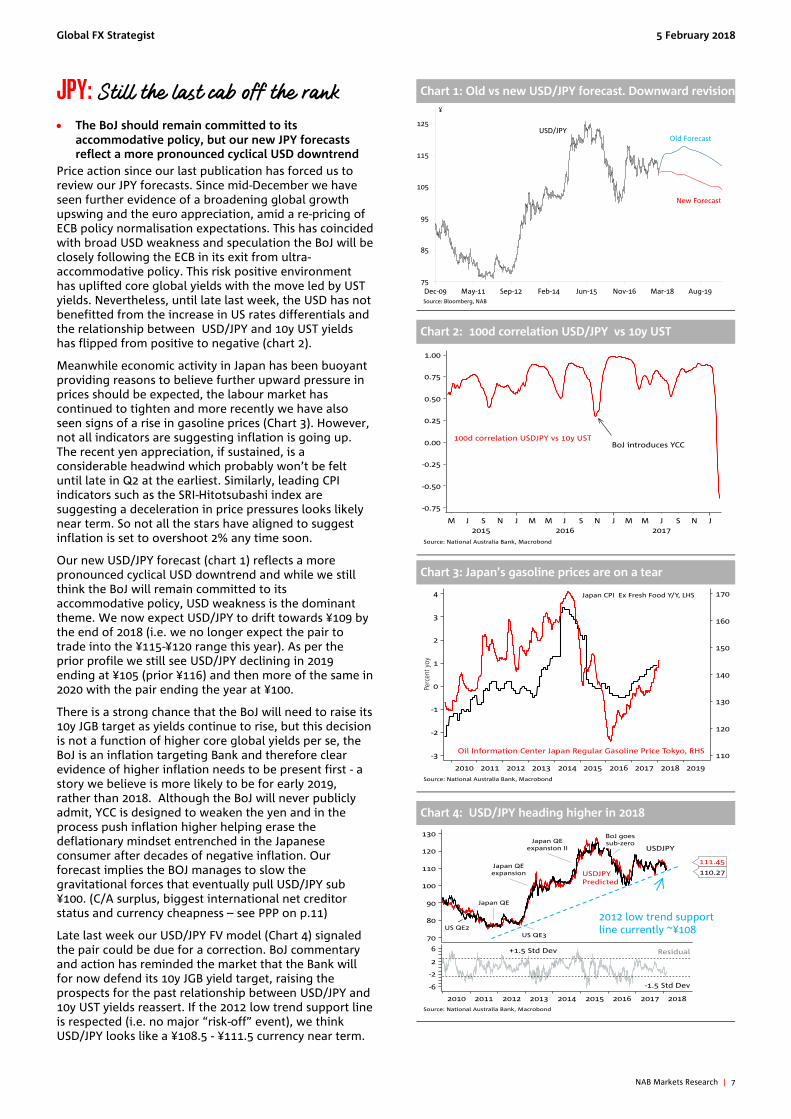
JPY: Still the last cab off the rank • The BoJ should remain committed to its
accommodative policy, but our new JPY forecasts reflect a more pronounced cyclical USD downtrend
Price action since our last publication has forced us to review our JPY forecasts. Since mid-December we have seen further evidence of a broadening global growth upswing and the euro appreciation, amid a re-pricing of ECB policy normalisation expectations. This has coincided with broad USD weakness and speculation the BoJ will be closely following the ECB in its exit from ultra-accommodative policy. This risk positive environment has uplifted core global yields with the move led by UST yields. Nevertheless, until late last week, the USD has not benefitted from the increase in US rates differentials and the relationship between USD/JPY and 10y UST yields has flipped from positive to negative (chart 2).
Meanwhile economic activity in Japan has been buoyant providing reasons to believe further upward pressure in prices should be expected, the labour market has continued to tighten and more recently we have also seen signs of a rise in gasoline prices (Chart 3). However, not all indicators are suggesting inflation is going up. The recent yen appreciation, if sustained, is a considerable headwind which probably won’t be felt until late in Q2 at the earliest. Similarly, leading CPI indicators such as the SRI-Hitotsubashi index are suggesting a deceleration in price pressures looks likely near term. So not all the stars have aligned to suggest inflation is set to overshoot 2% any time soon.
Our new USD/JPY forecast (chart 1) reflects a more pronounced cyclical USD downtrend and while we still think the BoJ will remain committed to its accommodative policy, USD weakness is the dominant theme. We now expect USD/JPY to drift towards ¥109 by the end of 2018 (i.e. we no longer expect the pair to trade into the ¥115-¥120 range this year). As per the prior profile we still see USD/JPY declining in 2019 ending at ¥105 (prior ¥116) and then more of the same in 2020 with the pair ending the year at ¥100.
There is a strong chance that the BoJ will need to raise its 10y JGB target as yields continue to rise, but this decision is not a function of higher core global yields per se, the BoJ is an inflation targeting Bank and therefore clear evidence of higher inflation needs to be present first - a story we believe is more likely to be for early 2019, rather than 2018. Although the BoJ will never publicly admit, YCC is designed to weaken the yen and in the process push inflation higher helping erase the deflationary mindset entrenched in the Japanese consumer after decades of negative inflation. Our forecast implies the BOJ manages to slow the gravitational forces that eventually pull USD/JPY sub ¥100. (C/A surplus, biggest international net creditor status and currency cheapness – see PPP on p.11)
Late last week our USD/JPY FV model (Chart 4) signaled the pair could be due for a correction. BoJ commentary and action has reminded the market that the Bank will for now defend its 10y JGB yield target, raising the prospects for the past relationship between USD/JPY and 10y UST yields reassert. If the 2012 low trend support line is respected (i.e. no major “risk-off” event), we think USD/JPY looks like a ¥108.5 - ¥111.5 currency near term.
Chart 1: Old vs new USD/JPY forecast. Downward revision
Chart 2: 100d correlation USD/JPY vs 10y UST
Chart 3: Japan’s gasoline prices are on a tear
Chart 4: USD/JPY heading higher in 2018
75
85
95
105
115
125
Dec-09 May-11 Sep-12 Feb-14 Jun-15 Nov-16 Mar-18 Aug-19
¥
Source: Bloomberg, NAB
USD/JPY
New Forecast
Old Forecast
2012 low trend support line currently ~¥108
Global FX Strategist 5 February 2018
NAB Markets Research | 8
NAB FX STRATEGY TARGETS
5-Feb-18 Mar-18 Jun-18 Sep-18 Dec-18 Mar-19 Jun-19 Sep-19 Dec-19 Mar-20 Jun-20 Sep-20 Dec-20
Majors
Australian Dollar AUD/USD 0.7909 0.79 0.78 0.77 0.75 0.75 0.76 0.75 0.75 0.75 0.74 0.74 0.73
New Zealand Dollar NZD/USD 0.7284 0.73 0.72 0.71 0.70 0.70 0.71 0.71 0.70 0.70 0.69 0.69 0.68
Japanese yen USD/JPY 110.28 110 110 109 109 108 107 106 105 105 103 102 100
Euro EUR/USD 1.2431 1.25 1.28 1.30 1.30 1.28 1.27 1.28 1.30 1.32 1.34 1.36 1.38
British Pound GBP/USD 1.4101 1.44 1.45 1.47 1.48 1.46 1.45 1.45 1.46 1.47 1.48 1.47 1.48
Swiss Franc USD/CHF 0.9327 0.93 0.92 0.90 0.91 0.91 0.93 0.93 0.92 0.92 0.90 0.89 0.88
Canadian Dollar USD/CAD 1.2443 1.23 1.22 1.24 1.25 1.23 1.21 1.22 1.22 1.24 1.26 1.28 1.29
Chinese New Yuan USD/CNY 6.3008 6.28 6.25 6.20 6.18 6.20 6.23 6.23 6.24 6.25 6.26 6.28 6.28
Australian Cross Rates
AUD/NZD 1.0858 1.08 1.08 1.08 1.07 1.07 1.06 1.06 1.07 1.07 1.07 1.07 1.07
AUD/JPY 87.22 87 86 84 82 81 81 80 79 79 76 75 73
AUD/EUR 0.6362 0.63 0.61 0.59 0.58 0.59 0.59 0.59 0.58 0.57 0.55 0.54 0.53
AUD/GBP 0.5609 0.55 0.54 0.52 0.51 0.51 0.52 0.52 0.51 0.51 0.50 0.50 0.49
AUD/CHF 0.7377 0.73 0.70 0.70 0.68 0.70 0.70 0.69 0.69 0.68 0.67 0.66 0.64
AUD/CAD 0.9841 0.97 0.95 0.95 0.94 0.92 0.91 0.92 0.92 0.93 0.93 0.95 0.94
AUD/SGD 1.0451 1.03 1.00 0.98 0.95 0.96 0.97 0.97 0.98 0.98 0.97 0.98 0.96
AUD/KRW 854.12 837 823 812 788 788 800 810 818 818 814 814 818
AUD/CNY 4.9833 4.96 4.88 4.77 4.64 4.65 4.70 4.67 4.68 4.69 4.63 4.65 4.58
Trade-Weighted Index AUD TWI 64.90 62.6 61.4 60.3 58.7 58.8 59.3 58.9 58.9 58.8 57.9 57.9 57.0
NZD/JPY 80.33 80 79 77 76 76 76 75 74 74 71 70 68
NZD/EUR 0.5860 0.58 0.56 0.55 0.54 0.55 0.56 0.55 0.54 0.53 0.51 0.51 0.49
NZD/GBP 0.5166 0.51 0.50 0.48 0.47 0.48 0.49 0.49 0.48 0.48 0.47 0.47 0.46
NZD/CHF 0.6794 0.67 0.65 0.65 0.64 0.65 0.66 0.65 0.64 0.63 0.62 0.61 0.60
NZD/CAD 0.9063 0.90 0.88 0.88 0.88 0.86 0.86 0.87 0.85 0.87 0.87 0.88 0.88
EUR/GBP 0.8816 0.87 0.88 0.88 0.88 0.88 0.88 0.88 0.89 0.90 0.91 0.93 0.93
EUR/CHF 1.1594 1.16 1.18 1.17 1.18 1.16 1.18 1.19 1.20 1.21 1.21 1.21 1.21
USD (DXY) 89.20 88.6 87.1 86.1 86.2 86.9 87.2 86.8 85.7 85.0 84.0 83.2 82.2
BBDXY 1124.15 1116 1106 1096 1098 1101 1101 1099 1091 1085 1078 1073 1066
Global FX Strategist 5 February 2018
NAB Markets Research | 9
CENTRAL BANK POLICY MONITOR
Current Rate
Last Change
Bias Next Meeting
NAB Forecast
Forecast Rate End 2018
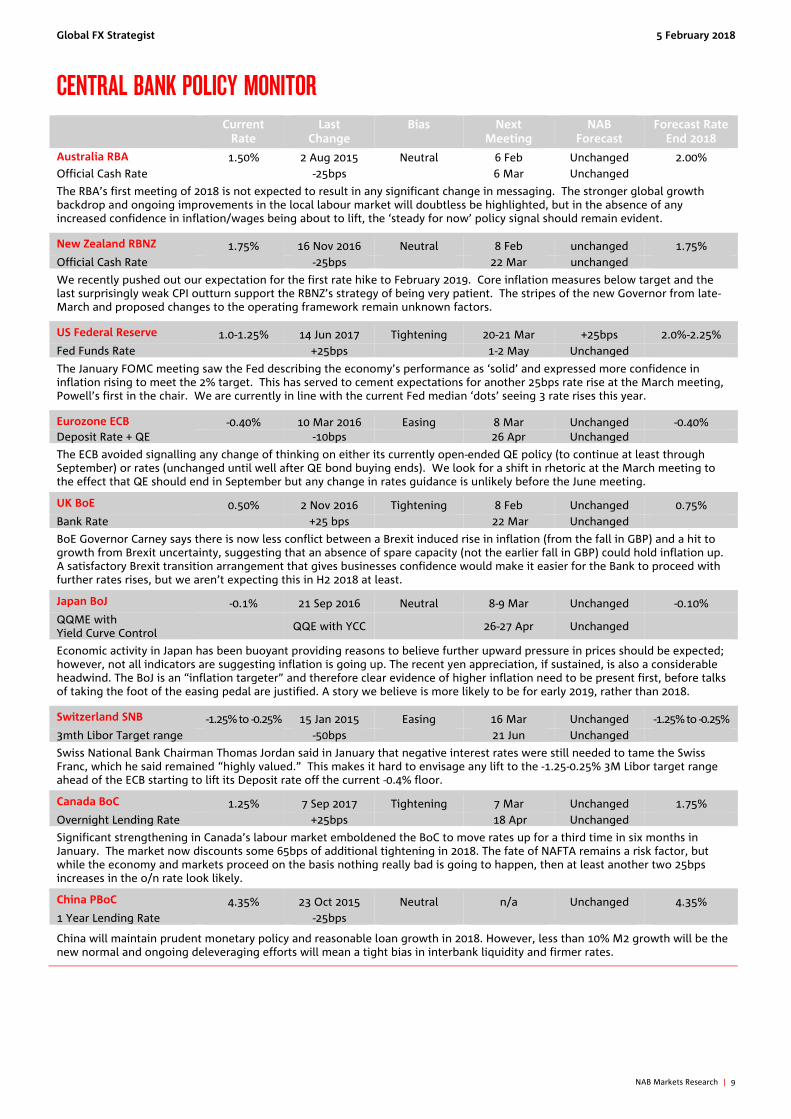
Australia RBA 1.50% 2 Aug 2015 Neutral 6 Feb Unchanged 2.00% Official Cash Rate -25bps 6 Mar Unchanged
The RBA’s first meeting of 2018 is not expected to result in any significant change in messaging. The stronger global growth backdrop and ongoing improvements in the local labour market will doubtless be highlighted, but in the absence of any increased confidence in inflation/wages being about to lift, the ‘steady for now’ policy signal should remain evident.
New Zealand RBNZ 1.75% 16 Nov 2016 Neutral 8 Feb unchanged 1.75% Official Cash Rate -25bps 22 Mar unchanged
We recently pushed out our expectation for the first rate hike to February 2019. Core inflation measures below target and the last surprisingly weak CPI outturn support the RBNZ’s strategy of being very patient. The stripes of the new Governor from late-March and proposed changes to the operating framework remain unknown factors.
US Federal Reserve 1.0-1.25% 14 Jun 2017 Tightening 20-21 Mar +25bps 2.0%-2.25% Fed Funds Rate +25bps 1-2 May Unchanged
The January FOMC meeting saw the Fed describing the economy’s performance as ‘solid’ and expressed more confidence in inflation rising to meet the 2% target. This has served to cement expectations for another 25bps rate rise at the March meeting, Powell’s first in the chair. We are currently in line with the current Fed median ‘dots’ seeing 3 rate rises this year.
Eurozone ECB -0.40% 10 Mar 2016 Easing 8 Mar Unchanged -0.40% Deposit Rate + QE -10bps 26 Apr Unchanged
The ECB avoided signalling any change of thinking on either its currently open-ended QE policy (to continue at least through September) or rates (unchanged until well after QE bond buying ends). We look for a shift in rhetoric at the March meeting to the effect that QE should end in September but any change in rates guidance is unlikely before the June meeting.
UK BoE 0.50% 2 Nov 2016 Tightening 8 Feb Unchanged 0.75% Bank Rate +25 bps 22 Mar Unchanged
BoE Governor Carney says there is now less conflict between a Brexit induced rise in inflation (from the fall in GBP) and a hit to growth from Brexit uncertainty, suggesting that an absence of spare capacity (not the earlier fall in GBP) could hold inflation up. A satisfactory Brexit transition arrangement that gives businesses confidence would make it easier for the Bank to proceed with further rates rises, but we aren’t expecting this in H2 2018 at least.
Japan BoJ -0.1% 21 Sep 2016 Neutral 8-9 Mar Unchanged -0.10% QQME with Yield Curve Control
QQE with YCC 26-27 Apr Unchanged
Economic activity in Japan has been buoyant providing reasons to believe further upward pressure in prices should be expected; however, not all indicators are suggesting inflation is going up. The recent yen appreciation, if sustained, is also a considerable headwind. The BoJ is an “inflation targeter” and therefore clear evidence of higher inflation need to be present first, before talks of taking the foot of the easing pedal are justified. A story we believe is more likely to be for early 2019, rather than 2018.
Switzerland SNB -1.25% to -0.25% 15 Jan 2015 Easing 16 Mar Unchanged -1.25% to -0.25% 3mth Libor Target range -50bps 21 Jun Unchanged
Swiss National Bank Chairman Thomas Jordan said in January that negative interest rates were still needed to tame the Swiss Franc, which he said remained “highly valued.” This makes it hard to envisage any lift to the -1.25-0.25% 3M Libor target range ahead of the ECB starting to lift its Deposit rate off the current -0.4% floor.
Canada BoC 1.25% 7 Sep 2017 Tightening 7 Mar Unchanged 1.75% Overnight Lending Rate +25bps 18 Apr Unchanged
Significant strengthening in Canada’s labour market emboldened the BoC to move rates up for a third time in six months in January. The market now discounts some 65bps of additional tightening in 2018. The fate of NAFTA remains a risk factor, but while the economy and markets proceed on the basis nothing really bad is going to happen, then at least another two 25bps increases in the o/n rate look likely.
China PBoC 4.35% 23 Oct 2015 Neutral n/a Unchanged 4.35% 1 Year Lending Rate -25bps
China will maintain prudent monetary policy and reasonable loan growth in 2018. However, less than 10% M2 growth will be the new normal and ongoing deleveraging efforts will mean a tight bias in interbank liquidity and firmer rates.
Global FX Strategist 5 February 2018
NAB Markets Research | 10
PPP ESTIMATES
0.30
0.50
0.70
0.90
1.10
Jan-00 Jan-03 Jan-06 Jan-09 Jan-12 Jan-15 Jan-18
AUD/USD
0.30
0.40
0.50
0.60
0.70
0.80
0.90
1.00
Jan-00 Jan-03 Jan-06 Jan-09 Jan-12 Jan-15 Jan-18
NZD/USD
0.90
1.00
1.10
1.20
1.30
1.40
Jan-00 Jan-03 Jan-06 Jan-09 Jan-12 Jan-15 Jan-
AUD/NZD
40
60
80
100
120
140
160
180
Jan-00 Jan-03 Jan-06 Jan-09 Jan-12 Jan-15 Jan-
USD/JPY
0.60
0.80
1.00
1.20
1.40
1.60
1.80
Jan-00 Jan-03 Jan-06 Jan-09 Jan-12 Jan-15 Jan-
EUR/USD
1.00
1.20
1.40
1.60
1.80
2.00
2.20
Jan-00 Jan-03 Jan-06 Jan-09 Jan-12 Jan-15 Jan-
GBP/USD
0.60
0.80
1.00
1.20
1.40
1.60
1.80
Jan-00 Jan-03 Jan-06 Jan-09 Jan-12 Jan-15 Jan-
USD/CAD
0.40
0.90
1.40
1.90
Jan-00 Jan-03 Jan-06 Jan-09 Jan-12 Jan-15 Jan-
USD/CHF
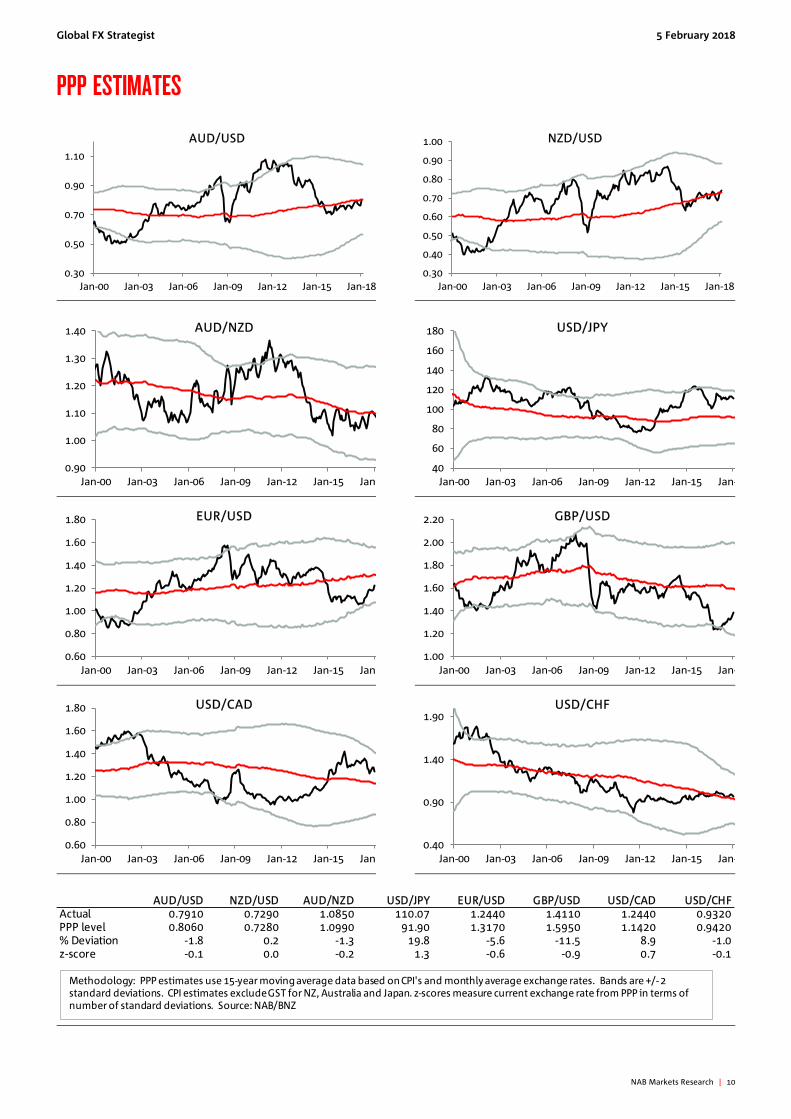
AUD/USD NZD/USD AUD/NZD USD/JPY EUR/USD GBP/USD USD/CAD USD/CHFActual 0.7910 0.7290 1.0850 110.07 1.2440 1.4110 1.2440 0.9320PPP level 0.8060 0.7280 1.0990 91.90 1.3170 1.5950 1.1420 0.9420% Deviation -1.8 0.2 -1.3 19.8 -5.6 -11.5 8.9 -1.0z-score -0.1 0.0 -0.2 1.3 -0.6 -0.9 0.7 -0.1
Methodology: PPP estimates use 15-year moving average data based on CPI's and monthly average exchange rates. Bands are +/- 2 standard deviations. CPI estimates exclude GST for NZ, Australia and Japan. z-scores measure current exchange rate from PPP in terms of number of standard deviations. Source: NAB/BNZ
Global FX Strategist 5 February 2018
NAB Markets Research | 11
FLOW AND BIS CHARTS
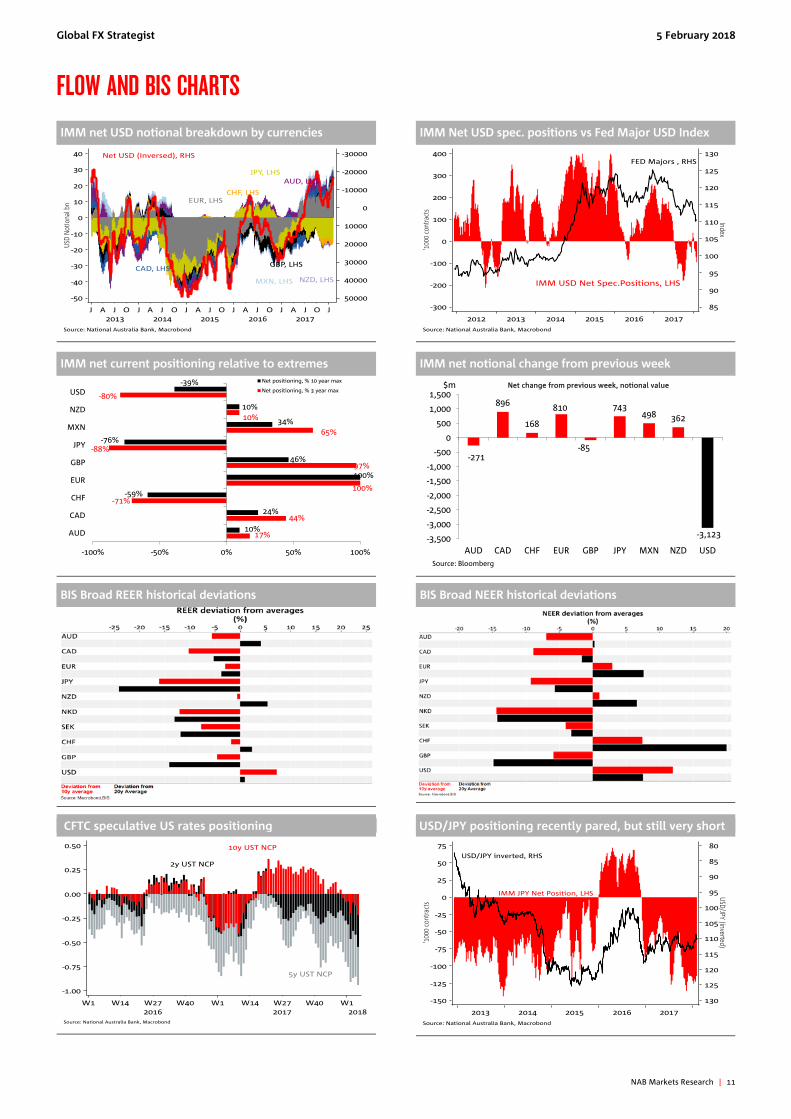
IMM net USD notional breakdown by currencies IMM Net USD spec. positions vs Fed Major USD Index
IMM net current positioning relative to extremes IMM net notional change from previous week
BIS Broad REER historical deviations BIS Broad NEER historical deviations
CFTC speculative US rates positioning
USD/JPY positioning recently pared, but still very short
17%
44%
-71%
100%
97%
-88%
65%
10%
-80%
10%
24%
-59%
100%
46%
-76%
34%
10%
-39%
-100% -50% 0% 50% 100%
AUD
CAD
CHF
EUR
GBP
JPY
MXN
NZD
USD
Net positioning, % 10 year max
Net positioning, % 3 year max
-271
896
168
810
-85
743498 362
-3,123-3,500
-3,000
-2,500
-2,000
-1,500
-1,000
-500
0
500
1,000
1,500
AUD CAD CHF EUR GBP JPY MXN NZD USD
$m Net change from previous week, notional value
Source: Bloomberg
Global FX Strategist 5 February 2018
NAB Markets Research | 12
CONTACT DETAILS
FX Strategy
Ray Attrill Head of FX Strategy +61 2 9237 1848 [email protected] Rodrigo Catril Senior FX Strategist +61 2 9293 7109 [email protected] Jason Wong Senior Markets Strategist +64 4 924 7652 [email protected] Christy Tan Head of Markets Strategy/Research, Asia +852 2822 5350 [email protected] Julian Wee Senior Markets Strategist, Asia +65 6632 8055 [email protected] Gavin Friend Senior Markets Strategist +44 207 710 1588 [email protected]
Markets Research
Peter Jolly Global Head of Research +61 2 9237 1406 [email protected]
Group Economics
Alan Oster Chief Economist +61 3 8634 2927 [email protected]
Important Notice This document has been prepared by National Australia Bank Limited ABN 12 004 044 937 AFSL 230686 ("NAB"). Any advice contained in this document has been prepared without taking into account your objectives, financial situation or needs. Before acting on any advice in this document, NAB recommends that you consider whether the advice is appropriate for your circumstances. NAB recommends that you obtain and consider the relevant Product Disclosure Statement or other disclosure document, before making any decision about a product including whether to acquire or to continue to hold it.
Please click here to view our disclaimer and terms of use.