Embed Size (px)
Citation preview

Biogeosciences, 8, 1181–1192, 2011www.biogeosciences.net/8/1181/2011/doi:10.5194/bg-8-1181-2011© Author(s) 2011. CC Attribution 3.0 License.
Biogeosciences
Global fungal spore emissions, review and synthesis of literaturedata
A. Sesartic and T. N. Dallafior
ETH Zurich, Institute for Atmospheric and Climate Science, 8092 Zurich, Switzerland
Received: 11 October 2010 – Published in Biogeosciences Discuss.: 18 November 2010Revised: 29 April 2011 – Accepted: 11 May 2011 – Published: 17 May 2011
Abstract. The present paper summarizes fungal spore emis-sion fluxes in different biomes. A literature study hasbeen conducted and emission fluxes have been calculatedbased on 35 fungal spore concentration datasets. Biomearea data has been derived from the World Resource In-stitute. Several assumptions and simplifications needed tobe adopted while aggregating the data: results from differ-ent measurement methods have been treated equally, whilediurnal and seasonal cycles have been neglected. More-over flux data were aggregated to very coarse biome areasdue to scarcity of data. Results show number fluxes persquare meter and second of 194 for tropical and subtropi-cal forests, 203 for all other forests, 1203 for shrub, 2509for crop, 8 for tundra, and 165 for grassland. No datawere found for land ice. The annual mean global fluxesamount to 1.69× 10⁻¹¹ kg m−2 s−1 as the best estimates,and 9.01× 10⁻¹² kg m−2 s−1 and 3.28× 10⁻¹¹ kg m−2 s−1
as the low and high estimate, respectively.
1 Introduction
Fungal spores are part of the bioaerosol population in our at-mosphere which also comprises components such as pollen,bacteria or viruses. Interest in bioaerosols is mainly relatedto their health effects, agriculture, ice nucleation and clouddroplet activation or atmospheric chemistry (Ariya et al.,2009). In the present study, the focus lies on fungal aerosols.
Measurements of fungal aerosols report average groundlevel concentrations of around 10 000–50 000 spores m−3,sometimes even exceeding 200 000 spores m−3 (Levetin,1995). This is two orders of magnitude higher than observed
Correspondence to:A. Sesartic([email protected])
peak pollen concentrations (1000–2000 grains m−3) (Man-drioli, 1998). Froehlich-Nowoisky et al.(2009) also statethat up to 45 % of the coarse particle mass in tropical rain-forest air consists of fungal spores.Elbert et al.(2007) foundthat fungal spores are the main contributor to the bioaerosolmass in the Amazon basin. Simulations conducted byHealdand Spracklen(2009) came to the conclusion that 23 % of allprimary emissions of organic aerosol are of fungal origin. In-vestigations ofBauer et al.(2002b) have shown that “5.8 %of the organic carbon in the coarse aerosol mode” was dueto fungal spores and bacteria. When sampling bioaerosols atthe Rothampsted Experimental Station in the south of Eng-land, Gregory (1978) found that they mainly consisted offungal spores; nearly half of a fair weather sample consistedof Cladosporiumspores (a mould) and only one percent ofall bioaerosols were plant pollen. These findings show thatfungal spores are an non-negligible part of the atmosphericaerosol. Fungi are even found in marine habitats where theyare important decomposers of plant substrates (Hyde et al.,1998). As marine fungal spore emission observations arelacking so far, this biome has not been further taken accountof in this review.
The primary source of fungal aerosols are plants (Burgess,2002), soil, litter and decaying organic matter (Heald andSpracklen, 2009). Release mechanisms of fungal spores arenumerous and vary from species to species (Elbert et al.,2007; Gregory, 1967, 1973; Levetin, 1995; Jones and Harri-son, 2004; Madelin, 1994; Hirst, 1953). Generally, release ofspores is highly dependent on meteorological factors. Somerequire rather humid conditions whereas others favour dryand windy conditions for spore release. Several studies havebeen conducted on the relationship between meteorologicalfactors and spore concentrations. Significant correlations be-tween spore counts and wind speeds could be found (Gliksonet al., 1995) as well as a positive correlation ofAlternariaspore counts with temperature (Burch and Levetin, 2002).
Published by Copernicus Publications on behalf of the European Geosciences Union.

1182 A. Sesartic and T. N. Dallafior: Global fungal spore emissions
Stepalska and Wolek(2009) on the other hand could not finda significant correlation of spore concentrations with weatherconditions for most species investigated in their study. It ishence difficult to predict which and how many spores are re-leased according to weather conditions.
As for their transport behaviour, most of the spores donot travel very long distances. As calculations byGregory(1962) have shown only a fraction of about 10 % of all re-leased fungal spores is transported farther away than 100m.This fraction is called the “escape fraction”. The measuredconcentrations are a blend of local emissions and advectedspores. It is difficult to distinguish between those two groups.A possible distinction criterion might be the size or shapesince larger particles are deposited more easily than smallerones. However,Heald and Spracklen(2009) note that thelarger size fraction is less well investigated due to measure-ment device constraints. The farther away the sampling de-vice is from the spore source, the more is the measured con-centration influenced by deposition and other processes. Thiscan lead to devices in immediate proximity to the groundmeasuring the actually emitted spore numbers, whereas otherdevices on higher levels might measure the escape fractiononly. As most observational data was taken further awayfrom the ground, we assume our estimate to represent theescape fraction.
Wind speed, temperature, atmospheric pressure or precipi-tation are important conditions determining transport and de-position of the dispersed aerosols (Hirst et al., 1967). Thereis evidence that fungal spores can also be transported overlong distances (Griffin et al., 2006, 2001; Prospero et al.,2005) before they are deposited either due to gravity, wash-out by rain or impaction (Gregory, 1967). Among others,Prospero et al.(2005) found fungal spores originating fromthe African desert to influence the prevailing fungal sporeconcentrations on the Virgin Islands in the Caribbean.
Some fungal spores can act as very effective ice nucle-ators. Lichen were found to nucleate ice at temperatureshigher than−8◦C and some even at temperatures higherthan −5◦C (Kieft, 1988). The lichen fungusRhizoplacachrysoleucawas even found to be an active ice nucleusat temperatures as high as−2◦C (Kieft, 1988; Kieft andRuscetti, 1990). To date, only a few fungus species have beenfound to be active ice nucleators: besides the above men-tioned lichen these areFusarium avenaceumandFusariumacuminatum(Pouleur et al., 1992). The ice nucleating activ-ity of F. avenaceumis comparable to that of the bacteriumPseudomonassp. (Pouleur et al., 1992). In contrast to thosefindings is the recent research byIannone et al.(2011) thatshowed poor ice nucleation ability ofCladosporiumspores,with immersion freezing starting at−28.5◦C. This might bedue to the spores being coated with hydrophobic proteins thatare widespread in filamentous fungi such asCladosporiumsp. Additionally, fungal aerosols are likely to be effectivecloud condensation nuclei, but data on behalf of this is stillscarce.
Recent field measurements have highlighted the impor-tance of bioaerosols as ice nucleators in the atmosphere,e.g. Pratt et al.(2009) and Prenni(2009). Relying on theabove evidence, there is probably a link between meteoro-logical conditions and fungal spores as well. On the onehand, fungal spores acting as ice nuclei might influence cloudand precipitation formation process, as has already been pro-posed byMorris et al. (2004) in general for biological icenuclei. On the other hand, changes in climatic conditionsalso alter the meteorological situation on a smaller time scalewhich in turn might influence fungal spore release as wellas transport according to the respective release mechanism.These possible interactions with the weather and climate sys-tem as well as the fact that fungi are one of the major con-tributors to global bioaerosols makes it crucial to gain moreknowledge about the circumstances and amounts in whichthey are emitted as well as their transport behaviour. Manystudies have already focused on sampling of fungal sporesin order to estimate their concentration in the atmosphere.However, a standardised procedure in order to do so is stillmissing which leads to very heterogeneous and hardly com-parable results.
The goal of this paper is to review the available literaturedata on fungal spores and estimate global fungal spore emis-sions by biome area. Available literature is reviewed and dataprovided used to derive the respective fungal spore fluxes formajor ecoregions. Moreover, measurement methods are re-viewed and discussed.
2 Data and methods
A review of available fungal spore concentration data hasbeen undertaken. Fungal spore concentration data have beenassigned to an ecosystem and converted to surface numberand mass fluxes. More than 150 studies have been reviewedof which 35 have been found to contain data relevant for thisstudy, and thus were taken into account for flux calculations.Exclusion criteria were a lack of information about measure-ment sites, biomes, measurement period, only absolute sporecounts considered instead of concentrations, and petri dishsamplings.
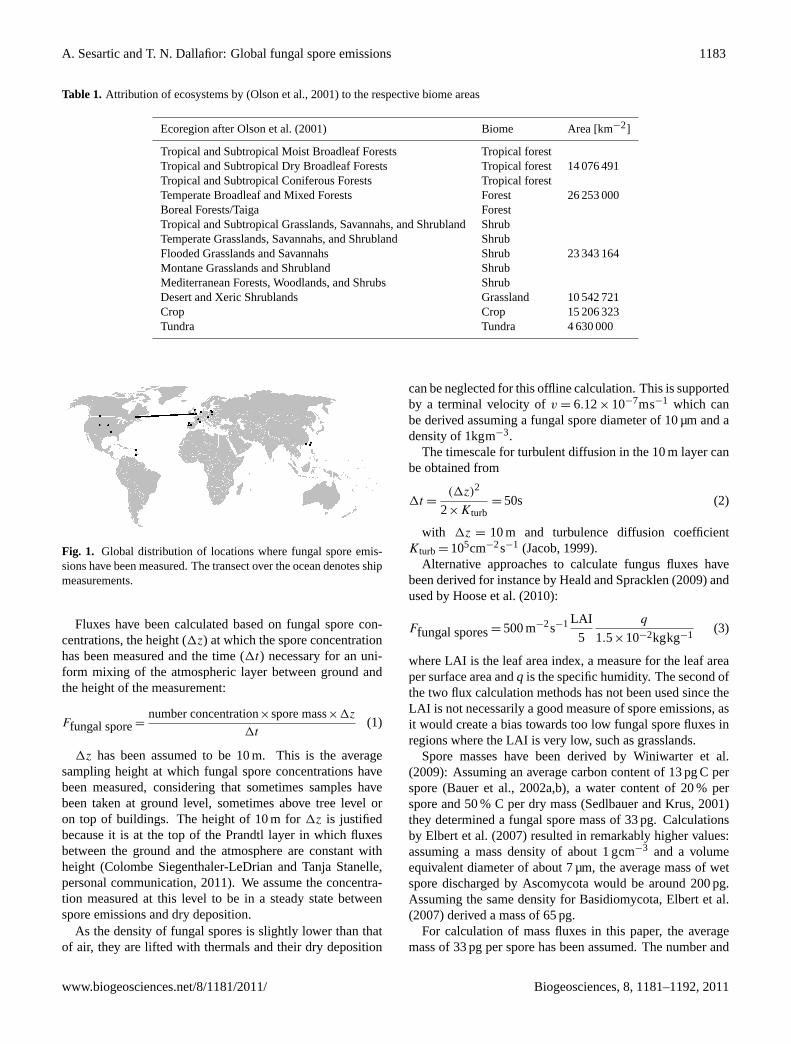
The biome areas byOlson et al.(2001) have been used forecosystem classification. But since data points were not suf-ficiently dense, broader definitions of the respective biomeshad to be taken. These ecoregions covered tropical and non-tropical forests, shrub, grass, crop, tundra and land ice (databased on (World Resource Institute, 2003a,b)). Attribution ofthe respective ecoregions byOlson et al.(2001) to the biomeareas used here has been done according to Table 1. Thebiome “crop” was used when the studies mentioned closeproximity to agriculture land. Effects of urban environmentswere not taken into account. Biome area data has been de-rived from World Resource Institute(2003a,b). Figure 1shows the global distribution of available measurement data.
Biogeosciences, 8, 1181–1192, 2011 www.biogeosciences.net/8/1181/2011/
A. Sesartic and T. N. Dallafior: Global fungal spore emissions 1183
Table 1. Attribution of ecosystems by (Olson et al., 2001) to the respective biome areas
Ecoregion afterOlson et al.(2001) Biome Area [km−2]
Tropical and Subtropical Moist Broadleaf Forests Tropical forestTropical and Subtropical Dry Broadleaf Forests Tropical forest 14 076 491Tropical and Subtropical Coniferous Forests Tropical forestTemperate Broadleaf and Mixed Forests Forest 26 253 000Boreal Forests/Taiga ForestTropical and Subtropical Grasslands, Savannahs, and Shrubland ShrubTemperate Grasslands, Savannahs, and Shrubland ShrubFlooded Grasslands and Savannahs Shrub 23 343 164Montane Grasslands and Shrubland ShrubMediterranean Forests, Woodlands, and Shrubs ShrubDesert and Xeric Shrublands Grassland 10 542 721Crop Crop 15 206 323Tundra Tundra 4 630 000
Fig. 1. Global distribution of locations where fungal spore emis-sions have been measured. The transect over the ocean denotes shipmeasurements.
Fluxes have been calculated based on fungal spore con-centrations, the height (1z) at which the spore concentrationhas been measured and the time (1t) necessary for an uni-form mixing of the atmospheric layer between ground andthe height of the measurement:
Ffungal spore=number concentration×spore mass×1z
1t(1)
1z has been assumed to be 10 m. This is the averagesampling height at which fungal spore concentrations havebeen measured, considering that sometimes samples havebeen taken at ground level, sometimes above tree level oron top of buildings. The height of 10 m for1z is justifiedbecause it is at the top of the Prandtl layer in which fluxesbetween the ground and the atmosphere are constant withheight (Colombe Siegenthaler-LeDrian and Tanja Stanelle,personal communication, 2011). We assume the concentra-tion measured at this level to be in a steady state betweenspore emissions and dry deposition.
As the density of fungal spores is slightly lower than thatof air, they are lifted with thermals and their dry deposition
can be neglected for this offline calculation. This is supportedby a terminal velocity ofv = 6.12× 10⁻⁷ms−1 which canbe derived assuming a fungal spore diameter of 10 µm and adensity of 1kgm−3.
The timescale for turbulent diffusion in the 10 m layer canbe obtained from
1t =(1z)2
2×Kturb= 50s (2)
with 1z = 10 m and turbulence diffusion coefficientKturb= 105cm−2s−1 (Jacob, 1999).
Alternative approaches to calculate fungus fluxes havebeen derived for instance byHeald and Spracklen(2009) andused byHoose et al.(2010):
Ffungal spores= 500 m−2s−1 LAI
5
q
1.5×10⁻²kgkg−1(3)
where LAI is the leaf area index, a measure for the leaf areaper surface area andq is the specific humidity. The second ofthe two flux calculation methods has not been used since theLAI is not necessarily a good measure of spore emissions, asit would create a bias towards too low fungal spore fluxes inregions where the LAI is very low, such as grasslands.
Spore masses have been derived byWiniwarter et al.(2009): Assuming an average carbon content of 13 pg C perspore (Bauer et al., 2002a,b), a water content of 20 % perspore and 50 % C per dry mass (Sedlbauer and Krus, 2001)they determined a fungal spore mass of 33 pg. Calculationsby Elbert et al.(2007) resulted in remarkably higher values:assuming a mass density of about 1 gcm−3 and a volumeequivalent diameter of about 7 µm, the average mass of wetspore discharged by Ascomycota would be around 200 pg.Assuming the same density for Basidiomycota,Elbert et al.(2007) derived a mass of 65 pg.
For calculation of mass fluxes in this paper, the averagemass of 33 pg per spore has been assumed. The number and
www.biogeosciences.net/8/1181/2011/ Biogeosciences, 8, 1181–1192, 2011

1184 A. Sesartic and T. N. Dallafior: Global fungal spore emissions
Table 2. Number fluxes of fungal spores per square metre of biomeand second [m−2 s−1].
Biome low estimate best estimate high estimate
Tropical forest 93 194 458Forest 31 214 387Shrub 37 1203 3472Grassland 14 165 1111Crop 2469 2509 2549Tundra 1 8 15
mass fluxes are listed once per second and once per secondand square meter of the specific biome. Global averages arederived by taking the mean of the respective values for eachbiome area.
The following assumptions have been made for the fluxcalculations:
– Seasonal or daily cycles do not influence the measuredspore concentrations.
– There is no difference between colony forming units(CFU) and total counts.
– Due to data scarcity the measurements taken at spe-cific ecosystems were summarised in broader categories(cf. Table 1).
– Similar assumptions have been made for the otherbiome regions.
Best estimates have been calculated from all average sporeconcentration data available.Lau et al.(2006) are the onlyresearchers that have expressed their data with the geometricmean instead of the arithmetic mean. Since the difference be-tween the geometric mean and the arithmetic mean are small,they have been treated in the same manner. It should be notedthat for the low and high estimates of crop emissions, onlyone measurement result was available. Where no averageconcentrations were provided, the average between the max-imum and minimum spore concentrations (if available) hasbeen taken instead. The high and low estimates are the av-erages of all minimum and maximum spore counts (whereavailable). In the optimum case, total spore counts were pro-vided covering all identifiable species. However, in somestudies, only certain genera were investigated. Where sporecounts had been split according to species, the sum over allhas been taken in order to get as close as possible to the num-ber of total counts.
Table 2 shows the aggregated number fluxes of fungalspores per square metre of biome and second, while Table 3shows the respective mass fluxes in kg per square metre andsecond. The biome area with the largest fungal spore fluxis crop followed by shrub, tropical and non-tropical forest,grassland and tundra in descending order. This can also be
Table 3. Mass fluxes of fungal spores per square metre of biomeand second [kgm−2s−1].
Biome low estimate best estimate high estimate
Tropical forest 3.06× 10⁻¹² 6.40× 10⁻¹² 1.51× 10⁻¹¹
Forest 1.02× 10⁻¹² 7.08× 10⁻¹² 1.28× 10⁻¹¹
Shrub 1.22× 10⁻¹² 3.97× 10⁻¹¹ 1.15× 10⁻¹⁰
Grassland 4.65× 10⁻¹³ 5.44× 10⁻¹² 3.67× 10⁻¹¹
Crop 8.15× 10⁻¹¹ 8.28× 10⁻¹¹ 8.41× 10⁻¹¹
Tundra 4.49× 10⁻¹⁴ 2.62× 10⁻¹³ 4.79× 10⁻¹³
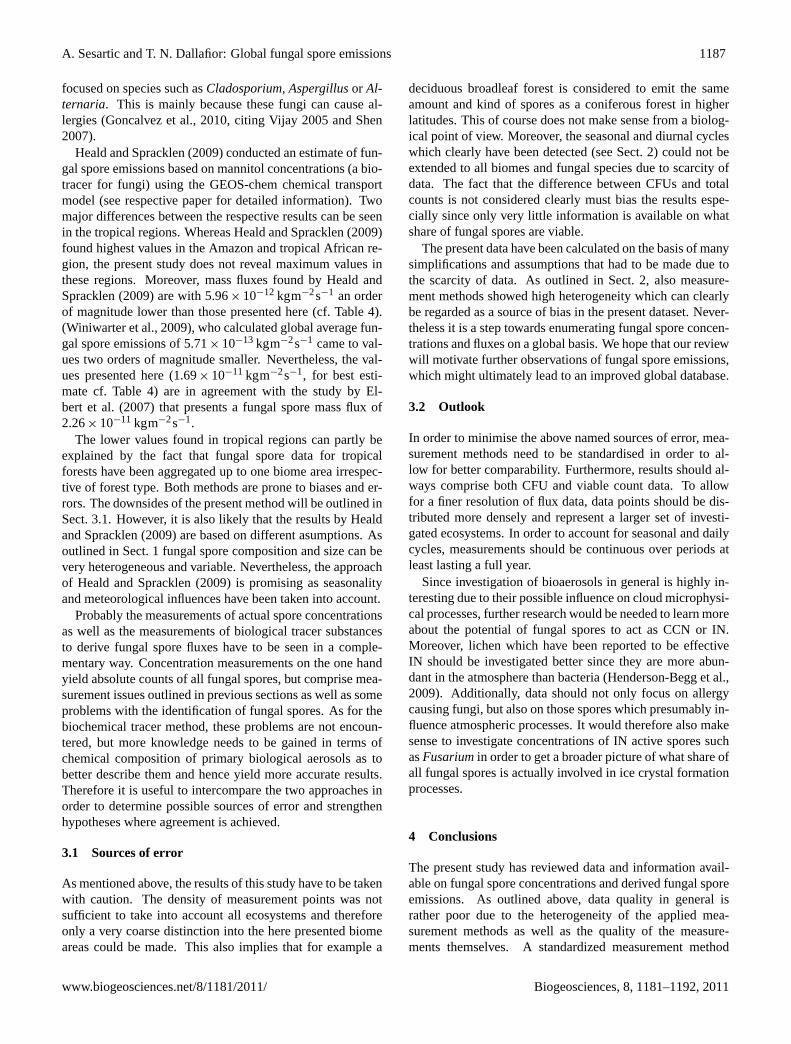
Fig. 2. Best estimate weighted annual mean fungal spore numberflux in m−2 s−1.
seen in Fig. 2, showing the fungal number flux, which wasproduced by combining the best estimates of reviewed fungalspore data with the plant functional types from the JSBACHdynamic vegetation model (Raddatz et al., 2007).
As for the prevalence of different spore genera, most ofthe studies agree thatCladosporiummake up a very dom-inant part of the fungal spore air spora, e.g.Sakiyan andInceoglu (2003); Mallo et al. (2010). Other species suchas Alternaria, Aspergillus, Ganoderma, Agaricus, Copri-nus, Leptosphaeriaor smuts and rusts have been consid-ered as important constituents, but usually showed muchlower concentrations thanCladosporium(e.g. Sakiyan andInceoglu, 2003; Mallo et al., 2010). Based on literature stud-ies,Goncalvez et al.(2010) concluded thatAsperigllus, Al-ternaria andPenicillium were predominant in hot climates,whereasCladosporiumspores were found to be most abun-dant in temperate climatic regimes.
2.1 Review of measurement methods
The simplest method to measure airborne fungal spores isto expose sticky surfaces or petri dishes and then count ei-ther all detectable fungal spores or, in the case of petridishes, the colony forming units (CFU). This method hasfor instance been used byBhati and Gaur(1979) or
Biogeosciences, 8, 1181–1192, 2011 www.biogeosciences.net/8/1181/2011/

A. Sesartic and T. N. Dallafior: Global fungal spore emissions 1185
Abu-Dieyeh et al.(2010). The obtained sample results areuseful in order to get a qualitative impression of the compo-sition of the prevailing air spora. However,Gregory(1952)pointed out that these data imply the “tacit assumption thatthe relation between the number of particles suspended in theair flowing over the surface and the number deposited on thesurface is known”.Gregory(1952) further argue that thesesimple rules would only apply for still air. According to theauthors of the study, the efficiency of a sticky surface to col-lect fungal spores rather varies with wind speed and subse-quently number concentrations per unit volume are difficultto obtain.Gregory(1952) note, that a good sampling devicedraws in “a known volume of air without altering its sporecontent, removes all particles over the 2–100 µm size range,and leaves them in a form in which they can be examined,counted and classified”.
Hirst (1952) described the features a measurement deviceshould have in order to give useful results: Besides the abil-ity of assessing the spore concentration per unit volume ofair, it should also be possible to measure in distinct time in-tervals to better correlate concentrations with meteorologicalconditions. He designed a spore trap that was able to suck inair and subsequently impact the contained spores on a stickysurface. The principle of suction increases, asHirst (1952)argues, the efficiency of filtration and impaction. However,he also found that this does not guarantee for the air massesentering the trap being representative of the actual spore load(collection efficiency). To counteract this problem,Hirst(1952) proposed that air should be sampled isokineticallyand that the orifice should always be directed into the air-stream. In order to get a distinction in time, a sticky slide ismoved slowly past the orifice (Hirst, 1952). As suction ratesare constant, trapping efficiencies change with wind speeds(Hirst, 1953).
Recent methods take advantage of biochemical propertiesof fungal spores.Elbert et al.(2007) for instance use man-nitol (a component of fungal cell membranes) as a fungalbiomarker to determine their prevalence in air masses.Baueret al. (2008) rely on other biochemical tracers such as man-nitol or arabitol to measure the fungal spore content in theprecipitation.
A review of the available studies of spore concentrationsshowed that the measurement methods applied were diverse.As outlined above, data from measurements with petri disheshave not been included in the flux calculations for this paperdue to the above named reasons. The trapping efficiency ofpetri dishes is no higher than 5 % which is remarkably lowerthan the 80 % trapping efficiency of a Hirst trap (Davies et al.,1963, citing Gregory and Stedman, 1953).
Among the data sets used for calculations, many of theresearchers relied on the Hirst-type spore trap as describedabove, e.g. (Davies et al., 1963; Hamilton, 1959; Rodrıguez-Rajo et al., 2005; Oliveira et al., 2009; Mallo et al., 2010;Levetin and Dorsey, 2006; Herrero et al., 2006; Wu et al.,2004; Stepalska and Wolek, 2009; Kasprzyk and Worek,
2006; Sakiyan and Inceoglu, 2003). Among these, mostlymodels from Lanzoni (VPPS 2000) (Lanzoni, 2010) orBurkard (Burkard Scientific, 2000) were used. Others re-lied on Filterhousings containing 2 µm filter membranes,e.g.Prospero et al.(2005); Griffin et al. (2001, 2003, 2007),for their measurement. Another device sometimes used wasthe May Cascade Impactor (May, 1945). However, this de-vice was found to have a considerably lower trapping ef-ficiency for small spores than the Volumetric Spore Trap(Hirst, 1953). Only a few of the studies monitored the fungalspore content in cloud droplets or precipitation (Amato et al.,2007; Bauer et al., 2002a) and some other measurement de-vices and methods apart from those named above have beenused as well (for detailed information on measurement meth-ods see Table A1 in the appendix).
The measurement duration varied from a few minutes tocontinuous measurements seven days a week (especially ap-plied for the Hirst-type spore traps). Also the time span overthe year varied from study to study: some only measured onone single day, e.g.Cote et al.(2008), others even over sev-eral years continuously, e.g.Mallo et al.(2010).
Besides the heterogeneity of the used measurement de-vices also the airflow varied from 1.9 lmin−1 (Griffin et al.,2001) up to 1.13 m3min−1 (Lau et al., 2006). An airflow of10 lmin−1 seems to be the most commonly used value forsuch measurements. Moreover it was difficult to retrieve theairflow rates from all studies. The correct choice of airflow isan important factor for spore measurements since measure-ments that are not conducted isokinetically can lead to re-markable biases in spore counts.
Furthermore the height at which the devices had been in-stalled was not the same in the respective studies. Some usedair samples in heights up to several kilometres, whereas otherconducted ground-based measurements in heights from 2 mup to 50 m. When considering spore dispersal from a bound-ary layer meteorological point of view, the choice of the mea-surement height might be crucial since it decides on whethermeasurements are taken within or outside the turbulent layer.
The situation is alike for the different impaction mediachosen: whereas those using the Lanzoni Hirst-type sporetrap rely on so-called Melinex tape which is mounted afterspore collection with glycerol jelly, others use different sur-faces. The same situation can be found when it comes to theuse of nutrient media for growth of the trapped fungal spores(viable counts). Some rely on R2A agar, others on YM(yeast-morphology) agar, others on Sabouraud’s medium forfungi or malt-agar extract, etc. The possibilities for fungusincubation for viable counts are numerous. Incubation timesvary from two days up to two weeks and longer and so doalso the incubation temperatures applied. Moreover, count-ing methods are not the same in all studies. Some use opti-cal methods such as microscopy or macroscopy with differ-ent magnifications (ranging from 40x−1000x) while othersuse Polymerase Chain Reaction (PCR) to determine generaand species from their genome. As for the nutrient medium
www.biogeosciences.net/8/1181/2011/ Biogeosciences, 8, 1181–1192, 2011

1186 A. Sesartic and T. N. Dallafior: Global fungal spore emissions
chosen, bothAbdel-Hafez et al.(1985) and Abdel-Hafezet al.(1986) conclude that the choice of nutrient medium hadan influence on the prevalence of respective species counted.
To sum up, the measurement methods differ at many stagesof the measurement and counting process: The counting de-vice, the airflow chosen, the placement of the sampling de-vice, the sticky medium, the nutrient medium (for viablecounts), the incubation duration and the counting method.It is crucial to introduce a convention on how to exactly mea-sure fungal spores in the atmosphere in order to prevent bi-ases due to different measurement methods and to increasecomparability of results.
2.2 CFU vs. total spore count
Not all studies have investigated both the total count of allspores available and the counts of viable spores called colonyforming units (CFU) after incubation. However, this wouldbe an important source of information on what share of theatmospheric fungal spora is viable and which is not (Gre-gory, 1967). In very few of the studies, both the viable andtotal counts of spores have been investigated, e.g.Lau et al.(2006); Pady and Kapica(1955); Griffin et al. (2001); Baueret al.(2002a). All other studies either published total sporesor only CFUs. In order to assess their activity as CCN or INit is not relevant whether they are alive or not. The importantfeature is the shape and presence of the active proteins whichactually act as nuclei (Kieft and Ruscetti, 1990). Therefore,it is not the viability of the fungal spore that affects its INactivity, but whether the ice nucleation active proteins on itssurface are denatured or not. If the protein conformation isintact, it can trigger the ice nucleation, regardless of the cell’sviability. However, it is important that the cell has been aliveat one point in order to produce the ice nucleation proteinsin the first place. Therefore it is all the more important toevaluate total counts instead of only viable counts in order toinclude all possible IN present on the spore surface.
Pady and Kapica(1955) found that silicone slides exposedin a slit sampler revealed spore counts a manifold higherthan those of plates exposed at the same time where CFUshad been counted. This could be explained by a remarkablebias between viable and total spore counts.Gregory(1967)found that viability ofAlternaria spores averaged at 80 %and that ofCladosporiumspores at 42 % with viability de-creasing at midday. Hence, viability varies from species tospecies. Other sources reportCladosporiumviability to beon average at 62 % (Pady and Gregory, 1963). Experimentsby Harvey(1967) investigated viability ofCladosporiumandcame to the conclusion that single spores germinate morereadily than clumps of spores. Moreover they also found adiurnal cycle in germination that reached maximum valuesbetween 10:00 UTC and 18:00 UTC and minimum values at02:00 UTC. However, the authors also state that this cyclical-ity of viability is in disagreement with the findings byPathakand Pady(1965). Bauer et al.(2002a) estimated the total vi-
Table 4. Weighted average number [m−2s−1] and mass[kgm−2s−1] fluxes of fungal spore emissions over land.
low estimate best estimate high estimate
number flux 273 513 995mass flux 9.01× 10⁻¹² 1.69× 10⁻¹¹ 3.28× 10⁻¹¹
ability of the sampled bacteria and fungi to be around 87 %using the condition of the cell wall as a criterion to determineviability. Analysis of snow samples then showed that the cul-tivable part of fungi amounted only up to 0.7 % (Bauer et al.,2002a). This seems a very low number, but it is sensibleconsidering the fact that these spores already had to survivevery harsh conditions within the ice crystals or even duringprecipitation formation processes.Fisar et al.(1990) com-pared two counting methods, CFUs and direct counts (Fluo-rescence technique; see respective paper for detailed descrip-tion of this method) and came to the conclusion that the dif-ference between CFUs and direct counts for both, bacteriaand yeasts, is not only considerable but also highly variable.The authors added that seasonal trends in these discrepancieswere not detected.
The information provided in the above section is strongevidence for the fact that CFU counts and total spore countsare not equal at all. Due to the scarcity of studies includ-ing both viable and total counts, values for CFUs and totalspore counts have been treated equally in this paper knowingthat the two counting methods show remarkable differencesin resulting counts.
3 Discussion
The fungal spore fluxes for the respective biome areas are inthe expected orders of magnitude. The more a biome regionis vegetated, the higher are the fungal spore emissions (cf. Ta-ble 2 and Fig. 2). This makes sense considering the fact thatplants are the largest source of fungal bioaerosol. This rea-soning is also supported byHeald and Spracklen(2009), al-though their fungal spore flux calculations are based on theleaf area index (LAI) which might result in a bias towards toolow emissions for biomes with lower LAI as already pointedout in Sect. 2.
Unfortunately, no useful data in land ice areas were foundso that emissions are not available for this ecoregion. Itwould nonetheless be worth investigating these regions aswell. Lichen soredia (i.e. the reproductive structure of lichen)have been reported to be most abundant in maritime Antarc-tica (Henderson-Begg et al., 2009, citing Marshall 1996).Considering the fact that lichen have been found to be effec-tive ice nuclei, it is probable that lichen in these ecoregionsdo have an influence on cloud microphysical processes aswell as precipitation formation. A number of studies mainly
Biogeosciences, 8, 1181–1192, 2011 www.biogeosciences.net/8/1181/2011/
A. Sesartic and T. N. Dallafior: Global fungal spore emissions 1187
focused on species such asCladosporium, Aspergillusor Al-ternaria. This is mainly because these fungi can cause al-lergies (Goncalvez et al., 2010, citing Vijay 2005 and Shen2007).
Heald and Spracklen(2009) conducted an estimate of fun-gal spore emissions based on mannitol concentrations (a bio-tracer for fungi) using the GEOS-chem chemical transportmodel (see respective paper for detailed information). Twomajor differences between the respective results can be seenin the tropical regions. WhereasHeald and Spracklen(2009)found highest values in the Amazon and tropical African re-gion, the present study does not reveal maximum values inthese regions. Moreover, mass fluxes found byHeald andSpracklen(2009) are with 5.96× 10⁻¹² kgm−2s−1 an orderof magnitude lower than those presented here (cf. Table 4).(Winiwarter et al., 2009), who calculated global average fun-gal spore emissions of 5.71× 10⁻¹³ kgm−2s−1 came to val-ues two orders of magnitude smaller. Nevertheless, the val-ues presented here (1.69× 10⁻¹¹ kgm−2s−1, for best esti-mate cf. Table 4) are in agreement with the study byEl-bert et al.(2007) that presents a fungal spore mass flux of2.26× 10−11 kgm−2s−1.
The lower values found in tropical regions can partly beexplained by the fact that fungal spore data for tropicalforests have been aggregated up to one biome area irrespec-tive of forest type. Both methods are prone to biases and er-rors. The downsides of the present method will be outlined inSect.3.1. However, it is also likely that the results byHealdand Spracklen(2009) are based on different asumptions. Asoutlined in Sect.1 fungal spore composition and size can bevery heterogeneous and variable. Nevertheless, the approachof Heald and Spracklen(2009) is promising as seasonalityand meteorological influences have been taken into account.
Probably the measurements of actual spore concentrationsas well as the measurements of biological tracer substancesto derive fungal spore fluxes have to be seen in a comple-mentary way. Concentration measurements on the one handyield absolute counts of all fungal spores, but comprise mea-surement issues outlined in previous sections as well as someproblems with the identification of fungal spores. As for thebiochemical tracer method, these problems are not encoun-tered, but more knowledge needs to be gained in terms ofchemical composition of primary biological aerosols as tobetter describe them and hence yield more accurate results.Therefore it is useful to intercompare the two approaches inorder to determine possible sources of error and strengthenhypotheses where agreement is achieved.
3.1 Sources of error
As mentioned above, the results of this study have to be takenwith caution. The density of measurement points was notsufficient to take into account all ecosystems and thereforeonly a very coarse distinction into the here presented biomeareas could be made. This also implies that for example a
deciduous broadleaf forest is considered to emit the sameamount and kind of spores as a coniferous forest in higherlatitudes. This of course does not make sense from a biolog-ical point of view. Moreover, the seasonal and diurnal cycleswhich clearly have been detected (see Sect.2) could not beextended to all biomes and fungal species due to scarcity ofdata. The fact that the difference between CFUs and totalcounts is not considered clearly must bias the results espe-cially since only very little information is available on whatshare of fungal spores are viable.
The present data have been calculated on the basis of manysimplifications and assumptions that had to be made due tothe scarcity of data. As outlined in Sect.2, also measure-ment methods showed high heterogeneity which can clearlybe regarded as a source of bias in the present dataset. Never-theless it is a step towards enumerating fungal spore concen-trations and fluxes on a global basis. We hope that our reviewwill motivate further observations of fungal spore emissions,which might ultimately lead to an improved global database.
3.2 Outlook
In order to minimise the above named sources of error, mea-surement methods need to be standardised in order to al-low for better comparability. Furthermore, results should al-ways comprise both CFU and viable count data. To allowfor a finer resolution of flux data, data points should be dis-tributed more densely and represent a larger set of investi-gated ecosystems. In order to account for seasonal and dailycycles, measurements should be continuous over periods atleast lasting a full year.
Since investigation of bioaerosols in general is highly in-teresting due to their possible influence on cloud microphysi-cal processes, further research would be needed to learn moreabout the potential of fungal spores to act as CCN or IN.Moreover, lichen which have been reported to be effectiveIN should be investigated better since they are more abun-dant in the atmosphere than bacteria (Henderson-Begg et al.,2009). Additionally, data should not only focus on allergycausing fungi, but also on those spores which presumably in-fluence atmospheric processes. It would therefore also makesense to investigate concentrations of IN active spores suchasFusariumin order to get a broader picture of what share ofall fungal spores is actually involved in ice crystal formationprocesses.
4 Conclusions
The present study has reviewed data and information avail-able on fungal spore concentrations and derived fungal sporeemissions. As outlined above, data quality in general israther poor due to the heterogeneity of the applied mea-surement methods as well as the quality of the measure-ments themselves. A standardized measurement method
www.biogeosciences.net/8/1181/2011/ Biogeosciences, 8, 1181–1192, 2011
1188 A. Sesartic and T. N. Dallafior: Global fungal spore emissions
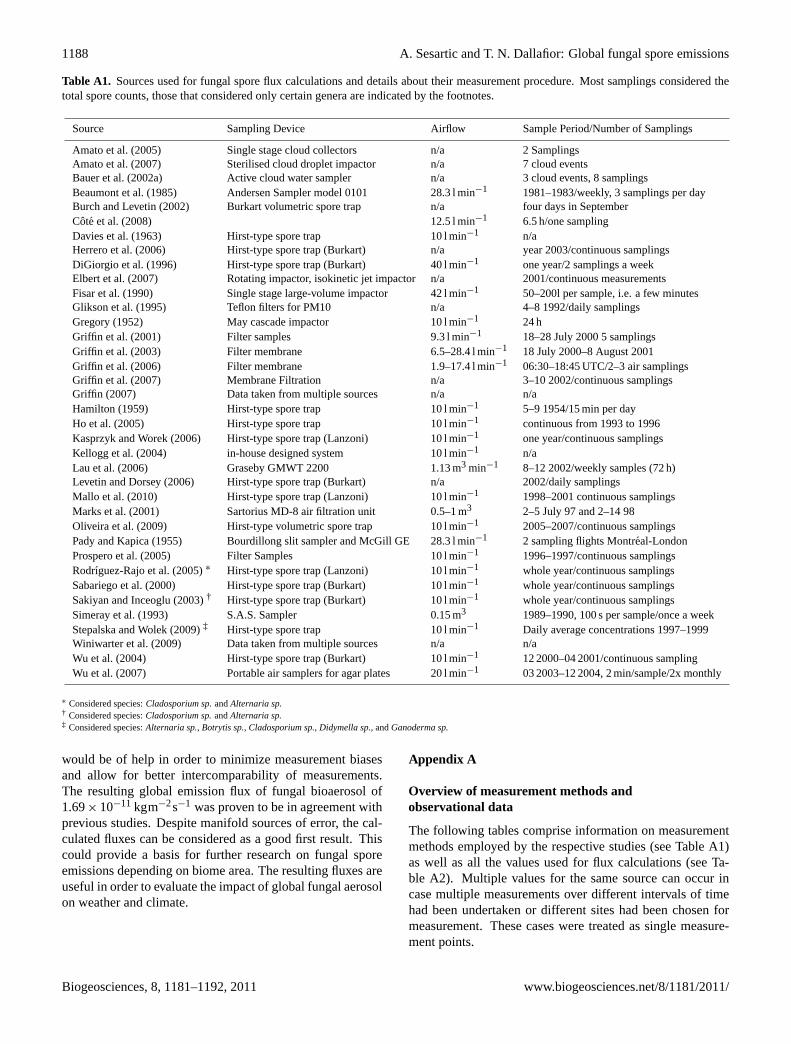
Table A1. Sources used for fungal spore flux calculations and details about their measurement procedure. Most samplings considered thetotal spore counts, those that considered only certain genera are indicated by the footnotes.
Source Sampling Device Airflow Sample Period/Number of Samplings
Amato et al.(2005) Single stage cloud collectors n/a 2 SamplingsAmato et al.(2007) Sterilised cloud droplet impactor n/a 7 cloud eventsBauer et al.(2002a) Active cloud water sampler n/a 3 cloud events, 8 samplingsBeaumont et al.(1985) Andersen Sampler model 0101 28.3 l min−1 1981–1983/weekly, 3 samplings per dayBurch and Levetin(2002) Burkart volumetric spore trap n/a four days in SeptemberCote et al.(2008) 12.5 l min−1 6.5 h/one samplingDavies et al.(1963) Hirst-type spore trap 10 l min−1 n/aHerrero et al.(2006) Hirst-type spore trap (Burkart) n/a year 2003/continuous samplingsDiGiorgio et al.(1996) Hirst-type spore trap (Burkart) 40 l min−1 one year/2 samplings a weekElbert et al.(2007) Rotating impactor, isokinetic jet impactor n/a 2001/continuous measurementsFisar et al.(1990) Single stage large-volume impactor 42 l min−1 50–200l per sample, i.e. a few minutesGlikson et al.(1995) Teflon filters for PM10 n/a 4–8 1992/daily samplingsGregory(1952) May cascade impactor 10 l min−1 24 hGriffin et al. (2001) Filter samples 9.3 l min−1 18–28 July 2000 5 samplingsGriffin et al. (2003) Filter membrane 6.5–28.4 l min−1 18 July 2000–8 August 2001Griffin et al. (2006) Filter membrane 1.9–17.4 l min−1 06:30–18:45 UTC/2–3 air samplingsGriffin et al. (2007) Membrane Filtration n/a 3–10 2002/continuous samplingsGriffin (2007) Data taken from multiple sources n/a n/aHamilton(1959) Hirst-type spore trap 10 l min−1 5–9 1954/15 min per dayHo et al.(2005) Hirst-type spore trap 10 l min−1 continuous from 1993 to 1996Kasprzyk and Worek(2006) Hirst-type spore trap (Lanzoni) 10 l min−1 one year/continuous samplingsKellogg et al.(2004) in-house designed system 10 l min−1 n/aLau et al.(2006) Graseby GMWT 2200 1.13 m3 min−1 8–12 2002/weekly samples (72 h)Levetin and Dorsey(2006) Hirst-type spore trap (Burkart) n/a 2002/daily samplingsMallo et al.(2010) Hirst-type spore trap (Lanzoni) 10 l min−1 1998–2001 continuous samplingsMarks et al.(2001) Sartorius MD-8 air filtration unit 0.5–1 m3 2–5 July 97 and 2–14 98Oliveira et al.(2009) Hirst-type volumetric spore trap 10 l min−1 2005–2007/continuous samplingsPady and Kapica(1955) Bourdillong slit sampler and McGill GE 28.3 l min−1 2 sampling flights Montreal-LondonProspero et al.(2005) Filter Samples 10 l min−1 1996–1997/continuous samplingsRodrıguez-Rajo et al.(2005) ∗ Hirst-type spore trap (Lanzoni) 10 l min−1 whole year/continuous samplingsSabariego et al.(2000) Hirst-type spore trap (Burkart) 10 l min−1 whole year/continuous samplingsSakiyan and Inceoglu(2003) † Hirst-type spore trap (Burkart) 10 l min−1 whole year/continuous samplingsSimeray et al.(1993) S.A.S. Sampler 0.15 m3 1989–1990, 100 s per sample/once a weekStepalska and Wolek(2009) ‡ Hirst-type spore trap 10 l min−1 Daily average concentrations 1997–1999Winiwarter et al.(2009) Data taken from multiple sources n/a n/aWu et al.(2004) Hirst-type spore trap (Burkart) 10 l min−1 12 2000–04 2001/continuous samplingWu et al.(2007) Portable air samplers for agar plates 20 l min−1 03 2003–12 2004, 2 min/sample/2x monthly
∗ Considered species:Cladosporium sp.andAlternaria sp.† Considered species:Cladosporium sp.andAlternaria sp.‡ Considered species:Alternaria sp., Botrytis sp., Cladosporium sp., Didymella sp., andGanoderma sp.
would be of help in order to minimize measurement biasesand allow for better intercomparability of measurements.The resulting global emission flux of fungal bioaerosol of1.69× 10−11 kgm−2s−1 was proven to be in agreement withprevious studies. Despite manifold sources of error, the cal-culated fluxes can be considered as a good first result. Thiscould provide a basis for further research on fungal sporeemissions depending on biome area. The resulting fluxes areuseful in order to evaluate the impact of global fungal aerosolon weather and climate.
Appendix A
Overview of measurement methods andobservational data
The following tables comprise information on measurementmethods employed by the respective studies (see Table A1)as well as all the values used for flux calculations (see Ta-ble A2). Multiple values for the same source can occur incase multiple measurements over different intervals of timehad been undertaken or different sites had been chosen formeasurement. These cases were treated as single measure-ment points.
Biogeosciences, 8, 1181–1192, 2011 www.biogeosciences.net/8/1181/2011/

A. Sesartic and T. N. Dallafior: Global fungal spore emissions 1189
Table A2. Data used as input for fungal spore flux calculations; average, minimum and maximum number concentrations and number fluxesof fungal spores. The data were always rounded to a whole number. The column CFU (Culture Forming Units) counts denotes if a culturebased technique was used for the analysis (yes), if it was a culture-independent technique (no), or if both methods were used.
Source Ecosystem Average conc. Min conc. Max. conc. Average flux Min flux Max flux CFU counts[m−3] [m−3] [m−3] [m−2s−1] [m−2s−1] [m−2s−1]
Amato et al.(2005) Forest 222 53 390 44 11 78 yesBauer et al.(2002a) Forest 2200 340 5000 440 68 1000 noBauer et al.(2002a) Forest 1200 170 3200 240 34 640 noBauer et al.(2002a) Forest 346 49 863 69 10 173 noBeaumont et al.(1985) Forest 258 n/a n/a 52 n/a n/a yesCote et al.(2008) Forest 615 492 738 123 98 148 yesFisar et al.(1990) Forest 17 n/a n/a 3 n/a n/a Both methodsGregory(1967) Forest n/a n/a 43 300 n/a n/a 8660 noGregory(1967) Forest 5250 n/a n/a n/a n/a 1050 noGregory(1967) Forest n/a 766 n/a 153 n/a n/a noKasprzyk and Worek(2006) Forest 2144 n/a n/a 429 n/a n/a noKasprzyk and Worek(2006) Forest 2183 n/a n/a 437 n/a n/a noKasprzyk and Worek(2006) Forest 2093 n/a n/a 419 n/a n/a noKasprzyk and Worek(2006) Forest 2146 n/a n/a 429 n/a n/a noMarks et al.(2001) Forest 105 0 1000 21 0 200 yesMarks et al.(2001) Forest 223 0 600 45 0 120 yesMarks et al.(2001) Forest 26 0 200 5 0 40 yesMarks et al.(2001) Forest 12 0 45 2 0 9 yesOliveira et al.(2009) Forest 531 n/a 8509 106 n/a 1702 noRodrıguez-Rajo et al.(2005) Forest 564 n/a n/a 113 n/a n/a noWiniwarter et al.(2009) Forest 49 n/a n/a 10 n/a n/aElbert et al.(2007) Tropical forest 12 476 4764 20 188 2495 953 4038 noGriffin et al. (2001) Tropical forest 45 n/a n/a 9 n/a n/a noGriffin et al. (2003) Tropical forest 0 n/a n/a 0 n/a n/a yesGriffin et al. (2003) Tropical forest 57 n/a n/a 11 n/a n/a yesGriffin et al. (2003) Tropical forest 9 5 20 2 1 4 yesGriffin et al. (2003) Tropical forest 12 8 24 2 2 5 yesGriffin et al. (2007) Tropical forest 1702 100 8510 340 20 1702 yesLau et al.(2006) Tropical forest 86 18 341 17 4 68 both methodsLau et al.(2006) Tropical forest 72 30 294 14 6 59 both methodsLau et al.(2006) Tropical forest 292 7 2386 58 1 477 both methodsLau et al.(2006) Tropical forest 247 50 1540 49 10 308 both methodsProspero et al.(2005) Tropical forest 92 n/a n/a 18 n/a n/a yesProspero et al.(2005) Tropical forest 213 n/a n/a 43 n/a n/a yesPady and Kapica(1955) Tropical forest 37 6 67 7 1 13 both methodsPady and Kapica(1955) Tropical forest 230 170 291 46 24 58 both methodsPady and Kapica(1955) Tropical forest 6 6 6 1 1 1 both methodsPady and Kapica(1955) Tropical forest 44 39 49 9 8 10 both methodsPady and Kapica(1955) Tropical forest 16 n/a n/a 3 n/a n/a both methodsPady and Kapica(1955) Tropical forest 31 n/a n/a 6 n/a n/a both methodsWu et al.(2007) Tropical forest 2233 n/a n/a 447 n/a n/a yesWu et al.(2007) Tropical forest 2278 n/a n/a 456 n/a n/a yesBurch and Levetin(2002) Shrub 50 000 n/a n/a 10 000 n/a n/a noHerrero et al.(2006) Shrub 609 n/a n/a 122 n/a n/a noDiGiorgio et al.(1996) Shrub 92 n/a n/a 18 n/a n/a noDiGiorgio et al.(1996) Shrub 46 n/a n/a 9 n/a n/a noGriffin et al. (2007) Shrub 73 31 115 15 6 23 yesGriffin et al. (2007) Shrub 25 0 291 5 0 58 yesKatial et al.(1997) Shrub 409 n/a n/a 82 n/a n/a noPady(1957) Shrub 24 499 837 48 162 4 900 167 9632 noPady(1957) Shrub 715 170 1261 143 34 252 noLevetin and Dorsey(2006) Shrub 24 121 53 48 188 4824 11 9638 yesLevetin and Dorsey(2006) Shrub 5459 n/a 64 363 1092 n/a 12 873 yesMallo et al.(2010) Shrub 285 n/a 2000 57 n/a 400 noMallo et al.(2010) Shrub 814 n/a 3488 163 n/a 698 noOliveira et al.(2009) Shrub 934 n/a 8761 187 n/a 1752 noRodrıguez-Rajo et al.(2005) Shrub 950 n/a n/a 190 n/a n/a noRodrıguez-Rajo et al.(2005) Shrub 979 n/a n/a 196 n/a n/a noSabariego et al.(2000) Shrub 832 n/a n/a 166 n/a n/a noSakiyan and Inceoglu(2003) Shrub 2917 17 5817 583 3 1163 noGregory(1952) Crop 9175 n/a n/a 1835 n/a n/a no
www.biogeosciences.net/8/1181/2011/ Biogeosciences, 8, 1181–1192, 2011

1190 A. Sesartic and T. N. Dallafior: Global fungal spore emissions
Table A2. Continued.
Source Ecosystem Average conc. Min conc. Max. conc. Average flux Min flux Max flux CFU counts[m−3] [m−3] [m−3] [m−2s−1] [m−2s−1] [m−2s−1]
Gregory(1952) Crop 11900 n/a n/a 2380 n/a n/a noGregory(1952) Crop 6975 n/a n/a 1395 n/a n/a noGregory(1952) Crop 9372 n/a n/a 1874 n/a n/a noGregory(1952) Crop 13970 n/a n/a 2794 n/a n/a noGregory(1952) Crop 9830 n/a n/a 1966 n/a n/a noHamilton(1959) Crop 14 800 n/a n/a 2960 n/a n/a noHamilton(1959) Crop 8200 6400 10 000 1640 1280 2000 noWu et al.(2004) Crop 28684 n/a n/a 5737 n/a n/a noGriffin et al. (2001) Grassland 42 n/a n/a 8 n/a n/a noGriffin et al. (2003) Grassland 24 n/a n/a 5 n/a n/a yesGriffin et al. (2003) Grassland 46 27 57 9 5 11 yesGriffin et al. (2003) Grassland 65 48 90 13 10 18 yesGriffin et al. (2003) Grassland 11 8 14 2 3 2 yesGriffin et al. (2007) Grassland 869 n/a n/a 174 n/a n/a yesGriffin et al. (2007) Grassland 215 205 226 43 41 45 yesGriffin et al. (2007) Grassland 66 0 703 13 0 141 yesGriffin et al. (2007) Grassland 3 0 27 1 0 5 yesGriffin et al. (2007) Grassland 1398 336 6992 280 67 1398 yesGriffin et al. (2007) Grassland 6078 n/a n/a 1216 n/a n/a yesKellogg et al.(2004) Grassland 225 80 370 45 16 74 yesKellogg et al.(2004) Grassland 65 0 130 13 0 26 yesKellogg and Griffin(2006) Grassland 0 n/a n/a 0 n/a n/a yes (apart from one source)Kellogg and Griffin(2006) Grassland 60 n/a n/a 12 n/a n/a yes (apart from one source)Kellogg and Griffin(2006) Grassland 6078 n/a n/a 1216 n/a n/a yes (apart from one source)Kellogg and Griffin(2006) Grassland 4839 n/a n/a 968 n/a n/a yes (apart from one source)Prospero et al.(2005) Grassland 0 n/a n/a 0 n/a n/a yesWu et al.(2004) Grassland n/a n/a 29 038 n/a n/a 5808 noPady and Kapica(1955) Tundra 30 4 57 6 1 11 both methodsPady and Kapica(1955) Tundra 87 14 159 17 3 32 both methodsPady and Kapica(1955) Tundra 3 2 4 1 0 1 both methodsPady and Kapica(1955) Tundra 39 7 71 8 1 14 both methods
Acknowledgement.The authors would like to thank Ul-rike Lohmann, Ulrich Poschl, Trude Storelvmo and NathalieBaumgartner for helpful discussions, Colombe Siegenthaler-LeDrian and Tanja Stanelle for expert opinions concerning theboundary layer and emission parameterisation, as well as twoanonymous referrees for valuable feedback on this paper.
References
Abdel-Hafez, S.I.I. and Shoreit, A.A.M.: Mycotoxins producingfungi and mycoflora of air-dust from Taif, Saudi Arabia, My-copathologia, 92, 65–71, 1985.
Abdel-Hafez, S. I. I., Shoreit, A. A. M., Abdel-Hafez, A. I. I.,and E.-Maghraby, O. M. O: Mycoflora and mycotoxin-producingfungi of air-dust particles from Egypt, Mycopathologia, 93(1),25–32,doi:10.1007/BF00437011,1986.
Abu-Dieyeh, M., Barham, R., Abu-Elteen, K., Al-Rashidi, R., andShaheen, I.: Seasonal variation of fungal spore populations in theatmosphere of Zarqa area, Jordan, Aerobiologia, 2010.
Amato, P., Menager, M., Sancelme, M., Laj, P., Mailhot, G., andDelort, A.-M.: Microbial population in cloud water at the Puy deDome: Implications for the chemistry of clouds, Atmos. Envi-ron., 39, 4143–4153, 2005.
Amato, P., Parazols, M., Sancelme, M., Laj, P., Mailhot, G., andDelort, A.-M.: Microorganisms isolated from the water phaseof tropospheric clouds at the Puy de Dome: major groups and
growth abilities at low temperatures, FEMS Microbiol. Ecol., 59,242–254, 2007.
Ariya, P., Sun, J., Eltouny, N., Hudson, E., Hayes, C., and Kos, G.:Physical and chemical characterization of bioaerosols – Implica-tions for nucleation processes, Int. Rev. Phys. Chem., 28, 1–32,2009.
Bauer, H., Kasper-Giebl, A., Loflund, M., giebl, H., Hitzenberger,R., Zibuschka, F., and Puxbaum, H.: The contribution of bacteriaand fungal spores to the organic carbon content of cloud water,precipitation and aerosols, Atmos. Res., 64, 109–119, 2002a.
Bauer, H., Kasper-Giebl, A., Zibuschka, F., Hitzenberger, R., Kraus,G., and Puxbaum, H.: Determination of the Carbon Content ofAirborne Fungal Spores, Anal. Chem., 74, 91–95, 2002b.
Bauer, H., Claeys, M., Vermeylen, R., Schueller, E., Weinke, G.,Berger, A., and Puxbaum, H.: Arabitol and mannitol as tracersfor the quantification of airborne fungal spores, Atmos. Environ.,42, 588–593, 2008.
Beaumont, F., Kauffman, H., der Mark, T. V., Sluiter, H., andde Vries, K.: Volumetric Aerobiological Survey of Conidialfungi in the North-East Netherlands, Allergy, 40, 173–180, 1985.
Bhati, H. and Gaur, R.: Studies on Aerobiology – Atmospheric Fun-gal Spores, New Phytol., 82, 519–527, 1979.
Burch, M. and Levetin, E.: Effects of Meteorological Conditions onSpore Plumes, Int. J. Biometeorol., 46, 107–117, 2002.
Burgess, H.: An update on pollen and fungal spore aerobiology,Journal of Allergy and Clinical Immunology, 110, 544–552,
Biogeosciences, 8, 1181–1192, 2011 www.biogeosciences.net/8/1181/2011/

A. Sesartic and T. N. Dallafior: Global fungal spore emissions 1191
2002.Burkard Scientific: Burkard 7-day volumetric spore sampler,www.
burkardscientific.co.uk/agronomics/hirst/spore/sampler.htm, lastaccess: 19 July 2010, 2000.
Cote, V., Kos, G., Martazavi, R., and Ariya, P.: Microbial and“de novo” transformation of dicarboxylic acids by three airbornefungi, Sci. Total Environ., 390, 530–537, 2008.
Davies, R., Denny, M., and Newton, L.: A comparison Between theSummer and Autumn Air-Sporas at London and Liverpool, ActaAllergologica, 18, 131–147, 1963.
DiGiorgio, C., Krempff, A., Guiraud, H., Binder, P., Tiret, C., andDumenil, G.: Atmospheric Pollution y Airborne Microorganismsin the City of Marseilles, Atmos. Environ., 30, 155–160, 1996.
Elbert, W., Taylor, P. E., Andreae, M. O., and Poschl, U.: Contribu-tion of fungi to primary biogenic aerosols in the atmosphere: wetand dry discharged spores, carbohydrates, and inorganic ions, At-mos. Chem. Phys., 7, 4569–4588,doi:10.5194/acp-7-4569-2007,2007.
Fisar, Z., Hysek, J., and Binek, B.: Quantification of airborne mi-croorganisms and investigation of their interactions with non-livin particles, Int. J. Biometeorol., 34, 189–193, 1990.
Froehlich-Nowoisky, J., Pickersgill, D., Despres, V. R., and Poschl,U.: High diversity of fungi in air particulate matter, Proceed-ings of the national academy of science, 106, 12814–12819,doi:10.1073/pnas.0811003106, 2009.
Glikson, M., Rutherford, S., Simpson, R., Mitchell, C., and Yago,A.: Microscopic and Submicron Components of AtmosphericParticulate Matter During High Asthma Periods in Brisbane,Queensland, Australia, Atmos. Environ., 29, 549–562, 1995.
Goncalvez, F. T., Bauer, H., Cardoso, M. R. A., Pukinskas, S.,Matos, D., Melhem, M., and Puxbaum, H.: Indoor and outdooratmospheric fungal spores in the Sao Paulo metropolitan area(Brazil): species and numeric concentrations, Int. J. Biometeo-rol., 54, 347–355, 2010.
Gregory, P. H.: Microbiology of the Atmosphere, Leonhard Hill,Aylesbury (Bucks.), chap. 2, 1973.
Gregory, P.: Spore Content of the Atmosphere Near the Ground,Nature, 170, 475–477, 1952.
Gregory, P.: The Dispersal Distance Problem, Pollen Spores, 348,1962.
Gregory, P.: Atmospheric microbial cloud systems, Scri. Prog. Oxf.,55, 613–628, 1967.
Gregory, P.: Distribution of Airborne Pollen and Spores and theirLong Distance Transport, Pure and Applied Geophysics, 116,309–315, 1978.
Griffin, D.: Atmospheric Movement of Microorganisms in Cloudsof Desert Dust and Implications ofr Human Health, Climical Mi-crobiology Reviews, 20, 459–477, 2007.
Griffin, D., Garrison, V., Herman, J., and Shinn, E. A.: Africandesert dust in the Caribbean atmosphere: Microbiology and pub-lic health, Aerobiologia, 17, 203–213, 2001.
Griffin, D., Westphal, D., and Gray, M.: Airborne microorganismsin the Aftican desert dust corridor over the mid-Atlantic ridge,Ocean Drilling Program, Leg 209, Aerobiologia, 22, 211–226,2006.
Griffin, D., Kubliay, N., Kocak, M., Gray, M. A., Borden, T., andShinn, E.: Airborne deser dust and aeromicrobiology over theTurkish Mediterranean coastline, Atmos. Environ., 41, 4050–4062, 2007.
Griffin, D. W., Kellogg, C., Garrison, V., Lisle, J., Borden, T., andShinn, E.: Atmospheric microbiology in the northern Caribbeanuring Aftican dust events, Aerobiologia, 19, 143–157, 2003.
Hamilton, E.: Studies on the Air Spora, Acta Allergol., 13, 143–175, 1959.
Harvey, R.: Air-Spora Studies at Cardiff, T. Brit. Mycol. Soc., 50,479–495, 1967.
Heald, C. and Spracklen, D.: Atmospheric budget of primary bio-logical aerosol particles from fungal spores, Geophys. Res. Lett.,36, L09806,doi:10.1029/2009GL037493, 2009.
Henderson-Begg, S., Hill, T., Thyrhaug, R., Khan, M., and Moffett,B.: Terrestrial and airborne non-bacterial ice nuclei, Atmos. Sci.Lett., 10, 215–219, 2009.
Herrero, A. D., Ruiz, S. S., Bustillo, M. G., and Morales, P. C.:Study of airborne fungal spores in Madrid, Spain, Aerobiologia,22, 135–142, 2006.
Hirst, J.: An Automatic Volumetric Spore Trap, Ann. Appl. Biol.,39, 257–265, 1952.
Hirst, J.: Changes in Atmospheric Spore Content: Diurnal Periodic-ity and the Effects of Weather, T. Brit. Mycol. Soc., 36, 375–393,1953.
Hirst, J. M., Stedman, O., and Hogg, W.: Long-distance SporeTransport: Methods of Mesurement, Vertical Spore Profiles andthe Detection of Immigrant Spores, J. Gen. Microbiol., 48, 329–355, 1967.
Ho, H., Rao, C., Hsu, H., Chiu, Y., Liu, C., and Chao, H.: Charac-teristics and determinants of ambient fungal spores in Hualien,Taiwan, Atmos. Environ., 39, 5839–5850, 2005.
Hoose, C., Kristjansson, J., and Burrows, S.: How important is bio-logical ice nculeation in clouds on a global scale?, Environ. Res.Lett., 5(2), 024009,doi:10.1088/1748-9326/5/2/024009, 2010.
Hyde, K. D., Jones, E. B. G., Leano, E., Pointing, S. B., Poonyth, A.D., and Vrijmoed, L. L. P.: Role of fungi in marine ecosystems,Biodiversity and Conservation, 7(9), 1147–1161, 1998.
Iannone, R., Chernoff, D. I., Pringle, A., Martin, S. T., and Bertram,A. K.: The ice nucleation ability of one of the most abundanttypes of fungal spores found in the atmosphere, Atmos. Chem.Phys., 11, 1191–1201,doi:10.5194/acp-11-1191-2011, 2011.
Jacob, D.: Introduction to Atmospheric Chemistry, Princeton Uni-versity Press, 66–67, 1999.
Jaenicke, R., Matthias-Maser, S., and Gruber, S.: Omnipresence ofbiological material in the atmosphere, Environ. Chem., 4, 217–220, 2007.
Jones, A. and Harrison, R.: The effects of meteorological factorson atmospheric bioaerosol concentrations – a review, Sci. TotalEnviron., 326, 151–180, 2004.
Kasprzyk, I. and Worek, M.: Airborne fungal spores in urban andrural environments in Poland, Aerobiologia, 22, 169–176, 2006.
Katial, R., Zhang, Y., Jones, R., and Dyer, P.: Atmospheric moldspore counts in relation to meteorological parameters, Int. J.Biometeorol., 41, 17–22, 1997.
Kellogg, C. and Griffin, D.: Aerobiology and the global transportof desert dust, Trends. Ecol. Evol., 21, 638–644, 2006.
Kellogg, C., Griffin, D. W., Garrison, V., Peak, K. K., Royall, N.,Smith, R., and Shinn, E.: Characterization of aerosolized bacte-ria and fungi from desert dust events in Mali, West Africa, Aero-biologia, 20, 99–110, 2004.
Kieft, T.: Ice Nucleation Activity in Lichens, Appl. Env. Microb.,54, 1678–1681, 1988.
www.biogeosciences.net/8/1181/2011/ Biogeosciences, 8, 1181–1192, 2011

1192 A. Sesartic and T. N. Dallafior: Global fungal spore emissions
Kieft, T. and Ruscetti, T.: Characterization of Biological Ice Nucleifrom a Lichen, J. Bacteriol., 172, 3519–5323, 1990.
Lanzoni: VPPS 2000 sampler,www.lanzoni.it/vpps/2000.html, lastaccess: 19 July 2010, 2010.
Lau, A., Lee, A., Chan, C., and Fang, M.: Ergosterol as a biomarkerfor the quantification of the fungal biomass in atmosphericaerosols, Atmos. Environ., 40, 249–259, 2006.
Levetin, E.: Bioaerosols, chap. Fungi, CRC Press, Boca Raton,Florida, USA, 1995.
Levetin, E. and Dorsey, K.: Contribution of leaf surface fungi to theair spora, Aerobiologia, 22, 3–12, 2006.
Madelin, T. M.: Fungal Aersols: A Review, J. Aerosol Sci., 25,1405–1412, 1994.
Mallo, A., Nitiu, D., and Sambeth, M. G.: Airborne fungal sporecontent in the atmosphere of the city of La Plata, Argentina, Aer-obiologia, 2010.
Mandrioli, P.: Basic Aerobiology, Aerobiologia, 14, 89–94, 1998.Marks, R., Kruczalak, K., Jankowska, K., and Michalska, M.: Bac-
teria and fungi in air over the Gulf of Gdansk and Baltic season,J. Aerosol Sci., 32, 237–250, 2001.
May, K.: The Cascade Impactor: An Instrument for SamplingCoarse Aerosols, J. Sci. Instrum., 22, 187–195, 1945.
Morris, C. E., Georgakopoulos, D. G., and Sands, D. G.: Ice nu-cleation active bacteria and their potential role in precipitation, J.Phys. IV, 121, 87–103, 2004.
Oliveira, M., Ribeiro, H., Delgado, J., and Abreu, I.: Seasonal andintradiurnal variation of allergenic fungal spores in urban andrural areas of the North of Portugal, Aerobiologia, 25, 85–98,2009.
Olson, D., Dinerstein, E., Wikramanayake, E., Burgess, N., Powell,G., Underwood, E., D’Amico, J., Itoua, I., Strand, H. E., Mor-rison, J., Loucks, C., Allnutt, T. F., ricketts, T., Kura, Y., Lam-oureux, J., Wettengel, W. W., Hedeao, P., and Kassem, K.: Ter-restrial Ecoregions of the world: A New Map of Life on Earth’s,BioScience, 51, 933–938, 2001.
Pady, S.: Quantitative studies of fungus spores in the air, Mycolo-gia, 49, 339–353, 1957.
Pady, S. and Gregory, P.: Numbers and variability of airbore hyphalfragments in England, T. Brit. Mycol. Soc., 46, 609–613, 1963.
Pady, S. and Kapica, L.: Fungi in air over the atlantic oceanic, My-cologia, 47, 34–50, 1955.
Pathak, V. and Pady, S.: Numbers and viability of certain airbornefungus spores, Mycologia, 57, 301–310, 1965.
Pouleur, S., Richard, C., Martin, J.-G., and Antoun, H.: Ice Nu-cleation Activity in Fusarium acuminatumand Fusarium ave-naceum, Appl. Env. Microb., 58, 2960–2964, 1992.
Pratt, K. A., DeMott, P. J., French, J. R., Wang, Z., Westphal, D. L.,Heymsfield, A. J., Twohy, C. H., Prenni, A. J., and Prather, K. A.:In situ detection of biological particles in cloud ice-crystals, Nat.Geosci., 2, 397–400, 2009.
Prenni, A. J.: Relative roles of biogenic emissions and Saharan dustas ice nuclei in the Amazon basin, Nat. Geosci., 2, 401–404,2009.
Prospero, J., Blades, E., Mathison, G., and Naidu, R.: Interhemi-spheric transport of viable fungi and bacteria from Africa to theCaribean with soil dust, Aerobiologia, 21, 1–19, 2005.
Raddatz, T. J., Reick, C. H., Knorr, W., Kattge, J., Roeckner, E., R.,S., Schnitzler, K.-G., Wetzel, P., and Jungclaus, J.: Will the trop-ical ladn biosphere dominate the climate-carbon cycle feedbackduring the twenty-first century?, Clim. Dyn., 29, 565–574, 2007.
Rodrıguez-Rajo, F., Iglesias, I., and Jato, V.: Variation assessmentof airborneAlternariaandCladosporiumspores at different bio-climatical conditions, Mycol. Res., 109, 297–507, 2005.
Sabariego, S., de la Guardia, C. D., and Alba, F.: The effect ofmeteorological factors on the daily variation of airborne fungalspores in Granada (southern Spain), Int. J. Biometeorol., 44, 1–5,2000.
Sakiyan, N. and Inceoglu, O.: Atmospheric Concentrations ofCla-dosporiumandAlternaria Spores in Ankara and the Effects ofMeteorological Factors, Turk. J. Bot., 27, 77–81, 2003.
Sedlbauer, K. and Krus, M.: Schimmelpilze and Wohngebauden– Altes Thema, neue Losungen, in: Proceedings of theThird Dahlberg-Kollogquium “Mikroorganismen und Bauw-erkinstandesetzung”, Wisman, Germany, 2001.
Simeray, J., Chaumont, J.-P., and Leger, D.: Seasonal variationsin the airborne fungal spore population of the East of France(Franche – Comte). Comparison between urban and rural envi-ronment during two years, Aerobiologia, 9, 201–206, 1993.
Stepalska, D. and Wolek, J.: Intradiurnal periodicity of fungal sporeconcentration (Alternaria, Botrytis, Cladosporium, Didymella,Ganoderma) in Cracow, Poland, Aerobiologia, 2009.
Winiwarter, W., Bauer, H., Caseiro, A., and Puxbaum, H.: Quan-tifying emissions of primary biological aerosol particle mass inEurope, Atmos. Environ., 43, 1403–1409, 2009.
World Resource Institute: Eearth Trend Tables: Forests, Grass-lands, and Drylands,earthtrends.wri.org/pdf/library/data/tables/for1/2003.pdf, last access: June 2010, 2003a.
World Resource Institute: Land Area classification by Ecosys-tem Type,earthtrends.wri.org/pdf/library/data/tables/for1/2003.pdf, last access: June 2010, 2003b.
Wu, P.-C., Tsai, J.-C., Li, F.-C., Lung, S.-C., and Suzuku, H.-J.: In-creased levels of ambient fungal spores in Taiwan are associatedwith dust events from China, Atmos. Environ., 38, 4879–4886,2004.
Wu, Y., Chan, C., Rao, C., Lee, C.-T., Hsu, H.-H., Chiu, Y.-H., andChao, H. J.: Characteristics, determinants, and spatial variationsof ambient fungal levels in the subtropical Taipei metropolis, At-mos. Environ., 41, 2500–2509, 2007.
Biogeosciences, 8, 1181–1192, 2011 www.biogeosciences.net/8/1181/2011/