Embed Size (px)
Citation preview

10th World Seafood Congress
Saint John’s, Canada
29 September – 3 October 2013
Lahsen Ababouch and Iddya Karunasagar
Department of Fisheries and Aquaculture
Food and Agriculture Organization of the United Nations. Rome, Italy
Global Fisheries and Aquaculture: Opportunities and Challenges
Global Contribution of Fisheries and
Aquaculture to Food Security

Fishery production and utilization Fish production
(million tonnes live weight) Per capita fish supply (kg)

Fishery production 2011
Moderately
exploited
Capture Aquaculture
China 17%
Peru 9%
Indonesia 6% USA
5% India 5% Russian Federation
5%
Japan 4%
Other 49%
China 62%
India 7%
Viet Nam 5%
Indonesia 4%
Bangladesh 2%
Norway 2%
Thailand 2%
Others 16%
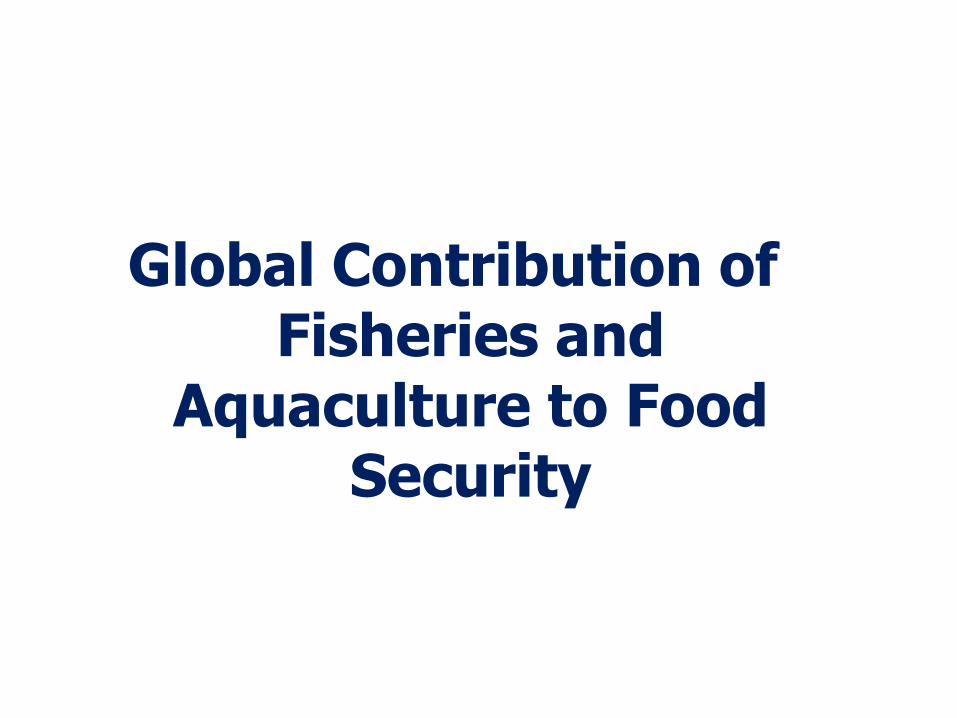
Top 10 aquaculture producing countries
Country Production World rank
China 35,074,560 1
India 3,791,920 2
Viet Nam 2,556,200 3
Indonesia 1,749,291 4
Thailand 1,396,020 5
Bangladesh 1,064,285 6
Norway 961,840 7
Chile 792,891 8
Myanmar 778,096 9
Philippines 737,397 10

Aquaculture in Asia Pacific Region
• Asia Pacific Region produced about 50 million tonnes of fish by aquaculture
• Five SE Asian countries in global top ten: – 7.7 million tonnes, – 13.7 billion dollars,
• SE Asia production: – 16 % of global total, – 13 % of total value
• Southeast Asia highest growth in aquaculture of the Asian sub‐regions in recent years: – 45% increase over last decade
• FAO study of aquaculture policies in Southeast Asia– reveals that well‐planned government interventions built on comparative advantages and fostering an enabling incentive environment can lead to economic growth, food security and better living standards.

Aquaculture in Asia Pacific Region
• Backyard aquaculture contributes to livelihoods
• Major contribution to local economies and fish supply
• significant contribution to household and local food/nutritional security
• Effective integration of aquaculture with other livelihood activities
• More effective utilization to limited resources available to small farm holder
• Empowerment of wome
• Increased resilience of livelihood of smallscale farmer

A complete nutrient package
• Major source of animal proteins and micronutrients for many coastal populations
• Unique source of poly-unsaturated fatty acids (DHA, EPA) for optimal brain development and the prevention of coronary heart disease
• Unique & complete source of micronutrients (calcium, iodine, zinc, iron, selenium,...)
• Source of vitamins (A, D, B group)generally scarce in rural diets
Fish:
Informati
on

Salmon,
farmed
Salmon,
wild
Carp,
common Tilapia Chicken Beef
Protein g/100g 20 20 18 20 19 21
Lipids g/100g 13 6.3 5.6 1.7 15 12
Water g/100g 65 69 76 78 66 65
Ash g/100g 1.1 2.5 1.5 0.9 0.8 1.0
DHA + EPA
(ω-3) mg/100g 1966 1436 350 91 40 3
USDA National Nutrient Database (USDA, 2012)
Comparison of Omega-3 levels in fish and other meats

Examples of the importance of micronutrients
Micronutrient
deficiency
Level of micronutrient
in 100 g edible part
Recommended
daily intake for
children:
250 million preschool
children are vitamin A
deficient
Small sized fish eaten whole, good source;
> 2 500 µg RAE in 100 g Mola
(Amblypharyngodon mola)
500 µg RAE
54 countries are still
iodine-deficient
Seafood nearly the only natural food source of
iodine;
250 µg iodine in 100 g Cod (Gadhus morhua)
120 µg
Iron deficiency affects
about 2 billion people
Small sized fish eaten whole, good source;
45 mg iron in 100 g Chanwa pileng (Esomus
longimanus)
8.9 mg
800 000 child deaths
per year are
attributable to zinc
deficiency
Small sized fish eaten whole, good source;
20 mg zinc in 100 g
Chanwa pileng (Esomus longimanus)
3.7 mg
Fish:
Informati
on

Contribution of fish to human diet (2009)
22.6
19.3
11.6
11.0
7.4
7.0
24.2
16.5
0.0 5.0 10.0 15.0 20.0 25.0
Asia
Africa
Europe
Oceania
Northern America
Latin America & Caribbean
LIFDC's
WORLD
Fish as percentage of total animal protein intake

Global Contribution of Fisheries and
Aquaculture to Social and Economic Development

Employment & Livelihoods
• 54.8 million total employment (2010) – 90% small scale
– 38.2 million capture
– 16.6 million aquaculture

0
30
60
90
120
150
1961 1967 1973 1979 1985 1991 1997 2003 2008
Fish and seafood utilization (in volume)
Non-food purposes
Canning
Curing
Freezing
Marketing as fresh produce
Million tonnes (live weight)

Socio-Economic importance of the fish and seafood value chain Estimated Total Value 818 US $ billion in 2008
Fisheries
US $ 100 billion Primary
processing
US $ 90
billion
Secondary
processing
US $ 180
billion
Distribution
US $ 350
billion
Aquaculture
US $ 98 billion
15
Employment in fisheries and aquaculture:
- 52 million persons in fisheries and aquaculture 2008
- 195 million along the value chain
-- 660 - 880 million persons (12%) depend on the sector for their
livelihoods

Enabling Trade and Wealth Extraction

0
20
40
60
80
100
120
140
Bill
ion
s o
f U
S$
Developed countries Developing countries
Export of fish and seafood: 1976 – 2012 (US $ billion)
Source: GTIS ® (2012)
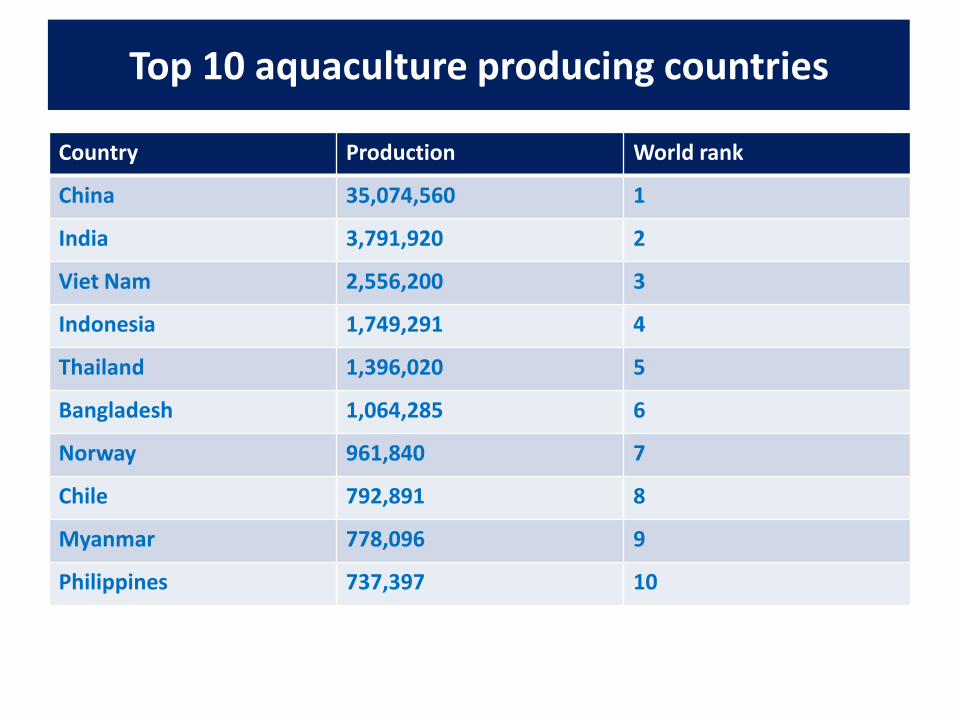
-5
0
5
10
15
20
25
30
Fish Coffee Rubber Bananas Cocoa Meat Tea Sugar Tobacco Rice
US$ billions
Net trade income of developing countries from various agricultural commodities
1987
1997
2007
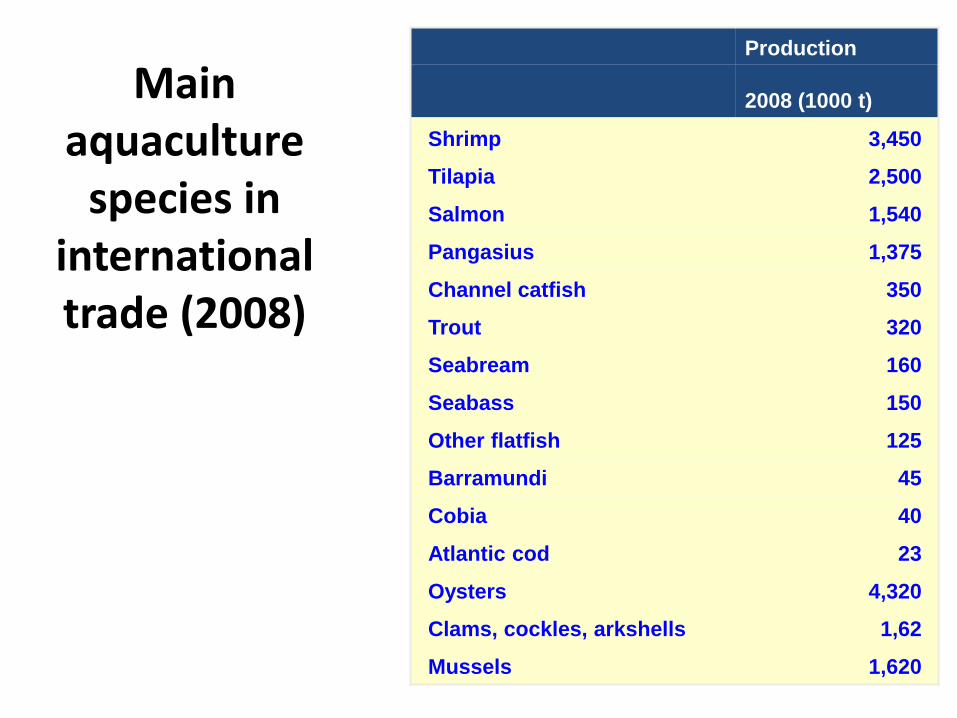
Main aquaculture
species in international trade (2008)
Production
2008 (1000 t)
Shrimp 3,450
Tilapia 2,500
Salmon 1,540
Pangasius 1,375
Channel catfish 350
Trout 320
Seabream 160
Seabass 150
Other flatfish 125
Barramundi 45
Cobia 40
Atlantic cod 23
Oysters 4,320
Clams, cockles, arkshells 1,62
Mussels 1,620

Challenges

Challenges
21 WWW.FAO.ORG
Increasing demand:
1. Population increase
2. Economic development
3. Increased consumption
Decreasing resource base:
1. Overexploited fish stocks
2. IUU fishing
3. Overcapacity in fishing fleets
4. Degraded environment and
ecosystems
5. Climate Changes
6. Post harvest losses

Stock Status of Marine Fishery Resources
22 WWW.FAO.ORG
• % of non-fully exploited
stocks continuously
decreased
• 30% of stocks overexploited
in 2009
• Fully exploited stocks at
around 50%
• An increasing trend in fully
exploited stocks from 1990 to
present
Year
%
1980 1990 2000 2010
02
04
06
0
Fully exploited
Non-fully fished
Overfished
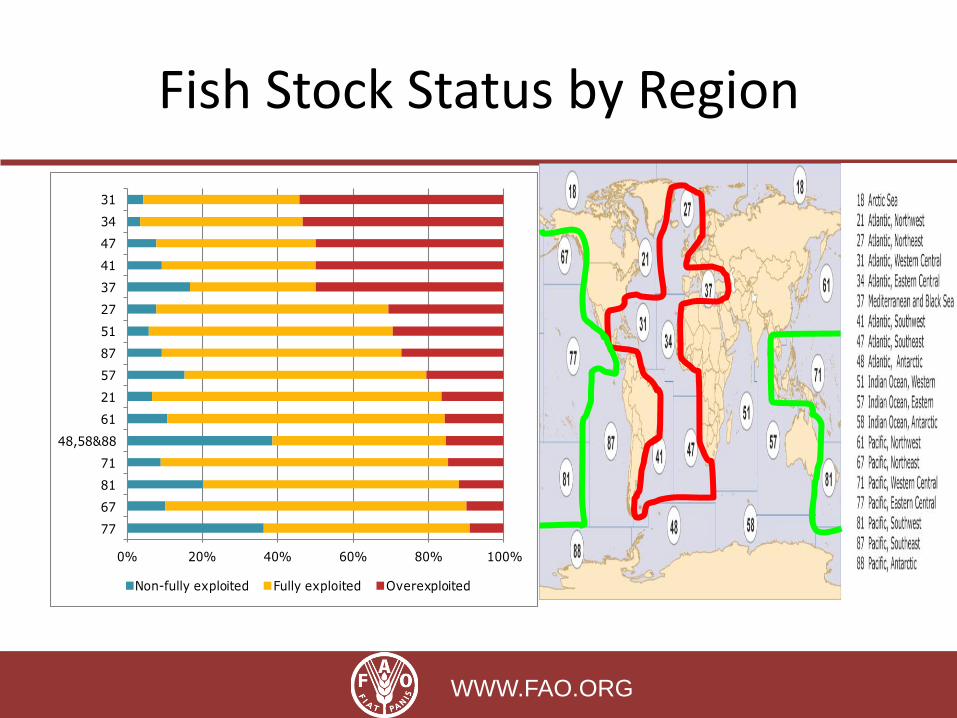
Fish Stock Status by Region
23 WWW.FAO.ORG
0% 20% 40% 60% 80% 100%
77
67
81
71
48,58&88
61
21
57
87
51
27
37
41
47
34
31
Non-fully exploited Fully exploited Overexploited

Perspectives of fish supply
Fish supply (mt) 2010
(baseline) 2020/2030 projection
Aquaculture 59 95/123
Capture fisheries 88 88/88
Total supply 147 168/211
% of aquaculture: 40 (48 for
human consumption)
57/58 (65/65 for human
consumption)
Source: Estimation of FI Department -
10
20
30
40
50
60
70
80
90
100
1950 1960 1970 1980 1990 2000 2010
Mill
ion
s to
nn
es
World Fish Production
Capture fisheries
Aquaculture
Source: FAO FISHSTAT

Fish demand driven by population and income growth
-
1
2
3
4
5
6
7
8
9
1980 1990 2000 2010 2020 2030
Billi
on
Population growth
World
Africa
Asia
Europe
L.A. & C.
N. America
Oceania
0.0
2.0
4.0
6.0
8.0
Africa Asia Europe L.A. & C. N. America Oceania World
%
Growth of GDP per capita: 2010-2020
Fish Demand (mt) 2007 (baseline) 2030
(projection)
Africa 9.0 18.7
Asia 86.4 186.3
Europe 19.4 23.4
L.A. & C. 15.2 18.3
Northern A. 9.1 12.9
Oceania 1.1 1.8
World 140.3 261.2
Source: Estimation of FI Department

Fish supply-demand gaps
S-D gap (mt)
Supply 2030
Demand 2030
S-D gap 2030
Africa 11.7 18.7 -7.0
Asia 156.5 186.3 -29.8
Europe 18.6 23.4 -4.8
L.A. & C. 16.2 18.3 -2.1
Northern A. 6.2 12.9 -6.6
Oceania 1.5 1.8 -0.3
World 210.7 261.2 -50.6
Source: Estimation of FI Department
Per capita fish demand in 2020 estimated based on assumptions:
–GDP per capita projection by IMF –Prices unchanged –Preference unchanged
Total fish demand in 2030 estimated based on:
–Estimated per capita demand in 2020. –UN population projection in 2030. –Non-food fish demand unchanged
Results: –Supply < Demand
•51 mt shortage –S-D gaps decline in all regions
•Largest insufficiency in Asia

Aquaculture
Aquaculture growth rate is declining!
-4%
-2%
0%
2%
4%
6%
8%
10%
12%
0
20
40
60
80
100
120
140
160
Mill
ion
s
Aquaculture production Capture fisheries production
Aquaculture production growth rate Capture fisheries production growth rate

Bridging the supply-demand gaps
Aquaculture growth rate
during 2007-2030
Expected APR (%)
Required APR (%)
World 4.0 5.6
Africa 7.2 11.5
Asia 4.0 5.3
Europe 3.1 4.0
L.A. & C. 4.4 7.6
Northern A. 0.4 9.0
Oceania 2.6 7.9
Source: Estimation of FI Department
If countries aquaculture production follow the recent trend, expected aquaculture growth rate:
–4.0 percent annually.
Improved capture fisheries 10-20 mill. t.
To feed growing and wealthier world population, required aquaculture growth rate:
–5.0/ 5.5 percent annually.
Insufficiency

International regulatory framework for fisheries Governance
1995 Code of Conduct for Responsible Fisheries
1993 C
om
plia
nce
Agre
em
ent
IPOAs • Seabirds 1999 • Sharks 1999 • Capacity 1999 • IUU 2001 •[Kyoto POA ’95]
Port State Measures: Model Scheme 2005 + 2009 Agreement Flag State Performance
Strategies: •Status & Trends on Capture Fisheries 2003 • Status & Trends on Aquaculture 2007
International Guidelines: • Sea-Turtles2009 • Ecolabelling 2009 • Deep sea fisheries 2009 • By-catch management &
discards reduction 2010
1982 UN Convention on the Law of the Sea
1995 U
NFSA
1992 UNCED: Rio Declaration + Agenda 21
Ecosystem approach to fisheries: Reykjavík 2001
2002 WSSD Johannesburg Plan of Implementation
Rio + 20 U. N Conference on Sustainable Development

Regional Fisheries Bodies

Regional approach in the Nansen Programme
NW-Africa
Benguela
BENEFIT

FAO Approach: Focus
Common forum for management discussions and agreements Formal meeting point
Focus on trust and cooperation Level Playing field Identify Common
Interests/Issues Centre points for cooperation
Take into account differences in capacity and
culture: Sub-regional Approach
Capacity Development for National/Local Institutions
Teach HOW TO FISH
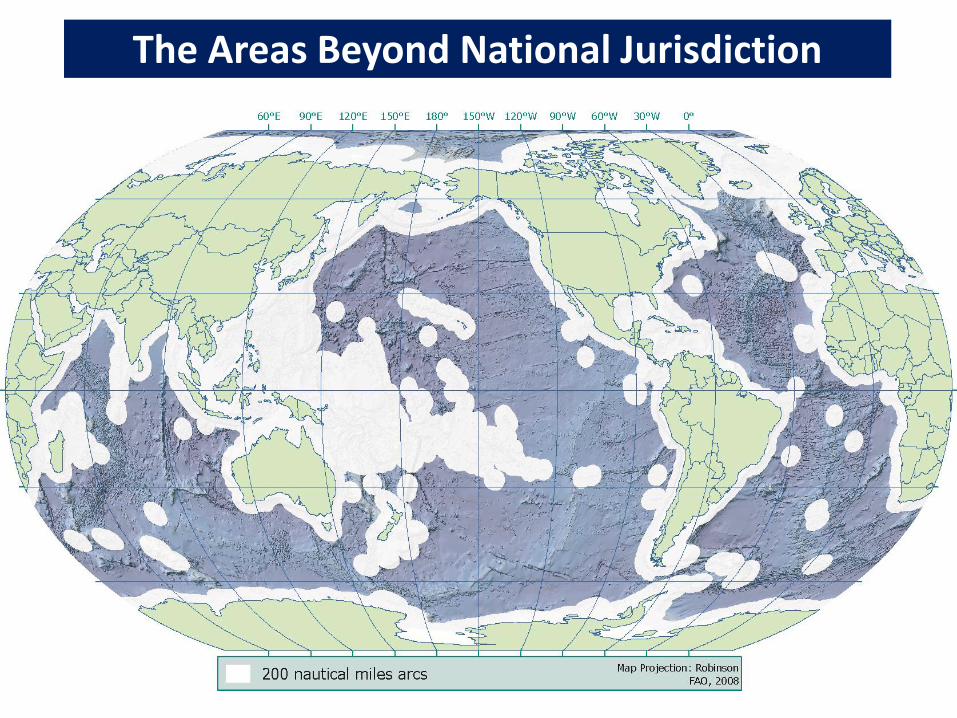
The Areas Beyond National Jurisdiction

Market based measures
• Food scares: Mad cow disease, Dioxin, Avian flu, SARS,...
• Loss of confidence in public control authorities
• Concern over the sustainability of natural resources, the marine fauna (dolphins, whales, turtles,...) and environment
• Increasing influence of civil society and consumer advocacy groups
• Globalization of production, processing and trade
• Vertical integration and Consolidation
• “Supermarketization”, including in developing countries
• Increasing role of retailers as the last link between suppliers and consumers
• The use of B2B standards to protect reputations
• Emergence of coalitions (GFSI, BRC)
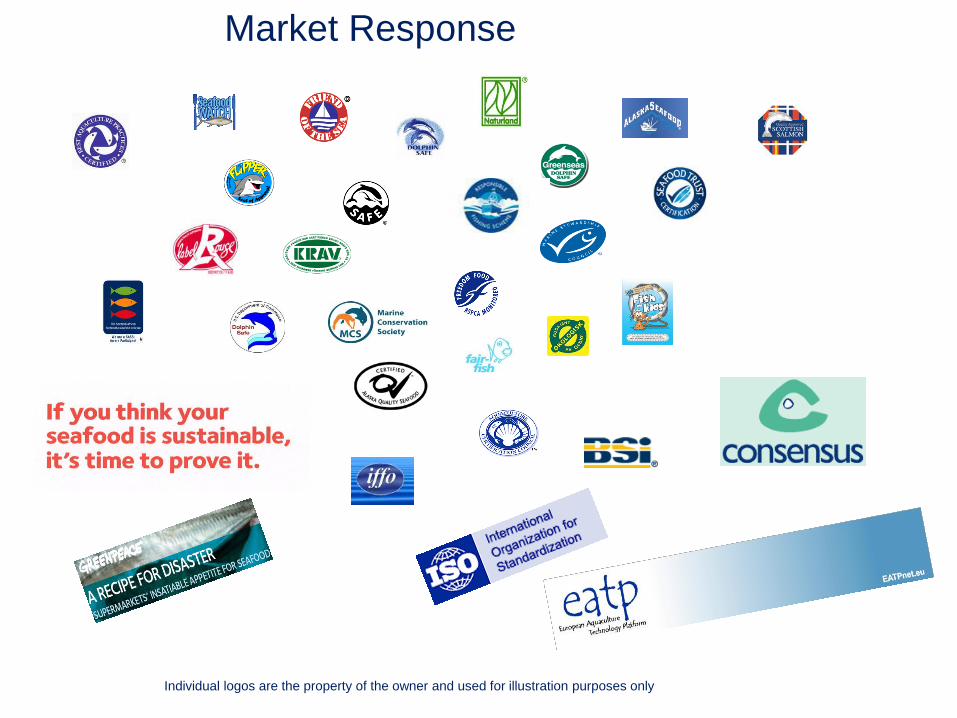
Market Response
Individual logos are the property of the owner and used for illustration purposes only

Do we not ALL have shared responsibility?
• Governments
• Policymakers
• Fisheries Bodies
• CSO’s
• Processors • Retailers • Catching
• Farming
Sector
Fisheries sustainability is too important to be left to International Organizations,
Governments, Industry, RFBs, CSOs or markets alone. All share the responsibility

!
!
Thank you!
Merci!
Gracias!
Спасибо!
Lahseno.org