Embed Size (px)
Citation preview
World Economic and Financial Surveys
Global Financial Stability ReportMarket Developments and Issues
March 2002
International Monetary FundWashington DC
© 2002 International Monetary Fund
Production: IMF Graphics SectionCover: Massoud Etemadi
Figures: Lai Oy LouieTypesetting: Choon Lee
ISBN 1-58906-105-5ISSN 0258-7440
Price: US$42.00(US$35.00 to full-time faculty members and
students at universities and colleges)
Please send orders to:International Monetary Fund, Publication Services
700 19th Street, N.W., Washington, D.C. 20431, U.S.A.Tel.: (202) 623-7430 Telefax: (202) 623-7201
E-mail: [email protected]:http://www.imf.org
recycled paper

The experience of the past decade with the rapid expansion of financial markets has underlined theimportance of a constant evaluation of the private sector capital flows that are the engine of world eco-nomic growth, but sometimes at the core of crisis developments as well. This experience demonstratesthat the opportunities offered by the international capital markets for enhancing global prosperitymust be balanced by a commitment to prevent debilitating financial crises.
The challenge facing the international community is to deepen our understanding of the potentialsystemic weaknesses and fault lines that have the potential to lead to crises. The International MonetaryFund is working on a comprehensive strategy aimed at safeguarding the stability and integrity of the in-ternational financial system by better understanding how to cope with the dynamics of rapidly evolvingcapital markets.
The founding of the IMF’s International Capital Markets Department in 2001 was an important stepin this effort to deepen our understanding of international capital flows and to strengthen the IMF’ssurveillance of developments in financial markets. The inauguration of the Global Financial StabilityReport, which now will become a quarterly publication of the IMF under the direction of theInternational Capital Markets Department, is aimed at this same purpose. I believe that this report willmake an important contribution to the effort to better understand the trends and issues that influencethe capital markets—thereby contributing to global financial stability and the prosperity of all ourmember countries.
Horst KöhlerManaging Director
iii
FOREWORD

Foreword iii
Preface ix
Chapter I. Overview 1
Chapter II. Recent Developments in International Capital Markets 5
The Recovery Rally 5What Are Markets Anticipating About Recovery? 9Emerging Market Financing 14References 22
Chapter III. Stability Implications of Global Financial Market Conditions 23
Financial Market Implications of Financial Imbalances and a Subdued Recovery 23How Effectively Is the Market for Credit Risk Transfer Vehicles Functioning? 36References 47
Chapter IV. Early Warning System Models: The Next Steps Forward 48
Current EWS Models at the IMF 49EWS: A Way Forward 53Conclusion 62References 62
Chapter V. Alternative Financial Instruments and Access to Capital Markets 65
Alternative Financial Instruments: What Are They and How Do They Work? 66Policy Implications 74Concluding Remarks 76
Boxes
2.1 Anticipating Economic Turnarounds: The Record of the Stock Market 102.2 Argentina and the Asset Class 163.1 Financial Implications of Enron’s Bankruptcy 414.1 The IMF’s Core Early Warning System Models—A Primer 504.2 Alternative Measures of Contagion 605.1 Recent Bond Warrants 715.2 The Structure of Future-Flow Securitizations—Modalities and
the Case of PEMEX 74
v
CONTENTS

Tables
2.1 Total Return Performance of Mature Equity Markets 72.2 U.S. Corporate Bond Total Returns 72.3 Emerging Market Financing 142.4 Performance of Emerging Bond Markets 142.5 Currency of Issue 192.6 Total Dollar Return Performance of Emerging Equity Markets 203.1 U.S. Financial Conditions During the 1990–91 and 2001 Recessions 253.2 Performance of Large European Banks 283.3 Performance of Major Japanese City Banks 295.1 Emerging Market Sovereign Bond and Loan Issues by Type 665.2 Market Conditions and Alternative Financial Instruments 67
Figures
2.1 Global Risk Aversion 52.2 Global Equity Markets 52.3 Net Purchases by Foreigners from U.S. Residents 62.4 U.S. Treasury Yield Differentials 62.5 S&P 500 Earnings Growth Forecasts for 2002 82.6 U.S. Treasury Credit Curves 82.7 U.S. Domestic Bond Issuance 92.8 The U.S. Dollar 92.9 Twelve-Month Forward Price-Earnings Ratio for the S&P 500 12
2.10 Twelve-Month Forward Price-Earnings Ratio of the Group of Three 122.11 Expected Policy Rates: Federal Funds Futures 132.12 Expected Changes in Forward Rates in the Group of Seven 132.13 Emerging Market Spreads 152.14 Average Cross-Correlation of Emerging Debt Markets 152.15 Emerging Market Spread Correlations with Argentina 182.16 Monthly Bond Issuance 182.17 Loan Issuance 202.18 Cumulative Gross Annual Issuance of Hard Currency Loans 202.19 Loan-Weighted Interest Margin 212.20 Net Foreign Purchases and Monthly Returns on Emerging Equity Markets 212.21 Capital Flows to Emerging Economies 223.1 United States: Financial Conditions, 1987–2001 243.2 Probability Density Functions for Group of Three Exchange Rates Implied
by Option Prices 263.3 Household and Corporate Sector Balance Sheets in the Euro Area and Japan 273.4 Japan Premium 303.5 United States: Household and Corporate Sector Balance Sheets and
Debt Services Ratios 313.6 Performance of Bank Stock Indices 323.7 Implied Earnings Growth Rates 333.8 Global Credit Derivatives Market Size and Structure 373.9 Key Characteristics of Credit Derivatives Markets 38
CONTENTS
vi

3.10 Spread Between Credit Derivatives Premium and Underlying Bond Spread 454.1 The IMF Early Warning System Models: Developing Country Studies Division
(DCSD) and Kaminsky, Lizondo, and Reinhart (KLR) Probabilities of Crisis 524.2 Forward Exchange Rates for Argentine Peso 544.3 Spot Price and Implied Probability Density Function for the Brazilian Real 554.4 Argentina and Turkey: External Liquidity and Debt Service Ratios 564.5 Slope of Default Swap Curve 574.6 Korea: Financial Institutions Index (1991–2001) 58
CONTENTS
vii
The following symbols have been used throughout this volume:
. . . to indicate that data are not available;
— to indicate that the figure is zero or less than half the final digit shown, or thatthe item does not exist;
– between years or months (for example, 1997–99 or January–June) to indicate theyears or months covered, including the beginning and ending years or months;
/ between years (for example, 1998/99) to indicate a fiscal or financial year.
“Billion” means a thousand million; “trillion” means a thousand billion.
“Basis points” refer to hundredths of 1 percentage point (for example, 25 basis pointsare equivalent to !/4 of 1 percentage point).
“n.a.” means not applicable.
Minor discrepancies between constituent figures and totals are due to rounding.
As used in this volume the term “country” does not in all cases refer to a territorial en-tity that is a state as understood by international law and practice. As used here, theterm also covers some territorial entities that are not states but for which statisticaldata are maintained on a separate and independent basis.

This is the first Global Financial Stability Report, a quarterly publication produced by the IMF’sInternational Capital Markets Department. It replaces two IMF publications: the annual InternationalCapital Markets Report (published since 1980) and the quarterly Emerging Market Financing (publishedsince 2000). The report was created to provide a more frequent assessment of global financial marketsand to address emerging market financing in a global context. The report focuses on current condi-tions in global financial markets, highlighting issues of financial imbalances, and of a structural nature,that could pose a risk to financial market stability and sustained market access by emerging market bor-rowers. As a quarterly, it will focus on relevant contemporary issues and not try to be a comprehensivesurvey of all potential risks, and on analyzing the financial ramifications of economic imbalances high-lighted by the IMF’s World Economic Outlook. It will regularly contain, as a special feature, articles onstructural or systemic issues relevant to international financial stability. Thus, the report is part of abroad effort by the IMF to strengthen bilateral and multilateral surveillance of international financialmarkets, with a view to promoting financial stability as a global public good. Other components of thisbroad effort include integrating financial market assessment with the World Economic Outlook, the WorldEconomic and Market Developments review, work on private sector involvement in the resolution of fi-nancial crises, work on standards and codes, the Financial Sector Assessment Program (FSAP), andSpecial Data Dissemination Standards (SDDS).
The Global Financial Stability Report was prepared in the International Capital Markets Department,under the direction of the Counsellor and Director, Gerd Häusler. The Global Financial Stability Reportproject is directed by an Editorial Committee comprised of Hung Q. Tran (Chairman), BankimChadha, Donald J. Mathieson, and Garry J. Schinasi, and benefits from comments and suggestions fromWilliam E. Alexander, Charles R. Blitzer, Matthew Fisher, Peter Dattels, Ronald Johannes, and L. EffiePsalida. Other contributors to the report from the International Capital Markets Department areTorbjorn Becker, Peter Breuer, Jorge Chan Lau, Anna Ilyina, Charles Kramer, Subir Lall, GabrielleLipworth, Jens Nystedt, Jorge Roldos, Srikant Seshadri, R. Todd Smith, Krishna Srinivasan, Amadou Sy,and James Yao. Martin Edmonds, Patricia Gillett, Silvia Iorgova, Anne Jansen, Oksana Khadarina, YoonSook Kim, Advin Pagtakhan, and Peter Tran provided research assistance. Maame Baiden, CarolineBagworth, Lucia Buono, Vera Jasenovec, Sheila Kinsella, Ramanjeet Singh, Adriana Vohden, and JoanWise provided expert word processing assistance. Jeff Hayden of the External Relations Department ed-ited the manuscript and coordinated production of the publication.
This particular quarterly issue of the report draws, in part, on a series of informal discussions withcommercial and investment banks, securities firms, asset management companies, insurance compa-nies, pension funds, stock and futures exchanges, and credit rating agencies in London, New York, andTokyo. The report contains data available up to February 8, 2002.
The study has benefited from comments and suggestions from staff in other IMF departments, aswell as from Executive Directors following their discussions of the Global Financial Stability Report onFebruary 27, 2002. However, the analysis and policy considerations are those of the contributing staffand should not be attributed to the Executive Directors, their national authorities, or the IMF.
ix
PREFACE
The year 2001 has yet again demon-strated how resilient the internationalfinancial system was in the face of anumber of serious challenges. In
chronological order, the past year saw the con-tinuing deflation of the telecom, media, andtechnology (TMT) bubble across global markets,the onset of a recession in the United Statesamid a synchronized global slowdown, a finan-cial crisis in Turkey, the terrorist attacks onSeptember 11, the record number of bankrupt-cies, and the default by Argentina after a longand drawn-out crisis. Throughout these events,several of which represented serious problemsrequiring prompt attention by the appropriateauthorities, the international financial systemhas shown remarkable resilience. This capacityto absorb shocks has been bolstered by the ro-bustness of the infrastructure of the financial sys-tem and the key players in it; the vigilance andready action of the financial and monetary au-thorities to ensure the smooth functioning ofthe system, including through the timely provi-sion of liquidity support; and the increasinglydiscriminating investment behavior of marketparticipants. Going forward, this resiliencewould again be tested if a global economic re-covery is subdued. However, the starting condi-tions this year would be weaker than those at thebeginning of 2001.
As analyzed in Chapter II, financial marketsended the year on a positive note. Equity mar-kets recovered and rallied noticeably from theirlows of late September. In bond markets, yieldspreads of corporates and high-yielding bonds,particularly emerging market bonds, narrowedagainst U.S. Treasuries. At the same time, theU.S. Treasury yield curve steepened, and theU.S. dollar has strengthened. Financial marketsthus anticipate, and have priced in, a recovery ineconomic activity and corporate earnings during2002. In the emerging market bond markets,
signs of financial contagion moderatedmarkedly. Fallout from the Argentina crisis anddefault has been quite limited, in contrast tomost previous experiences. The reasons for suchnoncontagion include more discriminating in-vestment behavior by market participants, thelack of any surprise element as the crisis slowlyproceeded to what the markets anticipatedwould be an inevitable default event, the gener-ally better economic policies, including the useof more flexible exchange rate regimes, adoptedby many emerging market countries, as well asvarious technical factors such as limited lever-aged positions and the significant reduction inArgentina’s weight in emerging market bond in-dexes, such as the EMBI+. New issuance byemerging market sovereign borrowers has re-vived since November and this rebound has con-tinued in the new year. For those emerging mar-ket countries, which have so far avoidedfinancial contagion from Argentina, it is impor-tant to reinforce the positive sovereign andcredit risk assessment currently held by investors.This can be most effectively achieved by bothstrengthening sustainable economic policieswhere necessary and consolidating the structuralreform achieved in recent years.
At present, the consensus view that the globaleconomy will recover during the course of 2002is being buttressed by recent economic statistics.In spite of this widespread expectation, as well asthe demonstrated resilience of the internationalfinancial system, there is no reason for compla-cency. In the view of many market participants,the risk of a subdued global economic recovery,subjecting the world to a second straight year ofslow growth, as well as opening a gap between fi-nancial market expectations and economic per-formance, is not insignificant. If that were to ma-terialize, it would exacerbate the financialimbalances and some of the underlying weak-ness in the financial sector. From a historical
1
CHAPTER I OVERVIEW

and cyclical perspective, it is important in themonths ahead to see whether the recovery ineconomic activity and corporate earnings willvalidate market expectations, especially for equi-ties. If not, the likely adjustment in asset pricesand deterioration in credit quality could erodethe still fragile business and consumer confi-dence. The implications of overleveraging andcredit quality deterioration, which would be ex-acerbated by a subdued recovery, for financialmarket stability are explored in Chapter III. First,downward asset price adjustment and further de-terioration in credit quality could weaken bal-ance sheets of corporates, households, and fi-nancial institutions in the major industrialcountries, all of which have increased their ex-posure to traded financial assets in recent years.Second, a subdued recovery would put furtherpressure on banks’ profitability. These develop-ments could be more worrisome in light of thefact that present levels of indebtedness in themajor industrial countries, both in the corporateand the household sectors, are high from a cycli-cal perspective. Their debt servicing burden isalso high relative to current income, despite thecyclically low interest rates. Consequently, ad-verse financial market developments could im-pair the incipient recovery and make a sustain-able recovery more difficult to achieve. Theappropriate policy response by the internationalcommunity to help sustain demand has been de-scribed in the IMF’s World Economic Outlook,December 2001. However, to the extent that theeventual recovery is accompanied by a furtherrise in the level of indebtedness, thereby increas-ing the sensitivity of these economies and finan-cial systems to financial asset price fluctuations,the situation warrants close monitoring in theperiod ahead.
Of some concern is the health of individualfinancial institutions in the major industrialcountries that have been weakened by the eventsof 2001. The resilience of the international fi-nancial system mentioned above has been duelargely to the strength of banking systems, and fi-nancial systems in general, in key countries, par-ticularly the United States. The banks in these
countries have built up their capital strengththrough improved profitability during the longexpansion of the 1990s, ongoing consolidation,and improvements in operational technologyand risk management practice. However,progress was not uniform or even among banksin the industrial countries; those lagging behindin the pace of consolidation and restructuringhave continued to cope with overcapacity, stiffcompetitive pressure, and sometimes poor prof-itability in their home markets even before thesynchronized growth slowdown. For some otherinstitutions, diversifying into overseas markets,including emerging markets, and pursuing newactivities, including lending to the telecom in-dustry and engaging in credit derivative busi-ness, have exposed them to the potential of ad-ditional losses. In particular, in Japan, the weightof nonperforming loans amid a prolonged pe-riod of deflation has seriously weakened manybanking institutions, leading to their downgrad-ing by the major rating agencies. Adverse finan-cial market developments would further squeezethe weak institutions between sharply reducedearnings expectations and a still rigid cost base,now burdened with the need for further loanloss provisioning. In the period ahead, such con-ditions would probably speed up the financialsector consolidation process, both in market andcross border.
Credit quality deterioration also provides animportant test of the performance and stabilityof the market for credit risk transfers that hasgrown rapidly in recent years. Overall, the prolif-eration of credit risk transfer instruments, in-cluding credit risk swaps, credit derivatives, andcollateralized debt obligations (CDOs), is a posi-tive step. It has enabled banks to remove creditexposures from their balance sheets and to dis-tribute them more widely among market partici-pants. In 2001, the market seemed to be able tocope with a series of credit events, with paymentsby and large being made by credit risk protec-tion sellers to protection buyers; even though insome cases only after arbitration (these caseshave led to improvements in the InternationalSwap and Derivatives Association documenta-
CHAPTER I OVERVIEW
2

tion, widely used in the market). Further deteri-oration in credit quality, which as a lagging indi-cator could persist for some time even if theglobal economy recovers, would continue to testthe market.
Independent of economic performance, sev-eral areas of risk are surfacing. First, to the ex-tent that regulatory arbitrage drives the growth ofthe market, banks may be encouraged to origi-nate more credit business than they would havedone otherwise, and then to transfer the creditrisks to non- or less-regulated entities, particu-larly with regard to capital adequacy require-ments, such as insurance companies and, to alesser degree, hedge funds. Banks, having signifi-cantly substituted traditional credit risks forcounterparty risks, now depend on their coun-terparties to perform when a credit event occursto keep their exposure within limits ex post. This,however, has been shown to be uncertain inmany cases. Second, the group of important non-traditional players has expanded to include indus-trial companies with an active financial arm. Dueto the lighter (or lack of) financial regulatoryregime, their disclosure has been less adequatethan from regulated financial institutions, lead-ing to a lack of information and transparencyabout the overall development of the marketand the pattern of risk distribution and concen-tration in the financial system. This makes it dif-ficult for market participants to gauge accuratelythe creditworthiness of companies and institu-tions in a timely fashion. Third, the complexity ofinstruments and transactions has grown overtime, and when a credit event occurs, it is notclear that all contracts can be expected to be au-tomatically executed in a way that protectionbuyers expect and with a high degree of cer-tainty. This is a risk even if one allows for thefact that new financial instruments will have“teething” problems initially as to solid legal doc-umentation. The collapse of Enron, and subse-quent events, illustrates the three areas of riskdescribed.
As a consequence, there seems to be the needto review and possibly improve regulatoryregimes in the industrial countries to keep pace
with the ongoing process of modernization andglobalization of finance. Specifically, there is theissue of regulatory arbitrage that might distortthe origination, distribution, and pricing ofcredit risks; and the need to identify and addressthe gaps in regulation that have allowed signifi-cant players in the financial markets, be theybanks or nonbanks, not to operate under a com-parable and consistent regulatory framework(“same business, same risk, same rule”). The na-tional authorities are already looking to developand enforce appropriate disclosure require-ments to enhance transparency in these com-plex markets. In addition, accounting rules andstandards are also in the process of being up-dated to address the increasing complexity of fi-nancial transactions. Of immediate interest isthe enhanced transparency of off-balance-sheetrisk management structures such as special pur-pose vehicles (SPVs)—particularly the extent towhich such vehicles genuinely remove risks fromthe balance sheet of the originating entity ratherthan merely disguise them. Such enhancedtransparency could strongly bolster the effective-ness of market discipline as the first line of de-fense against financial instability by enablingmarket participants to more clearly identify fi-nancial imbalances at an early stage. The result-ing repricing of credit to those institutions couldwork to limit the buildup of such vulnerabilitiesbefore they reach an unsustainable level and po-tentially pose risks to financial stability.
On the heels of slow global growth and ofcrises in Turkey and Argentina, the need to fur-ther develop and refine early warning systems(EWS) as a tool for crisis prevention has againbecome relevant to the international financialcommunity. Chapter IV analyzes the performanceof existing early warning system models that fo-cus mostly on foreign exchange markets. Theway forward includes building models for bank-ing and debt crises in addition to enhancing theexisting ones on foreign exchange crises, exam-ining the linkages among different types ofcrises and across countries (contagion), andmaking more efficient use of information em-bedded in financial asset prices. Chapter IV also
OVERVIEW
3

lays out a research program in this area for theIMF in the period ahead.
Chapter V addresses the role of alternativedebt instruments—other than new “plainvanilla” bonds and regular loan issues—in en-abling emerging market sovereigns to maintainaccess to global capital markets and better man-age their debt through risk diversification. Theneed for such instruments may increase at timesof financial stress, when investor appetite foremerging market debt could diminish and bor-rowing costs increase. In such circumstances,emerging market sovereigns often have adjusted
their debt management strategies, and havemade use of debt instruments embodying inno-vative features, including debt augmentations,time varying and state contingent instruments,structured notes, and collateralized borrowing.Chapter V evaluates these instruments and pres-ents a comparative analysis of the benefits andcosts of their use, including the risks of lockinginto high debt-service costs for prolongedperiod of time and creating inflexible debtstructures, as well as the implications of the dif-ficulty that markets often have in pricing theseinstruments.
CHAPTER I OVERVIEW
4

Changing perceptions of the economicslowdown and the prospects for recov-ery dominated global market develop-ments during the fourth quarter of last
year, and continue to do so in 2002. Marketshad reacted strongly to the events of September11, before staging a sharp rally from the begin-ning of the quarter as global risk aversion sub-sided (see Figure 2.1).1 The heightened marketuncertainty associated with the events surround-ing September 11 initially translated into highlevels of risk aversion at the beginning of thefourth quarter. Measures of risk aversionsteadily dissipated during October and Novem-ber, with a consensus emerging that, in hind-sight, financial markets overreacted to the po-tential impacts of the September 11 events. Thesubsequent rally, in conjunction with a strongrevision of views on economic recovery and itsstrength and scope, was also influenced by sev-eral technical factors and ample liquidity on thepart of investors.
The Recovery RallyDuring October and November, financial
markets rose markedly to price in an imminentrecovery in global activity, led by the UnitedStates, though opinion remained divided on thetiming and speed of the recovery (see Figure2.2). These expectations of economic recoverycombined with a decline in the “political” riskpremium, reflecting progress in the operationin Afghanistan, and led to a decline in measuresof global risk aversion to well below pre-
5
CHAPTER IIRECENT DEVELOPMENTS IN INTERNATIONAL CAPITAL MARKETS
Figure 2.1. Global Risk Aversion
Source: JP Morgan Chase.
0
10
20
30
40
50
60
70
80
90
100
022001200019991998
One standarddeviation
Mean
September 11
Figure 2.2. Global Equity Markets(January 2001 = 100)
Source: Bloomberg L.P.
50
60
70
80
90
100
110
120
Jan.2002
Oct.JulyApr.Jan.
September 11Recovery ExpectationsSlowdown Concerns
Dow
Emerging Market Free
All Country WorldIndex Free
Interest raterelief
Interest raterelief
Nasdaq
2001
1JP Morgan’s Liquidity and Credit Premia Index(LCPI). This index attempts to measure risk aversionmore broadly, and, therefore, captures not only risk ap-petite but also the liquidity premia demanded in U.S. fi-nancial markets. See the IMF’s Emerging Market Financing(November 14, 2001) for a detailed discussion.
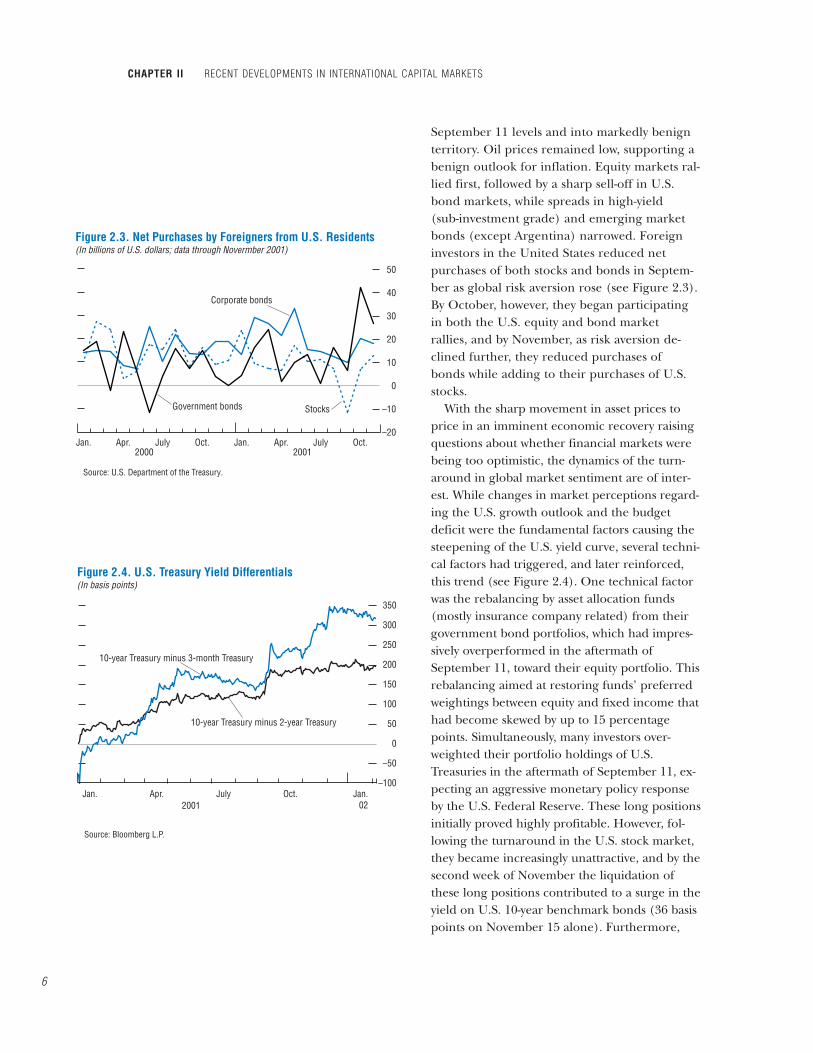
September 11 levels and into markedly benignterritory. Oil prices remained low, supporting abenign outlook for inflation. Equity markets ral-lied first, followed by a sharp sell-off in U.S.bond markets, while spreads in high-yield(sub-investment grade) and emerging marketbonds (except Argentina) narrowed. Foreigninvestors in the United States reduced netpurchases of both stocks and bonds in Septem-ber as global risk aversion rose (see Figure 2.3).By October, however, they began participatingin both the U.S. equity and bond marketrallies, and by November, as risk aversion de-clined further, they reduced purchases ofbonds while adding to their purchases of U.S.stocks.
With the sharp movement in asset prices toprice in an imminent economic recovery raisingquestions about whether financial markets werebeing too optimistic, the dynamics of the turn-around in global market sentiment are of inter-est. While changes in market perceptions regard-ing the U.S. growth outlook and the budgetdeficit were the fundamental factors causing thesteepening of the U.S. yield curve, several techni-cal factors had triggered, and later reinforced,this trend (see Figure 2.4). One technical factorwas the rebalancing by asset allocation funds(mostly insurance company related) from theirgovernment bond portfolios, which had impres-sively overperformed in the aftermath ofSeptember 11, toward their equity portfolio. Thisrebalancing aimed at restoring funds’ preferredweightings between equity and fixed income thathad become skewed by up to 15 percentagepoints. Simultaneously, many investors over-weighted their portfolio holdings of U.S.Treasuries in the aftermath of September 11, ex-pecting an aggressive monetary policy responseby the U.S. Federal Reserve. These long positionsinitially proved highly profitable. However, fol-lowing the turnaround in the U.S. stock market,they became increasingly unattractive, and by thesecond week of November the liquidation ofthese long positions contributed to a surge in theyield on U.S. 10-year benchmark bonds (36 basispoints on November 15 alone). Furthermore,
CHAPTER II RECENT DEVELOPMENTS IN INTERNATIONAL CAPITAL MARKETS
6
Figure 2.3. Net Purchases by Foreigners from U.S. Residents(In billions of U.S. dollars; data through Novermber 2001)
Source: U.S. Department of the Treasury.
–20
–10
0
10
20
30
40
50
Oct.JulyApr.Jan.Oct.JulyApr.Jan.
Corporate bonds
Government bonds Stocks
2000 2001
Figure 2.4. U.S. Treasury Yield Differentials(In basis points)
–100
–50
0
50
100
150
200
250
300
350
Jan.02
Oct.JulyApr.Jan.
10-year Treasury minus 3-month Treasury
10-year Treasury minus 2-year Treasury
2001
Source: Bloomberg L.P.

portfolios including mortgage backed securities(MBS) faced a significant increase in the dura-tion of their holdings as a result of the decline ininterest rates (by as much as 40 percent). In or-der to bring the duration of their portfolios back,MBS holders sold longer maturity U.S. Treasurybonds, such as the benchmark 10-year, therebycontributing to the spike in yields.
During the fourth quarter, equity market per-formance also reflected perceptions of recovery.Morgan Stanley’s All Country World Index—Free (ACWIF) gained 9 percent, the S&P 500rose 10 percent, while the Nasdaq posted arecord quarterly return of 30 percent. An indi-cation of investor expectations driving the rallyis provided by the fact that cyclical sectors(mainly consumer durables, commercial serv-ices, and technology) significantly outper-formed defensive sectors during the rally, indi-cating investors were positioning for animminent recovery (see Table 2.1). A similarpattern was also in evidence in European mar-kets, whereas there is little evidence of Japaneseequities pricing in a strong economic recovery.The impact of the crisis in Argentina, however,sparked a sell-off in Spanish stocks, especiallybanks and telecom companies. The strong re-bound in emerging equity markets (see Figure 2.2),viewed as a “high beta” (that is, more than pro-
portional comovement) play on the state ofthe global economy, exactly on cue with globalequity markets, also suggests investor position-ing on expectations of a global recovery.Technology was by far the best performingsector, with returns for the sector exceeding theaverage for other sectors by more than twostandard deviations. This equity market rallyoccurred despite continuing downward revisionsto near term corporate earnings forecasts (seeFigure 2.5). The rally lost some steam in earlyDecember and January, coinciding with Enron’sbankruptcy filing, which raised, among otherthings, doubts about the reliability of corporateincome statements.
The increasing appetite for risk in the fourthquarter was clearly apparent in credit markets,where, for example, in the United States thepronounced flight to quality of the third quarterin the aftermath of September 11 was more thanreversed (see Table 2.2). In sharp contrast to thethird quarter, where returns were positively re-lated to credit ratings, returns in the fourthquarter were inversely related to credit ratings.European investment grade corporates per-formed similarly, with evidence of flight to qual-ity in the third quarter (while AAA corporatesposted a 3.3 percent return, BBB corporates hada –0.7 percent return) followed by a partial re-versal in the fourth quarter.
The post-September 11 steepening of the“credit quality curve” (average spreads measuredagainst average credit quality of issuers) was fullyreversed by early December (see Figure 2.6). By
THE RECOVERY RALLY
7
Table 2.1. Total Return Performance of MatureEquity Markets(In percent)
Jul. 1– Sep.10– Sep. 21– Sep.10–Sep. 10 Sep. 21 Dec. 31 Dec. 31
MSCI US$ index –10.7 –11.6 18.2 4.5Cyclical sectors –17.2 –16.1 27.5 7.0Defensive sectors –2.5 –6.7 8.6 1.3Banks and financials –11.8 –12.5 21.8 6.6
MSCI EU$ index –10.0 –13.9 23.8 6.7Cyclical sectors –11.3 –17.4 31.4 8.6Defensive sectors –9.4 –7.7 15.4 6.5Banks and financials –8.5 –20.7 29.8 2.9
MSCI Japan$ index –14.4 –4.1 –6.2 –10.1Cyclical sectors –17.9 –8.1 3.1 –5.3Defensive sectors –9.6 4.9 –12.7 –8.4Banks and financials –6.3 –1.9 –29.6 –30.9
Sources: Morgan Stanley Capital International; and IMF staffestimates.
Table 2.2. U.S. Corporate Bond Total Returns(In percent)
Sept. 10– Third Fourth Year-Sept. 26 Quarter Quarter 2001 to-Date1
AAA 0.9 4.8 0.5 9.4 1.2AA 0.8 4.6 0.9 10.7 1.3A 0.5 4.4 0.7 11.0 0.9BBB –0.1 3.7 0.8 10.5 0.4BB –4.9 –1.9 4.4 11.1 –0.3B –6.2 –4.9 6.5 2.6 0.9C –9.7 –8.3 7.0 4.3 –0.2
Source: Merrill Lynch.1February 8.

early January, reflecting expectations of eco-nomic recovery and a further move down thecredit spectrum, the credit quality curve had flat-tened relative to pre-September 11 levels.However, high-yield spreads remain high by his-torical standards, consistent with market expec-tations (reinforced by the bankruptcies ofEnron, Kmart, and Global Crossing) of contin-ued high rates of corporate defaults. For theyear as a whole, investment grade bonds postedtheir best year since 1995, while high-yield bondsturned in a modestly positive performance aftera dismal 2000.
In primary markets, U.S. high (investment)grade corporate bond issuance reached a recordweekly level of $27 billion by the end of October,reflecting pent up demand to issue as a result ofdisruptions in the aftermath of September 11,and an increased demand to issue debt in thelow interest rate environment (see Figure 2.7).With the rally in credit markets losing steam bylate November, and many issuers having pre-financed their needs, high-grade issuance fellwell below average levels by the end of the year,picking up again in early January. High-yield is-suance, in contrast, was slow to recover, notreaching weekly average levels over the previousyear until December and was slow to pick upagain in January.
The fourth quarter saw a pickup in syndicatedlending in the mature markets. Lenders, how-ever, remained discriminating regarding creditquality, with U.S. bank lending standardscontinuing to tighten. Refinancings continuedto dominate deal flows as borrowers sought totake advantage of lower interest rates, and theinterest rate cycle was perceived as reaching aturning point (see next subsection). Reflectingthe impact of the global slowdown and thesharp fall off in mergers and acquisitions andtelecom financing, however, 2001 volumes weresignificantly lower than in 2000, with Euroloanvolumes down roughly 30 percent. This declinein activity, and reliance on refinancings, is re-portedly placing pressure on banks, with (standalone) investment banks suffering dispropor-tionately, as commercial banks increasingly tie
CHAPTER II RECENT DEVELOPMENTS IN INTERNATIONAL CAPITAL MARKETS
8
Figure 2.5. S&P 500 Earnings Growth Forecasts for 2002(Percent change, year-on-year)
Source: Thomson Financial First Call.
Q1
Q2
Q3
–10
–5
0
5
10
15
20
25
30
35
Feb. 2001Oct. 2001Sept. 2001
Q1
Q2
Q3
Q1
Q2
Figure 2.6. U.S. Treasury Credit Curves(Spreads in basis points)
Source: Merrill Lynch.
0
200
400
600
800
1000
BBBBBBAAAAAA
October 1
September 1
Two-year average
February 8

the less lucrative extension of their balancesheets to the provision of more profitablefee-driven business. The move to a “one-stopshop” reflects not only the strengthened posi-tion of commercial banks with a large balancesheet in the context of the global slowdown, butalso the advances made by some of these banksin developing their mergers and acquisitionsand investment banking businesses in recentyears.
In foreign exchange markets, consistent with theview that global economic recovery was not onlyimminent but would be led by the UnitedStates, the U.S. dollar strengthened (see Figure2.8). At the same time, data confirmed furtherweakening in Japan, and the yen suffered asharp sell off to levels not seen since 1998. Theeuro, while weakening against the dollar,strengthened sharply against the yen duringthe quarter.
What Are Markets AnticipatingAbout Recovery?
The speed and magnitude of the turnaroundin global markets during the fourth quarter of2001 on expectations of a turnaround in theglobal economy, led by the United States, wereremarkable. Such a turnaround raised questionsabout whether the equity market rally, and inparticular the performance of telecom, media,and technology (TMT) stocks, was justified byfundamentals, and the extent to which it repre-sented a liquidity-driven “bear market rally” andeven a “new tech bubble.”
On the one hand, many view the run up inequity markets as appropriately pricing in therecovery, brought forward by the decisive mone-tary and fiscal policy responses, and view therecent positive economic data as ratifying theseexpectations. Box 2.1 examines the anticipationof economic recovery by equity markets in pastrecessions. Many argue that precisely becausethe cyclical downturn partly reflects the burst-ing of the tech bubble, recovery will be fastsince the half-life of technology investmentspending is estimated at only 18 months com-
WHAT ARE MARKETS ANTICIPATING ABOUT RECOVERY?
9
Figure 2.7. U.S. Domestic Bond Issuance(In billions of U.S. dollars)
Source: Bloomberg L.P.
September 11
Investment grade bond issuance
High-yield bond issuance
Averages
2001
0
5
10
15
20
25
30
Jan.02
Nov.Sept.JulyMayMar.Jan.
Figure 2.8. The U.S. Dollar
Source: Bloomberg L.P.
Yen/US$
95
100
105
110
115
120
Jan.02
Nov.Sept.JulyMayMar.Jan.
Euro/US$
Trade weighted
2001

CHAPTER II RECENT DEVELOPMENTS IN INTERNATIONAL CAPITAL MARKETS
10
How well have stock markets done in antici-pating recovery from past recessions?
The first four Figures document the historicalbehavior of stock markets during the six reces-sions since 1970, where the National Bureau ofEconomic Research’s (NBER) definitions of re-cessions are denoted by the shaded areas. Since1970, U.S. recessions have lasted between 7 to17 months and averaged about 12 months.
The data suggest that in the previous five re-cessions, equity markets have in fact had a rela-tively “good” record in anticipating the end of reces-sions. That is to say, historically, at least in theUnited States, equity markets began rising in an-ticipation of recovery, that is, before the end of
recessions, and, critically, these expectations ofrecovery were validated, that is, the recessionsended soon after.
By how much did the recoveries in stockmarkets precede the economic recoveries?Troughs in equity markets preceded the endof recessions as defined by the NBER on aver-age by 4.4 months, and turning points inindustrial production by a similar 4.2 months.The beginning of the equity market recoveryrallies generally occurred ahead of turn-arounds in corporate earnings, which occurredon average slightly more than a quarter later(based on quarterly data; see the Table). Ifthe recession of 1981–82, where earnings
Box 2.1. Anticipating Economic Turnarounds: The Record of the Stock Market
S&P 500 and Changes in Industrial Production1
Source: Primark Datastream. 1Shaded areas mark U.S. recessions.
Industrial production (right scale; year-on-year in percent)
60
80
100
120
140
160
180
848280787674721970–20
–15
–10
–5
0
5
10
15
20
S&P 500(left scale)
S&P 500 and Changes in Corporate Earnings1
Sources: I/B/E/S; Primark Datastream. 1Shaded areas mark U.S. recessions.
Corporate earnings (right scale; year-on-year in percent)
S&P 500(left scale)
848280787674721970–30
–20
–10
0
10
20
30
40
60
80
100
120
140
160
180
Comparing Troughs: Stock Market Troughs Versus Industrial Production and Corporate Earnings’ Troughs
Lags in Months_____________________________________U.S. Stock Industrial Lags in Quarters______________
Recession Dates1 Market Trough2 End of recession production trough Earnings trough
Dec. 1969 to Nov. 1970 June 1970 5 4 2Nov. 1973 to Mar. 1975 October 1974 5 7 1Jan. 1980 to Jul. 1980 April 1980 3 3 2Jul. 1981 to Nov. 1982 July 1982 4 2 –1Jul. 1990 to Mar. 1991 November 1990 5 5 2Mar. 2001 to present October 2001 . . . . . . . . .
Average Past Recessions 4.4 4.2 1.2
Sources: IMF staff estimates; and Thomson Financial First Call.1National Bureau of Economic Research.2S&P 500.

WHAT ARE MARKETS ANTICIPATING ABOUT RECOVERY?
11
actually began to rebound before the stockmarket trough, is excluded, the average was1.75 quarters. These averages can be viewedas the average time it took for the recoveriesin equity markets to be validated by actualdevelopments in the real economy. In reality,of course, these should be viewed as minimumtimes for the equity market rebound to bevalidated by data since it is only after theavailability of (several) post turning pointdata that the trough would clearly becomeapparent.
Turning to the current recession:• The equity market has already had one false
start in April–May 2001, in predicting an eco-nomic recovery.
• For the present rebound in equity markets tobe validated by developments in the real econ-omy in accordance with past historical experi-ence, industrial production would need to havereached a turning point (trough in year-on-yeargrowth) between November of last year andFebruary of this year.
• Similarly, corporate earnings would have to turnaround in the first quarter of this year. Histori-cally, corporate earnings (see the fifth Figure)have troughed four to seven quarters (meas-ured along the x-axis) following their pre-re-
cession peak (an index value of 100). Currentmarket expectations on earnings are for stableearnings in the first quarter of 2002 (sevenquarters into the downturn), and a recoveryduring the second quarter, which is in linewith earnings experience from past reces-sions. Based on historical trends, industrialproduction and earnings need to turn aroundthis quarter. If this turnaround does not mate-rialize, there is a risk of a market correction.
S&P 500 and Changes in Industrial Production1
Source: Primark Datastream. 1Shaded areas mark U.S. recessions.
S&P 500
Industrial production (right scale; year-on-year in percent)
–10
–8
–6
–4
–2
0
2
4
6
8
10
250
450
650
850
1050
1250
1450
2000989694921990 2000989694921990
S&P 500 and Changes in Corporate Earnings1
Sources: I/B/E/S; Primark Datastream. 1Shaded areas mark U.S. recessions.
S&P 500 (left scale)
Corporate earnings (right scale; year-on-year
in percent)
–30
–20
–10
0
10
20
30
250
450
650
850
1050
1250
1450
U.S. Corporate Earnings (Actual) Index
Source: I/B/E/S.
ConsensusForecasts
60
80
100
120
Peak Q2
Peak Q4 1981
Peak Q1 1980
Peak Q2 1974
121110987654321
Peak Q2 2000
110
90
70
Quarters

pared to several years for traditional physicalcapital. The optimists argue that the run up inTMT sector equity prices is justified by changesin fundamentals, with signs that excess capac-ity in the sector is being worked off, and the“winners being picked,” thereby creating thenecessary conditions for fast profit growth inthe sector. Others view the September 11 eventsas having created a (V-shaped) kink in anotherwise unaltered U-shaped recovery and,therefore, not representative of broader recov-ery. These market participants see the equitymarket rebound as pricing in a quick reboundin earnings growth that is faster than wasevident in previous business cycles. The pes-simists argue that the overcapacity built upduring the TMT bubble will in fact take longer(than previous business cycles) to work off, as it would only follow a recovery in othersectors.
With the expectations of imminent economicrecovery driving financial markets since thelast quarter, many policymakers are cautioningthat markets may be getting ahead of them-selves. While, as Box 2.1 notes, equity marketshave had a “good” record in anticipating thetiming of recovery, the combination of risingequity prices and falling earnings estimateshas pushed the 12-month forward price-earningsratio for the S&P 500, as well as for other coun-tries (e.g., Germany), to higher than averagelevels (see Figures 2.9 and 2.10). This has ledto concerns about the sustainability of growthassumptions priced into the stock marketvaluations.2
In other markets, many market participantsview the sell off in the U.S. bond market in the sec-ond week of November as having been consider-ably exaggerated by technical factors as notedabove. Similarly, there is a consensus that “capit-ulation” selling in the federal funds futures mar-ket resulted in a disconnect in the form of a verypronounced U shape for federal funds futures—
CHAPTER II RECENT DEVELOPMENTS IN INTERNATIONAL CAPITAL MARKETS
12
Figure 2.9. Twelve-Month Forward Price-Earnings Ratio for the S&P 500
Source: I/B/E/S.
5 year average=21.1
10 year average=17.3
average for entire period=15.2
5
10
15
20
25
021985 88 91 94 97 2000
Figure 2.10.Twelve-Month Forward Price-Earnings Ratio for theGroup of Three
Source: I/B/E/S.
German DAX
Japanese Topix (right scale)
S&P 500
0
5
10
15
20
25
30
0
10
20
30
40
50
60
70
80
1988 90 92 94 96 98 2000 02
2See, for example, IMF, International Capital Markets(various issues through 2001).
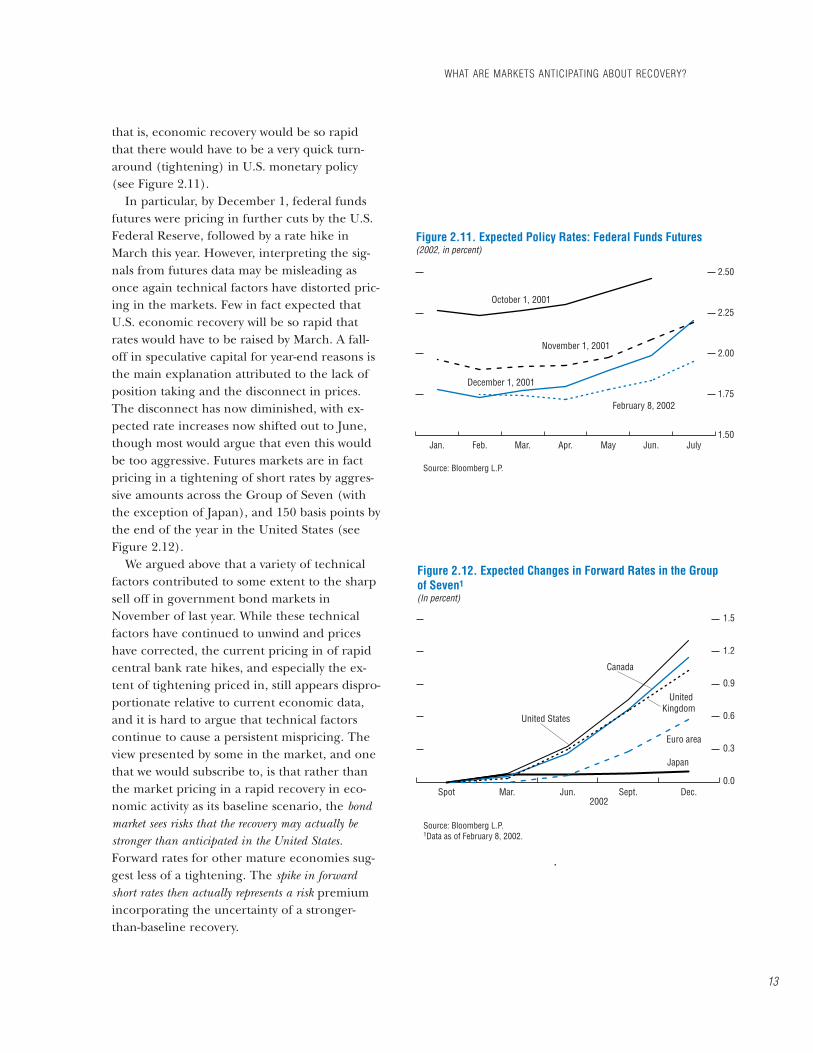
that is, economic recovery would be so rapidthat there would have to be a very quick turn-around (tightening) in U.S. monetary policy(see Figure 2.11).
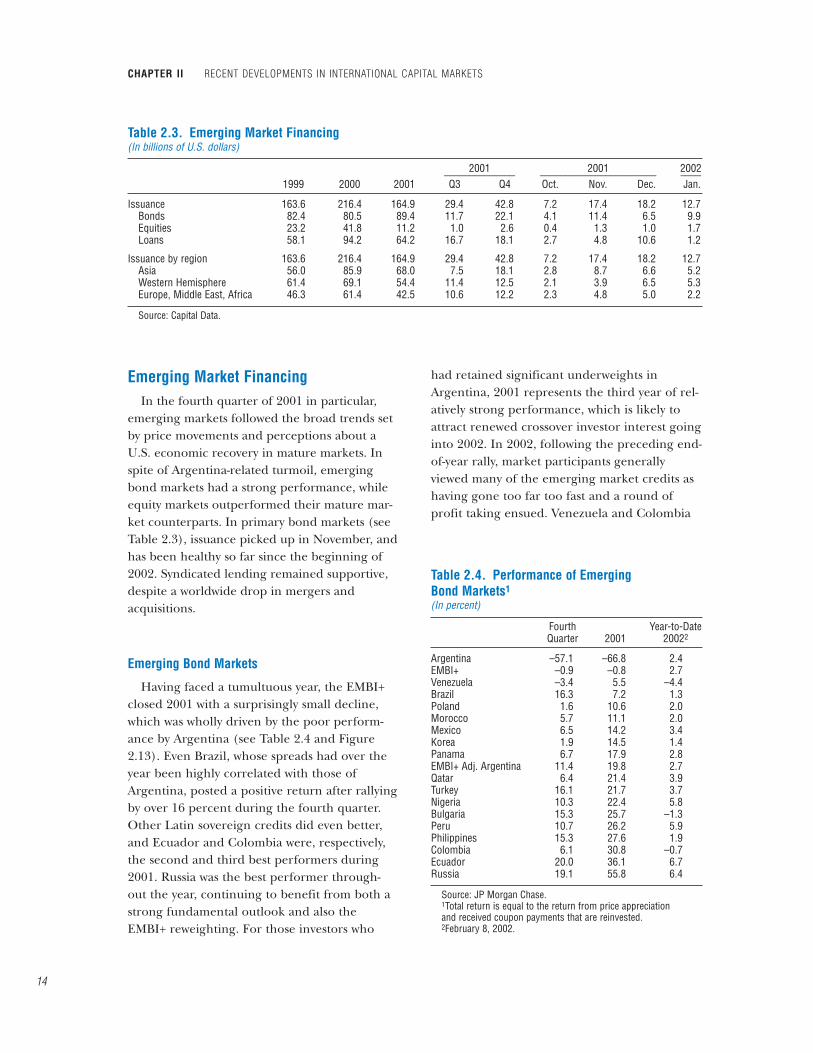
In particular, by December 1, federal fundsfutures were pricing in further cuts by the U.S.Federal Reserve, followed by a rate hike inMarch this year. However, interpreting the sig-nals from futures data may be misleading asonce again technical factors have distorted pric-ing in the markets. Few in fact expected thatU.S. economic recovery will be so rapid thatrates would have to be raised by March. A fall-off in speculative capital for year-end reasons isthe main explanation attributed to the lack ofposition taking and the disconnect in prices.The disconnect has now diminished, with ex-pected rate increases now shifted out to June,though most would argue that even this wouldbe too aggressive. Futures markets are in factpricing in a tightening of short rates by aggres-sive amounts across the Group of Seven (withthe exception of Japan), and 150 basis points bythe end of the year in the United States (seeFigure 2.12).
We argued above that a variety of technicalfactors contributed to some extent to the sharpsell off in government bond markets inNovember of last year. While these technicalfactors have continued to unwind and priceshave corrected, the current pricing in of rapidcentral bank rate hikes, and especially the ex-tent of tightening priced in, still appears dispro-portionate relative to current economic data,and it is hard to argue that technical factorscontinue to cause a persistent mispricing. Theview presented by some in the market, and onethat we would subscribe to, is that rather thanthe market pricing in a rapid recovery in eco-nomic activity as its baseline scenario, the bondmarket sees risks that the recovery may actually bestronger than anticipated in the United States.Forward rates for other mature economies sug-gest less of a tightening. The spike in forwardshort rates then actually represents a risk premiumincorporating the uncertainty of a stronger-than-baseline recovery.
WHAT ARE MARKETS ANTICIPATING ABOUT RECOVERY?
13
Figure 2.11. Expected Policy Rates: Federal Funds Futures(2002, in percent)
Source: Bloomberg L.P.
October 1, 2001
1.50
1.75
2.00
2.25
2.50
JulyJun.MayApr.Mar.Feb.Jan.
November 1, 2001
December 1, 2001
February 8, 2002
Figure 2.12. Expected Changes in Forward Rates in the Group of Seven1
(In percent)
Source: Bloomberg L.P. 1Data as of February 8, 2002.
United States
0.0
0.3
0.6
0.9
1.2
1.5
Dec.Sept.Jun.Mar.Spot
Canada
United Kingdom
Euro area
Japan
2002
Emerging Market FinancingIn the fourth quarter of 2001 in particular,
emerging markets followed the broad trends setby price movements and perceptions about aU.S. economic recovery in mature markets. Inspite of Argentina-related turmoil, emergingbond markets had a strong performance, whileequity markets outperformed their mature mar-ket counterparts. In primary bond markets (seeTable 2.3), issuance picked up in November, andhas been healthy so far since the beginning of2002. Syndicated lending remained supportive,despite a worldwide drop in mergers andacquisitions.
Emerging Bond Markets
Having faced a tumultuous year, the EMBI+closed 2001 with a surprisingly small decline,which was wholly driven by the poor perform-ance by Argentina (see Table 2.4 and Figure2.13). Even Brazil, whose spreads had over theyear been highly correlated with those ofArgentina, posted a positive return after rallyingby over 16 percent during the fourth quarter.Other Latin sovereign credits did even better,and Ecuador and Colombia were, respectively,the second and third best performers during2001. Russia was the best performer through-out the year, continuing to benefit from both astrong fundamental outlook and also theEMBI+ reweighting. For those investors who
had retained significant underweights inArgentina, 2001 represents the third year of rel-atively strong performance, which is likely toattract renewed crossover investor interest goinginto 2002. In 2002, following the preceding end-of-year rally, market participants generallyviewed many of the emerging market credits ashaving gone too far too fast and a round ofprofit taking ensued. Venezuela and Colombia
CHAPTER II RECENT DEVELOPMENTS IN INTERNATIONAL CAPITAL MARKETS
14
Table 2.3. Emerging Market Financing (In billions of U.S. dollars)
2001 2001 2002______________ _______________________ ____1999 2000 2001 Q3 Q4 Oct. Nov. Dec. Jan.
Issuance 163.6 216.4 164.9 29.4 42.8 7.2 17.4 18.2 12.7Bonds 82.4 80.5 89.4 11.7 22.1 4.1 11.4 6.5 9.9Equities 23.2 41.8 11.2 1.0 2.6 0.4 1.3 1.0 1.7Loans 58.1 94.2 64.2 16.7 18.1 2.7 4.8 10.6 1.2
Issuance by region 163.6 216.4 164.9 29.4 42.8 7.2 17.4 18.2 12.7Asia 56.0 85.9 68.0 7.5 18.1 2.8 8.7 6.6 5.2Western Hemisphere 61.4 69.1 54.4 11.4 12.5 2.1 3.9 6.5 5.3Europe, Middle East, Africa 46.3 61.4 42.5 10.6 12.2 2.3 4.8 5.0 2.2
Source: Capital Data.
Table 2.4. Performance of EmergingBond Markets1
(In percent)
Fourth Year-to-DateQuarter 2001 20022
Argentina –57.1 –66.8 2.4EMBI+ –0.9 –0.8 2.7Venezuela –3.4 5.5 –4.4Brazil 16.3 7.2 1.3Poland 1.6 10.6 2.0Morocco 5.7 11.1 2.0Mexico 6.5 14.2 3.4Korea 1.9 14.5 1.4Panama 6.7 17.9 2.8EMBI+ Adj. Argentina 11.4 19.8 2.7Qatar 6.4 21.4 3.9Turkey 16.1 21.7 3.7Nigeria 10.3 22.4 5.8Bulgaria 15.3 25.7 –1.3Peru 10.7 26.2 5.9Philippines 15.3 27.6 1.9Colombia 6.1 30.8 –0.7Ecuador 20.0 36.1 6.7Russia 19.1 55.8 6.4
Source: JP Morgan Chase.1Total return is equal to the return from price appreciationand received coupon payments that are reinvested.2February 8, 2002.
were in particular focus during this latestsell-off.
In December, Argentina completed one ofthe largest bond swaps to date. It exchanged$41 billion of original dollar and peso-denomi-nated government bonds for guaranteed loanspaying a below market coupon and which repre-sented a maturity extension for many participat-ing bondholders. By replacing a largely non-tradable loan in exchange for a bond, the swapreduced significantly the amount of debt eligi-ble for inclusion in the EMBI+, with significanteffects on the emerging market bond asset classas a whole (Box 2.2). JP Morgan adjustedArgentina’s EMBI+ weight for the exchange intwo steps. The first step, which took place onDecember 5, adjusted for the bonds that wereswapped by simply reducing the face value ofthe bonds tendered into the exchange andbrought Argentina’s weight to 5 percent from10.6 percent. In the second step, on December31, the index was adjusted taking into accountliquidity requirements—that is, some bonds hadto be automatically excluded if the face value ofthe outstanding bonds fell below $500 million,or they became illiquid. This last adjustmentbrought the Argentine weight to 2.6 percent,thus allowing investors to safely have zero alloca-tions to the credit without incurring large risksof underperforming the benchmark in the (un-likely) event of a large rally in Argentine bondprices.
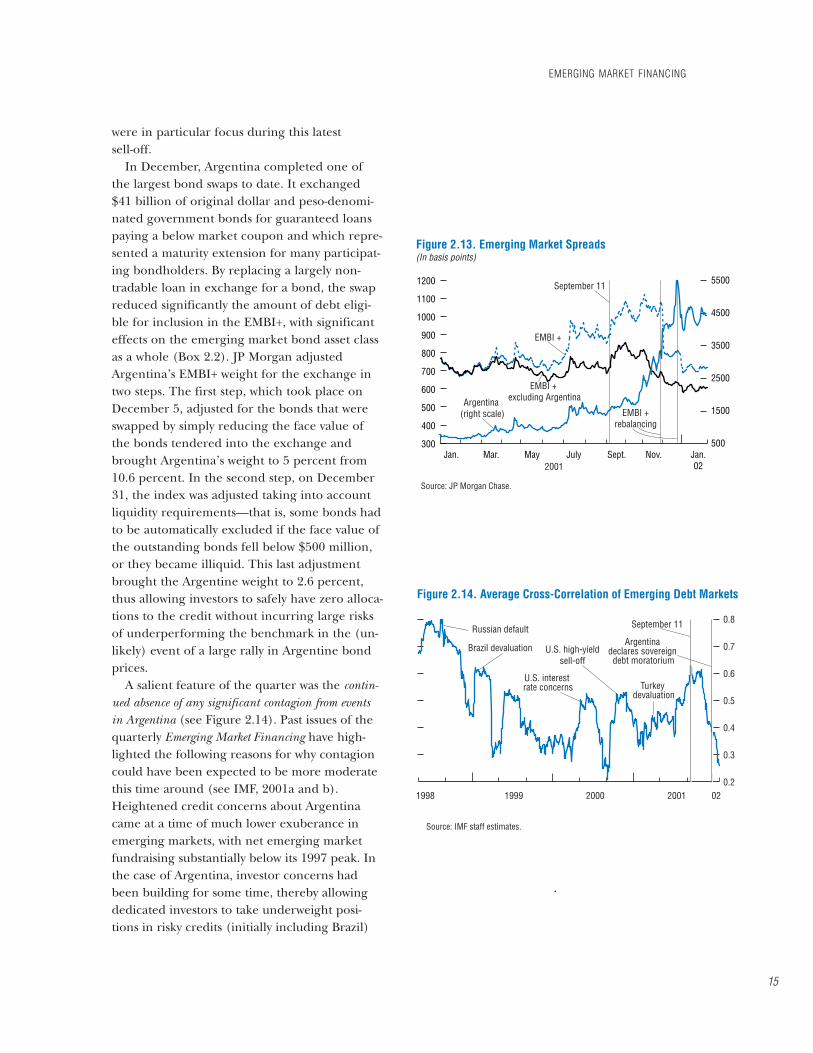
A salient feature of the quarter was the contin-ued absence of any significant contagion from eventsin Argentina (see Figure 2.14). Past issues of thequarterly Emerging Market Financing have high-lighted the following reasons for why contagioncould have been expected to be more moderatethis time around (see IMF, 2001a and b).Heightened credit concerns about Argentinacame at a time of much lower exuberance inemerging markets, with net emerging marketfundraising substantially below its 1997 peak. Inthe case of Argentina, investor concerns hadbeen building for some time, thereby allowingdedicated investors to take underweight posi-tions in risky credits (initially including Brazil)
EMERGING MARKET FINANCING
15
Figure 2.13. Emerging Market Spreads(In basis points)
Source: JP Morgan Chase.
September 11
EMBI +
Argentina (right scale)
300
400
500
600
700
800
900
1000
1100
1200
Jan.02
Nov.Sept.JulyMayMar.Jan.500
1500
2500
3500
4500
5500
EMBI + excluding Argentina
EMBI +rebalancing
2001
Figure 2.14. Average Cross-Correlation of Emerging Debt Markets
Source: IMF staff estimates.
Russian default
Brazil devaluation U.S. high-yieldsell-off
0.2
0.3
0.4
0.5
0.6
0.7
0.8September 11
Argentina declares sovereign debt moratorium
Turkey devaluation
U.S. interest rate concerns
1998 1999 2000 2001 02

CHAPTER II RECENT DEVELOPMENTS IN INTERNATIONAL CAPITAL MARKETS
16
Argentina’s large stock of foreign currencydenominated bonds had been an importantsource of market concern about potential conta-gion in the run up to a default. Recently,Argentina had the highest or second highestweight in the EMBI+, and the sovereign was alsothe largest emerging market issuer in the euro-market. Even during non-crisis times, dedicatedinvestors benchmarked to the EMBI+ kept a“structural” underweight toward Argentina, inan attempt not to concentrate their portfoliosexcessively in one credit. Given Argentina’slarge weight, however, these investors could notreduce their portfolio allocations to zero inArgentina without running the risk of larger-than-tolerable index tracking error. Hence,there was a fear that losses in Argentina wouldforce dedicated investors to liquidate profitableoverweight positions elsewhere (Russia andBrazil). This “common ownership” motivationfor contagion was further exacerbated by con-cerns that a default on a quarter of the bench-mark index could frighten end-investors,thereby triggering a withdrawal of capital fromthe asset class. In the euro and yen markets,Argentine bonds were largely held by less so-phisticated “buy-and-hold” retail investors whowere not benchmarked to any index. The extentof contagion from the default hence differedacross the three segments:• In the case of dollar-denominated emerging market
bonds, investor discrimination was supportedby the falling weight of Argentina in the mar-ket cap weighted EMBI+. This allowed dedi-cated investors to automatically reduce theirexposure to Argentina further. The debt swapin early December created further support forthe decoupling of Argentina from the rest ofthe asset class. There had already at that timebeen signs of speculative investors and thestreet “front-running” the eventual change indedicated investors’ portfolio allocations. Inthe end, Argentina’s weight in the EMBI+ fellto 2.6 percent. The retrenchment by dedi-cated investors away from Argentina benefitedthose index constituents that stood to gainmost from the reweighting (notably Brazil,
Mexico, and Russia, see the figure) and hencenegated any contagion effects at that stage.
• The “common ownership” explanation forcontagion played a larger role for contagionacross Latin credits within the investor basefor euro-denominated emerging market bonds.When capitulation selling of Argentine bondsby mainly Italian, German, and Spanish retailinvestors occurred, these investors also largelyexited other Latin American sovereign bonds.Following the Argentine default, the euro-de-nominated market is currently in a state ofdisarray, as the large-scale exit of retail in-vestors has pushed the spreads of several euro-denominated emerging market bonds beyondthose of comparable dollar-denominatedbonds. As a result, the overall appetite forLatin American emerging market bonds hassubstantially declined, both in terms of supply(it is no longer price competitive relative todollar issuance) and demand. It remains anopen question whether the classic Europeanretail demand will again invest, in any size, inhigher risk emerging markets.
• In Japan, retail demand for any form ofhigher risk bond issue has suffered from boththe Enron and Argentine defaults. TheSamurai market remains firmly shut despite
Box 2.2. Argentina and the Asset Class
Historical EMBI Weights(In percent)
Source: JP Morgan Chase.
0
5
10
15
20
25
30
Mexico
Russia
Brazil
Argentina
0201200099989796951994

and to overweight those that were seen asrelatively immune. This increase in investor dis-crimination has been a positive developmentand shows maturation in at least the dollar-denominated segment of the asset class. We havein the past attributed the increase in investor dis-crimination to the rising relative importance ofdedicated and local investors, and to the declinein importance of leverage in the system. Ofcourse, in the past the major episodes of conta-gion in emerging markets have been a result ofsurprises, while Argentina’s default at the end ofDecember clearly was not.
Turning to the fourth quarter of 2001, we at-tribute the surprising lack of secondary marketspillovers from Argentina additionally to thesupportive global environment for fixed incomeproducts, the EMBI+ reweighting due to theArgentine bond swap, and market beliefsthroughout October and November that theexchange rate regime would either remain as
is or involve a stabilization, thereby supportingArgentine bond prices in the secondary market.
Our measure of contagion,3 the average cross-correlation of individual country returns in theEMBI+, continued to fall throughout Decemberand January, despite the increased turbulence inArgentina, and is currently around 0.3, beloweven the long-term average of 0.4. With respectto individual cross-country correlations,Argentine sovereign bonds continue to decouplefrom most other emerging market sovereigns(see Figure 2.15). However, the pair wise correla-tion with Venezuela has clearly been high, asVenezuela faces increasing investor concernsagainst a backdrop of political turmoil and oilprice weakness. Looking ahead, the risk of con-tagion has certainly not disappeared completelyand there remains a concern about contagion ei-ther though the foreign exchange markets, asseen during a few days in January, or through
EMERGING MARKET FINANCING
17
appearances to the contrary in the quarter. Inthe wake of Argentina–related credit concernsand then the actual default, the market is ex-pected to remain closed for some time toother low-rated credits. The Philippine shibo-sai (privately placed Samurai) went toEuropean investors who were comfortablewith the 97.5 percent credit enhancement bythe Japanese Export Import Agency NEXI(2.5 percent risk on the underlyingPhilippines risk was enough to deter Japaneseinvestors), while mid-December’s ThaiSamurai was taken up mainly by Japanesebanks operating in Thailand to fulfill local re-serve requirements. As a result, there has
been so far no issuance of any emerging mar-ket bond since mid-December.In conclusion, Argentina’s impact on the
emerging market bond class has been more sub-stantial in the euro and yen markets, where re-tail investors held on in the somewhat optimisticbelief that emerging market sovereigns wouldnot default. While these two markets will have togo through a transformation, it is indeed possi-ble that these necessary changes will in the endlead to a more developed and sophisticated in-stitutional investor base for emerging marketbonds with similar characteristics to that of thedollar segment, which has weathered theArgentine default quite well.
3The measure uses the average cross-correlation of spreads for a rolling 50-day window on the external debt of nineemerging markets (Argentina, Brazil, Ecuador, Mexico, Panama, Peru, Poland, Russia, and Venezuela). A criticism of simi-lar measures can be found by Forbes and Rigobon (2000), who point out that in measuring contagion, increases in volatil-ity during crisis periods can bias correlations upwards. However, Baig and Goldfajn (2000), argue that it is unclear theForbes and Rigobon correction should be made, as the same factors that result in increased volatility (thin markets, panic,margin calls) are precisely the factors responsible for contagion and controlling for one, causes a loss of power for theother.

primary markets (renewed closures) or a fall offin foreign direct investment (FDI) flows toemerging markets.
Turning to primary markets, following therecovery in global financial markets and declinein risk aversion, capital markets reopened inNovember to emerging market issuers followingthe longest bond market drought (11 weeks)since the Russian crisis (13 weeks). As expected,those issuers highest up the credit spectrumwere able to re-access markets first, using plain-vanilla structures in the case of sovereigns, andpolitical risk insurance in the case of non-investment-grade corporates. After near-recordbond issuance in November, issuance levels re-mained robust in December, allowing a substan-tial amount of pre-financing for emergingmarket borrowers. In the last quarter, bond is-suance reached $21.1 billion, which is abouthalfway between the healthy issuance level ofthe second quarter and the dismal third quarterof 2001 (Figure 2.16). As anticipated, invest-ment-grade issuers dominated the quarter andaccounted for 62 percent of total bond issuance(SingTel issued $2.3 billion), while, at leastinitially, non-investment-grade issuance wasdominated by credits that could be seen as di-versification plays (such as the DominicanRepublic, Guatemala, or Bulgaria) or were seenas enjoying the support of the internationalcommunity—for example, Turkey. The fourthquarter also marked the recovery of euro-de-nominated issuance, following both Turkey’sand the City of Moscow’s return to the market.Dollar-denominated issuance also took a largershare, while bond issuance denominated inJapanese yen fell back closer to its average his-torical quarterly level (see Table 2.5). For 2001as a whole, the recovery in issuance during thelast quarter brought total issuance to nearly $90billion (excluding exchanges) exceeding thelevels of 1998–2000, but was nonetheless stillbelow the $100 billion plus issuance of 1996and 1997.
Since the beginning of the year, emergingmarket bond issuance has remained at relativelyhealthy levels and $1 billion plus bond issues
CHAPTER II RECENT DEVELOPMENTS IN INTERNATIONAL CAPITAL MARKETS
18
Figure 2.15. Emerging Market Spread Correlations with Argentina1
Source: IMF staff estimates. 180-day rolling correlations.
September 11
Brazil
Non-Latin
–1.0
–0.8
–0.6
–0.4
–0.2
0
0.2
0.4
0.6
0.8
1.0
Jan.02
Nov.Sept.JulyMayMar.
Venezuela
Mexico
2001
Figure 2.16. Monthly Bond Issuance(In billions of U.S. dollars)
Source: Capital Data.
0
5
10
15
20
25Other Western HemisphereAsia
20012000199919981997
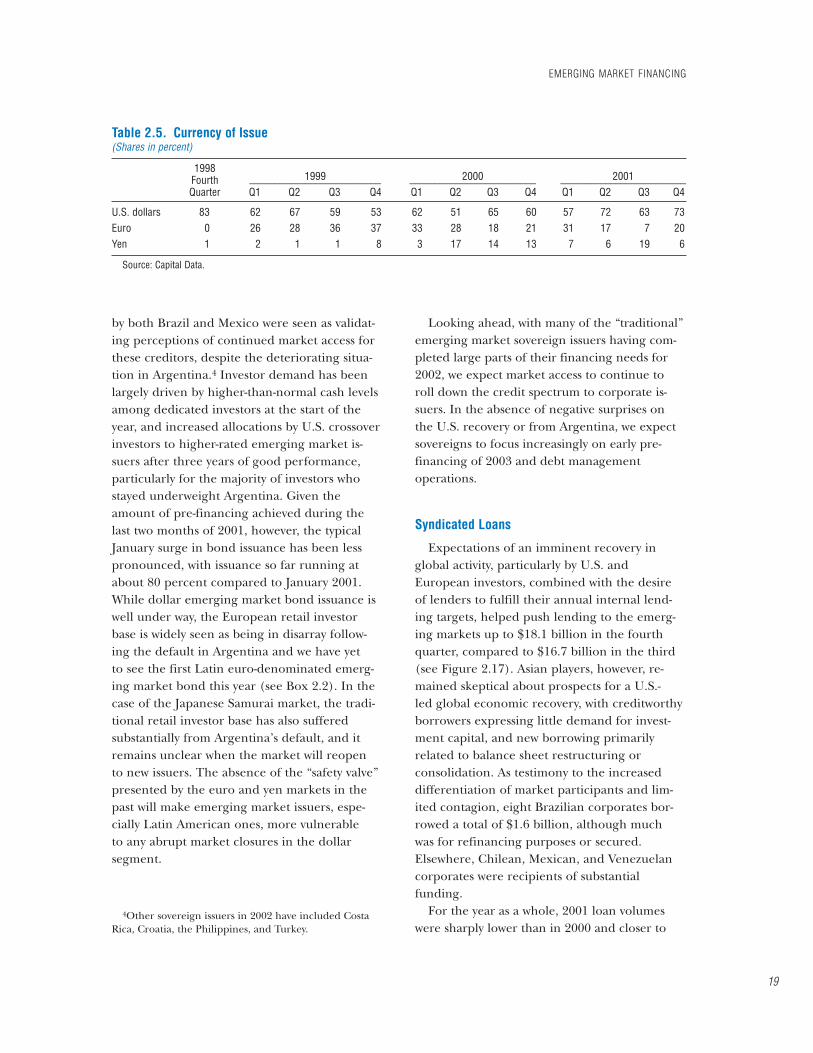
by both Brazil and Mexico were seen as validat-ing perceptions of continued market access forthese creditors, despite the deteriorating situa-tion in Argentina.4 Investor demand has beenlargely driven by higher-than-normal cash levelsamong dedicated investors at the start of theyear, and increased allocations by U.S. crossoverinvestors to higher-rated emerging market is-suers after three years of good performance,particularly for the majority of investors whostayed underweight Argentina. Given theamount of pre-financing achieved during thelast two months of 2001, however, the typicalJanuary surge in bond issuance has been lesspronounced, with issuance so far running atabout 80 percent compared to January 2001.While dollar emerging market bond issuance iswell under way, the European retail investorbase is widely seen as being in disarray follow-ing the default in Argentina and we have yetto see the first Latin euro-denominated emerg-ing market bond this year (see Box 2.2). In thecase of the Japanese Samurai market, the tradi-tional retail investor base has also sufferedsubstantially from Argentina’s default, and itremains unclear when the market will reopento new issuers. The absence of the “safety valve”presented by the euro and yen markets in thepast will make emerging market issuers, espe-cially Latin American ones, more vulnerableto any abrupt market closures in the dollarsegment.
Looking ahead, with many of the “traditional”emerging market sovereign issuers having com-pleted large parts of their financing needs for2002, we expect market access to continue toroll down the credit spectrum to corporate is-suers. In the absence of negative surprises onthe U.S. recovery or from Argentina, we expectsovereigns to focus increasingly on early pre-financing of 2003 and debt managementoperations.
Syndicated Loans
Expectations of an imminent recovery inglobal activity, particularly by U.S. andEuropean investors, combined with the desireof lenders to fulfill their annual internal lend-ing targets, helped push lending to the emerg-ing markets up to $18.1 billion in the fourthquarter, compared to $16.7 billion in the third(see Figure 2.17). Asian players, however, re-mained skeptical about prospects for a U.S.-led global economic recovery, with creditworthyborrowers expressing little demand for invest-ment capital, and new borrowing primarilyrelated to balance sheet restructuring orconsolidation. As testimony to the increaseddifferentiation of market participants and lim-ited contagion, eight Brazilian corporates bor-rowed a total of $1.6 billion, although muchwas for refinancing purposes or secured.Elsewhere, Chilean, Mexican, and Venezuelancorporates were recipients of substantialfunding.
For the year as a whole, 2001 loan volumeswere sharply lower than in 2000 and closer to
EMERGING MARKET FINANCING
19
Table 2.5. Currency of Issue(Shares in percent)
1998Fourth 1999 2000 2001__________________________ _________________________ _________________________Quarter Q1 Q2 Q3 Q4 Q1 Q2 Q3 Q4 Q1 Q2 Q3 Q4
U.S. dollars 83 62 67 59 53 62 51 65 60 57 72 63 73Euro 0 26 28 36 37 33 28 18 21 31 17 7 20Yen 1 2 1 1 8 3 17 14 13 7 6 19 6
Source: Capital Data.
4Other sovereign issuers in 2002 have included CostaRica, Croatia, the Philippines, and Turkey.

trends in 1998–99. With demand for new moneylimited amid concern about the global slowdownand a dearth of mergers and acquisitions activity,the volume of lending reached $64.2 billion in2001 compared with $94.2 billion in 2000 (seeFigure 2.18).
On the pricing front, the syndicated lendingmarket in Asia remains characterized by ahigh degree of competition between banks tolend to the handful of top tier corporatesand financial institutions, while shutting outlower tier borrowers. With little demand fornew money, banks competed to lend to bor-rowers, making pricing very tight at the topend, while rationing out those entities thatmay be most in need of capital. As a result,syndicated loan spreads remained broadly flatin Asia at low levels, while spreads declined inLatin America, reflecting this quarter’s distri-bution of lending among Latin corporates (seeFigure 2.19).
Emerging Equity Markets
Emerging equity markets recovered on cuewith their mature market counterparts as a“high beta” play on global growth and reflectingtheir higher (than global markets) concentra-tion in TMT stocks (see Table 2.6). Emerging
CHAPTER II RECENT DEVELOPMENTS IN INTERNATIONAL CAPITAL MARKETS
20
Figure 2.17. Loan Issuance(In billions of U.S. dollars)
Source: Capital Data.
0
3
6
9
12
15OtherWestern HemisphereAsia
2000 2001
Figure 2.18. Cumulative Gross Annual Issuance of Hard Currency Loans(In billions of U.S. dollars)
Source: Capital Data.
0
30
60
90
120
150
2001 2000
1999
1998
1997
1996
Dec.Nov.Oct.Sept.Aug.JulyJuneMayApr.Mar.Feb.Jan.
Table 2.6. Total Dollar Return Performance ofEmerging Equity Markets(In percent)
Year-to-Date*
Q1 Q2 Q3 Q4 2001 2002
RegionsEM Free –6.2 3.1 –22.1 26.3 –4.9 2.3Asia –0.1 –1.6 –20.1 32.8 4.2 4.6LatAm –3.5 7.1 –24.0 21.8 –4.3 –2.8EMEA –22.0 4.5 –25.8 36.3 –17.7 –2.0
Mature market comparators
ACWI Free –12.8 2.3 –15.0 9.1 –17.3 –4.5S&P 500 –12.1 5.5 –15.0 10.3 –13.0 –2.8Dow –8.4 6.3 –15.8 13.3 –7.1 –6.7Nasdaq –25.5 17.4 –30.7 30.1 –21.1 –5.1
Sources: Bloomberg L.P.; and Morgan Stanley CapitalInternational.
*February 8.

equity markets comfortably outperformed theirmature market counterparts, with returns re-sembling those of the Nasdaq. Cyclical sectorsincluding technology led the rally. The initialrally, particularly in tech heavy markets such asKorea and Taiwan Province of China, was led byforeign investors increasing exposures to Asianequities in order not to underperform in theevent of a global rally. Local investors werenotably absent from the rally. Asian emergingmarkets received the bulk of substantial foreigninvestor flows into emerging equity marketsduring October and November (see Figure2.20). While having similar earnings growthforecasts as in mature markets, Asian equitiesare still seen as cheap, encouraging investors tomaintain neutral to overweight positions inAsia.
Primary market issuance in the fourthquarter (of $2.6 billion compared with $1 bil-lion in the third) was again dominated by Asiannames, but 2001 as a whole was only slightlyhigher than 1998 but lower than the succeedingtwo years. Issues were mainly privatization dealsfrom China, along with banking sector issuancefrom Singapore and the tobacco sector inKorea.
Foreign Direct Investment
In 2001, despite an estimated 42 percentdrop in global FDI to $760 billion, and anestimated 45 percent drop in cross-bordermergers and acquisitions activity, net FDI flowsto emerging market countries are estimated tohave held steady at $163 billion (see IMF,2001c) (see Figure 2.21). Reflecting an ongoingtrend, FDI flows to emerging market countriesremained highly concentrated, with 10 coun-tries accounting for nearly 70 percent of netFDI flows to emerging markets, and China,Brazil, and Mexico alone accounting for aboutone-half of net FDI flows. Looking ahead, netFDI flows to emerging markets are expected tofall further as mergers and acquisition activity isexpected to remain slow to recover, while thehigh cost of equity capital in emerging equity
EMERGING MARKET FINANCING
21
Figure 2.19. Loan-Weighted Interest Margin(In basis points, 1995–2001)
Source: Capital Data.
0
100
200
300
400
500
600
Western Hemisphere
Asia
2001200019991998199719961995
Figure 2.20. Net Foreign Purchases and Monthly Returns on Emerging Equity Markets1
Sources: IMF staff estimates; Central banks; and Bloomberg L.P. 1August data exclude $8.9 bn for Mexico the purchase of Banamex by Citigroup.
Russian CrisisAsian Crisis
US slowdownand tech rout
–4000
–3000
–2000
–1000
0
1000
2000
3000
4000
5000
6000Net purchases (left scale)
–20
–15
–10
–5
0
5
10
15
20
25
30MSCI Emerging Markets Free(monthly returns, right scale)
(In millions of U.S. dollars) (In percent)
1997 1998 1999 2000 2001

markets will hinder privatization-related FDIinflows.
ReferencesBaig, Taimur, and Ilan Goldfajn, 2000, “The Russian
Default and the Contagion to Brazil,” IMF WorkingPaper No. 00/160 (Washington: InternationalMonetary Fund).
Forbes, Kristin, and Roberto Rigobon, 2000, “Measur-ing Contagion: Conceptual and Empirical issues,”(unpublished).
International Monetary Fund, International CapitalMarkets: Developments, Prospects, and Key Policy Issues,World Economic and Financial Surveys(Washington), various issues.
———, 2001a, Emerging Market Financing, February 13,available on the Internet at http://www.imf.org/external/pubs/ft/emf/index.htm.
———, 2001b, Emerging Market Financing, August 8,available on the Internet at http://www.imf.org/external/pubs/ft/emf/index.htm.
———, 2001c, World Economic Outlook: December 2001,World Economic and Financial Surveys(Washington).
CHAPTER II RECENT DEVELOPMENTS IN INTERNATIONAL CAPITAL MARKETS
22
Figure 2.21. Capital Flows to Emerging Economies(In billions of U.S. dollars)
Source: IMF, World Ecomonic Outlook.
Total portfolio and banking flows, net
Direct investment, net
–150
–100
–50
0
50
100
150
200
20009896949290888684821980
Total private sector, net
Total official sector, net

As mentioned in Chapter I, during 2001the international financial system hasshown remarkable resilience in theface of sizable disruptions. Moreover,
recent economic data seem to support marketexpectations that the global economy will re-cover soon. Nevertheless, for the purpose ofidentifying vulnerabilities in international finan-cial markets, this chapter considers the risks tointernational financial stability that could be as-sociated with the potential financial fallout ofseveral financial imbalances, which could be ex-acerbated by a subdued recovery. In light of ac-cumulated financial imbalances that have not yetbeen worked off, the main uncertainties wouldseem to be associated with the resilience ofhousehold, corporate, and bank (and nonbankfinancial institution) balance sheets in the pres-ence of the renewed declines in equity pricesand deterioration in credit quality that might oc-cur during a weaker-than-expected global recov-ery. If balance sheets are impaired and financialimbalances are aggravated as a result of such as-set price adjustments during the recession, thiscould itself lead to a subdued recovery andcould possibly delay it, which in turn could feedback to a further deterioration in financial con-ditions (and so on). This would lead to a lessfriendly operating environment for financial in-stitutions, especially for those already weakenedby the events of 2001, and to possible stresswithin the international financial system.
Another closely related source of risk derivesfrom the ongoing structural transformation inglobal finance. Many such sources can—and infuture issues of this report will—be identified.For the period immediately ahead, with creditdeterioration still unfolding, the increasing re-
liance on credit risk transfer mechanisms coulddevelop to be a source of financial market risk.The recent global rise in corporate debt defaultsto historically high levels, and the relatively lowdegree of financial disclosure and market trans-parency about these instruments and markets—and about who owns the credit risk—wouldseem to pose some risk that market participantsmight have difficulty in accurately gauging thenature and extent of the credit deterioration.Even though these instruments and marketshave coped fairly well with the events of 2001, itis still an open question how effectively they areworking in the presence of a global slowdownand record high default rates.
Financial Market Implications of FinancialImbalances and a Subdued Recovery
As analyzed in previous International CapitalMarkets reports, the structure of financial mar-kets in the major international financial centersand the international financial system havechanged significantly. So too have the linkagesbetween economic activities and financial condi-tions. In this respect, one of the most significantstructural changes in the past two decades hasbeen the increased reliance by corporations andhouseholds on financial market instruments.1
There has also been a corresponding increase inthe dependence of households’ and corpora-tions’ financial conditions—and accordingly,household and corporate spending—on move-ments in financial asset prices. In addition to thedirect impact, this represents another transmis-sion channel from movements in asset prices tothe quality of banks’ balance sheets. Accordingly,just as asset price adjustments have shaped the
23
CHAPTER IIISTABILITY IMPLICATIONS OF GLOBAL FINANCIALMARKET CONDITIONS
1Chapter I in International Monetary Fund (2001a) examines household, corporate, and financial balance sheets;Dynan and Maki (2001) and Ludwig and Sløk (2002) discuss wealth effects. The latter paper finds that consumption inOECD countries can be about twice as sensitive to changes in stock market wealth than it is to changes in housing wealth.

strength and contours of the U.S. and worldwideexpansion in the 1990s, they are also likely todetermine the extent of the present global eco-nomic slowdown and later the pace of therecovery.2
How Prevalent Were Financial Imbalances Beforethe Present Global Slowdown Compared with theRecession in 1990–91?
In trying to assess the impact of the currentrecession on financial conditions, and theprospects for financial markets remaining re-silient, it would be useful to have an historicalperspective drawing on relevant experience andprecedents. Unfortunately, given the changes infinancial systems in the last two decades, thereare few historical experiences of recessions thatare useful for calibrating the internationalfinancial market implications of a subduedglobal recovery. This is particularly so given thegreater effect that asset price adjustments arehaving on household and corporate balancesheets and financing compared with previousrecessions. Such effects may be especially impor-tant to consider in view of the current conjunc-ture, which is characterized by accumulatedcorporate and household sector financial imbal-ances, a synchronized slowdown in the world’sthree largest currency zones, and significantglobal economic, financial, and politicaluncertainties.
In terms of financial market structure, andthe dependence of balance sheets on financialasset prices, perhaps the only comparable reces-sion is the U.S. recession of 1990–91. In the pe-riod leading up to the 1990–91 recession, bothdomestic and external financial imbalances hadaccumulated across a wide range of sectors,markets, and financial institutions—for exam-
CHAPTER III STABILITY IMPLICATIONS OF GLOBAL FINANCIAL MARKET CONDITIONS
24
30
40
50
60
70
80
0120009998979695949392919089881987
0
1
2
3
4
5
6
7
8
9
Commercial and industrial loans
Consumer loans
Real estate loans
0120009998979695949392919089881987
0
2
4
6
8
10
12
0120009998979695949392919089881987
Figure 3.1. United States: Financial Conditions, 1987–20011
Debt to GDP Ratios(In percent)
Delinquency Rates for All U.S. Commercial Banks2
(In percent; seasonally adjusted)
High-Yield Corporate Credit Market
Merrill Lynch high-yield spread3
(in percent; right scale)
Issuance(in billions of U.S. dollars; left scale)
0
5
10
15
20
25
Sources: United States, Board of Governors of the Federal Reserve System; BloombergFinancial Markets L.P.; and Merrill Lynch. 1Shaded areas indicate recessions. 2The delinquency rate for any loan category is the ratio of the dollar amount of a bank's delinquent loans in that category to the dollar amount of total loans outstanding in that category. These rates are calculated from the available data in the Report of Condition and Income (Call Report), filed each quarter by all commercial banks. 3Spread against yields on a 10-year U.S. government bond.
Households
Nonfinancial corporations
2During the recent period, developments in the U.S.economy and financial markets seem to have played a keyrole in driving global economic and financial develop-ments. See, for example, Arora and Vamvakidis (2001) foran empirical analysis of the apparently important “loco-motive” role of the U.S. economy in global growth.
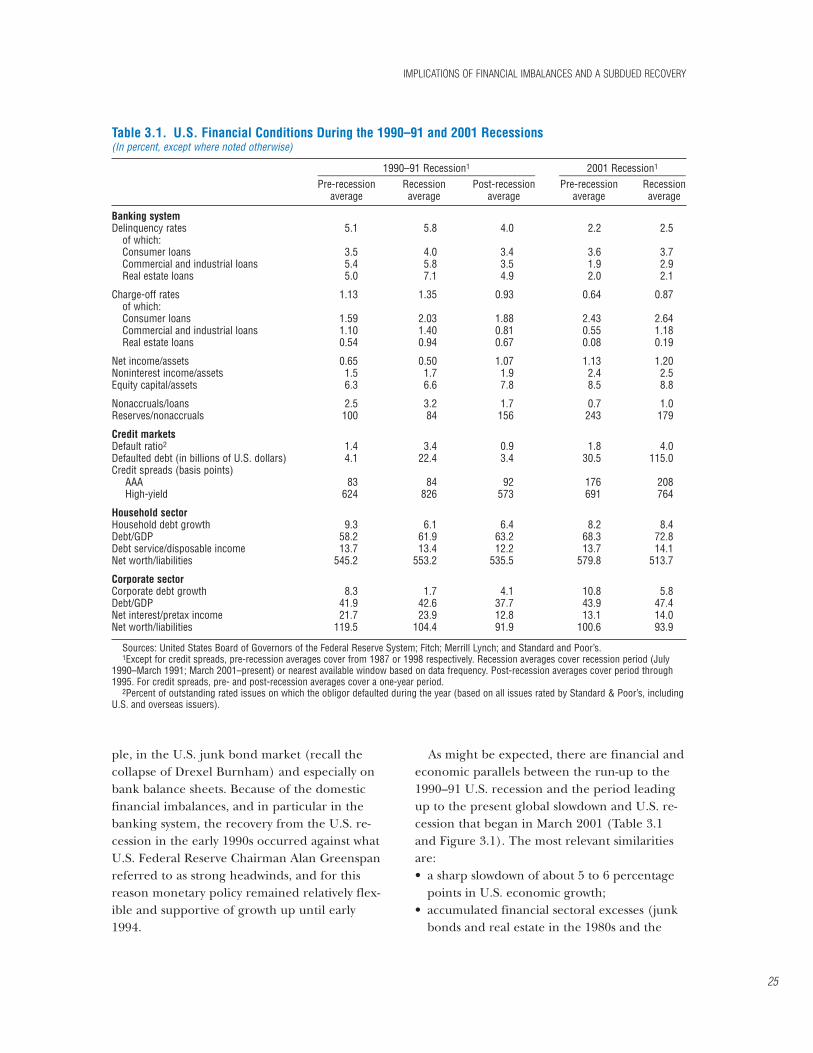
ple, in the U.S. junk bond market (recall thecollapse of Drexel Burnham) and especially onbank balance sheets. Because of the domesticfinancial imbalances, and in particular in thebanking system, the recovery from the U.S. re-cession in the early 1990s occurred against whatU.S. Federal Reserve Chairman Alan Greenspanreferred to as strong headwinds, and for thisreason monetary policy remained relatively flex-ible and supportive of growth up until early1994.
As might be expected, there are financial andeconomic parallels between the run-up to the1990–91 U.S. recession and the period leadingup to the present global slowdown and U.S. re-cession that began in March 2001 (Table 3.1and Figure 3.1). The most relevant similaritiesare:• a sharp slowdown of about 5 to 6 percentage
points in U.S. economic growth;• accumulated financial sectoral excesses (junk
bonds and real estate in the 1980s and the
IMPLICATIONS OF FINANCIAL IMBALANCES AND A SUBDUED RECOVERY
25
Table 3.1. U.S. Financial Conditions During the 1990–91 and 2001 Recessions(In percent, except where noted otherwise)
1990–91 Recession1 2001 Recession1___________________________________________ _________________________Pre-recession Recession Post-recession Pre-recession Recession
average average average average average
Banking systemDelinquency rates 5.1 5.8 4.0 2.2 2.5
of which:Consumer loans 3.5 4.0 3.4 3.6 3.7Commercial and industrial loans 5.4 5.8 3.5 1.9 2.9Real estate loans 5.0 7.1 4.9 2.0 2.1
Charge-off rates 1.13 1.35 0.93 0.64 0.87of which:Consumer loans 1.59 2.03 1.88 2.43 2.64Commercial and industrial loans 1.10 1.40 0.81 0.55 1.18Real estate loans 0.54 0.94 0.67 0.08 0.19
Net income/assets 0.65 0.50 1.07 1.13 1.20Noninterest income/assets 1.5 1.7 1.9 2.4 2.5Equity capital/assets 6.3 6.6 7.8 8.5 8.8
Nonaccruals/loans 2.5 3.2 1.7 0.7 1.0Reserves/nonaccruals 100 84 156 243 179
Credit marketsDefault ratio2 1.4 3.4 0.9 1.8 4.0Defaulted debt (in billions of U.S. dollars) 4.1 22.4 3.4 30.5 115.0Credit spreads (basis points)
AAA 83 84 92 176 208High-yield 624 826 573 691 764
Household sectorHousehold debt growth 9.3 6.1 6.4 8.2 8.4Debt/GDP 58.2 61.9 63.2 68.3 72.8Debt service/disposable income 13.7 13.4 12.2 13.7 14.1Net worth/liabilities 545.2 553.2 535.5 579.8 513.7
Corporate sectorCorporate debt growth 8.3 1.7 4.1 10.8 5.8Debt/GDP 41.9 42.6 37.7 43.9 47.4Net interest/pretax income 21.7 23.9 12.8 13.1 14.0Net worth/liabilities 119.5 104.4 91.9 100.6 93.9
Sources: United States Board of Governors of the Federal Reserve System; Fitch; Merrill Lynch; and Standard and Poor’s.1Except for credit spreads, pre-recession averages cover from 1987 or 1998 respectively. Recession averages cover recession period (July
1990–March 1991; March 2001–present) or nearest available window based on data frequency. Post-recession averages cover period through1995. For credit spreads, pre- and post-recession averages cover a one-year period.
2Percent of outstanding rated issues on which the obligor defaulted during the year (based on all issues rated by Standard & Poor’s, includingU.S. and overseas issuers).

TMT sector in the 1990s) that adversely af-fected financial institution earnings and capi-tal and caused market volatility in manycountries;
• run-ups in U.S. corporate and household debtto cyclical highs relative to net equity, assets,and even GDP (for corporations, to a levelthat is 5 percentage points higher than in1991, and for households, to 10 percentagepoints of GDP higher);
• sharp increases by U.S. banks in the cost ofloans and tightening of loan standards; and
• record corporate bond defaults globally, in-cluding on investment-grade debt.There are also important economic and finan-
cial differences in the current situation from1990–91. First, the current slowdown is moreglobally synchronized than the previous one.Both Japan and the United States experiencedrecessions, European economies experiencedweak growth, and economies in other regionshave also experienced a recession or a slowdownin growth. Counterbalancing this to some extentare the much lower inflation and fiscal deficitsin many countries, which provide degrees of pol-icy flexibility, and the ample liquidity enjoyed byinvestors, which can be quickly moved to assetmarkets if sentiment improves.
The recession in Japan—the world’s secondlargest economy—has restrained global growthand aggravated Japanese financial market imbal-ances and fragilities at a time when support forworld demand would be beneficial. Severalfinancial imbalances are worth noting. Govern-ment debt has grown to 140 percent of GDPand is projected to grow to over 150 percent ofGDP in 2002, and this could pose financial risksin the Japanese government bond (JGB) marketin the future (International Monetary Fund,2001b, p. 44). Concerns about rising govern-ment debt have been reflected in downgrades ofJapan’s sovereign ratings to Aa3 (Moody’s) andAA (S&P). Household debt has remained above130 percent of disposable personal income. Inthe corporate sector, debt burdens remain highwhile at the same time asset price deflation andrising corporate bankruptcies are continuing to
CHAPTER III STABILITY IMPLICATIONS OF GLOBAL FINANCIAL MARKET CONDITIONS
26
Figure 3.2. Probability Density Functions for G-3 Exchange RatesImplied by Option Prices1
(December 31, 2001)
Euro–U.S. dollar
Japanese yen–U.S. dollar
Source: IMF staff estimates. 1Based on an assumed log normal distribution for exchange rates in which the mean equals the forward rate.
1.181.141.11.061.020.980.940.90.860.820.780.740.7
1471411351291231171111059993
1 month
3 month
12 month
1 month
3 month
12 month
U.S. dollar per euro(movement to the right implies euro appreciation)
Japanese yen per U.S. dollar(movement to the right implies yen depreciation)

weaken financial institutions’ balance sheets.3
Part of the reason is that corporations and fi-nancial institutions have not fully taken advan-tage of the various reforms implemented inJapan, as, for example, in bankruptcy laws, toaddress some of these imbalances and their rootcauses. As a result, they may not be able to con-tribute much to Japan’s recovery when it materi-alizes. Price movements in asset markets inJapan have also continued to strain householdand corporate balance sheets. Finally, as sug-gested by market expectations extracted fromforeign exchange options prices, the risks of ayen depreciation and appreciation seem to beequally likely (symmetric), with a high probabil-ity of a significant move (“fat-tailed”) (Figure3.2). It is possible that a depreciation might ac-company further aggressive monetary easing.An appreciation could be triggered by simulta-neous decisions by many Japanese investors toliquidate their substantial overseas portfolios(notwithstanding the relatively attractive returnsavailable in overseas markets) and repatriatecapital in order to finance corporate and finan-cial sector restructuring.
In Europe, economic growth has slowed bymore than anticipated, reflecting stronger-than-expected economic and financial linkages withthe United States. For example, measures ofEuropean and U.S. financial conditions, such asequity prices and the profitability of financialinstitutions (including those that are active inboth regions), have tended to move together.Looking ahead, rising debt burdens may act as aconstraint on the recovery of growth in Europe:since 1997, household debt has risen from lessthan 44 percent to about 48 percent of GDP,while corporate debt has grown from about47 percent to about 56 percent of GDP (Figure3.3). Household debt in the United Kingdomand Germany has reached 117 and 115 percent,respectively, of disposable personal income,
IMPLICATIONS OF FINANCIAL IMBALANCES AND A SUBDUED RECOVERY
27
Figure 3.3. Household and Corporate Sector Balance Sheets in the Euro Area and Japan(In percent)
Sources: ECB; and Nomura database. 1Includes general government.
40
42
44
46
48
50
52
54
56
58
200120001999199836
38
40
42
44
46
48
2001200019991998
60
65
70
75
80
200098969492199010
15
20
25
30
2000989694921990200
225
250
275
300
325
350
Euro Area: Debt to GDP Ratio Euro Area: Shares of Traded Instruments in Nonfinancial Sector Assets1
Japan: Debt to GDP Ratio Japan: Shares of Traded Instruments in Nonfinancial Sector Assets
Households(left scale)
Corporations(right scale)
Corporations
Households
Corporations
Households
3The number of bankruptcies has risen sharply sincethe introduction of the Corporate Rehabilitation Act inApril 2000.

compared with 106 percent in the UnitedStates.4
A second difference from 1990–91 is that inthe period leading up to the present globalslowdown, both U.S. and European banks werein relatively strong financial condition com-pared with prior years. This partly reflects theeffects of the record-length economic expansionduring 1991–2000, strengthened supervisionand regulation, and improved private riskmanagement. Accordingly, in the first half of2001, U.S. bank income/assets and equity/as-sets ratios stood at 1.2 percent and 8.8 percentrespectively, well above 1990–91 levels (Fitch,2001). Similarly, charge-off and delinquencyrates are half or less of those attained at thesame point in the 1990–91 cycle. In 2000, thelargest banks’ returns on equity and on assetswere at relatively strong levels by internationalstandards (16 percent and 1 percent, respec-tively), broadly similar to their levels in 1993.Between 1993 and 2000, major European banks’
credit quality, profitability, and capitalizationrelative to assets all improved (Table 3.2).During that period, nonperforming loans(NPLs) declined from 3.6 percent to 2.3 per-cent of loans; charge-offs fell from 0.7 percentto 0.2 percent of loans; return on equity in-creased from under 10 percent to 16 percent;and equity as a percent of assets rose slightly to4.4 percent.5 However, the average figures forthe largest European banks mask the poor per-formance of banks in the countries where thepace of consolidation and restructuring has no-ticeably lagged behind that of the United Statesand the European average. Those institutionshave already struggled to cope with overcapacityand poor profitability in their home markets.Moreover, their efforts to diversify business over-seas (to emerging markets countries) and intonew business activities (such as lending to thetelecom industry and engaging in credit deriva-tives businesses) have exposed them to newsources of weakness.
CHAPTER III STABILITY IMPLICATIONS OF GLOBAL FINANCIAL MARKET CONDITIONS
28
Table 3.2. Performance of Large European Banks(In percent)
1993 1994 1995 1996 1997 1998 1999 2000
Asset qualityNonperforming loans/gross loans 3.6 2.7 3.0 2.1 2.1 2.3 2.6 2.3Net charge-offs/average gross loans 0.7 0.6 0.4 0.3 0.3 0.2 0.2 0.2Loan loss reserves/nonperforming loans 88.8 118.2 96.0 111.3 100.0 99.0 94.7 89.8Loan loss reserves/gross loans 3.2 3.2 2.9 2.3 2.1 2.3 2.4 2.0Loan loss provisions/net interest revenue 32.3 17.8 15.0 13.1 15.2 19.0 15.4 12.9
CapitalizationEquity/total assets 4.2 4.4 4.4 4.4 3.8 3.9 4.1 4.4Equity/net loans 8.5 9.0 9.2 9.5 8.6 9.0 9.4 10.4Equity/liabilities 4.5 4.7 4.7 4.6 4.0 4.2 4.3 4.7
Revenue and profitabilityNet interest revenue/average assets 2.0 2.1 1.9 1.8 1.6 1.5 1.3 1.2Other operating income/average assets 1.3 1.2 1.2 1.5 1.5 1.4 1.4 1.7Return on average assets 0.4 0.6 0.5 0.5 0.5 0.5 0.5 0.7Return on average equity 9.7 12.7 12.0 11.5 11.4 12.6 13.7 16.0
Source: Bankscope; data for 30 largest European banks by assets.
4Source: OECD. According to calculations by the Bundesbank, including non-incorporated enterprises (which are in-cluded in the German figures) in the U.S. figures increases the U.S. ratio to 142 percent.
5The crisis in Argentina will likely affect the profits of two major Spanish banks that have a local presence in the coun-try. Nevertheless, credit rating agencies and bank analysts consider that losses will be manageable for these banks, becauseArgentina accounts for a relatively small share of their assets, and the banks have already set aside special reserves thatcover the full amount of their Argentine banking equity investments.

Financial institution weaknesses are most pro-nounced in Japan. The cost of loan write-offscontinues to exceed banks’ operating profits,while reported NPL ratios have risen owing tothe weak economy and tighter loan classificationcriteria (Table 3.3). During the first half of FY2001 alone, major banks’ NPLs increased by 13percent from March 2001 to ¥22.5 trillion ($275billion). According to figures published bybanks—which are lower than estimates by somemarket analysts—total banking system NPLs areabout ¥43 trillion ($320 billion), equivalent toabout 8 percent of GDP, or roughly double thelevel present in the U.S. banking system duringthe 1980s S&L crisis. Japanese banks are also sig-nificantly exposed to market volatility throughtheir equity holdings (equivalent to more than150 percent of bank capital), as well as JGBs andswap holdings. At the same time, the zero inter-est rate policy has contributed to a further nar-rowing of spreads on corporate loans—thebanks’ traditional mainstay—and ongoing re-structuring efforts have not yet significantly in-creased profits in other business areas. Mean-
while, insurance companies have been adverselyaffected by low premia, the negative spread be-tween high guaranteed returns on life policiesand low returns available in Japanese financialmarkets, and losses associated with theSeptember 11 attacks (which caused the bank-ruptcy of one property and casualty insurancecompany). Notwithstanding these factors, life in-surance companies reported ¥1.1 trillion in baseprofits during the first half of FY2001, owing to amore favorable demographic outturn than incor-porated in actuarial assumptions.
Concerns about these problems seem to havemounted in the run-up to the planned with-drawal of blanket deposit insurance, which is in-tended by the government to demonstrate itscommitment to reform. Confidence in the bank-ing sector has sharply fallen, as reflected in asteep decline in bank stock prices and increasedspreads on banks’ yen bonds, dollar subordi-nated debt, and credit default swaps. In addi-tion, the Nikkei’s decline to an 18-year low hasfed concerns about banks’ losses on their largecross-shareholdings, particularly now that these
IMPLICATIONS OF FINANCIAL IMBALANCES AND A SUBDUED RECOVERY
29
Table 3.3. Performance of Major Japanese City Banks1
(In percent, except where noted otherwise)
FY 1996 FY 1997 FY 1998 FY 1999 FY 2000
Asset qualityNonperforming loans/loans 3.89 4.82 5.53 5.01 5.34Credit expenses/average loans 1.25 2.78 2.90 1.32 1.36Loan loss reserves/nonperforming loans 53.26 67.69 49.02 42.93 36.64Loan loss reserves/gross loans 2.07 3.28 2.71 2.15 1.96Loan loss provisions/net interest revenue
CapitalEquity/total assets 3.11 2.40 4.42 4.69 4.12Equity/net loans 4.83 3.92 7.02 7.41 7.49Equity/liabilities 3.21 2.46 4.62 4.95 4.30
OperationsNet interest income/average assets 1.07 0.96 1.01 1.08 0.98Other operating income/average assetsReturn on average assets (ROAA) –0.01 –0.72 –0.57 0.15 –0.01Return on equity (ROE) –0.19 –29.93 –13.42 3.15 –0.32
Loan portfolio (trillion yen)International loans 71.3 60.8 40.8 29.2 28.3Domestic loans 219.2 217.8 221.0 224.1 222.4
of which:Wholesale loans 64.4 64.9 72.5 67.6 68.4Housing loans 36.2 38.9 40.7 41.8 41.6
Source: Moody’s Investors Service, Banking Statistical Supplement: Japan.1Data for fiscal year ending in March.

losses directly affect banks’ already weakenedcapital following the introduction of mark-to-market accounting in April 2001. The FinancialServices Agency (FSA) estimates that a 10 per-cent drop in the Topix would reduce majorJapanese banks’ capital ratio by about 0.4 per-centage points. Nevertheless, the Japan pre-mium, while rising in recent weeks, remains atlow levels compared with past episodes of bank-ing crises (Figure 3.4)—reflecting a perceptionthat the government will support the bankingsystem, and thereby replace the private risk oflending to Japanese banks with public-sectorrisk. In addition, the potential for stress inJapan’s financial system to give rise to interna-tional spillovers may have declined. MajorJapanese banks’ international loan portfolioshave contracted every year since FY 1996 (seeTable 3.3), as they reportedly cut back overseasoperations (adversely affecting markets). At thesame time, and as noted above, the repatriationof capital by Japanese investors could affect con-ditions in international capital markets.
Third, U.S. household and corporate interestpayments relative to income are below the peaksattained during (or in the run up to) the previ-ous recession—partly reflecting today’s lowernominal interest rates—although their debt serv-ice is higher relative to income (Figure 3.5). Bythe same token, interest burdens could rise if in-terest rates picked up amid an early recovery.Fourth, the levels of household and corporatenet worth were boosted by asset priceincreases—including in real estate markets—during the last decade, although liabilities havegrown more rapidly than net worth in both sec-tors, leading to a decline in the net worth/liabilities ratio. Fifth, despite mounting concernsabout the dollar’s overvaluation and large U.S.current account deficits, the dollar has contin-ued to strengthen even as the U.S. economy hasweakened and markets have become morevolatile. This may reflect sustained capital in-flows into the United States. In this environ-ment, a change in foreign appetite for U.S. as-sets could affect the magnitude and compositionof capital flows into the United States, leading to
CHAPTER III STABILITY IMPLICATIONS OF GLOBAL FINANCIAL MARKET CONDITIONS
30
Figure 3.4. Japan Premium1
(In basis points)
Source: Bloomberg L.P. 1Average U.S. dollar LIBOR of Fuji Bank and Bank of Tokyo minus the LIBOR fix (three-month rate).
–10
0
10
20
30
40
50
60
70
80
90
02012000999897961995
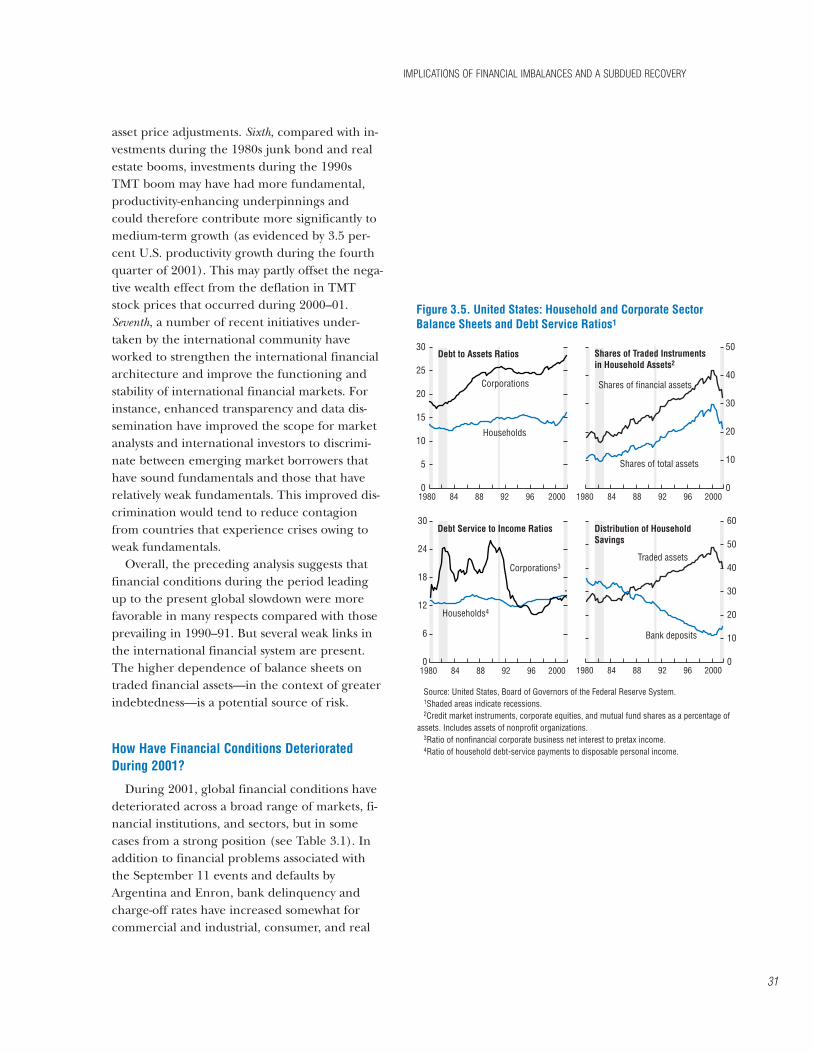
asset price adjustments. Sixth, compared with in-vestments during the 1980s junk bond and realestate booms, investments during the 1990sTMT boom may have had more fundamental,productivity-enhancing underpinnings andcould therefore contribute more significantly tomedium-term growth (as evidenced by 3.5 per-cent U.S. productivity growth during the fourthquarter of 2001). This may partly offset the nega-tive wealth effect from the deflation in TMTstock prices that occurred during 2000–01.Seventh, a number of recent initiatives under-taken by the international community haveworked to strengthen the international financialarchitecture and improve the functioning andstability of international financial markets. Forinstance, enhanced transparency and data dis-semination have improved the scope for marketanalysts and international investors to discrimi-nate between emerging market borrowers thathave sound fundamentals and those that haverelatively weak fundamentals. This improved dis-crimination would tend to reduce contagionfrom countries that experience crises owing toweak fundamentals.
Overall, the preceding analysis suggests thatfinancial conditions during the period leadingup to the present global slowdown were morefavorable in many respects compared with thoseprevailing in 1990–91. But several weak links inthe international financial system are present.The higher dependence of balance sheets ontraded financial assets—in the context of greaterindebtedness—is a potential source of risk.
How Have Financial Conditions DeterioratedDuring 2001?
During 2001, global financial conditions havedeteriorated across a broad range of markets, fi-nancial institutions, and sectors, but in somecases from a strong position (see Table 3.1). Inaddition to financial problems associated withthe September 11 events and defaults byArgentina and Enron, bank delinquency andcharge-off rates have increased somewhat forcommercial and industrial, consumer, and real
IMPLICATIONS OF FINANCIAL IMBALANCES AND A SUBDUED RECOVERY
31
Figure 3.5. United States: Household and Corporate Sector Balance Sheets and Debt Service Ratios1
Debt to Assets Ratios
Source: United States, Board of Governors of the Federal Reserve System. 1Shaded areas indicate recessions. 2Credit market instruments, corporate equities, and mutual fund shares as a percentage of assets. Includes assets of nonprofit organizations. 3Ratio of nonfinancial corporate business net interest to pretax income. 4Ratio of household debt-service payments to disposable personal income.
0
5
10
15
20
25
30
20009692888419800
10
20
30
40
50
2000969288841980
0
6
12
18
24
30
0
10
20
30
40
50
60
Households
Corporations
2000969288841980 2000969288841980
Shares of Traded Instruments in Household Assets2
Shares of financial assets
Shares of total assets
Corporations3
Households4
Bank deposits
Traded assets
Debt Service to Income Ratios Distribution of Household Savings

estate loans. Financial asset prices have alsoweakened on balance, as the performance ofEuropean and U.S. bank stock indexes has beenlackluster, and Japanese bank stocks have fallenby over 40 percent (Figure 3.6). Broad stockmarket indexes fell during 2001, although mar-kets recovered losses following the post-September 11 rebound. In the U.S. equity mar-kets, price-earnings ratios ended the year at highlevels that seem to be pricing in a mid-2002global recovery (as discussed in Chapter II). Inparticular, they imply an increasingly optimisticoutlook for U.S. corporate earnings growth(Figure 3.7), which contrasts with downward re-visions to analysts’ near-term earnings forecasts.
At the same time, and amid an unusuallystrong cyclical erosion in U.S. corporate profitsas a share of GDP, credit market default rateshave increased sharply to an average of almost 4percent (they are normally in the range of 1 to 2percent) exceeding those in 1990–91. Theamount of defaulted debt reached a new annualrecord high of about $115 billion in 2001 and anew monthly high of $31 billion in January2002. In addition, spreads on high-yield debtsurged and peaked above 900 basis points inSeptember 2001—only slightly below the peakreached in 1990–91. AAA spreads are presently168 basis points and somewhat above 1990–91levels. High-yield issuance has slowed sharplywhile investment-grade issuance has continuedapace (see Chapter II).
Meanwhile, corporate and household debthave continued to rise relative to GDP, suggest-ing that these imbalances accumulated duringthe expansion have not yet been fully workedoff. At the same time, aggressive reductions ininterest rates and active mortgage refinancingactivity have worked to limit upward pressure oncorporate and household debt service. However,equity prices exhibited sharp price movementsin 2001 in both directions, and, on balance, thenet worth of U.S. households and nonprofit or-ganizations has been reduced by about $1.2 tril-lion as a result of equity price adjustments. Morespecifically, and based on an end-2000 equity-portfolio wealth of $7.5 trillion, according to
CHAPTER III STABILITY IMPLICATIONS OF GLOBAL FINANCIAL MARKET CONDITIONS
32
Figure 3.6. Performance of Bank Stock Indices(January 1, 1999 = 100)
United States: S&P 500
Japan: Topix
Europe: Bloomberg European 500
Source: Bloomberg L.P.
60
70
80
90
100
110
120
130
40
60
80
100
120
140
160
180
60708090
100110120130140150160
Stock market index
Banking index
Stock market index
Banking index
Stock market index
Banking/financial services index
1999 2000 2001 02
1999 2000 2001 02
1999 2000 2001 02

U.S. flow-of-funds data, U.S. household and non-profit organizations experienced a capital loss of$1.1 trillion in the first quarter of 2001, a capitalgain of $400 billion in the second quarter, a cap-ital loss of $1.1 trillion in the third quarter, anda gain of about $600 billion in the fourth quar-ter.6 Comparable flow-of-funds data do not ap-pear to be available for Europe, but during2001, EMU equity market capitalization fell by14.2 percent, equivalent to €718 billion ($640billion). By contrast, U.S. equity market capital-ization fell by 8.4 percent.7
The aforementioned financial adjustments area manifestation of structural changes that arelikely to be particularly relevant for gauging risksto financial market stability going forward: thesignificantly greater exposure of households andcorporate balance sheets and net worth to finan-cial asset prices and markets. In the past, com-mercial banks acted as the main shock absorberfor many of their corporate clients, as they con-tinued to provide financing through good andbad economic conditions, up to a point. Tradedinstruments now account for about one-third ofU.S. household financial assets, compared withone-quarter about a decade ago (see Figure 3.5).Likewise, traded instruments now account forabout 44 percent of euro-area nonfinancial sec-tor assets, compared with 38 percent in 1997(see Figure 3.3).8 Companies have also increas-ingly relied on the buoyancy of their own shareprices to acquire other companies, to raise fundsthrough new stock issuance, or to guaranteeloans to their own special purpose financingentities.
Financial institutions themselves also dependmore on markets. Commercial and investment
IMPLICATIONS OF FINANCIAL IMBALANCES AND A SUBDUED RECOVERY
33
Figure 3.7. Implied Earnings Growth Rates1
(In percent; weekly data)
Sources: Datastream; and IMF staff calculations. 1Expected earnings growth rates implied by levels of price-earnings ratios and long-term interest rates. Based on 8 percent equity premium.
0
2
4
6
8
10
12
02012000999897969594939291901989
United States
20-year historical average earnings growth rate: 6.8%
0
2
4
6
8
10
12
14
02012000999897969594939291901989
20-year historical average earnings growth rate: 1.6%
Japan
0
2
4
6
8
10
12
02012000999897969594939291901989
12-year historical average earnings growth rate: 8.4%
Europe
6Derived from Board of Governors of the FederalReserve, Flow of Funds, Table R.100 and staff estimates.
7Figures based on Datastream indexes covering aboutonly 85 percent of market capitalization.
8Includes general government, corporate, and house-hold sectors. This development may partly reflect therapid growth of euro area wholesale financial markets fol-lowing the 1999 introduction of the euro. The introduc-tion of notes and coins in 2002, while a key milestonefrom an economic perspective, was of less significancefrom a financial markets perspective.

banks actively use securities and derivatives mar-kets to fund their activities, earn underwritingand trading income, and manage risks. Financialinstitutions are now more exposed to market,liquidity, and counterparty credit risks. This mar-ket re-orientation has been facilitated by therapid growth of the global over-the-counter(OTC) derivatives markets (including credit de-rivatives, discussed in the next section), whichbetween 1995 and 2001 virtually doubled in no-tional size to nearly $100 trillion. As a result ofthe global slowdown and these structural factors,financial institutions have been affected throughtwo channels. First, asset price adjustments haveadversely affected balance sheets and asset qual-ity. Second, the deteriorating general economicclimate has put downward pressure on revenuesand profitability as fee-based incomes have de-clined (for example, from brokerage commis-sions, initial public offerings, and mergers andacquisitions). In addition, domestically orientedfinancial institutions face intensified competi-tion in markets from the large complex financialinstitutions (LCFIs) that dominate the matureand international capital markets and intermedi-ate the bulk of international capital flows. LCFIs’international activities, particularly in the globalinterbank and OTC derivatives markets, havealso strengthened the linkages among the majorfinancial systems and financial centers. This mayhave increased the potential for spillovers acrossfinancial institutions and centers.
Based on the comparison with 1990–91, andeven with the adverse effects of the considerableshocks of the September 11 attacks, Argentina’sdefault, and the failure of Enron, the interna-tional financial system has shown remarkable re-silience thus far, even if weak institutions havebecome more vulnerable. Moreover, in someways the experience during the 1990s provides abasis for optimism that the international finan-cial system will continue to cope. During thatdecade, markets proved resilient during a seriesof tests—the collapse of ERM; several episodesof bond market turbulence and equity price ad-justments; crises in Mexico, Asia, and Russia; andthe failures of Barings and Long-Term Capital
Management (LTCM). In each case, despite con-siderable market volatility and substantial lossesexperienced by individual institutions, the sys-temic economic and financial costs were well-contained. Of course, all of this occurred againstthe background of the longest U.S. economicexpansion on record. It remains to be seen howlong the system can remain resilient during a pe-riod of slower global growth.
In considering the risks going forward, twoobservations are worth re-emphasizing. First, thesystemically important European and U.S. banksstill seem to be well capitalized, and probablycould withstand a further deterioration in finan-cial conditions and asset quality without posing asubstantial risk of instability: however, there ex-ists heightened stress for weak institutions (al-though none of the weaker U.S. or European in-stitutions may be systemically important).Second, at the same time, the increased relianceon market finance intensifies the effects of assetmarket adjustments on corporate and householdbalance sheets, with the potential for feedbackonto economic activity and then onto financialmarket conditions.
What Are the Implications for Financial MarketStability Going Forward?
Against this background, and in light of the fi-nancial imbalances that accumulated in majorcountries during the 1990s, the key question sur-rounding the implications for financial marketstability going forward is how well will financialmarkets cope with pressure on corporate profits and fur-ther credit deterioration, especially if the global recoveryis subdued? The answer to this question dependson how closely the economic outturn conformswith market expectations. Two scenarios can beidentified that illustrate this.
Under a baseline scenario, the U.S. and globaleconomies would begin to recover in early 2002.Since markets broadly reflect an expectationthat this will take place, no widespread adjust-ment in asset prices or flows would be likely tooccur. Some adjustments might be associatedwith unexpected developments in some sectors
CHAPTER III STABILITY IMPLICATIONS OF GLOBAL FINANCIAL MARKET CONDITIONS
34

or regions—such as new evidence of fragility inthe high-tech sector, or signs of difficulties inemerging market countries that have so faravoided financial contagion. This could cause in-vestors to rebalance portfolios toward those sec-tors or countries that would then be perceived asoffering better risk-adjusted returns than before.In addition, according to some estimates, pres-ent U.S. equity valuations seem to imply higherlevels of year-end corporate profits than consen-sus estimates now suggest. This suggests that as-set prices could weaken even if the recoverymatches the baseline forecasts for economic andprofit growth. Nevertheless, as long as the globalrecovery unfolds as expected, any increasedcredit and market risks would probably be mod-est and could likely be readily absorbed by mostinvestors and financial institutions. Thereforethis scenario would be very unlikely to cause ma-jor problems in financial markets. Even in thisbenign scenario, however, the situation in Japancould worsen considerably—for example, ifprogress in implementing corporate and finan-cial sector reforms is seen as faltering, if ongoingasset-price deflation continues to impair bankand corporate balance sheets, or if banking sys-tem strains reach critical proportions.9
Under an alternative scenario, the recoverywould be subdued compared with market expec-tations. In this case, a slower pace of corporateearnings growth could lead to broad-based cor-rections in global equity markets. This may beparticularly likely to occur in the United States,where price/earnings ratios reflect an optimisticoutlook for corporate earnings growth, notwith-standing an unusually large cyclical decline incorporate profits as a share of GDP. In addition,reduced corporate earnings growth, along withrising corporate default rates (particularlyamong more highly leveraged sectors and com-panies) could cause credit spreads to increaseand tighten conditions in domestic and interna-tional loan and bond markets as financial inter-
mediaries and investors sought to limit their ex-posures. Under this scenario, more market-risk-sensitive investors would probably rebalancetheir portfolios toward less cyclically vulnerablesectors, waiting for signs that the recovery hadmaterialized in earnest before taking on signifi-cant exposure to cyclically sensitive risky assets.The credit market adjustment could also entail ahigher interest burden for households and cor-porations that have relied heavily on floating-rate or short-term financing, particularly if riskpremia in credit markets rise sharply. Along withthe negative household wealth effects of assetprice deflation, reductions in investment andconsumption expenditure would work to con-strain economic growth.
This scenario could have significant adverseeffects on Japan and on emerging market bor-rowers. In particular, reduced external demandstemming from a global slowdown would putdownward pressure on Japan’s economic growth.This in turn could give rise to an increase inbankruptcies and add to asset-price deflation,and thereby heighten the stresses on Japan’s al-ready weakened financial system. Slower globalgrowth, along with increased investor risk aver-sion, could also be reflected in tighter terms ofaccess to international capital markets foremerging market borrowers (see Chapter II).This could pose challenges to countries thathave relied heavily on international markets tomeet their financing requirements.
In this kind of adjustment it is not possible toknow how markets would behave. But in previ-ous periods of adjustments in the 1990s, marketintermediaries and participants have temporar-ily and selectively withdrawn from some types ofrisk taking in capital markets to protect theircapital and assets. As in the past, risk manage-ment systems, mark-to-market accounting losseson securities holdings, and the increased risk offurther losses could lead market makers to re-duce their market exposures in particular mar-
IMPLICATIONS OF FINANCIAL IMBALANCES AND A SUBDUED RECOVERY
35
9Another risk in this benign scenario is that shocks could affect the pattern of international capital flows and nationaland international financial conditions. Future reports will devote further analysis to this issue.

ket segments. Financial institution income andasset quality could also be adversely affected byreduced earnings (for some institutions, losses)from capital markets activities, and balance-sheet and off-balance sheet exposures.Meanwhile, counterparty credit risk exposuresto institutions participating in derivatives mar-kets would increase as well. If (as occurred in1998 during the LTCM crisis) there were fearsof further credit events, and in particular involv-ing the soundness of some financial institutions,the prospect that OTC derivatives hedges mightbe unwound could lead to a rebalancing ofportfolios. The experience with such adjust-ments in the 1990s, and the relative resilienceof the international financial system at thattime, is cause for optimism that adjustmentswould be manageable and contained. This isparticularly so because there are likely to becountervailing forces working in the directionof maintaining financial stability, as, for exam-ple, through the markets’ self-correcting mecha-nisms and as a result of possible further mone-tary policy adjustments. However, in thescenarios just described, all of these adjustmentswould occur against the background of a globalslowdown and already somewhat weakened fi-nancial conditions, and it cannot be excludedthat several of the weakened financial institu-tions might come under additional stress.
How Effectively Is the Market for CreditRisk Transfer Vehicles Functioning?
The market for instruments that transfercredit risk from one investor to another—creditrisk transfer vehicles such as credit default swapsand collateralized debt obligations—is now un-dergoing the first major test in the form of aU.S. recession and global economic slowdown.This test comes after a relatively short period ofvery rapid growth. Between 1997 and 2001, thenotional amount of outstandings increased byabout ninefold to an estimated $1.6 trillion. A
variety of market participants—including com-mercial and investment banks, and institutionalinvestors (such as mutual funds, insurance com-panies, pension funds, and hedge funds)—arenow using the market to hedge or take on creditrisk (Figures 3.8 and 3.9).
Measured in terms of notional principal—thereference amount on contracts—the credit risktransfer market is still small compared with theentire OTC derivatives market, which amountsto about $100 trillion. But this comparison sig-nificantly understates the amount at risk incredit risk transfer contracts compared withmost OTC derivatives contracts. For a standard-ized contract such as an interest rate swap, creditexposure is typically equivalent to about 3 to 5percent of the notional principal. By contrast,for a credit derivative, credit exposure could beup to 100 percent of the notional amount. Thisis because some credit derivatives involve the ex-change of a cashflow equivalent to the principalamount of the underlying credit instrument (insome cases, less the market or recovery value ofthe underlying instrument) when they are exer-cised, whereas principal amounts are not ex-changed in standardized interest rate swaps.Moreover, credit risk transfers will probably ac-count for an increasing share of OTC derivativesmarkets owing to their rapid growth—whichsome market participants predict could rangearound 40 to 50 percent per year over comingyears.10
Particularly as the markets mature and growover time, credit risk transfers have the potentialto enhance the efficiency and stability of creditmarkets overall and improve the allocation ofcapital. By separating credit origination fromcredit risk bearing, these instruments can makecredit markets more efficient. They can alsohelp to reduce the overall concentration ofcredit risk in financial systems by making it eas-ier for nonbank institutions to take on the creditrisks that banks have traditionally held. In addi-tion, credit risk transfers allow banks and other
CHAPTER III STABILITY IMPLICATIONS OF GLOBAL FINANCIAL MARKET CONDITIONS
36
10Deutsche Bank, “Credit Derivatives Outlook,” January 8, 2002, p. 2.
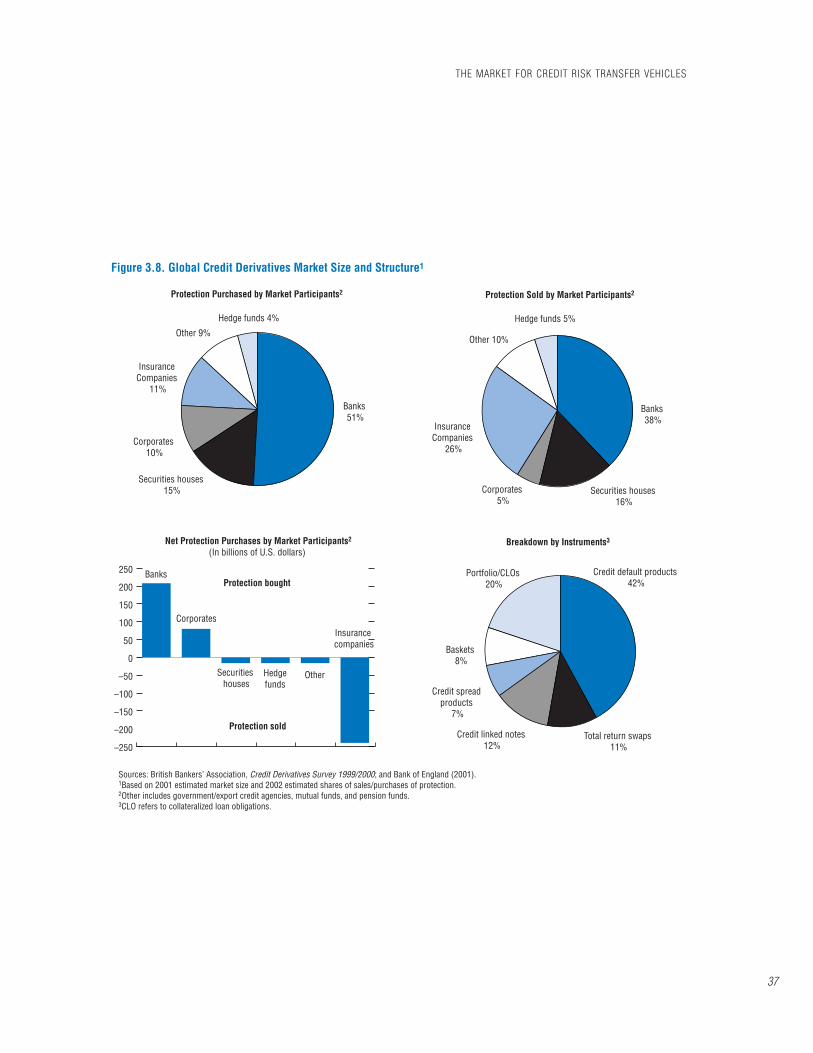
THE MARKET FOR CREDIT RISK TRANSFER VEHICLES
37
Figure 3.8. Global Credit Derivatives Market Size and Structure1
Protection Purchased by Market Participants2
Sources: British Bankers’ Association, Credit Derivatives Survey 1999/2000; and Bank of England (2001). 1Based on 2001 estimated market size and 2002 estimated shares of sales/purchases of protection. 2Other includes government/export credit agencies, mutual funds, and pension funds. 3CLO refers to collateralized loan obligations.
Protection Sold by Market Participants2
Net Protection Purchases by Market Participants2
(In billions of U.S. dollars) Breakdown by Instruments3
Banks 51%
Securities houses 15%
Corporates 10%
Insurance Companies
11%
Other 9%
Hedge funds 4%
Credit default products 42%
Portfolio/CLOs 20%
Baskets 8%
Credit spread products
7%
Credit linked notes 12%
Total return swaps 11%–250
–200
–150
–100
–50
0
50
100
150
200
250
Banks 38%
Securities houses 16%
Corporates 5%
Insurance Companies
26%
Other 10%
Hedge funds 5%
Insurance companies
OtherHedgefunds
Securities houses
Corporates
BanksProtection bought
Protection sold
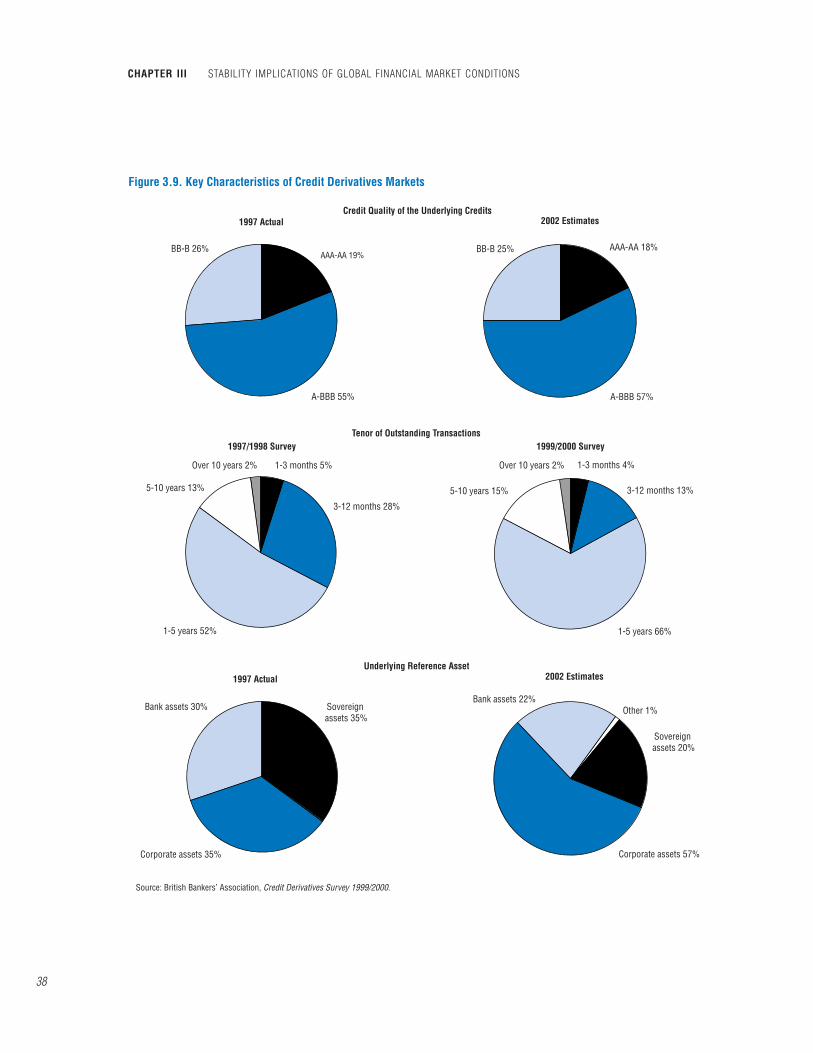
CHAPTER III STABILITY IMPLICATIONS OF GLOBAL FINANCIAL MARKET CONDITIONS
38
Figure 3.9. Key Characteristics of Credit Derivatives Markets
Credit Quality of the Underlying Credits
Source: British Bankers’ Association, Credit Derivatives Survey 1999/2000.
1997 Actual 2002 Estimates
AAA-AA 18%
A-BBB 57%
BB-B 25%
Tenor of Outstanding Transactions
Underlying Reference Asset
1997/1998 Survey
1997 Actual 2002 Estimates
1999/2000 Survey
AAA-AA 19%BB-B 26%
A-BBB 55%
3-12 months 28%
1-3 months 5%
5-10 years 13%
Over 10 years 2%
1-5 years 52%
3-12 months 13%
1-3 months 4%
5-10 years 15%
Over 10 years 2%
1-5 years 66%
Sovereign assets 35%
Bank assets 30%
Corporate assets 35%
Sovereign assets 20%
Bank assets 22%
Corporate assets 57%
Other 1%
financial institutions to diversify their credit ex-posures across markets and sectors. They also fa-cilitate the trading of credit risk, which can helpfinancial and nonfinancial institutions to man-age their credit exposures more flexibly. Finally,liquid credit risk transfer markets can augmentprice discovery and provide price informationthat usefully supplements the information avail-able from more traditional credit markets.
At the same time these instruments and marketsare currently being driven by regulatory arbitrage, in-volve nontraditional players, and are adding to thecomplexity of financial transactions and markets. Inthis way—and as will be explained in more detailbelow—they have posed new challenges or in-tensified existing ones. First, they are reducingtransparency about the institutional distributionof credit risk and its concentration. Second,while they are dispersing credit risk to a broaderset of market participants, they may be creatingor magnifying channels through which the dis-tress associated with credit events would spreadacross institutions and markets (includingthrough the web of rapidly shifting counterpartyexposures). Third, these instruments seem tohave created demand for credit risk by a muchlarger and different set of market participants,generally less, or even, not regulated as well asbanks, and not necessarily having the experiencerequired for properly pricing or managing theserisks. Finally, by their very nature, credit risktransfer mechanisms are by and large leveragedinstruments, and they can add to the totalamount of credit that is internally created withinthe financial system. This increases the potentialfor mispricing and misallocation of capital. Forthese reasons, the market’s ability to efficientlyand effectively transfer credit risk potentially hasimplications for financial efficiency, if not finan-cial stability.11 As Federal Reserve chairman AlanGreenspan recently noted, “derivatives have pro-vided greater flexibility to our financial system.
But their very complexity could leave counter-parties vulnerable to significant risk that they donot currently recognize, and hence, these instru-ments potentially expose the overall system ifmistakes are large. In that regard, the market’sreaction to the revelations about Enron providesencouragement that the force of market disci-pline can be counted on over time to fostermuch greater transparency and increased clarityand completeness in the accounting treatmentof derivatives.”12
Market Performance During the Slowdown
Since the beginning of the slowdown in globalgrowth, financial strains on corporate and sover-eign entities have given rise to a number ofcredit events, some of which in turn have trig-gered payments on—or legal disputes about—credit risk transfer instruments. As noted earlier,in 2001, amid an unusually large cyclical erosionin U.S. corporate profits relative to GDP, corpo-rate defaults rose to annual record levels, with211 issuers defaulting on $115 billion in debt. InJanuary 2002, corporate defaults reached newmonthly highs, with 41 issuers defaulting on $31billion in debt. Defaults also have been moreclustered than expected, and recovery rates havebeen lower than expected. Accordingly, marketparticipants have reportedly begun to improvediscipline on issuers by adjusting the pricing andcollateral terms of contracts and scrutinizingstructured financial instruments (involving un-derlying and derivative instruments) moreclosely. Some investors and credit-protection sell-ers have sustained sharp losses. For example,American Express lost $370 million in June 2001on a $1.4 billion collateralized debt obligation(CDO) portfolio, and several internationally ac-tive financial institutions have already experi-enced losses on credit enhancement transactionswith Enron now that it is in the midst of bank-
THE MARKET FOR CREDIT RISK TRANSFER VEHICLES
39
11For an extensive discussion of the risks associated with OTC derivatives, see Schinasi and others (2000).12Testimony of Chairman Alan Greenspan (Federal Reserve Board’s semiannual monetary policy report to the
Congress) before the U.S. House of Representatives Committee on Financial Services, February 27, 2002.

ruptcy proceedings, the full extent of which willnot be known with certainty until the bank-ruptcy proceedings and related lawsuits are re-solved. In addition, there is some uncertaintyabout the performance of some of the credit risktransfers used to hedge credit exposures toEnron.13 According to credit analysts and marketparticipants, except for Enron, no private coun-terparties to credit risk transfer vehicles have yetdefaulted. Accordingly, they see the markets ashaving worked reasonably effectively to insurecredit risk so far. Dealers and credit rating agen-cies see activity in credit risk transfer vehicles,which in the CDO market was reportedly fairlywell-sustained through September 11, as reflect-ing continued investor and dealer appetite forcredit risk.
As a result of these financial strains and creditevents, and in particular recent private defaultevents involving Railtrack and Enron, weak-nesses in the legal and operational infrastructureof OTC derivatives markets have resurfaced—asthey did during the LTCM crisis—and in particu-lar have raised concerns about the performanceand enforceability of some credit risk transfers.14
There are three recent examples of this. First,hedge funds had arranged credit default swaps15
to hedge credit risk in convertible bonds issuedby Railtrack, which was placed in administrationin October. Afterwards, uncertainty prevailed
about whether convertible bonds could be deliv-ered for the swaps. Some of this uncertainty wasaddressed in November when the InternationalSwaps and Derivatives Association (ISDA) issuedsupplementary documentation.16
Second, in December 2001, Enron’s failureand its involvement in credit and other OTC de-rivatives markets highlighted longstanding un-certainties about the legal effectiveness in bank-ruptcy of “closeout netting” provisions in OTCderivatives documentation (Box 3.1).17 Withoutcloseout netting, OTC derivatives holders couldbe exposed to a defaulting counterpart on agross, rather than net, basis (U.S. banks’ grossOTC derivatives exposures are about four timeslarger than their net exposures). U.S. bank-ruptcy legislation that would resolve this uncer-tainty for U.S. contracts is still under review inCongress, as it has been since the collapse ofLTCM in the autumn of 1998.
Third, in early 2002, JP Morgan Chase suedinsurance companies that failed to pay off on$965 million worth of surety bonds issued to JPMorgan as insurance against the failure ofEnron to make good on forward contracts in-volving the delivery of natural gas and oil. Suretybonds typically are used as a general form ofprotection against nonperformance of deliveryof goods.18 The insurance companies are alleg-ing that JP Morgan had no intention of taking
CHAPTER III STABILITY IMPLICATIONS OF GLOBAL FINANCIAL MARKET CONDITIONS
40
13See Financial Times (2002a, 2002b).14Earlier watershed credit events included the Conseco restructuring (September 2000), which raised issues about
whether restructuring should be treated as a credit event, and the National Power demerger (November 2000), whichraised issues about the treatment of credit derivatives involving obligations that are split between successor companies.These contract design issues were subsequently addressed in supplements and user guides issued by the InternationalSwaps and Derivatives Association.
For discussion of legal risks in OTC derivatives markets, including credit derivatives, see Box 3.6 in Schinasi and others(2000).
15These contracts involve the payment of periodic premiums from a “protection buyer” to a “protection seller.” In theevent that a predefined “credit event” such as default occurs, the protection seller makes a payment related to the marketvalue of an underlying reference instrument such as a bond. For example, the protection seller might either buy the refer-ence instrument at par value from the protection buyer, or make a payment that is equivalent to the difference betweenpar and market value. For more technical details on these and other instruments see Handbook of Credit Derivatives (1999).
16ISDA develops standards and serves as a forum for the discussion of legal and documentation issues surrounding OTCderivatives contracts.
17Closeout netting—the settlement of net outstanding obligations by a single payment in the event of default—mitigatesthe risk that a bankrupt counterparty will ‘cherry pick’ its obligations by attempting to enforce those that have positivevalue to it while repudiating the others. See Schinasi and others (2000).
18A surety bond is a bond issued by one party, the surety, guaranteeing that he will perform certain acts promised by an-other or pay a stipulated sum, up to the bond limit, in lieu of performance should the principal fail to perform.
THE MARKET FOR CREDIT RISK TRANSFER VEHICLES
41
Enron has come to symbolize the use of ag-gressive accounting techniques by major compa-nies to mask excessive leverage and weak earn-ings. The company’s collapse—the largest U.S.Chapter 11 bankruptcy in history—also causedsignificant volatility in financial markets and willno doubt lead to significant losses for financialinstitutions and institutional and retail investors.So far, these effects have not been seen as hav-ing systemic financial consequences, because ex-posures to Enron are generally well diversifiedacross institutions and markets. Remaining un-certainties include: the likelihood that hiddenlosses will be uncovered as Enron’s highly com-plex financial operations are unwound; the mag-nitude of bank exposures to other energy com-panies that are also facing difficulties because ofEnron’s collapse; the size and structure ofEnron’s derivatives books; and the extent of in-surance company exposure.
As described in the text, Enron’s failure high-lighted uncertainties about the effective func-tioning of credit-risk transfer vehicles. It also un-derscored three broader capital-markets issues.
Inadequate oversight of financial activities of non-financial corporations. Enron was the maindealer, market-maker, and liquidity provider inmajor segments of the OTC energy derivativesmarkets, and was also active in other derivativesmarkets segments (at end-September 2001, itsoverall derivatives trading liabilities stood atabout $19 billion). Despite its size, complexity(including many off-balance-sheet special pur-pose vehicles), and central role in the energyderivatives markets, its OTC derivatives activitieswere essentially unregulated (like those of manyother large market participants that trade on aprincipal-to-principal basis).1 In particular, itwas not required to disclose information aboutits risks to counterparties; disclose information
about market prices or conditions, even in mar-kets that it dominated; or set aside prudentialcapital against trading risks. It is possible, butnot yet clear that these gaps contributed to itsdemise and the associated financial market im-plications. Because its trading unit’s capital wasnot segregated from the parent company’s capi-tal, a loss of confidence in the parent com-pany’s soundness led its banks to withdrawcredit lines, which in turn contributed to a col-lapse in its trading operation. Some observershave since called for revisions to the 2000Commodity Futures Modernization Act that ex-empted energy derivatives activities from keyregulatory provisions, and U.S. Congressionalhearings have since clarified that certain energyderivatives contracts are not covered by key reg-ulatory provisions. Nevertheless, even if theseexemptions had not been made, Enron’s activi-ties in, for example, credit and other financialderivatives markets would still have been essen-tially unregulated.
Ineffective private market discipline, disclosure,corporate governance and auditing. Enron’s finan-cial difficulties and vulnerabilities, includingthose associated with its extensive off-balance-sheet transactions, seemed to have gone unde-tected by analysts as well as its shareholders andcreditors until it was on the brink of bank-ruptcy. In part this may have reflected inade-quate accounting rules and standards as wellas errors by its auditors, which (among otheroversights) did not uncover related-party trans-actions or require Enron to properly consoli-date its many and complex off-balance-sheetSPVs in its financial statements. In October2001, the correction of this and other errorsresulted in a restatement of income since 1997by $600 million and a writedown of shareholderequity by $1.2 billion. Questions also aroseabout the auditor’s possible conflict of interestowing to its parent company’s extensive consult-ing business with Enron (in 2000 Enron paid it$25 million in auditing fees and $27 million inconsulting fees). Along with allegations that theauditor destroyed documents relevant to aSecurities and Exchange Commission inquiry,
Box 3.1. Financial Implications of Enron’s Bankruptcy
1Testimony of Vincent Viola, Chairman, New YorkMercantile Exchange, before the Senate Energy andNatural Resources Committee, January 29, 2002.Energy derivatives are subject to the anti-fraud andanti-manipulation provisions of the CommodityExchange Act, however.

physical delivery and instead used the transac-tions as a way of extending loans to Enron collat-eralized by the surety bonds. These examples to-gether highlight, in actual practice, the opacityand legal uncertainties associated with credit risktransfers.
Argentina’s default in December also consti-tutes a major test of the rapidly growing marketfor emerging market credit default swaps. Therepresently are no reliable estimates or surveys ofthe total outstanding amount of Argentine de-fault protection. But market observers suggestthat the total could be in the range of $10 to $15billion in notional amount covering a largenumber of contracts. These contracts are now inthe process of being settled.
In sum, some progress has been made in ad-dressing operational “teething problems” in thenascent credit risk transfer markets, particularlyfor standardized “vanilla” instruments such ascredit default swaps. At the same time, as evidentfrom ongoing legal disputes, some operationalissues highlighted by the downturn and deterio-rating credit environment remain to be ad-dressed. Moreover, there may be significant op-erational risks in the CDO market, whichinvolves heterogeneous instruments and SPVstructures that can be complex and relativelynontransparent to investors. In addition, the po-
tential for CDO investors to experience suddenand larger-than-anticipated losses (as in the caseof American Express) raises a question aboutwhether such vehicles pose reputational risks tobanks. An originating bank might prefer to com-pensate its investors for losses or buy back theproduct, rather than risk damage to its reputa-tion that could prevent it from selling such prod-ucts in the future. If this occurred, the bankwould wind up with a loss on the underlyingcredit exposure despite having bought creditprotection in what seemingly had been an “armslength” transaction.
Challenges Going Forward
The development of markets for credit risktransfers is still in an early stage of the new prod-uct cycle typical of new markets. As noted above,in 2001 the market seemed to be able to copewith a series of credit events that emerged as theglobal economy slowed. Payments were by andlarge made by credit risk protection sellers toprotection buyers, even though in some casesthis occurred only after arbitration. At the sametime, the global slowdown—along with risingcorporate defaults—has revealed some chal-lenges in using these instruments and in under-standing their impact on financial stability.
CHAPTER III STABILITY IMPLICATIONS OF GLOBAL FINANCIAL MARKET CONDITIONS
42
these revelations led to widespread calls for acloser examination of auditing standards andpractices.
Misallocation of retirement savings. More than10,000 of Enron’s employees held most of theirretirement savings in Enron stock, includingEnron’s contributions (entirely in companystock)—which the company prohibited themfrom selling until age 50. In addition, for threeweeks in October, Enron required its employeesto freeze their asset allocations as it switchedplan administrators, during which time Enronstock fell by 35 percent. As a consequence of the
pension plan’s poor diversification and inflexi-bility, during 2001 a large share of employee sav-ings were wiped out as Enron’s stock priceplummeted from about $90 to less than $1.00.In the early part of 2002, the U.S. authoritiesformed a working group to consider potentialreforms to the Employee Retirement IncomeSecurity Act (ERISA) rules that govern privatepension investments, and the U.S. Congressheld hearings to discuss (among other topics)how to address gaps in ERISA that permitted ahigh concentration of Enron stock in the com-pany’s pension fund.
Box 3.1 (concluded)

First, credit derivatives can reduce the trans-parency about who owns credit risk. This occurs,in part, because the transfer of credit risk re-duces the informational content of balancesheets without necessarily providing additionalinformation about where the risk is transferredor even how it is priced. By reducing trans-parency about credit exposures, the growth incredit derivatives complicates the assessment ofprivate credit and counterparty risk in individualinstitutions. It also makes it more difficult to as-sess the overall distribution of credit risk acrossinstitutions and markets, and the challenges thatcredit risk transfers might pose to liquidity con-ditions in related underlying and derivative mar-kets (i.e., it poses liquidity risks) and more gen-erally to financial market stability. The fact thatthere are now nontraditional entities that aretrading in these markets—such as Enron, for ex-ample—that are not subject to the same disclo-sure rules and standards as regulated financialinstitutions further adds to the lack of trans-parency. Moreover, and as illustrated by the caseof Enron, there are also gaps in accounting rulesand standards, particularly regarding specialpurpose vehicles, as well as in auditing practices,that apparently are also contributing to a lack oftransparency.
Second, regulatory arbitrage involving creditrisk transfer vehicles is shifting credit risk expo-sures to outside the banking system. This is aconcern because regulatory incentives appear toencourage banks to transfer credit risk to otherinstitutions—such as hedge funds, pension fundsand insurance companies—that are not pruden-tially regulated like banks, in particular as re-gards capital adequacy, and that have not tradi-tionally had cultures or risk managementsystems that are as attuned to credit risk. Never-theless, these nonbank financial institutionsmanage a large volume of assets distributedacross global markets and are part of the global
network of counterparty risk exposures. Somebelieve they are the weak links in the chain ofcounterparty relationships. A string of unantici-pated credit events that caused those marketparticipants to experience much larger-than-expected losses could lead them to reduce theirwillingness to supply credit protection whenbanks need it most. It could also lead to a with-drawal of capital devoted to market making incredit risk transfer markets. These reactions, ifthey were sharp and sustained, could signifi-cantly impair liquidity and create volatility in thecredit derivatives and related markets, similar tothe way in which the threat of default by LTCMaffected credit markets in 1998.
Third, because the use of credit risk transfervehicles tends to increase the linkages betweenmarkets and institutions, these new instrumentstend to increase the potential for spilloversacross markets or to augment existing ones. Forexample, unanticipated shocks to an underlyingbond or loan transaction for which there is anassociated credit derivative would give rise to in-creased demand for credit hedges. During a pe-riod of turbulence in the underlying market, sit-uations could arise in which there would beone-sided, illiquid, and volatile credit derivativemarkets, which through counterparty relation-ships could spill over into connected markets.Likewise, in a market where there are relativelyfew very large counterparties, a cluster of creditevents could trigger payments on many contractsat once and put considerable liquidity demandson one or more of the relatively small numberof major market makers.19 If these market mak-ers had to sell a wide range of liquid securitiesfrom their portfolios to cover payments, volatilitycould rise sharply in a variety of markets at once.In addition, as a number of the institutions thatsell protection—particularly insurance compa-nies—typically have access to bank credit lines,they might tap these lines to fund payments on
THE MARKET FOR CREDIT RISK TRANSFER VEHICLES
43
19Global data are not available, but in the United States, one bank holds 60 percent of the banking system’s outstandingnotional credit derivatives; two banks hold 75 percent. As noted elsewhere, banks are net buyers of credit protection; it isunclear whether holdings of net protection sellers are similarly concentrated.

credit risk transfer contracts, potentially puttingpressure on bank liquidity. Finally, credit hedgescould fail to perform as expected if a major pro-tection seller came under financial stress and ei-ther contested the legality of the contract or wasunable to pay. This could leave banks with un-hedged credit positions, give rise to an increasein the demand for credit hedges and/or unload-ing of credit positions, and potentially lead to anincrease in credit-market volatility.
These transmission mechanisms can be mag-nified by the leverage inherent in credit deriva-tives. As with other OTC derivatives, credit deriv-atives allow investors to take on exposure to anunderlying credit instrument while committingmuch less funds than would be required to actu-ally buy the instrument. In addition, a single un-derlying credit transaction can give rise to multi-ple gross credit derivative transactions as dealersrehedge and lay exposures off on one another.The total gross credit exposures created throughthis process can in principle substantially exceedthe exposure on the underlying instrument. Forexample, an initial $1 billion credit transactionmight give rise to 5 rounds of hedging as dealerspass the exposure around the market. Eachtransaction involves the creation of another $1billion in gross exposure to one counterparty;five such transactions therefore give rise to$5 billion in gross credit exposure.
Fourth, because these are relatively new in-struments and markets, and there is now easierinvestor access to credit risk markets, a signifi-cant amount of capital from nontraditionalsources is flowing into credit risk transfers.Concerns have been raised that there is not yet afull understanding of the costs and benefits ofthese instruments. More generally, the tendencyfor credit derivative spreads to be volatile andeven decline below the spreads on the underly-
ing bonds raises questions about whether partici-pants in the credit derivative markets—especiallythose that have not traditionally managed creditrisks—have yet learned how to price these con-tracts appropriately. In early 2001, a strong sup-ply of credit protection—including from institu-tional investors and money managers—comparedwith demand for credit protection from banksapparently contributed to narrow and sometimeseven negative spreads between the credit defaultswap premium and the credit spread on the un-derlying security (Figure 3.10).20 Whether or notcontracts are being properly priced is difficult toknow, in part because the theory of credit deriva-tive pricing is still developing. If in fact credit de-rivative prices “overshoot” and are excessivelyvolatile relative to the price of the underlyingcredit, this would distort signals about creditrisks. Accordingly, it would also raise questionsabout whether credit risk transfer vehicles im-prove or reduce the efficiency of credit alloca-tion in markets.
Looking ahead, improvements to the infra-structure for, and transparency of, credit risktransfers could help them to develop more fully,help market participants to manage the risks,support market discipline, and make the mar-kets more efficient. This occurred in the OTCswaps markets during the 1990s, and there isgood reason to expect the credit derivative mar-kets would mature through time as well.Infrastructure improvements in the future willno doubt include better documentation that fur-ther refines the definition of a credit event.Bankruptcy legislation that would establish thelegal effectiveness of closeout netting and a con-vergence in bankruptcy laws about what consti-tutes a default would also encourage furthermaturation of the market. Better informationabout the size and structure of the market and
CHAPTER III STABILITY IMPLICATIONS OF GLOBAL FINANCIAL MARKET CONDITIONS
44
20The premium is the spread over the London Interbank Offered Rate (LIBOR) that is paid for credit protection.Although the analytical theory is still being developed, the difference between the premium on a credit derivative and thecredit spread on the underlying instrument partly reflects differences in tax treatment, liquidity, and counterparty risks fora bond versus a credit default swap. These structural features might limit the extent to which market participants can arbi-trage away the difference in spreads between the two markets. The sharp blowout in spreads during September probablyreflects an increased demand for credit protection following the attacks.

the exposures of bank and nonbank financial in-stitutions active in the market would help mar-ket participants assess the attendant risks andgauge whether they are well-managed by the in-stitutions involved in the markets. Acceleratedprogress on all these fronts would go a long waytoward addressing the weaknesses highlightedabove.
Potential Implications of Increasing RetailInvestor Involvement
Another issue that could become more impor-tant in the future is the now small, but increas-ing, exposure of retail investors to the risks asso-ciated with credit risk transfers. Hard data onretail participation and exposures are not avail-able, but retail investors are seen by market par-ticipants as searching for higher-yielding alterna-tives to their traditional investment instrumentssuch as stocks, government and corporatebonds, money-market mutual funds, and bankdeposits in light of the low returns on such in-struments in the recent period. Retail demandmay also reflect the longer-term underlyingtrends of disintermediation and more direct re-tail investment in asset markets. In this environ-ment, retail investors have increasingly investedand become exposed to the risks in a variety ofstructured products, including guaranteedfunds—providing downside protection by hedg-ing exposures in derivatives markets—and mu-tual funds that own CDOs.
At present, credit analysts see retail investors’relatively limited participation in credit risktransfer markets through three main channels:investments by “high net worth individuals,” mu-tual funds, and hedge funds.21 Although dataare not available, in view of their recent prolifer-ation, hedge funds are a principal channel forindirect retail participation in credit risk transfermarkets. Hedge funds invest in CDOs and em-
THE MARKET FOR CREDIT RISK TRANSFER VEHICLES
45
Figure 3.10. Spread Between Credit Derivatives Premium and Underlying Bond Spread1
(In basis points)
Sources: Deutsche Bank. 1Average for credit default swaps on four investment grade U.S. corporations.
80
60
40
20
0
–20
–40
–60Jan. Mar. May July Sept.
2001
21Retail participation takes place through mutual fundsinvesting in CDOs rather than credit derivatives, as thelatter trade only on OTC markets made up by financial-in-stitution counterparties.

ploy credit default swaps to hedge the credit riskin convertible bond arbitrage strategies. Retailinvestments in these strategies have becomemore accessible as hedge funds have reducedminimum investment requirements and insti-tuted less restrictive “lock up” rules that allow in-vestors to withdraw more quickly. Hedge fundsthat meet enhanced disclosure and regulatoryrequirements are allowed to increase the num-ber of investors (thereby reducing their mini-mum investments), and are more readily accessi-ble to pension funds and other institutionalinvestors. Moreover, minimum investment rulesmay be increasingly irrelevant, because one caninvest any amount in recently created offshore-based funds, structured as “closed end” funds,which invest 100 percent of their assets in hedgefunds (“funds of funds”).22 It is estimated thatabout 440 funds of funds exist and account forabout 20 to 25 percent of the hedge fund uni-verse of $500 billion in capital under manage-ment (UBS Warburg, 2001).
Even if direct involvement and exposure incredit risk transfer mechanisms are limited, re-tail investors can become exposed to credit riskin many less transparent ways. For example,shareholders of American Express stock were ad-versely affected when it became known thatAmerican Express had taken significant losses ontheir investments in CDOs, which involved creditrisk transfer mechanisms. Markets adjusted tothis new information, the company’s share pricefell, and shareholders saw the value of their in-vestment decline.
Likewise, many retail investors may hold mu-tual funds that invest in riskier credit instru-ments in order to enhance their yields. One il-lustration of this is the unexpected impact of thecollapse of Enron on some Japanese moneymanagement funds (MMFs). These MMFs in-vested in Enron’s Euroyen bonds and marketedshares in their funds to Japanese retail investorsas a high-yield alternative to bank deposits. The
collapse of Enron caused a sudden redemptionon these funds, as investors withdrew ¥2 trillion($16 billion) from the MMFs. This was well inexcess of the funds’ holdings of Enron Euroyenbonds (totaling ¥40.5 billion). The redemptions,among other things, prompted the Bank ofJapan to expand its liquidity provision to offsetthe potential adverse impact on financial mar-kets. This resulted in an increase of current ac-count balances by ¥6 trillion ($49 billion). Thisaction followed the earlier expansion of liquidityprovision in Japan of more than ¥8 trillion, as aresult of the impact of liquidity effects in Japanfollowing the events of September 11.
As a result of all these changes, the hedgefund industry, including the segment that is ac-tive in credit risk transfer markets, is widely con-sidered to have been “democratized.” For in-stance, many of the new retail investors are notthe traditional “high net worth individuals”—minimum investments in hedge funds inEurope, Japan, and the United States are now aslow as €20,000 (or $18,000). Reflecting this eas-ier access, retail hedge fund investments surgedfrom $8 billion in 2000 to over $22 billion in2001 through September. The potential for re-tail participation will increase further as morehedge fund investment vehicles begin to be of-fered publicly.
At present, the potential for active retail par-ticipation in credit risk transfer markets seems tobe mainly an investor protection issue. As notedabove, even some sophisticated market partici-pants have encountered challenges in investingin and understanding how best to use credit risktransfers. In this regard, there may be cause forconcern about, first, the ability of retail investorsto understand fully the risks in credit risk trans-fer vehicles and price them accordingly—partic-ularly given the difficulties that some sophisti-cated institutional investors seem to have hadwith this—and, second, whether the disclosureand transparency standards that have been de-
CHAPTER III STABILITY IMPLICATIONS OF GLOBAL FINANCIAL MARKET CONDITIONS
46
22Onshore funds, however, may be subject to regulation. In the United States, retail investors in “funds of funds” receivethe protection afforded an investor in any registered investment company. These include enhanced disclosure and pru-dential requirements placed on the fund that are designed to prevent self-dealing and favoring of affiliates.

veloped for other instruments, such as mutualfunds, would need to be updated.
An additional complication is that the activi-ties of intermediaries that offer products such asguaranteed funds might be altering the distribu-tion of credit risks in the financial system.Internationally active financial institutions tradeactively in global exchange-traded and OTC de-rivatives markets in order to hedge their expo-sures to the retail products they sell, in effect ar-bitraging between professional hedging marketsand the retail markets. As this activity effectivelytransfers credit risk from the fund to its counter-parties—which can include a wide range of fi-nancial institutions such as hedge funds and in-surance companies—it both complicates anassessment of who bears the ultimate risks associ-ated with the products and raises questionsabout whether the counterparties can managethese risks well.
If and as retail investor participation growsover time, the broader dispersion of credit risksacross investors could improve the effectivenessof credit risk transfer markets in mitigating thefinancial effects of periods of economic stress.Nevertheless, the relatively limited sophisticationof individual investors and questions about dis-closure and transparency could have implica-tions for financial efficiency and/or stability. Forinstance, herding or “bandwagon” effects couldoccur in credit risk transfer markets if retail in-vestment decisions are driven primarily by in-vestor sentiment rather than information aboutchanging fundamentals. Similarly, if disclosureand transparency to retail investors about therisks in these vehicles are insufficient, this wouldincrease the potential for investment mistakes tooccur, as well as rapid unwinding of investmentpositions when these mistakes are discovered.Both of these effects would tend to increasevolatility in credit prices and spreads, and mightalso adversely affect the efficient allocation ofcredit in the financial system.
ReferencesArora, Vivek B., and Athanasios Vamvakidis, 2001,
“The Impact of U.S. Economic Growth on the Restof the World: How Much Does it Matter?” IMFWorking Paper 01/119 (Washington: InternationalMonetary Fund).
Bank of England, 2001, Financial Stability Review, June.
Deutsche Bank, 2002, Credit Derivatives Outlook,Deutsche Bank (January).
Dynan, Karen E., and Dean M. Maki, 2001, “DoesStock Market Wealth Matter for Consumption?”Finance and Economics Discussion Series No.2001–23 (Washington: Board of Governors of theFederal Reserve System).
Financial Times, 2002a, “JP Morgan and Insurers GoTo Court Over Enron: Dispute About Surety BondsRaises Doubts About How Banks Transfer TheirCredit Risks,” January 15, p. 19.
———, 2002b, “SEC Investigates Credit Risk of USBank ‘Loans’: Exposure of JP Morgan andCitigroup to Enron Raises Fears Shareholders WereMisled,” January 16, p. 19.
Fitch, 2001, U.S. Banking Quarterly Review—3Q01 (NewYork).
Handbook of Credit Derivatives, 1999, ed. by Francis, JackClark, Joyce A. Frost, and Gregg Whittaker (NewYork: McGraw-Hill).
International Monetary Fund, 2001a, United States ofAmerica – Selected Issues (Washington).
———, 2001b, World Economic Outlook, December 2001:The Global Economy After September 11, WorldEconomic and Financial Surveys (Washington).
Ludwig, Alexander, and Torsten Sløk, 2002, “TheImpact of Changes in Stock Prices and HousePrices on Consumption in OECD Countries,” IMFWorking Paper 02/01 (Washington: InternationalMonetary Fund).
Schinasi, Garry J., R. Sean Craig, Burkhard Drees, andCharles Kramer, 2000, Modern Banking and OTCDerivatives Markets: The Transformation of GlobalFinance and its Implications for Systemic Risk, IMFOccasional Paper No. 203 (Washington:International Monetary Fund).
UBS Warburg, 2001, The Search For Alpha Continues: DoFund of Hedge Fund Managers Add Value? (London).
REFERENCES
47

The Mexican (1994–95) and Asian(1997–98) crises stimulated a variety ofempirical studies designed to identifyboth the causes of these crises and the
determinants of the associated spillover effects(Kaminsky and Reinhart, 2000). To the extentthat past crises can yield useful lessons about fac-tors that contribute to a country’s vulnerabilityto future crises, scholars and policymakersquickly realized that these empirical studiescould be one element in a forward-looking earlywarning system (EWS). As a result, a growingnumber of international financial institutions(IFIs) and central banks are using EWS modelsin their surveillance activities. Similarly, severalinvestment banks have developed in-house EWSmodels aimed at providing foreign exchangetrading advice to their clients and complement-ing their economic analysis of emergingmarkets.
These models typically have an empiricalstructure that attempts to forecast the likelihoodof a certain type of “crisis” using factors such ascountry fundamentals, developments in theglobal economy and/or global financial markets,and, in some cases, political risks. A number ofconsiderations have influenced the developmentof existing EWS models. First, despite a commonorigin in the academic models of the mid-1990s,existing EWS models differ sharply among them-selves in terms of their definition of a “crisis”and in terms of the time horizon over whichthey attempt to forecast a crisis. Not surprisingly,these differences reflect the different interests ofthe various end users. For example, investmentbank models define a crisis primarily in terms ofvariables such as changes in exchange rates andinterest rates that are likely to affect the prof-itability of foreign exchange trading or invest-ment positions. Moreover, investment bank mod-els typically focus on one- to three-monthforecast horizons that are regarded as most rele-
vant for foreign exchange trading and invest-ment positions. In contrast, EWS models used byIFIs and central banks in surveillance exercisestend to focus on variables associated with majorbalance of payments crises, namely largechanges in exchange rates and/or central bankforeign exchange reserves. In addition, surveil-lance-linked EWS models typically attempt toforecast a country’s vulnerability to crisis over amuch longer time horizon than investment bankmodels. These models can have a forecast hori-zon of up to 24 months, reflecting in part thedesire to have enough time to formulate correc-tive policy adjustments.
A second consideration that has affected thespecification of the models and the interpreta-tion of their forecasts has been the need to con-front the trade-off between so-called type I andtype II errors associated with the estimation ofthe statistical models. Type II errors (the accept-ance of a false hypothesis of no crisis) can beminimized if EWS models are designed so thatthey have a low probability of missing a crisis.Unfortunately, adopting estimation proceduresthat minimize type II errors typically result inlarger type I errors (the rejection of a true hy-pothesis of no crisis). In other words, the modelscan be calibrated to catch most crises, but onlyat the cost of many false claims.
A third consideration has been the availabilityand timeliness of data. For example, the absenceof adequate historical time series on market in-terest rates and other financial variables has ledto the exclusion of such variables in some EWSmodels. Moreover, variables available only withlong reporting lags complicate the updating offorecasts and again discourage the use of whatwould otherwise be important explanatoryvariables.
The current EWS models have a mixedrecord in terms of forecasting accuracy, but theyoffer a systematic, objective and consistent
48
CHAPTER IVEARLY WARNING SYSTEM MODELS: THE NEXT STEPS FORWARD

method to predict crisis that avoids analysts’ bi-ases. Nonetheless, these models are just one ofthe many inputs into the IMF’s surveillanceprocess, which encompasses a comprehensiveand intensive policy dialogue. As is the case withrisk management models, they are not a substi-tute for sound and balanced judgments on fi-nancial weaknesses. This chapter briefly reviewsthe nature of the core EWS models used by theIMF in surveillance exercises, examines the per-formance of these models in terms of the accu-racy of both in-sample and out-of sample fore-casts, and considers various avenues forimproving the usefulness of these models assurveillance tools. In particular, the use ofalternative “building blocks” for predicting for-eign exchange, debt, and banking crises, as wellas the more efficient use of the informationembedded in forward-looking asset prices, isdiscussed.
Current EWS Models at the IMFAs part of the IMF’s surveillance activities, the
IMF maintains two core EWS models: theDeveloping Countries Studies Division (DCSD)model and the Kaminsky, Lizondo, and Reinhart(KLR) Crisis Signals model (see Berg and oth-ers, 1999).1 In addition, the results of a numberof external EWS models are monitored on anongoing basis.
The core models attempt to forecast a coun-try’s vulnerability to a foreign exchange crisis de-fined as a large depreciation of the exchangerate and/or extensive losses of foreign exchangereserves over a 24-month forecast horizon. Inthis context, a crisis is said to have occurredwhen the “exchange market pressure” index—aweighted average of one-month changes in theexchange rate and foreign exchange reserves—is
more than three (country-specific) standard de-viations above the country average value.
The core models have parsimonious struc-tures. For example, the DCSD model includesonly five explanatory variables (real exchangerate overvaluation, current account, foreignexchange reserve losses, export growth, and theratio of short-term debt to foreign exchangereserves).2 In contrast, the KLR Crisis Signalsmodel uses twice as many variables (the firstfour variables used in the DCSD model as wellas the ratio of foreign exchange reserves to M2,the growth of the ratio of reserves to M2, do-mestic credit growth, change in the moneymultiplier, real interest rate, and “excess” M1balances—defined as actual M1 less an esti-mated demand for money). Box 4.1 describessome of the statistical properties of the twocore models.
The output of the core models is comple-mented by monitoring the results from three in-vestment bank models: Credit Suisse First BostonEmerging Markets Risk Indicator (CSFB-EMRI),Deutsche Bank Alarm Clock (DBAC), andGoldman Sachs GS-Watch.3 The forecasting hori-zon is one month for CSFB-EMRI and DBAC,and three months for GS-Watch. The choice ofexplanatory macroeconomic and financial vari-ables is similar to those in the core IMF models.Among the three, there are some differences inthe estimation methodology, but the major dif-ference is in how each model defines crisisevents. CSFB-EMRI defines a crisis as an ex-change rate depreciation that exceeds 5 percentand is at least double the preceding month’s de-preciation. In contrast, DBAC defines exchangerate and interest rate events as currency devalua-tions and interest rate increases exceeding ex-ogenous thresholds (typically a depreciation ofmore than 10 percent and an interest rate in-
CURRENT EWS MODELS AT THE IMF
49
1These EWS models are just one of the many inputs into the IMF’s surveillance process, which encompasses a compre-hensive and intensive policy dialogue.
2Efforts to incorporate fiscal sector variables are discussed in Kell and Schimmelpfennig (2002); corporate sector vari-ables are covered by Mulder, Perrelli, and Rocha (forthcoming).
3Roy (2001); Garber, Lumsdaine, and Longato (2001); and Ades, Masih, and Tenengauzer (1998). In the future, theIMF may add other models to the list.

CHAPTER IV EARLY WARNING SYSTEM MODELS: THE NEXT STEPS FORWARD
50
The core Early Warning System (EWS) modelsused in the IMF are the Developing Country StudiesDivision (DCSD) and the “modified” Kaminsky,Lizondo, and Reinhart (KLR) models.1 Both mod-els define a crisis as an event during which an “ex-change market pressure” index (EMPI)—a weightedaverage of monthly percentage depreciations in thenominal exchange rate and monthly percentage de-clines in foreign exchange reserves—exceeds itsmean by more than three standard deviations.2 TheEMPI is used to create the dependent binary vari-able, a crisis indicator, that is equal to one if a crisisoccurs in the subsequent 24 months, and equal tozero otherwise.
The DCSD model uses a multivariate panel pro-bit regression technique to estimate the monthlyprobability that a country would suffer a crisis inthe following 24 months. Explanatory variables in-clude real exchange rate overvaluation, current ac-count balance, foreign exchange reserve losses, ex-port growth, and the ratio of short-term debt toforeign exchange reserves, measured in percentileterms. The model coefficients corresponding to themost recent estimation for the period December1985 to July 1997 are shown in the table below.
The probabilities obtained from the model areconverted into a binary indicator, an early warningindicator that signals a crisis and also allows for thestatistical evaluation of different models. The indica-tor is equal to one (and is said to “call” a crisis) if theprobability exceeds a cutoff threshold probability,and equal to zero otherwise. When the indicator isequal to one, the model correctly calls or signals acrisis if one ensues within 24 months, and gives afalse alarm otherwise. When the indicator is zero, themodel correctly calls a tranquil period if no crisis en-sues within 24 months, and misses a crisis otherwise.
A statistical evaluation of the different models’accuracy relies heavily on the choice of the cutoffthreshold probability. Clearly, the choice of a low
threshold would lead to many false alarms but fewmissed crises.3 Alternatively, the choice of a largeprobability threshold would lead to few false alarmsbut many missed crises. In DCSD, the optimal se-lection of the threshold is obtained by minimizingan equally weighted sum of false alarms and missedcrisis.
The econometric methodology of the KLR sig-nals model is somewhat different from that of theDCSD model, except for the final stage that deter-mines the threshold probability for an aggregatecrisis index and a crisis is called. The KLR modelassumes that each individual explanatory variablesignals a crisis if its mean exceeds a variable-specificoptimal threshold and a crisis occurs in the next 24months. This threshold, which is expressed in per-centile terms and is assumed equal across coun-tries, is determined by minimizing the noise-to-signal ratio: the number of months during whichthe variable signaled a crisis incorrectly (false alarmor noise) divided by the number of months duringwhich the variable signaled a crisis correctly.
KLR constructs a single composite crisis indicatorequal to the weighted-sum of the explanatory vari-ables, with the weights being equal to the inverse ofeach indicators’ noise-to-signal ratio. The probabil-ity of crisis for each value of the aggregate index isthen obtained by observing how often, within thesample, a given value of the aggregate index is fol-lowed by a crisis within 24 months, and the optimalprobability threshold for the KLR model is deter-mined in a similar way as for the DCSD model.
Box 4.1. The IMF’s Core Early Warning System Models—A Primer
DCSD Model Specification
Variable Coefficient*
Constant –3.250Overvaluation 0.013Current account 0.007Foreign exchange reserves 0.007Export growth 0.002Short-term debt to reserves 0.002
*Coefficients significant at least at the 10 percent level.
1The current versions of the models were developed inthe IMF Research Department and are currently main-tained by the International Capital Markets Department.
2Means, standard deviations, and weights are country-specific. Weights are calculated so that the variance of thetwo components of the index are equal.
3From a statistical point of view, the former might bethought of as type I errors and the latter as type II errors,under the null hypothesis of no crisis.

crease of more than 25 percent) and estimatesthe probability of both events simultaneously us-ing a two-equation framework. Finally, GS-Watchdefines a crisis event as one in which a financialprice index (FPI) crosses an endogenous thresh-old, the latter being determined as a function oflagged values of the FPI.4
Model Performance
How well have the EWS models performed,especially in periods outside the original sampleperiod used for estimation of the relevant pa-rameters, in terms of both the appropriate fore-cast of an actual crisis and the avoidance of falsesignals (either missing an actual crisis or falselyforecasting a crisis that did not occur)?
A thorough evaluation of the IMF’s EWSmodels recently concluded that the core mod-els’ forecasts are significant predictors of actualcrises but that they still generate a substantialnumber of false alarms and missed crises (seeBerg, Borensztein, and Pattillo, 2001). Thestudy stresses the importance of out-of-sampleprediction for an EWS model to be a useful sur-veillance tool, as well as the trade-off betweenmissing crises and generating false alarms. Therelatively long 24-month prediction horizon ledthe authors to evaluate the models according tothe forecasts issued in July 1999. Overall, the au-thors concluded that the DCSD model per-formed reasonably well, as countries with a pre-dicted probability of crisis above 50 percentsubsequently had crises, and no crisis countryhad a probability of crisis below 26 percent.Furthermore, the DCSD model called 59 per-cent of the crises correctly but issued a largenumber of false alarms, 78 percent.5
In contrast, investment bank models do notperform as well as the core models when pre-dicting exchange rate crises out-of-sample, but
they appear to have satisfied their commercialobjectives. Both the GS-Watch and CSFB modelshave an adequate in-sample performance (thepercent of crises correctly called is 66 percentand 61 percent, respectively), but their out-of-sample predictions are much weaker (the per-cent of crises correctly called falls to 54 percentand 27 percent, respectively).6 However, invest-ment bank models are regarded by the invest-ment banks as performing reasonably well whenevaluated solely on the merits of their short-term trading and/or investment recommenda-tions. For example, the expected return of cur-rency portfolios based on GS-Watch haveconsistently outperformed market neutral port-folios of emerging markets currencies (seeAdes, Masih, and Tenengauzer, 1998).
The more recent performance of EWS modelscan be examined in terms of their forecasts inthe periods surrounding two episodes that tookplace in 2001 and satisfy the EWS models defini-tion of a crisis: namely, the devaluation of theTurkish lira in February 2001 and the devalua-tion of the Argentine peso in early January2002.
The predicted probabilities of crisis and cut-off probabilities for the IMF’s DCSD and KLRmodels before these episodes are shown inFigure 4.1. Both the DCSD and KLR CrisisSignals models correctly called for a crisis duringthe entire year preceding the Turkey crisis ofFebruary 2001. More precisely, both models cor-rectly called the Turkey crisis in respectively 19and 14 of the 24 months preceding the crisis.For the January 2002 crisis in Argentina, theDCSD model only started to signal problems inMarch 2001, when the run on the banks and for-eign exchange reserves began. By October 2001,the DCSD model still called the crisis but onlymarginally and after a counterfactual decline inthe probability of a foreign exchange crisis. The
CURRENT EWS MODELS AT THE IMF
51
4The FPI, a weighted average of three-month exchange rate and reserve changes, is similar to the “exchange marketpressure index” used in DCSD.
5A false alarm may not necessarily be bad if it signals real risks are eliminated through, for example, policy adjustments.6The corresponding number of false alarms as percent of total alarms are 74 percent and 94 percent (in-sample) and 87
percent and 96 percent (out-of-sample).
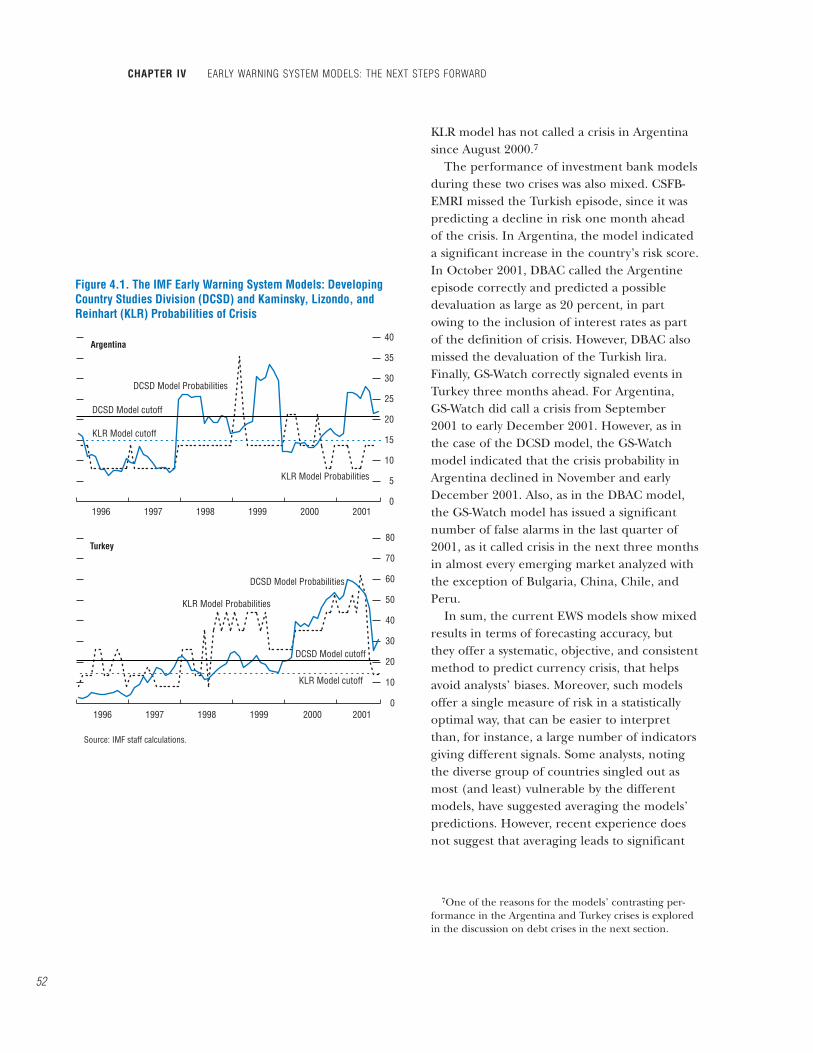
KLR model has not called a crisis in Argentinasince August 2000.7
The performance of investment bank modelsduring these two crises was also mixed. CSFB-EMRI missed the Turkish episode, since it waspredicting a decline in risk one month aheadof the crisis. In Argentina, the model indicateda significant increase in the country’s risk score.In October 2001, DBAC called the Argentineepisode correctly and predicted a possibledevaluation as large as 20 percent, in partowing to the inclusion of interest rates as partof the definition of crisis. However, DBAC alsomissed the devaluation of the Turkish lira.Finally, GS-Watch correctly signaled events inTurkey three months ahead. For Argentina,GS-Watch did call a crisis from September2001 to early December 2001. However, as inthe case of the DCSD model, the GS-Watchmodel indicated that the crisis probability inArgentina declined in November and earlyDecember 2001. Also, as in the DBAC model,the GS-Watch model has issued a significantnumber of false alarms in the last quarter of2001, as it called crisis in the next three monthsin almost every emerging market analyzed withthe exception of Bulgaria, China, Chile, andPeru.
In sum, the current EWS models show mixedresults in terms of forecasting accuracy, butthey offer a systematic, objective, and consistentmethod to predict currency crisis, that helpsavoid analysts’ biases. Moreover, such modelsoffer a single measure of risk in a statisticallyoptimal way, that can be easier to interpretthan, for instance, a large number of indicatorsgiving different signals. Some analysts, notingthe diverse group of countries singled out asmost (and least) vulnerable by the differentmodels, have suggested averaging the models’predictions. However, recent experience doesnot suggest that averaging leads to significant
CHAPTER IV EARLY WARNING SYSTEM MODELS: THE NEXT STEPS FORWARD
52
Figure 4.1. The IMF Early Warning System Models: Developing Country Studies Division (DCSD) and Kaminsky, Lizondo, and Reinhart (KLR) Probabilities of Crisis
Argentina
Source: IMF staff calculations.
0
5
10
15
20
25
30
35
40
200120001999199819971996
0
10
20
30
40
50
60
70
80
200120001999199819971996
Turkey
DCSD Model Probabilities
KLR Model Probabilities
DCSD Model cutoff
KLR Model cutoff
DCSD Model Probabilities
KLR Model Probabilities
DCSD Model cutoff
KLR Model cutoff
7One of the reasons for the models’ contrasting per-formance in the Argentina and Turkey crises is exploredin the discussion on debt crises in the next section.

improvements.8 As a result, the next section dis-cusses other avenues of improvement of EWSmodels.
EWS: A Way ForwardThe recent evaluations of the performance of
EWS models, as well as the experience withemerging markets crises around the turn of thecentury, suggest two potential avenues for in-creasing the usefulness of these models as sur-veillance tools. First, the different nature of re-cent financial crises suggests the desirability ofdeveloping a set of “building blocks” that wouldhelp forecast not only foreign exchange but alsodebt and banking crises, and identify the link-ages between them. Second, EWS models couldbe improved or augmented by a more efficientuse of the information embedded in forward-looking asset prices to anticipate financial mar-ket pressures. Although several crises took mar-ket participants by surprise, the increasingnumber of financial instruments available inemerging markets, combined with new tech-niques for extracting information from theprices of such instruments, suggest that thiscould be a fruitful avenue to pursue.9
Foreign Exchange Crises
Most of the existing EWS models omit the useof short-term interest rates as either a compo-
nent of the definition of a foreign exchange cri-sis or as a determinant of the crisis. Domestic in-terest rates could be included as an independentevent/equation along the lines of the DBACmodel, or they could be combined with ex-change rates in a more complete measure of “fi-nancial market pressures.” Similarly, excessivemoney or domestic credit creation is a key deter-minant of “first generation” foreign exchangecrises, but the lags in the availability of monetaryaggregates make them a less useful predictor ofsuch crises; interest rates could reflect moneymarket pressures in a more timely fashion.10
Stock market prices have some degree of pre-dictive power in all market models, as well as inKLR,11 and sectoral stock prices show promisingresults that are worth pursuing further. In partic-ular, Becker, Gelos, and Richards (2000) arguedthat sectoral differences in stock market per-formance may constitute valuable leading indica-tors of currency crises in emerging markets.Using company level data, the study indicatesthat around a year before the 1994–95 Mexicancurrency crisis net importers and financial com-panies began to continuously underperform themarket, while net exporters showed continuouslyhigh abnormal stock returns.
New methods to extract information aboutmarket expectations from derivative prices couldalso be used as part of an EWS. Traditionally, for-ward exchange rates have been used in the ma-ture markets to extract information about ex-
EWS: A WAY FORWARD
53
8See Forbes (2001). For example, the three most vulnerable countries in October 2001 were Malaysia, Israel, andMexico for CSFB-EMRI; Turkey, South Africa, and the Czech Republic for DBAC; and Poland, India, and Argentina forGS-Watch. Furthermore, on many occasions the models’ predictions of changes in the average vulnerability of emergingmarkets move in different directions. From February 2001 to August 2001, average vulnerability according to CSFB-EMRIincreased by 26 percent. In the same period, average vulnerability according to GS-Watch declined by 16 percent.
9The use of financial market data suggests that the definition of a crisis and the prediction horizon may have to be ad-justed to the shorter history and higher frequency of the data. Ideally, from the policymaker’s point of view, it would beoptimal to have indicators that signal a crisis several months or even years in advance. However, in the KLR model, all theindicators send their first crisis signal between a year and a year-and-a-half before the crisis erupts, and most of them givepersistent signals that grow in intensity as one approaches the crisis. It seems that not much would be lost by moving to a12-month horizon.
10First generation models of crises are driven by excessive domestic credit creation needed to finance budget deficits,while second generation models explain crises as the result of shifts in investors’ expectations whenever there is a conflictbetween a fixed exchange rate and other government objectives. Third generation models of crises emphasize financialfrictions (Krugman, 1999).
11Berg and Pattillo (1999) find that a rerun of the KLR model yields a noise-to-signal ratio greater than one for stockprices; this is in part due to a change in sample that removes some European countries and adds other emerging markets.

pected future spot rates.12 The proliferation ofoffshore nondeliverable forward markets foremerging market currencies, together with thedeepening of onshore markets in some coun-tries, increases the feasibility of applying thesemethods to emerging markets. For instance, asubstantial increase in the probability of devalua-tion of the Argentine peso was priced in the 12-month nondeliverable forward rates by lateJuly–early August 2001 (see Figure 4.2). Also, theexperience with the Korean won shows that oncerestrictions are removed and the market deep-ens, the offshore nondeliverable forward marketleads the domestic spot market—suggesting thatprice discovery happens primarily offshore andthat information from offshore markets could beused to predict onshore financial pressures(Park, 2001).
More recently, new techniques based on for-eign exchange option prices provide market ex-pectations on the whole risk-neutral probabilitydistribution of future exchange rates (seeSoderlind and Svensson, 1997; and Annex II ofIMF, 1997). Unlike traditional exchange rateforecasts that provide only a point estimate of themean of future exchange rates, option prices al-low for the derivation of the probabilities associ-ated with different ranges for the value of the un-derlying exchange rate. An example of thepotential usefulness of these techniques is pro-vided in Figure 4.3, which plots the probabilitydensity functions for the Brazilian real at differentdates in July, October, and December of 2001.13
CHAPTER IV EARLY WARNING SYSTEM MODELS: THE NEXT STEPS FORWARD
54
Figure 4.2. Forward Exchange Rates for Argentine Peso(Twelve-month Argentine peso per U.S. dollar nondeliverable forward exchange rate)
Source: IMF staff calculations based on data from Bloomberg L.P.
Jan. 13, 1999
0.9
1.0
1.1
1.2
1.3
1.4
1.5
1.6
1.7
1.8
Sept. 2001 Sept. 2000 Sept. 1999 Sept. 1998
Jul. 14, 1999
May 19, 2000
Oct. 30, 2000
Mar. 19, 2001
Aug. 2, 2001
12Although forward rates are generally biased predic-tors of future spot rates, they could be used together withsurvey expectations of exchange rates and other factorsthat explain systematic forecast errors in foreign ex-change markets (Lewis, 1995).
13While these methods have been applied mostly to ma-ture market currencies, Campa, Chang, and Refalo(1999) used them to study the credibility of the BrazilianReal Plan of 1994–97. The method used to derive theprobability density functions in Figure 4.3 differs from theones used in that paper and follows that suggested inMalz (1996). In both cases, these are risk-neutral proba-bility density functions, and there may be a bias derivedfrom the need to compensate risk averse investors(Breuer, 2002).

By the end of July, forward rates on theArgentine peso had increased sharply. The im-plied probability density function for the real onJuly 31, 2001, shows that markets underesti-mated somewhat the contagion effects fromArgentina. The Brazilian real exchange rate hit2.60 on September 10, 2001, a level that at theend of July was considered by market partici-pants to be likely with only a 2 percent probabil-ity. However, by mid-October, the implied proba-bility density function displayed negativeskewness, indicating the market was pricing cur-rency options as if it expected a reversal of thedepreciation of the real that had taken place be-tween the end of July and mid-October. Sincethe Argentine peso continued to trade in theforward market at a substantial discount fromspot, this suggests that market expected the realto decouple from the peso. The real did appreci-ate between mid-October and mid-December,and the December probability function shiftedto the left and its dispersion decreased.
Debt Crises
There have been important recent crises(such as in Pakistan and Argentina) in whichdebt crises occurred either without or well be-fore foreign exchange crises, and it may be thatpredicting debt crises is a worthwhile goal in andof itself. Recent research has highlighted therole of short-term external debt and rollover dif-ficulties during such crises (Detragiache andSpilimbergo, 2001). However, while the inclu-sion of short-term debt in an early warning sys-tem has improved the performance of the DCSDmodel relative to others, the changing nature ofcrises suggests that it may be too restrictive to fo-cus just on foreign exchange crises models. Inparticular, the short-term debt/reserves variableis a good indicator of liquidity problems, but it isnot necessarily a good predictor of external sol-vency crises. This point is illustrated in Figure4.4, which shows liquidity ratios, as well as debtservice ratios (a traditional determinant of coun-try risk) for Argentina, Turkey, and their peergroup. While Argentina had a good external
EWS: A WAY FORWARD
55
Figure 4.3. Spot Price and Implied Probability Density Functionfor the Brazilian Real
Spot Price: Brazilian Real per U.S Dollar.
Source: IMF staff estimates based on JP Morgan data and Bloomberg.
Implied Probability Density Functions for the Brazilian Real per U.S. Dollar: 90-Day Maturity, 2001
2.2
2.3
2.4
2.5
2.6
2.7
2.8
2.9
3.0
Jan.2002
Dec.Nov.Oct.Sept.Aug.July
0
2
4
6
8
10
3.232.82.62.42.221.8
Oct. 15
July 31Dec. 19
Strike Price
2001

liquidity position relative to Turkey, the country’sdebt-service indicator was more than twice thatof its peer group in 1999–2000. This reflected,and anticipated, the sovereign’s solvency prob-lems that would become more evident in 2001.
Traditional models of country (credit) riskand external solvency indices could be used aspart of an EWS for emerging market crises.14
An example of a country risk model is providedby Eichengreen and Mody (2000), who devel-oped an econometric model of the determinantsof emerging market debt spreads. The modelwas estimated for the years 1991–95 and pro-duced satisfactory out-of-sample forecasts for1996.15 The debt service to exports ratio is statis-tically significant in the regression,16 and has asample average of 0.20; Argentina’s figure for1999–2000 is more than three times that aver-age. An example of a model using external sol-vency indices is provided by Cohen (1991), whodevelops a simple solvency index that allows himto empirically assess whether or not indebted na-tions may have passed the point where theywould default on their debt-service obligations.
The above models could be complementedwith information on the term structure ofemerging market bond spreads as well as oncredit default swaps. The term structure of sover-eign yield spreads could reflect expectationsabout the probable timing of any default, and thepath of resolution and recovery of market ac-cess. In a recent study, Cunningham, Dixon, andHayes (2001) show that Argentina’s zero-couponspread curve was sharply inverted by the end ofJuly 2001 while the Brazilian curve was upward
CHAPTER IV EARLY WARNING SYSTEM MODELS: THE NEXT STEPS FORWARD
56
Figure 4.4. Argentina and Turkey: External Liquidity and Debt Service Ratios1
Liquidity Ratios
Sources: FitchResearch; and IMF staff estimates based on FitchResearch 1The figures for 2001 are FitchResearch estimates. Liquidity ratio is defined as official reserves incl. gold plus banks' foreign assets/debt service plus liquid external liabilities; debt service ratio is defined as debt service/current receipts; Argentina's peer group by December2000 included: Brazil, Colombia, Costa Rica, El Salvador, India, Kazakhstan, Lebanon, Panama, Peru, Philippines, Slovakia, Turkey, Venezuela.
0
10
20
30
40
50
60
70
80
200120001999199819971996
0
30
60
90
120
150TurkeyPeer GroupArgentina
200120001999199819971996
Debt Service Ratios
14Just as in the case of a balance of payments crisis, onewould need an operational definition of what constitutesa “debt” or “sustainability” crisis.
15Deviations of spreads from the levels predicted bycredit ratings could also signal the need for furtherscrutiny of a country’s fundamentals and market techni-cals, warning about potential reassessments of a country’screditworthiness (Sy, 2001).
16Other significant determinants of spreads includedfactors such as the ratio of external debt to GDP, debtreschedulings, maturity of the instruments, and the exis-tence of a private placement.

sloping, suggesting a heightened short-termcredit risk in Argentina that was somewhat—butnot totally—reduced after the June 2001 debtswap. The same pattern of curve inversion is in-dicated by default swap spreads: the differentialbetween 10-year and one-year Argentina defaultswap spreads became strongly negative in thesecond half of last year (Figure 4.5), implying ahigher short-term probability of default.Moreover, the differential is several times largerthan the similar negative differentials observedduring the Brazilian crises of 1998–99.
Recent experience has shown that temporarymarket closures (also referred to as “suddenstops” in capital inflows) have become a featureof international capital markets, and that thiscould increase the vulnerability of countries withrelatively large external financing needs. Marketclosures are systemic rather than country-specificevents that can be defined as the weeks when ag-gregate gross flows to all emerging markets arebelow 20 percent of average issuance levels (seeIMF, 2001b). While in some cases market clo-sures start with difficulties in a particular emerg-ing market, in others they are the result of con-ditions in mature markets that constrain thesupply of funds to the emerging market assetclass as a whole. Preliminary studies have shownthat mature market factors—such as the closurein the U.S. high-yield bond market and globalequity market volatility—increase the probabilityof closure for emerging market issuers. Moregenerally, studies show that factors like high U.S.interest rates and high-yield corporate bondspreads are associated with less issuance ofemerging market debt. At the same time, domes-tic emerging market factors, such as high localmarket returns and high debt amortizations, areassociated with higher issuance levels and lowerprobabilities of bond market closures (seeAnnex III of IMF, 2001a).
Banking Crises
Banking crises share several common determi-nants with foreign exchange crises, and aresometimes a main cause of an exchange crisis,
EWS: A WAY FORWARD
57
Figure 4.5. Slope of Default Swap Curve(Ten-year spread minus one-year spread, basis points)
Sources: IMF staff estimates based on JP Morgan data.
–4000
–3500
–3000
–2500
–2000
–1500
–1000
–500
0
500
1000
1998 1999 2000 2001
Argentina
Brazil

but recent efforts to predict banking crises havemet with limited success. Kaminsky and Reinhart(1999) and Kaminsky (1998) find that excessivecredit growth, recessions, and the burst of assetprice bubbles tend to precede banking crises.However, with the exception of stock marketprices, these variables (in particular, monetaryand credit aggregates) are available with rela-tively long lags in emerging markets. More im-portant, models that appropriately assign ahigher weight to type II errors for bankingcrises, had low predictive power relative to theAsian banking crises.17 Also, studies that look atindividual bank balance sheet indicators (seeGonzalez-Hermosillo, 1999), which could poten-tially identify problems in systemically importantbanks, find that loan quality and equity deterio-rate rapidly before a bank fails. However, thelack of consistent cross-country results and thescarcity and lack of timeliness of data on thesevariables in emerging markets make individualbank failure quite difficult to predict.18
Bank stock prices may provide useful predic-tive information, and while only some emergingmarkets banks are publicly traded, these are ingeneral the ones that would eventually cause sys-temic banking problems. Studies for the UnitedStates, for instance, show that stock prices helppredict the financial condition of individualbanks, even after taking into account past ratingand financial statement information (see Berger,Davies, and Flannery, 2000; and Gunther,Levonian, and Moore, 2001). There is no system-atic evidence for emerging markets, but Figure4.6 demonstrates the potential usefulness of for-ward-looking bank stock prices to predict bank-ing crises: the financial sector subcomponent of
CHAPTER IV EARLY WARNING SYSTEM MODELS: THE NEXT STEPS FORWARD
58
Figure 4.6. Korea: Financial Institutions Index (1991–2001)1
Source: Korea Stock Exchange. 1Sectoral index based on the set of financial companies in KOSPI of the Korea Stock Exchange. The thick solid line represents the average of the index through 05/30/96; the thin lines represent the corresponding standard deviation bands.
0
200
400
600
800
1000
1200
1400
01200099989796959493921991
3 Standard deviations
Thai baht devaluationJuly 2, 1997
Korea won weakeningOct. 23, 1997
First Day 3 Standard deviations below the average: Nov 20, 1996
1 Standard deviation
17Demirguc-Kunt and Detragiache (1999) stress that,the higher the cost of missing a crisis relative to the costof taking preventive action, the more concerned the poli-cymaker will be about type II errors relative to type Ierrors.
18The Financial Soundness Indicators (FSI) database,currently under construction in the IMF’s Monetary andExchange Affairs Department, could provide a useful in-put for a banking crises building block of an enhancedEWS.

Korea’s stock market index fell by more thanthree standard deviations almost a year beforethe onset of the foreign exchange crisis inKorea, a forewarning of potentially serious prob-lems in the banking system.
Banking crises are intimately linked to corpo-rate financial stress, and new tools developed toestimate forward-looking measures of credit riskof both banks and corporates could be used aspart of an EWS. These methods combine struc-tural models of default with standard portfoliotheory to assess the probability of extreme port-folio losses related to emerging market creditevents. Structural models of default rest on thepremise that a firm defaults on its debt when themarket value of assets falls below the book valueof its liabilities; viewing equity claims as a call op-tion on the underlying asset value allows for theuse of stock market prices to estimate market-based default probabilities.19 A preliminary ap-plication of these methods to selected emergingmarkets, using KMV LLC proprietary softwareand techniques (see Bohn and Chai, 2001), sug-gest that they are not only usable in emergingmarkets but also that they lead to results that theauthors regard as superior to those of economet-rically-fitted models given the problems with theavailability and quality of the data.
Financial Market Linkages
The development of separate “buildingblocks” for predicting foreign exchange, debt,and banking crises should take into account theclose links between financial markets, and thatone should be able to capture spillovers acrossbond, equity, and loan markets. Some of theselinkages are already incorporated into eachbuilding block, but others are more subtle andmay require a second stage of (joint) estimationand/or the use of scenario analyses. For exam-ple, Flood and Marion (2001) argue that study-
ing currency and banking crises either in isola-tion or in perfect correlation with each other isinappropriate, producing biased estimates of thelikelihood of crises. A key linkage between thetwo crises derives from the fact that governmentguarantees to depositors weaken the govern-ment’s ability to fulfill other guarantees, such asthat of maintaining a fixed exchange rate.Chang and Velasco (2000) relate bank and debtcrises by jointly modeling the behavior of domes-tic bank depositors and foreign debt creditors.Finally, Christiano, Gust, and Roldos (forthcom-ing) show how a foreign exchange crisis couldexacerbate the effects of a “sudden stop” in capi-tal inflows (i.e., a debt crisis), by reducing thevalue of domestic assets that could be used ascollateral in international credit markets.Although incorporating these linkages into ageneral EWS may be challenging, the insightscould be taken into account in scenarioanalyses.
Contagion and Cross-Country Linkages
Contagion measures are included in some ofthe investment bank EWS models, but the ad-hoc treatment in these models contrasts sharplywith the research on the issue. Traditional meas-ures of contagion compare sample correlationsamong asset returns of different countries dur-ing tranquil and crises periods (see, for exam-ple, IMF, 2001b). However, unconditionalcorrelations ignore the existence of interdepen-dencies, both through international trade and fi-nancial linkages across countries.20 There aretwo ways to overcome these limitations.
One approach is to assume that standard in-terdependencies are associated with small shocksto fundamentals whereas large crises and spo-radic shocks may generate panics and herdingbehavior unrelated to fundamentals. This ap-proach assumes that linkages across asset mar-
EWS: A WAY FORWARD
59
19These models are based on the work of Black and Scholes (1973) and Merton (1973).20Forbes and Rigobon (2001), and Corsetti, Pericoli, and Sbracia (2001) review the main issues in the measurement of
contagion.

CHAPTER IV EARLY WARNING SYSTEM MODELS: THE NEXT STEPS FORWARD
60
The major emerging market crises of the1990s were often associated with extensivespillover effects (contagion) across countriesand markets. Such contagion has been viewed asarising from trade linkages, financial linkages(such as a common lender), a “wake-up” callthat leads investors to reevaluate their view oncountries that are “similar” to the crisis coun-tries, and herding behavior.
The extent and pattern of contagion during acrisis has often been measured by examiningchanges in the level of correlation between fi-nancial variables in different markets and coun-tries such as bond spreads and equity returns.For example, in the aftermath of the Long-TermCapital Management (LTCM) debacle andRussian default in the fourth quarter of 1998,the correlations between equity markets jumpedupwards for all equity markets (see the firstFigure). In contrast, the continuing problemsfaced by Argentina during the last quarter of2001 did not affect stock markets in the regionsubstantially as witnessed by the decline in corre-lations (see Chapter II).
Although the changing pattern of correlationsprovides one indicator of contagion, these cor-relations do not directly measure the behaviorthat is more relevant during crisis periods,namely the degree to which large negative re-turns in one country or market are associatedwith large negative returns in another countryor market.1 Understanding how large shocks aretransmitted across markets, and characterizingthis transmission mechanism quantitatively is im-portant if the effects of small financial shocks inone country propagate to another country in a
different manner than large shocks. Indeed,large negative returns might have a higher levelof correlation across countries if their occur-rence leads investors to reevaluate the risks asso-ciated with investing in certain groups of coun-tries or classes of assets.
Recent developments in extreme value theory(EVT) have allowed for a more precise measureof what can be called “extreme correlation”—the likelihood that a large negative financialreturn in one country is accompanied by alarge negative return in another country. Toderive this extreme correlation, one needs firstto specify what constitutes a “large” or extremenegative return. In many studies, the criteriahas been to focus on the bottom 5 percent ofthe negative returns over a specified sampleperiod.2 Given this criteria, one can show thatthe univariate distribution of extreme returnsis well captured by the class of generalizedPareto distributions, and that the degree ofextreme correlation between two series of
Box 4.2. Alternative Measures of Contagion
1 Indeed, simple Pearson correlations can be decep-tive when studying the comovements between largenegative returns in two markets. For example, for adata sample obtained from a bivariate normal distribu-tion with constant correlation coefficient, the correla-tion of the subsample including large returns is higherthan the correlation of the subsample including smallreturns (Boyer, Gibson, and Loretan, 1997, andEmbrechts, McNeil, and Straumann, 1999). Therefore,an increase in correlation does not necessarily identifya contagion episode.
2More sophisticated methods can be used todetermine the threshold value that determineswhether returns are extreme or not. See Longinand Solnik (2001); and Poon, Rokinger, and Tawn(2001).
Correlation of Daily Equity Returns During Russian Crisis and Long-Term Capital Management Failure1
0.2
0.4
0.6
0.8
1.0
Jan.99
Dec.Nov.Oct.Sept.Aug.July
Argentina-Brazil
Argentina-Chile
Argentina-Mexico
Brazil-Chile
Brazil-Mexico
1998

EWS: A WAY FORWARD
61
returns is given by the so-called Chi depend-ence measure, χ.3
The dependence measure χ can be roughly re-garded as the conditional probability that, whena return in one market is the lower say 5 percentof all its outcomes, the other return will also bein the lower 5 percent of its outcomes. A highervalue of χ implies an increasing likelihood thatlarge negative returns in one market will be asso-ciated with large negative returns in the other.
While the value of χ can be examined duringany given period to measure the degree of conta-gion as represented by the extreme correlationof asset returns, one can also consider how thevalue of χ has evolved over time to see if the de-gree of contagion has been rising or falling. Asan example, the second figure portrays the evo-lution of the average χ values for a number ofLatin American countries during the 1990s.Using weekly returns on stock indices over a 15-year period between December 31, 1987 andOctober 25, 2001, the extreme correlation meas-ure is estimated for the bottom 5 percent of thenegative returns using five-year rolling windows.4
A number of results stand out. First, there hasbeen a secular increase in the values of the χthroughout the 1990s. Second, the values of χbecome statistically different from zero (at the 5percent level of confidence) only in the periodsince the Russian crisis of late 1998 (see Chan-Lau, Mathieson, and Yao, 2002). These resultssuggest that, for at least the Latin American
economies included in the sample, a largenegative return in the equity market in onecountry has become increasingly likely to be as-sociated with large negative outcomes in theother markets. The reasons for this secular in-crease in the extreme correlation between theLatin American markets are as yet not fully un-derstood. One possibility is that the nature of theinvestor base for Latin American equities haschanged over the course of the 1990s, with so-called “crossover” investors playing an increas-ingly important role.5 Such investors will place arelatively small fraction of large portfolios inemerging market investments if they expectthem to offer an attractive return. However,since the benchmarks used to evaluate the per-formance of portfolio managers of crossover in-vestors typically do not encompass emergingmarket assets, they can abruptly reduce or elimi-nate their holdings of emerging market assets ifthe outlook for emerging markets deteriorates orif managers become more risk adverse and seeklower overall volatility of their holdings.
3See Coles, Heffernan, and Tawn (1999). If x and yare two series of returns on equities, the
log Pr[Fx(–x) > u, Fy(–y) > u]χ = limu→12 – ––––––––––––––––––––––––––
log u
where u is the threshold value whose exceedance de-fines large returns, i.e. u = 1 – 0.05 = 0.95 for the bot-tom 5 percent negative returns, Pr(i, j) is the jointprobability of i and j occurring, and Fx, Fy are the cu-mulative marginal density functions of x and y.
4The temporal behavior of χ is virtually the same ifone starts with an initial five-year window and incremen-tally adds weekly observations until the full sample is uti-lized. These results and calculation of extreme correla-tions for emerging markets and for mature markets arediscussed in Chan-Lau, Mathieson, and Yao (2002).
5Such investors would include large mature marketsinstitutional investors such as pension funds and insur-ance companies.
Average Extreme Correlations (χ) of Weekly Equity Returns for Selected Latin American Countries1
Source: IMF staff calculations based on data from Primark Datastream LLC. 1Average of five-year rolling windows for estimates of χ for the following country pairs: Argentina-Brazil, Argentina-Chile, Argentina-Mexico, Brazil-Chile, and Brazil-Mexico.
0
0.1
0.2
0.3
0.4
0.5
0.6
0.7
0.8
0120009998979695941993

kets in periods of stress can be characterized bymeans of a measure derived from extreme valuetheory, one that captures the dependence orcorrelation between the extreme values of re-turns (or the tails of the distribution of returns).The approach allows for the derivation of theprobability that a crisis occurs in one country,conditional on a crisis happening in anotherone. Estimates for the G-5 countries suggest thatsimultaneous crashes in stock markets are abouttwo times more likely than in bond markets(Hartmann, Straetmans, and de Vries, 2001). Arecent application of these techniques to emerg-ing markets (Box 4.2) suggests that the intensityof stock market linkages during crises periods inLatin America has increased in recent years, aphenomenon that could be explained by shiftsin the investors base holding emerging marketassets.
Another approach estimates the empirical rel-evance of the different channels of transmissionof shocks across countries and argues that onlythe unexplained residual correlation across re-turns should be regarded as contagion. For ex-ample, Kaminsky and Reinhart (2000) examinethe role of international bank lending, the po-tential for cross-market hedging, and interna-tional trade in the transmission of crises acrosscountries. The authors conclude that contagionis more regional than global, and that, althoughit is sometimes difficult to distinguish betweenchannels, financial sector linkages appear to im-prove forecasting performance relatively morethan trade linkages. Also, they claim that eventhough these estimates reflect past contagion, tothe extent that current cross-hedging strategiesuse historical correlations, they could be a goodforecast of future contagion. The incorporationof these linkages to an EWS should take into ac-count the evolving nature of the investor basefor emerging market instruments in order to as-sess potential changes in the relative importanceof different channels. For instance, the changein investor behavior toward sectoral (rather thancountry) allocations is likely to have changed thenature of cross-country equity marketcorrelations.
ConclusionGoing forward, EWS models will continue to
be one element in the IMF’s multilateral surveil-lance activities. To enhance the usefulness ofthese models, the IMF staff will focus on incor-porating more information from forward-look-ing asset prices as well as developing “buildingblocks” for the prediction of foreign exchange,debt, and banking crises. In addition, there willbe further analyses of the determinants of theextent and scope of contagion during crises.The IMF staff will report periodically on theprogress made in developing these additionaltools of analysis.
ReferencesAdes, Alberto, Rumi Masih, and Daniel Tenengauzer,
1998, “GS-Watch: A New Framework for PredictingFinancial Crises in Emerging Markets,” EmergingMarkets Economic Research, (New York: GoldmanSachs, December).
Becker, Torbjorn, Gaston Gelos, and AnthonyRichards, 2000, “Devaluation Expectations and theStock Market: The Case of Mexico in 1994–95,” IMFWorking Paper No. 00/28 (Washington:International Monetary Fund).
Berg, Andrew, and Catherine Pattillo, 1999, “AreCurrency Crises Predictable? A Test,” IMF StaffPapers, International Monetary Fund, Vol. 46, pp.107–38.
Berg, Andrew, Eduardo Borensztein, Gian MariaMilesi-Ferretti, and Catherine Pattillo, 1999,“Anticipating Balance of Payments Crises—TheRole of Early Warning Systems,” IMF OccasionalPaper No. 186 (Washington: InternationalMonetary Fund).
Berg, Andrew, Eduardo Borensztein, and CatherinePattillo, 2001, “Assessing Early Warning Systems:How Have They Worked in Practice?” (unpub-lished; Washington: International Monetary Fund).
Berger, Allen N., Sally M. Davies, and Mark J.Flannery, 2000, “Comparing Market andSupervisory Assessments of Bank Performance:Who Knows What When?” Journal of Money, Credit,and Banking, Vol., 32 (August), pp. 641–67.
Black, Fisher, and Myron Scholes, 1973, “The Pricingof Options and Corporate Liabilities,” Journal ofPolitical Economy, Vol. 81 (May–June), pp. 637–59.
CHAPTER IV EARLY WARNING SYSTEM MODELS: THE NEXT STEPS FORWARD
62

Bohn, Jeffrey, and Jingqing Chai, 2001, “SharpeningCredit-Portfolio Risk Analysis in Emerging Asia,”(unpublished; KMV LLC).
Boyer, Brian H., Michael Gibson, and Mico Loretan,1997, “Pitfalls in Tests for Changes in Correlations,”International Finance Discussion Paper No. 597(Washington: Board of Governors of the FederalReserve).
Breuer, Peter, 2002, “How Does the Volatility RiskPremium Affect the Informational Content ofCurrency Options?” (unpublished; Washington:International Monetary Fund).
Campa, José, Kevin Chang, and James Refalo, 1999,“An Options-Based Analysis of Emerging MarketExchange Rate Expectations: Brazil’s Real Plan,1994–1997,” NBER Working Paper No. 6929(Cambridge, Massachusetts: National Bureau ofEconomic Research).
Chang, Roberto, and Andrés Velasco, 2000, “Banks,Debt Maturity and Financial Crises,” Journal ofInternational Economics, Vol. 51(June), pp. 169–94.
Chan-Lau, Jorge A., Donald Mathieson, and JamesYudong Yao, 2002, “Extreme Contagion acrossEquity Markets,” (unpublished; Washington:International Monetary Fund).
Christiano, Lawrence, Chris Gust, and Jorge Roldós,forthcoming, “Monetary Policy in a FinancialCrisis,” Journal of Economic Theory.
Cohen, Daniel, 1991, Private Lending to Sovereign States:A Theoretical Autopsy (Cambridge, Massachusetts:MIT Press).
Coles, Stuart, Janet Heffernan, and Jonathan Tawn,1999, “Dependence Measures for Extreme ValueAnalyses,” Extremes 2, pp. 339–65.
Corsetti, Giancarlo, Marcello Pericoli, and MassimoSbracia, 2001, “Correlation Analysis of FinancialContagion: What You Should Know Before Running a Test,” (unpublished).
Cunningham, Alastair, Liz Dixon, and Simon Hayes,2001, “Analysing Yield Spreads on Emerging Market Sovereign Bonds,” in Financial StabilityReview, Issue No. 11 (London: Bank of England).
de Faria, Jose Carlos, 2001, “The UnbearableLightness of the Real,” Deutsche Bank GlobalMarkets Research (October).
Demirguc-Kunt, Asli, and Enrica Detragiache, 1999,“Monitoring Banking Sector Fragility: AMultivariate Logit Approach,” IMF Working PaperNo. 99/147 (Washington: International MonetaryFund).
Detragiache, Enrica, and Antonio Spilimbergo, 2001,“Crises and Liquidity: Evidence and Interpretation,”IMF Working Paper 01/2 (Washington:International Monetary Fund).
Eichengreen, Barry, and Ashoka Mody, 2000, “WhatExplains Changing Spreads on Emerging MarketDebt: Fundamentals or Market Sentiment?” inCapital Flows and the Emerging Economies: Theory,Evidence, and Controversies, ed. by Sebastian Edwards(Chicago: University of Chicago Press).
Embrechts, Paul, Alexander McNeil, and DanielStraumann, 1999, “Correlation: Pitfalls andAlternatives,” Risk (May), pp. 69–71.
Flood, Robert, and Nancy Marion, 2001, “A Model ofthe Joint Distribution of Banking and ExchangeRate Crises,” IMF Working Paper No. 01/213(Washington: International Monetary Fund).
Forbes, Kristin J., 2001, Anticipating Crises: ModelBehavior or Stampeding Herds, presentation at theIMF Economic Forum (November).
———, and Roberto Rigobon, 2001, “MeasuringContagion: Conceptual and Empirical Issues,” inInternational Financial Contagion, ed. by StijnClaessens and Kristin J. Forbes (Boston: KluwerAcademic Publishers).
Garber, Peter M., Robin L. Lumsdaine, and PaoloLongato, 2001, “Deutsche Bank Alarm Clock:Descriptive Manual Version 3,” Global MarketsResearch (London: Deutsche Bank, October).
Gonzalez-Hermosillo, Brenda, 1999, “Determinants ofEx-Ante Banking System Distress: A Macro-MicroEmpirical Exploration of Some Recent Episodes,”IMF Working Paper No. 99/33 (Washington:International Monetary Fund).
Gunther, Jeffrey W., Mark E. Levonian, and Robert R.Moore, 2001, “Can the Stock Market Tell BankSupervisors Anything They Don’t Already know?”Economic and Financial Review, Federal Reserve Bankof Dallas, Second Quarter.
Hartman, Philipp, Stefan Straetmans, and Casper G.de Vries, 2001, “Asset Market Linkages in CrisisPeriods,” CEPR Discussion Paper Series No. 2916(London: Centre for Economic Policy Research).
International Monetary Fund, 1997, InternationalCapital Markets: Developments, Prospects, and Key PolicyIssues, World Economic and Financial Surveys,Annex II (Washington, November).
———, 2001a, International Capital Markets:Developments, Prospects, and Key Policy Issues, WorldEconomic and Financial Surveys, (Washington,August).
REFERENCES
63

———, 2001b, Emerging Market Financing, May issue,available on the Internet at http://www.imf.org/external/pubs/ft/emf/index.htm.
Kaminsky, Graciela, Saúl Lizondo, and Carmen M.Reinhart, 1998, “Leading Indicators of CurrencyCrises,” Staff Papers, International Monetary Fund,Vol. 45, pp. 1–48.
Kaminsky, Graciela, 1998, “Currency and BankingCrises: The Early Warnings of Distress,”International Finance Discussion Paper No. 629(Washington: International Monetary Fund).
———, and Carmen Reinhart, 1999, “The Twin Crisis:The Causes of Banking and Balance-of-PaymentsProblems,” American Economic Review, Vol. 89 (June),pp. 473–500.
———, 2000, “On Crises, Contagion, and Confusion,”Journal of International Economics, Vol. 51 (June), pp.145–68.
Kell, Michael, and Axel Schimmelpfennig, 2002,“Fiscal Indicators in an EWS—Some EmpiricalResults,” (unpublished; Washington: InternationalMonetary Fund).
Krugman, Paul, 1999, “Balance Sheets, the TransferProblem, and Financial Crises,” in InternationalFinance and Financial Crises—Essays in Honor of RobertP. Flood, Jr. (London: Kluwer Academic Publishers;Washington: International Monetary Fund).
Lewis, Karen, 1995, “Puzzles in International FinancialMarkets,” Chapter 37 in Grossman and Rogoff, eds.,Handbook of International Economics, Vol. III, (ElsevierScience).
Longin, Francois, and Bruno Solnik, 2001, “ExtremeCorrelation of International Equity Markets,”Journal of Finance, Vol. 56 (April), pp. 649–76.
Malz, Allan, 1996, “Options-based Estimates of theProbability Distribution of Exchange Rates andCurrency Excess Returns” (unpublished; New York:Federal Reserve Bank).
Merton, R.C., 1973, “Theory of Rational OptionPricing,” Bell Journal of Economics and ManagementScience 4, Spring, 141–83.
Mulder, Christian, Roberto Perrelli, and ManuelRocha, forthcoming, “The Role of Corporate,Legal and Macro Balance Sheet Indicators inCrisis Detection and Prevention,” IMF WorkingPaper (Washington: International Monetary Fund).
Park, Jinwoo, 2001, “Information Flows between Non-deliverable Forward (NDF) and Spot Markets:Evidence from Korean Currency,” Pacific-BasinFinance Journal, Vol. 9 (August), pp. 363–77.
Poon, Ser-Huang, Michael Rockinger, and JonathanTawn, 2001, “New Extreme-Value DependenceMeasures and Finance Applications,” CEPRDiscussion Paper No. 2762 (London: Centre forEconomic Policy Research).
Roy, Amlan, 2001, “Emerging Markets Risk Indicator(EMRI),” Global Emerging Markets Strategy (London:Credit Suisse First Bank, February).
Soderlind, Paul, and Lars Svensson, 1997, “NewTechniques to Extract Market Expectations fromFinancial Instruments,” Journal of MonetaryEconomics, Vol. 40 (October), pp. 383–429.
Sy, Amadou, 2001, “Emerging Market Bond Spreadsand Sovereign Credit Ratings: Reconciling MarketView with Economic Fundamentals,” IMF WorkingPaper No. 01/165 (Washington: InternationalMonetary Fund).
CHAPTER IV EARLY WARNING SYSTEM MODELS: THE NEXT STEPS FORWARD
64

Over the past several years, emergingmarket borrowers have used a numberof debt instruments, many of whichembody innovative features, to main-
tain access to global capital markets and bettermanage their debt through risk diversification.While emerging market borrowers are quitelikely to make use of alternative debt instru-ments1 at times of relative tranquility, the needfor their use may increase at times of market tur-bulence or financial stress, when investor ap-petite for emerging market debt diminishes andcosts of borrowing rise. In these circumstances,emerging market countries must maintain soundeconomic policies, both to signal their commit-ment to economic reform and adjustmentand/or to differentiate themselves from thecountries in crisis and limit the potential dam-age from contagion. Notwithstanding the adop-tion of those policies, to meet their financingneeds and maintain access to capital markets,sovereigns could face the daunting task of issu-ing debt that on the one hand appeals to in-vestors, but that on the other avoids lockingthemselves into high debt-service costs for pro-longed periods of time and creating inflexibledebt structures that could exacerbate futurecrises and have implications for financial stabil-ity, more generally.
It is evident from Table 5.1 that over the pastseveral years, in addition to reopening and aug-
menting existing debt issues, emerging marketsovereigns sought to reduce borrowing costs andextend the maturity of debt instruments throughthe use of collateral, warrants, and a greater re-liance on derivatives—all common features inmature financial markets, but less common inthe sovereign emerging market debt context.2
More recently, some of these instruments havebeen used less frequently, while others remain incommon use.
While the role of alternative debt instrumentsin international finance and their implicationsfor the new financial architecture have been dis-cussed in earlier IMF studies, not much atten-tion has been paid to comparing the relativemerits of these instruments in enabling emerg-ing market sovereigns to access capital marketsor diversify risk on a sustained basis and the con-cerns they may raise for the management of sov-ereign debt, crisis resolution, and the function-ing of emerging markets.3,4
This chapter focuses on the alternative debtinstruments used by emerging market sovereignsto access capital markets from 1997 through2001, a period marked by a number of financialcrises. It examines the potential for conflict be-tween a sovereign’s desire to maintain access tocapital markets and the principles of sound debtmanagement practices recognized and endorsedby the international community. In particular,the analysis addresses the following questions:
65
CHAPTER VALTERNATIVE FINANCIAL INSTRUMENTS AND ACCESSTO CAPITAL MARKETS
1The term alternative financial instruments is broadly defined to capture various debt instruments (bonds and loans)other than new “plain vanilla” bonds and regular (unenhanced) loan issues used by emerging market sovereigns.
2The analysis focuses on sovereign borrowing (including the public sector) since the discussion of the role of innova-tions is intertwined with issues relating to sovereign debt management strategy and private sector involvement in the reso-lution of crises.
3See the IMF’s “Involving the Private Sector in Forestalling and Resolving Financial Crises—Background Paper,” avail-able at http://www.imf.org/external/pubs/ft/series/01/index.htm
4A key conclusion that has emerged from earlier discussions of the role of alternative debt instruments is that there is apotential for greater risk shifting, but at the same time, a concern that such instruments could burden emerging marketsovereigns with an excessively rigid debt structure—an issue that comes back to haunt when the sovereign faces a financialcrisis.

• What kinds of alternative instruments havebeen introduced, and what impact do theyhave on sovereign borrowing costs and on en-abling access to capital markets on terms con-sistent with medium-term viability?
• Is the use of various alternative debt instru-ments consistent with sound debt manage-ment practices or does it merely push risksand problems to the future?
• Are these techniques consistent with efforts ofthe international community to involve theprivate sector in crisis resolution, both interms of the private sector maintaining expo-sure to a country at times of crises and interms of creating flexible debt structures?
Alternative Financial Instruments: WhatAre They and How Do They Work?
Financial market turbulence or financial stressis typically characterized by a loss of investor ap-petite for emerging market debt and higher bor-rowing costs for some or all of the following rea-sons: (1) reduced liquidity in secondary marketsfor emerging market debt; (2) higher risk pre-miums that (temporarily) push up borrowingcosts; (3) a rise in the perceived risk of defaultby sovereign borrowers; (4) increase in marketuncertainty, including from risks of contagion;(5) increased risk aversion among investors; and(6) increased uncertainty about future prospectsof the sovereign borrower.
CHAPTER V ALTERNATIVE FINANCIAL INSTRUMENTS AND ACCESS TO CAPITAL MARKETS
66
Table 5.1. Emerging Market Sovereign Bond and Loan Issues by Type(In millions of U.S. dollars, unless otherwise specified)
1997 1998 1999 2000 2001_________________ _________________ ________________ ________________ ________________Jan–June July–Dec Jan–June July–Dec Jan–June July–Dec Jan–June July–Dec Jan–June July–Dec
Regular 34,839 28,818 41,659 15,404 21,995 14,773 29,247 14,588 21,211 12,953of which loans 9,646 7,200 20,739 7,805 7,809 2,233 4,325 2,333 2,453 3,654number of transactions1 158 119 132 58 64 58 80 45 51 44
Augmentations 9,139 5,093 8,338 2,830 10,908 6,126 6,777 5,584 8,891 7,178number of transactions 9 8 17 15 26 24 14 14 19 19
Step-down . . . 1,672 3,286 416 938 . . . . . . . . . . . . . . .number of transactions . . . 5 8 2 3 . . . . . . . . . . . . . . .
Step-up 300 405 564 . . . 162 . . . . . . . . . . . . . . .number of transactions 1 1 1 . . . 1 . . . . . . . . . . . . . . .
Calls 2,547 1,044 150 1,550 33 100 1,120 310 300 . . .of which loans . . . 110 . . . 50 . . . . . . . . . 185 . . . . . .number of transactions1 10 8 1 3 1 2 4 7 1 . . .
Puts 2,742 310 2,695 1,369 1,233 1,310 80 1,215 . . . 2,062of which loans 445 110 195 163 . . . 94 80 185 . . . . . .number of transactions1 17 5 4 8 4 8 1 6 . . . 3
Warrants . . . . . . . . . 1,000 2,500 . . . . . . . . . . . . **2
number of transactions . . . . . . . . . 1 3 . . . . . . . . . . . . 1
Structured notes3 . . . 1,000 1,750 905 . . . . . . . . . . . . . . . . . .number of transactions . . . 2 2 3 . . . . . . . . . . . . . . . . . .
Collateralized 7,059 5,433 3,042 5,610 1,016 1,939 3,247 860 970 530of which loans 6,700 5,233 2,942 3,110 93 1,261 3,247 860 970 530number of transactions1 26 31 22 11 6 9 11 6 6 3
Total 56,626 43,775 61,484 29,083 38,785 24,247 40,471 22,557 31,372 24,041of which loans 16,792 12,653 23,876 11,128 7,902 3,589 7,652 3,562 3,423 4,184
Sources: Bondware and Loanware.Note: Includes all countries covered by the EMBI Global Index and covers issuance by all forms of government and the public sector. 1Includes bonds and loans.2Panama issued warrants in the context of retiring/swapping some debt maturing in 2002.3Owing to the non-transparency associated with structured notes, coverage may be incomplete.

In such circumstances, emerging market bor-rowers often have adjusted their debt manage-ment strategies, and have made use of debt in-struments, embodying innovative features, tomaintain access to capital markets and diversifyrisks (Table 5.2).5 The alternative debt instru-ments—which include debt augmentation, timevarying and state contingent instruments, struc-tured notes, and collateralized borrowing—seekto mitigate one or more of the above concernsby changing the nature of the debt instrument,its payoff, as well the commitment of the sover-
eign borrower to meet its debt obligations. Theuse of such instruments could, however, also beundertaken at times of relative tranquility pro-vided they are consistent with the overarchingand constant goals of improving fundamentalsand sound debt management and build credibil-ity with markets.
Augmentations
Sovereign borrowers have become increas-ingly aware of the importance of well function-
ALTERNATIVE FINANCIAL INSTRUMENTS: WHAT ARE THEY AND HOW DO THEY WORK?
67
Table 5.2. Market Conditions and Alternative Financial Instruments
Alternative Financial Financial Market Conditions Instruments Advantages Disadvantages
Diminished or uncertain Augmentation: use of Builds large fungible issues that Bond covenants need to secondary market liquidity. techniques for reopening of promote secondary market accommodate reopenings.Reduced demand for new existing issues. liquidity. If too large, may impact overall issuance. Allows sovereign to issue in yield curve and spread of all
smaller increments and to do outstanding issues.so more seamlessly.
Higher risk premiums that Time varying instruments: Sovereign can issue instruments Provides investors with an upside (temporarily) push up interest Step-up and step-downs: with longer maturity without potential reflected in higher rate costs for the borrower. allow the sovereign to shape locking in high short-term rates. average coupon rates.
present and future cash flows differently.
Markets have different State contingent instruments: Sovereign can reduce borrowing Difficulty in pricing.expectations (too pessimistic) Includes options and warrants. costs by providing insurance to Relatively high market premium.compared to fundamental investors against adverse outlook of the authorities. outcomes. Puts—the exercise by investors
may compound the difficulties ofdebt managers in adverseoutcomes.
Market spreads may be Structured notes: includes Allow the sovereign to hedge Tend to be complex and may be volatile or out of line with fixed income instruments market outcome risk or to difficult to price efficiently.medium run trends. linked to derivatives, such as provide a payoff to investors
swaps, caps, floors, and based on future economic Nontransparent.
futures. conditions. Need to be set into a sophisticatedrisk management strategy to avoiddebt management risks.
Rise in the perceived risk Collateralized instruments: Reduce spreads and improve May result in rise in spreads of of default by sovereign including instruments that rating of instrument. uncollateralized instruments by borrowers. borrow against future flows. Could potentially provide subordinating existing
significant market access when instruments.uncertainty is overwhelming and Inflexibility could complicate debt restricts other forms of market management.access. Could run counter to efforts to
secure private sector involvementin crisis resolution.
5Risk diversification refers to linking debt-service costs to the underlying ability to pay.

ing secondary markets for their debt instru-ments. Liquidity of these markets can be im-proved through a practice of building large fun-gible issues along the yield curve by reopeningand expanding existing debt, often termed “aug-mentation.” Reopening and expanding an exist-ing issue with which investors are already famil-iar makes the existing stock of bonds moreliquid—by widening the number of investors ina single issue, opportunities for secondary mar-ket transactions increase. It also makes it morelikely that the larger bond stock will be includedas a benchmark in several emerging market in-dices, thereby increasing the potential universeof portfolio investors. Liquid secondary markets,in turn, provide issuers with a benchmark forpricing new issues.
Augmentation offers advantages that areparticularly useful in times of financial marketturbulence. With reduced demand for new in-struments in such circumstances, augmentationallows the sovereign to access capital marketsin smaller amounts and across a series of bonds(as compared to a single large-size issue), help-ing the issuance to be more easily absorbedinto the market and with minimum disruption(existing issues are already aligned with marketconditions).6 Furthermore, augmentations canalso be used to maintain liquid markets whenshortages of a particular bond series arise owingto a technical market squeeze by short sellers.7
Reflecting these advantages, data presented inTable 5.1 show increasing use of augmentation,rising up from a share of only one-fifth in 1997,to more than one-third of all bond issuance in1999 and 2001, suggesting that augmentation
has been usefully deployed to maintain marketaccess during difficult periods.8,9
Augmentations are not, however, without limi-tations. In particular, augmentations, like allbond issuance, dilute the claims of previousholders of the bond, and may put pressure onsecondary market bond prices, increasing thespreads and cost of issuance and potentially dis-rupting secondary markets. Investors sometimesdemand explicit protection against such risks, in-cluding by embedding rules in bond contracts toprotect primary market buyers of bonded debt—such as by ensuring that augmentations takeplace when prices are close to par. In othercases, investors might require an additional pre-mium ex ante to allow for future augmentation,which in turn could bear upon sovereign debtmanagement strategy.10
Time-Varying Instruments
These include instruments in which couponpayments change over time.
Step-ups and Step-downs
In the period from 1997 through 1999, sev-eral key emerging market sovereigns issuedbonds that included a step-down or step-up fea-ture, where coupon payments are higher(lower) for a short initial time period, but thendecrease (increase) over the medium to longterm.11 Table 5.1 shows that the issuance of step-downs increased during the Asian crisis andpeaked during the first half of 1998—owing inlarge part to the issuance prior to the creationof the Euro by Argentina, and to a lesser extent,
CHAPTER V ALTERNATIVE FINANCIAL INSTRUMENTS AND ACCESS TO CAPITAL MARKETS
68
6Recently, South Africa augmented by $250 million one of its global bonds—in the wake of pressures on the Rand, onecould interpret this as a “testing of the waters” for market access.
7Augmentations of this sort, which Argentina and others have used, are called “reverse inquiries.”8EMBI spreads increased sharply in 1999 to average 1,032 basis points, while in 2001, spreads averaged 890 basis points.9Reflecting some of the benefits accruing from a well-developed yield curve, there has been a proliferation of augmenta-
tions of debt denominated in U.S. dollars relative to debt denominated in other currencies.10For augmentations to be viable, some minimum number of bonds of an appropriate maturity need to be outstanding,
while the bond documentation needs to incorporate a tap feature that allows the size of the issue to be increased at thediscretion of the debtor.
11A bond can have several steps (e.g., some older Brady bonds had numerous steps). However, the recent sovereignemerging market bonds generally have only one step.

Brazil, Venezuela, and Turkey, of bonds in vari-ous Euro-11 currencies and at coupons that hadstep-down features that would merge into onehighly liquid euro-denominated benchmark—before declining following the onset of theRussia crisis.
The motivation for step-downs is that itallows debt instruments with initially highcoupons, reflecting existing market conditions,to converge to the yields being paid on alreadyexisting sovereign debt. By doing so, the instru-ment usually becomes fungible with anotherbond issue and the two are traded as one.Thus, the issue achieves the benefits of longer-term borrowing and enhanced liquidity, whileavoiding locking the borrower into continuoushigh debt-service costs after the market hasreturned to more normal conditions. Despitethe potential benefits, a limitation of the step-down feature is that it is considerably less flexi-ble than a bond with an embedded call option(discussed below), because if the coupon ratethat it steps down to is higher than the prevail-ing market rate at that future point in time, theissuer might find the initial choice less thanoptimal.
In contrast to step-downs, an embedded step-up feature in a bond reflects the willingness ofthe market to accept the sovereign’s belief thateconomic prospects will improve over time,thereby improving the ability of the sovereign toservice its debt. The cash-flow relief initiallycould help the borrower to put its house in or-der to ensure economic stability and growth. Inthis way, a step-up bond has positive risk diversifi-cation features. Step-up bonds are, in general,instruments with a long duration, and may ap-peal more to certain classes of investors whohave a longer investment horizon. That said, thestep-up feature in bond contracts have remainedrare in recent new issuance, although Argentinaused this feature in the context of a voluntarydebt swap in June 2001.
State-Contingent Instruments
These include instruments in which the pay-ments depend upon future economic and/ormarket conditions.
Options
A call option would normally be reflected as acovenant in the bond or loan contract, statingthat on a certain date (or dates) prior to the ma-turity date of the instrument, at the discretion ofthe issuer, the debt can be redeemed at par. Thecall option provides an important advantage tothe issuer by allowing the possibility to refinanceat a substantially lower rate, if market conditionsimprove. Consequently, it is able to capture thebenefits of improved economic conditions with-out taking on additional funding risks (as wouldbe the case for put options exercisable at the dis-cretion of the creditor). In return, however, theholder (the seller of the call option) will de-mand a higher yield, both because he is exposedto reinvestment risk pertaining to the principaland because the price appreciation potential fora callable bond is restricted. Furthermore, incertain cases, the call option, by making the in-strument more complex or less easily tradable,will require an additional premium on liquiditygrounds. Call options are particularly attractivewhen there exists asymmetric risk preferenceand information, because of which the marketand the issuer disagree about the likely futurepath of the sovereign’s borrowing cost.
Notwithstanding the apparent advantages ofthe instrument, they have not proved popular inthe pure sovereign context since the onset of theAsian crisis and the last use of the instrumentwas in the second half of 1998.12 Arguably, diffi-culties in pricing the options efficiently to reflecttheir true value have deterred sovereigns fromadopting this technique to access capital mar-kets. It is also quite likely that market perceptionof a significant likelihood of a call option em-bedded in a new instrument issued at times of
ALTERNATIVE FINANCIAL INSTRUMENTS: WHAT ARE THEY AND HOW DO THEY WORK?
69
12Refers to borrowing solely by the central government. They continue to be used, however, by quasi-sovereignborrowers.
stress being exercised would lead investors toseek a large upfront premium that borrowers areunwilling to pay, thereby leading to a decline intheir overall use.
In contrast to a call option, a put option in abond or loan contract would provide the credi-tor with the right, but not the obligation, to re-deem the debt instrument before the maturitydate. Borrowers write put options as a means toachieve lower spread in the belief that over timespreads will decline, or at least remain stable, inwhich case the put would not be in the money,and would not be exercised.13 By issuing debtwith an embedded put feature, however, the is-suer risks being subject to a rapid increase in re-financing needs at times of emerging pressures,which could make a difficult situation worse. Inthe context of the Asian crisis, a number ofemerging market borrowers, in the face of a to-tal loss of access to international capital markets,faced significant pressures in their external ac-counts following creditors’ decision to exerciseput options. In the context of improvements insovereign debt management strategy, put op-tions have been relatively rare in their use in thepure sovereign context in recent times, althougha number of public sector entities continue touse them.
Warrants
An innovative feature, which has occasionallybeen used by emerging market sovereign bor-rowers, is the use of warrants embedded in newbond issues. Embedded warrants in nonsover-eign bonds are fairly common and have usuallybeen of the equity warrant type (i.e., they haveincluded a call option that gives the bondholderthe right, but not the obligation, to buy a certainamount of shares at a specified price). Bond war-rants, in contrast, give the holder of the warrantthe right, but not the obligation, to buy another
sovereign bond (usually long term), at a prede-termined price at some future date. Hence, war-rants can be seen as sold call options by the sov-ereign issued out of the money (i.e., theybecome in the money if spreads come downfaster than contracted before the exercise date)that are embedded in an otherwise plain vanillabond. Argentina revived the use of bond war-rants in November 1998 by embedding a warrantin a $1 billion bond issue. This structure, whichpreviously had not been used in a sovereign con-text since the early eighties, was well-receivedand subsequently copied by other issuers, withsome alterations (Box 5.1).
In effect, warrants allow the issuer to “buydown” the headline spread today, in return for acommitment to pay more in the future shouldthe outlook for the country improve and spreadsfall to the extent that the warrants become inthe money. The country will then issue new debtin the improved economic environment at ratesabove the prevailing market rates. Conversely, inthe event that spreads do not fall below thestrike price, the warrant will not be exercisedand the country will have benefited from lowerinitial issuing costs.14 Hence, by making debt-service payments countercyclical, warrants pro-vide risk-shifting benefits, and entail risks only tothe extent that effective borrowing costs in thefuture could increase if economic prospects im-prove sharply.
Market commentary has highlighted a num-ber of technical benefits from this structure, in-cluding an increase in liquidity. Furthermore,warrants, being a type of call option paid for bythe buyer, provide the owner of the warrant witha significant amount of extra leverage. Theywould appeal, in particular, to institutional in-vestors who are forbidden by home market regu-lations to take regular option positions but areallowed to hold warrants that are attached to a
CHAPTER V ALTERNATIVE FINANCIAL INSTRUMENTS AND ACCESS TO CAPITAL MARKETS
70
13Such options would be exercised when they are “in the money”—that is, in circumstances in which the secondary mar-ket price of the underlying debt instrument (identical in every respect except for the absence of the put option) is belowthe put price (usually par).
14If there is a need to restructure the issued bond before the exercise date, it seems clear that the warrant would beworthless and hence be ignored from the standpoint of pricing the restructured instrument.
ALTERNATIVE FINANCIAL INSTRUMENTS: WHAT ARE THEY AND HOW DO THEY WORK?
71
Following its introduction in the sovereign con-text by the Argentine government in November1998, there have been several instances of sover-eigns issuing a bond with an attached warrant.
Argentina I
On November 18, 1998, Argentina launched anunusual seven–year sovereign Eurobond that in-cluded a bond warrant. The bond was favorably re-ceived, and was increased from an initial $750 mil-lion to $1 billion, at a spread of 622 basis points.The Eurobond (the so-called “host bond”) includeda warrant that gave the holder the right, but not theobligation, to buy the Argentine 2027 bond (the so-called “back bond”) at 93.3 percent of par. Thevalue of the warrant was estimated at launch time tobe 64 basis points, which was the sweetener pro-vided by the issuer. The warrant, which was subse-quently exercised, had a maturity of approximatelyone year and expired in December 19, 1999.
Mexico
Mexico launched a $1 billion sovereign bond onFebruary 5, 1999, which included a fairly complexwarrant structure. The holder of the warrant wasgiven the right, one year after the launch, to ex-change some specific Brady bond issues into either: ayet to be issued floating rate note, due 2005, payingLIBOR plus 4.75 percent, or a reopening of theUnited Mexican States Bond, due 2016 with a 11.375percent coupon. Exchange ratios, which provided forthe exercise price of the warrant, were set at launch.Warrants were detachable at launch and could tradeseparately. The warrants were subsequently exercised.
Argentina II
Argentina issued its second bond with an embed-ded warrant attached in February 1999. The majordifference between this warrant and the previousArgentine one was that it was issued during consid-erably improved market conditions and the warrant,allowing another $500 million to be issued, exer-cised into the host bond (maturing February 2009)instead of a different bond. Market reactions werereportedly positive, yet the size was limited to $1 bil-lion in face of $2 billion worth of demand (allowingcertain investors to be targeted). The warrant was
valued around 20 to 30 basis points, resulting in amodest yield curve pickup of 20 basis points com-pared to the outstanding bonds maturing in 2017.The warrants, which were subsequently exercised,were not detachable until one month after launch.
Colombia
The Republic of Colombia launched in March1999 a $500 million Eurobond with a 10.875 per-cent semiannual paying coupon maturing in March2004. The bond issue also included a warrant givingthe right to exercise the warrant, one year from thehost bond’s issue date, into a yet-to-be-issuedRepublic of Colombia bond, with a maturity of 19years. The attached warrants are said to have saved87 basis points of the headline spread of the bondissue. Warrants were subsequently exercised.
Panama
On June 26, 2001, Panama offered to purchasefor cash and warrants up to $245 million aggregateprincipal amount of its 7.875 percent notes dueFebruary 13, 2002, in order to minimize the carry-ing cost of this issue. The offer was to expire on July10, 2001, or once the $245 million aggregate princi-pal of the 2002 notes was validly tendered,whichever came first. Under the terms of the offer,if Panama would purchase any 2002 notes, the ten-derer would receive, for each $1,000 principalamount of 2002 notes purchased, a cash payment of$1,039.375 and two warrants, each of which wouldentitle the holder, on January 16, 2002, to exercisean option to purchase $1,000 principal amount ofPanama’s newly issued 9.375 percent Global Bondsdue July 23, 2012 (the “2012 Bonds”) for cash at anexercise price of $990. If, however, the number ofwarrants exercised on January 16, 2002, would resultin the issuance of less than $100,000,000 aggregateprincipal amount of 2012 Bonds, Panama would in-stead issue and deliver, in respect of each warrantexercised, $943.10 principal amount of its outstand-ing 9.625 percent Global Bonds due February 8,2011 (the “2011 Bonds”). These 2011 Bonds, if is-sued would be a further issue of and form a singleseries with outstanding 2011 Bonds.
Finally, warrants were in the money and $182 mil-lion (57 percent of the total) were exercised.
Box 5.1. Recent Bond Warrants

bond. Another factor affecting the use of war-rants is the perceived advantage of tailoring theinstrument to a particular class of creditor. Inthe case of the Mexican sovereign bond issuedin 1999, the warrant was immediately detach-able, which according to market sources led rela-tive value players to buy the bond plus warrantand immediately sell the bond, causing the bondprice to drop immediately after syndicationbroke. In contrast, in the Argentine bond issueof February 1999, the warrant was first separableone month after the issue, and hence specificallytargeted longer-term investors. Argentina’s suc-cess in targeting the desired group of investorswas also helped by excess demand for the issue,which allowed the lead managers to discriminatebetween new money accounts and switching ac-counts (investors that sell one Argentine bondto buy the one being issued, thereby shifting theyield curve in the process).
Despite their potential benefits, the use of war-rants by sovereign issuers has significantly dimin-ished in recent years—although Panama usedthis feature in 2001 in the context of retiring/swapping some bonds maturing in 2002—inlarge part because of the difficulty, and potentialinefficiency, in the pricing of debt instrumentscontaining warrants.15 However, because of theirrisk diversification features (sweetener wouldonly need to be paid in the “good” state of theworld), emerging market sovereigns might con-sider the use of warrants in the future.
Structured Notes
In the aftermath of the Asian crisis, structurednotes became a popular means for emergingmarket borrowers to access international capitalmarkets, although their popularity has waned
significantly in recent years. These instrumentsare powerful tools for intermediating credit andrisk, and can be used to achieve virtually anyrisk/reward profile, but their complexity andnonuniformity pose distinct challenges foremerging market borrowers and lenders.
Structured notes are fixed income securitieslinked to derivatives. The embedded derivativetransactions are most commonly swaps, althoughoptions, futures/forwards, credit-linked deriva-tives, caps, and floors can be used as well. Assuch, they are often fairly complex transactionswith varying contingent payoffs.16 For emergingmarkets, structured notes have so far been is-sued by Argentina, Colombia, the Philippines,and Ukraine. These transactions have in totalamounted to about $3.7 billion, with a spike inissuance during the second half of 1998. Sincethen, however, they have seldom been used.
Structured notes allow for the hedging of al-most any risk, and could be designed such thatthe payoff on the note is linked to the paymentcapacity of the issuer. Therefore, structurednotes are unique in their ability to diversify risksand payments across states. In addition, sincestructured notes combine traditional debt instru-ments with derivatives, investors that might oth-erwise be off limits to derivative markets can ob-tain indirect access to these markets. The marketfor this innovative financial instrument, however,is rather nontransparent. More often than not,structured notes are tailor made to suit specificinvestors and sold in relative obscurity. As aresult, general market information relating toissuance of structured notes, the availability ofvarious types, and information on marketparticipants is hard to come by, which in turnrenders the pricing of these instruments verydifficult. A further limitation arising from
CHAPTER V ALTERNATIVE FINANCIAL INSTRUMENTS AND ACCESS TO CAPITAL MARKETS
72
15The absence of sufficient liquidity among other things affects adversely the fair pricing of warrants.16Since their inception in 1983, structured notes rapidly increased in volume globally and, including secondary struc-
tured notes, amount in notional terms to more than $300 billion. With maturities ranging anywhere from three months toas long as 10 years, structured notes have been mostly denominated in U.S. dollars and issued by corporations, financialinstitutions, including banks, specialized government agencies, sovereigns, and multilateral institutions, such as the WorldBank. U.S. government agencies are among the largest issuers of structured notes, and the most active of these agenciesare the Federal Home Loans Banks (FHLB).
tailor-making these instruments relates to liquid-ity. Given that they are customized, it is not sur-prising that structured notes are not very liquidinstruments in secondary markets, and thiswould imply that potential buyers, despite thecustomization of the instrument, would expect aliquidity discount. From the sovereign’s point ofview, a structured transaction would only makesense when it has some benchmark bonds thatwould provide guidance in the pricing processof the structured note.
Collateralization
Under some conditions of market stress, sov-ereigns could face prohibitive borrowing costs.In such circumstances, some emerging marketborrowers have adjusted their debt managementstrategies to offer collateralized instruments. Theuse of collateral to back financial instruments isa common feature of private market borrowing,but outside of project financing, it has been lesscommon in the sovereign context. In most cases,collateral has taken the form of current assets,or assets created or acquired using borrowedfunds. In addition to traditional forms of collat-eralized borrowing, more recently, future flowsof hard currency receipts have served as collat-eral for borrowing by a number of public enter-prises, and this development could potentiallyhave significant implications for sovereign mar-ket borrowers. The remainder of this section fo-cuses on collateralization through the use of fu-ture flows, although the discussion of the costsand benefits applies equally to other forms ofcollateralized borrowing.
Borrowing Against Future Flows
Following the Mexican crisis in late 1994,there was an increase in borrowing against thefuture flow of hard currency income from theexport of goods and services (Box 5.2).17 A num-
ber of these transactions have been backed byexports of goods, typically oil, but including met-als, minerals, auto parts, plastics, and liquor.Other forms of collateral have included tourism-generated credit card receivables, workers’ re-mittances, receipts from long-distance telephonecalls, and airline ticket receivables from foreignroutes.
As a result of the implicit insurance investorsderive from the collateral, issues backed by fu-ture flows typically are rated above the sovereignforeign-currency rating, and have spreads belowthe sovereign spread, reflecting the belief of rat-ing agencies and markets that these securitiesare de facto senior to sovereign internationalbonds. In addition to being securitized, a num-ber of these transactions have been supported byprivate bond insurance, which among otherthings enhances the creditworthiness of the in-strument. The insurance company’s guaranteeof repayment raises the insured issue’s credit rat-ing to AAA, a practice common for industrialcountry municipal issues.18
A pledge of future flows as collateral can havebenefits for both borrowers and lenders, oftenreflects normal commercial practice, and mayfoster a more efficient allocation of trade andexternal financing. Collateral increases the costsof default by increasing recovery ratios shoulddefault occur and enhances the willingness to re-pay, thereby signaling a commitment to policiesthat allow repayment. The decline in the proba-bility of default lowers spreads and increases therange of creditors able and willing to hold theasset. During a period of financial turmoil, useof collateralization may help encourage newcredits by effectively subordinating existing debtand ensuring that new creditors are repaid first.Collateralization, however, brings risks andcosts—including the creation of less flexibledebt structures, the potential delinking of thepursuit of good policies from market financing,
ALTERNATIVE FINANCIAL INSTRUMENTS: WHAT ARE THEY AND HOW DO THEY WORK?
73
17The technique was first used in an emerging market context by Telmex in 1987 to borrow against its net long-distancereceivables from AT&T.
18 MBIA–Ambac is nearly the sole supplier of bond insurance for emerging market debt, having guaranteed over $3 bil-lion, including $1.75 billion of PEMEX’s’ oil-backed issue.

and possibly increasing the cost of unsecuredborrowing—that require close monitoring (seefollowing section for further detail).
Policy ImplicationsTo maintain sustained access to capital mar-
kets on terms consistent with medium-term via-bility as well as for purposes of risk diversifica-tion, emerging market borrowers may wish tomake use of alternative debt instruments em-bodying innovative features. Pressures to do somay increase at times of financial crises, whenaccess to capital markets is significantly reduced.The issuance of such debt, however, must beconsistent with sound debt management prac-
tices—among other things to ensure that effortsto maintain market access do not come at an ex-cessive cost, either in terms of an inflexible debtstructure or in terms of increasing effective bor-rowing costs. From a policy perspective, use ofinnovations must also be compatible with effortsof the international community to secure privatesector involvement in the resolution of crisesand improve the international financial architec-ture more generally.
Augmentations provide sovereign borrowers asimple means, reflecting sound debt manage-ment practice and devoid of significant costs, tomaintain (and reaccess) capital markets. Theircontinued use over the past several years is aclear reflection of this realization. By improving
CHAPTER V ALTERNATIVE FINANCIAL INSTRUMENTS AND ACCESS TO CAPITAL MARKETS
74
In a typical securitization against future re-ceivables, income is typically assigned to an off-shore subsidiary created specifically for this pur-pose, called a special purpose vehicle, whichissues the bond. The borrower provides irrevo-cable instructions to foreign importers thatpurchase its exports requiring them to makepayments to an account controlled by thetransaction’s trustee. The trustee first pays debtservice to investors and transfers to the specialpurpose vehicle any excess receipts (the trans-actions are typically overcollateralized three tofour times). These documents can have theforce of contracts in foreign jurisdictions, bind-ing companies such as Exxon, Mobil, AT&T,Visa, and MasterCard to make payments intothe trustee account. The transaction shifts juris-diction over hard currency payments to a courtsystem trusted by investors; otherwise, borrow-ing against future flow of export income paral-lels industrial country finance institutions’practice of securitizing their loan receivables.The rating of the bond issued by the specialpurpose vehicle is determined by many factors,including the nature of the receivable, the de-gree of over-collateralization, redirection of pay-ment risk, the rating of the sovereign, and therating of the receivable generating process.
Ratings of individual tranches can be furtherenhanced by the use of mono–line insurersand/or subordination.
In one prominent example, PEMEX, theMexican state-owned oil and gas company, issued$4.1 billion of bonds in December 1998,February 1999 and July 1999 secured by futureoil export receivables.1 These transactions arenotable for a number of reasons. First, they ac-counted for 24 percent of all emerging marketissues backed by future flows of income. Second,PEMEX is an important source of tax and non-tax revenue for the Mexican government. Finally,a bond insurance company, MBIA–Ambac guar-anteed $1.35 billion of the issues, raising thecredit rating to AAA rating (S&P), while thenonguaranteed portions received a BBB rating(S&P). The sovereign credit rating for Mexico atthat time was (and still is) BB (S&P).
Box 5.2. The Structure of Future-Flow Securitizations—Modalities and the Case of PEMEX
1Specifically, PEMEX issued the bonds through aspecial purpose financing vehicle, PEMEX Finance,incorporated in the Cayman Islands. The issues aresecured by PEMEX’s account receivables from foreignclients, through a contract (a “receivables purchaseagreement”) that gives PEMEX Finance the right topurchase, from time to time, accounts receivables thathave been generated or will be generated in thefuture.
the liquidity of existing debt instruments, and bycatering to the specific needs of investors, aug-mentations enable sovereigns to maintain accessto capital markets in a series of small steps untilmarket sentiment improves. The successful useof augmentations in the context of financialcrises will, however, depend among other thingson whether the issuing sovereign is the source ofa crisis or is a victim of contagion. If the sover-eign is the source of a crisis, it is quite likely thatmarkets would dictate the need for other typesof enhancements for the sovereign to regain ac-cess on favorable terms, while if the sovereign isa victim of contagion, augmentations may be suf-ficient for the sovereign to maintain access tocapital markets.
Time varying and state-contingent financialinstruments, including step-downs and embed-ded call options, can provide market access atheadline spreads and allow for a reasonable bal-ance between the provision of enhancements toentice investors and the opportunity for the sov-ereign debtor to lower debt-servicing costs inthe future. Neither technique, however, pro-vides much in the way of risk diversification. Inthe case of call options, the future interest rateis uncertain, while in the step-down it is con-tracted ahead of time.19 The proper timing of acall option is inherently difficult to determinebefore hand since it depends quite critically onthe existence of asymmetric risk preference andinformation between the sovereign debtor andinvestors. However, because of the likelihoodthat the sovereign will have superior informa-tion than the market, the market will compen-sate by demanding a higher price for the op-tion. Therefore, only in a select fewcircumstances, when the quality of the sover-eign’s information is better than anticipated(i.e., the information asymmetry is unexpectedlylarge) or when the risk preferences diverge sig-nificantly, will the sovereign find it advanta-
geous to issue a bond with an embedded calloption.
The use of put options in debt instruments,while providing emerging market borrowers ac-cess to capital markets on favorable terms, couldcome at a significant cost in terms of increasingthe debt-service burden of borrowers at times offinancial stress, and could thereby make a diffi-cult situation worse. Therefore, from the sover-eign’s perspective, put options need to be care-fully considered to ensure consistency withsound debt management practices, in particular,the management of debt profiles and risks aris-ing from the possible exercise of the options.
In contrast to step-downs and options, bondwarrants provide risk diversification to emergingmarket sovereigns by offering the opportunity toissue debt that “buys down” headline spreadsprevailing at times of crises or contagion in re-turn for an explicit commitment to pay higherspreads—on new bonds—in the future, if eco-nomic prospects and market sentiment improve,leading to a decline in market spreads on sover-eign bonds. Without creating an inflexible debtinstrument, warrants can provide significant risk-shifting benefits and breathing room at times ofcrises by lowering debt service in the near term,and only expose the sovereign to risk in terms ofhigher borrowing rates (than market rates) inthe future when strong economic adjustment fa-cilitates sharp economic recovery. As a result,from the sovereign borrower’s perspective, war-rants may be more cost-effective and consistentwith sound debt management in the context ofcountries in crises, rather than for those suffer-ing from contagion, since the upside potentialfor these countries will probably take time tomanifest itself. Warrants are, however, morecomplex than conventional bonds, underscoringthe importance for sovereigns to make thoroughassessments of the associated benefits and risksprior to using them. Nonetheless, if properly un-
POLICY IMPLICATIONS
75
19Between a bond embedded with a step-down feature and a plain vanilla bond, the choice for the sovereign is basicallythe same, except that with the plain vanilla bond the yield curve can be augmented, while with the step-down the new in-strument can simply merge with an existing bond. Hence, the trade-off is between a better-defined yield curve and a moreliquid benchmark-like bond (the merger of the new bond and the existing one).

derstood and fairly priced, they can provide animportant source of risk insurance for emergingmarket borrowers.
As with other derivative products, structurednotes can be used to either manage existing riskor assume new risk. Among the numerous fixedincome securities available in the market, struc-tured notes are special in that they can be cus-tomized to satisfy the unique requirement of in-dividual investors, allowing for the possibility ofexotic payoffs and higher-than-market yields un-der certain scenarios, including links to any cur-rency, interest rate, stock index or combinationthereof, and exposure to different market sec-tors within one packaged security. In general,from a market access perspective, structurednotes could play a useful role in expanding theinterested emerging market investor class, byparticularly catering to previously unsatisfiedpockets of demand. There are, however, signifi-cant risks and impediment to their wider use.Owing to their complexity and nontrans-parency, structured instruments can be difficultto price, while the underlying structure couldbe inflexible. Therefore, like warrants, struc-tured instruments, when properly understood,fairly priced, and issued in moderate amounts,can provide an important means for emergingmarket borrowers to maintain market access tocapital markets.
Collateralized borrowing, by subordinatingother forms of debt and providing insurance toassure creditors that debts to them will be serv-iced, could potentially provide the sovereignborrower significant market access, and possiblyat terms consistent with medium-term viability,especially at times of financial stress and whenoverwhelming uncertainty restricts other formsof market access. Care and restraint is, however,required in their use since the costs that suchborrowing will impose on the sovereign bor-rower could be significant.
In an unsecured sovereign bond issue, marketaccess and spreads are determined by the levelof confidence that investors have in the coun-try’s underlying policies and prospects, thus ex-erting crucial market discipline.20 Collateralizedborrowing can, however, weaken the link be-tween the availability of finance and the qualityof policies, as investors are assured of paymentregardless of the policies pursued by the govern-ment. This weakens the incentives for sovereignsto adhere to appropriate policies, thereby erod-ing the quality of unsecured credits. Also, to theextent that such borrowing subordinates otherforms of debt, it could increase the costs of un-enhanced borrowing. Furthermore, since collat-eralized debt is effectively unreschedulable, itlimits a country’s room for maneuver in theevent of future payment difficulties. In addition,the successful use of collateralized instrumentsby one emerging market sovereign to regainmarket access may lead to a proliferation oftheir use, including by other emerging marketborrowers, as investors seek deals with similar se-curity, thereby widening the scope of a potentialfinancial crisis as debt structures become moreinflexible.
Finally, by reducing the net exposure of theprivate sector to sovereign risk, collateralizedborrowing also runs counter to the efforts of theinternational financial community to involve theprivate sector in the resolution of crises, while inlight of their role in creating less flexible debtstructures, they could be inimical to the effortsof the international community in encouraginga wider use of financial instruments that can fa-cilitate a restructuring of sovereign debt in ex-treme circumstances.
Concluding RemarksEmerging market sovereigns may face signifi-
cant risks in relying on debt issuance denomi-
CHAPTER V ALTERNATIVE FINANCIAL INSTRUMENTS AND ACCESS TO CAPITAL MARKETS
76
20This approach is mirrored in the IMF (and World Bank) policy of not demanding collateral for use of resources, butinstead looking to the quality of macroeconomic and structural policies to provide “collateral.” Collateralization may alsoraise a “safeguard” issue for international financial institutions since the earmarking of assets could affect the capacity of asovereign debtor to service its financial obligations to them.

nated in foreign currency. Therefore, prudentsovereign debt management practices wouldlimit additional risks that arise from borrowingusing debt instruments that create, among otherthings, inflexible debt structures and furthershift risks to the sovereign borrower. A numberof alternative debt instruments, including aug-mentations and those embedded with risk diver-sification features, such as warrants, can poten-tially provide emerging market borrowers withaccess to capital markets without posing signifi-cant costs and can allow debt-service payments
to be countercyclical, thereby contributing tothe maintenance of economic and financial sta-bility. Some debt instruments, including bondswith put options and collateralized instruments,however, can pose significant risks (and costs).Hence, emerging market sovereign borrowersneed to develop appropriate policies to assessrisks associated with borrowing using alternativefinancial instruments prior to using them tomaintain access to capital markets, both duringnormal market conditions and at times of finan-cial stress.
CONCLUDING REMARKS
77

World Economic Outlook: A Survey by the Staff of theInternational Monetary FundThe World Economic Outlook, published twice a year in English,French, Spanish, and Arabic, presents IMF staff economists’analyses of global economic developments during the nearand medium term. Chapters give an overview of the worldeconomy; consider issues affecting industrial countries, devel-oping countries, and economies in transition to the market;and address topics of pressing current interest.ISSN 0256-6877.
$42.00 (academic rate: $35.00); paper.2001. (Dec.). ISBN 1-58906-087-3. Stock #WEO EA 0172001.2001. (Oct.). ISBN 1-58906-073-3. Stock #WEO EA 0022001.2001. (May). ISBN 1-58906-032-6. Stock #WEO EA 0012001.2000. (Oct.). ISBN 1-55775-975-8. Stock #WEO EA 0022000.2000. (May). ISBN 1-55775-936-7. Stock #WEO EA 012000.1999. (Oct.). ISBN 1-55775-839-5. Stock #WEO EA 299.1999. (May). ISBN 1-55775-809-3. Stock #WEO-199.
Official Financing for Developing Countriesby a staff team in the IMF’s Policy Development and ReviewDepartment led by Anthony R. Boote and Doris C. Ross
This study provides information on official financing for de-veloping countries, with the focus on low-income countries. Itupdates the 1995 edition and reviews developments in directfinancing by official and multilateral sources.$25.00 (academic rate: $20.00); paper.2001. ISBN 1-58906-038-5. Stock #WEO EA 0132001.1998. ISBN 1-55775-702-X. Stock #WEO-1397.1995. ISBN 1-55775-527-2. Stock #WEO-1395.
Exchange Rate Arrangements and CurrencyConvertibility: Developments and Issuesby a staff team led by R. Barry Johnston
A principle force driving the growth in international trade andinvestment has been the liberalization of financial transactions,including the liberalization of trade and exchange controls.This study reviews the developments and issues in the exchangearrangements and currency convertibility of IMF members.$20.00 (academic rate: $12.00); paper.1999. ISBN 1-55775-795-X. Stock #WEO EA 0191999.
World Economic Outlook Supporting Studiesby the IMF’s Research Department
These studies, supporting analyses and scenarios of the WorldEconomic Outlook, provide a detailed examination of theory andevidence on major issues currently affecting the global economy. $25.00 (academic rate: $20.00); paper.2000. ISBN 1-55775-893-X. Stock #WEO EA 0032000.
Global Financial Stability Report: MarketDevelopments and Issues
The Global Financial Stability Report, published four times ayear, examines trends and issues that influence world fi-nancial markets. It replaces two IMF publications—the an-nual International Capital Markets report and the electronicquarterly Emerging Market Financing report. The report is de-signed to deepen understanding of international capitalflows and explores developments that could pose a risk tointernational financial market stability. $42.00 (academic rate: $35.00); paperMarch 2002 ISBN 1-58906-105-5. Stock #GFSR EA0012002.
International Capital Markets: Developments,Prospects, and Key Policy Issues (Back Issues)$42.00 (academic rate: $35.00); paper2001. ISBN 1-58906-056-3. Stock #WEO EA 0062001.2000. (Sep.). ISBN 1-55775-949-9. Stock #WEO EA 00620001999. (Sep.). ISBN 1-55775-852-2. Stock #WEO EA 699.
Toward a Framework for Financial Stabilityby a staff team led by David Folkerts-Landau and Carl-Johan Lindgren
This study outlines the broad principles and characteristics of sta-ble and sound financial systems, to facilitate IMF surveillanceover banking sector issues of macroeconomic significance and tocontribute to the general international effort to reduce the like-lihood and diminish the intensity of future financial sector crises.$25.00 (academic rate: $20.00); paper.1998. ISBN 1-55775-706-2. Stock #WEO-016.
Trade Liberalization in IMF-Supported Programsby a staff team led by Robert Sharer
This study assesses trade liberalization in programs supportedby the IMF by reviewing multiyear arrangements in the 1990sand six detailed case studies. It also discusses the main eco-nomic factors affecting trade policy targets.$25.00 (academic rate: $20.00); paper.1998. ISBN 1-55775-707-0. Stock #WEO-1897.
Private Market Financing for Developing Countriesby a staff team from the IMF’s Policy Development and Review Department led by Steven Dunaway
This study surveys recent trends in flows to developing coun-tries through banking and securities markets. It also analyzesthe institutional and regulatory framework for developingcountry finance; institutional investor behavior and pricing ofdeveloping country stocks; and progress in commercial bankdebt restructuring in low-income countries.$20.00 (academic rate: $12.00); paper.1995. ISBN 1-55775-526-4. Stock #WEO-1595.
World Economic and Financial SurveysThis series (ISSN 0258-7440) contains biannual, annual, and periodic studies covering monetary and financial issues of impor-tance to the global economy. The core elements of the series are the World Economic Outlook report, usually published in May andOctober, and the quarterly Global Financial Stability Report. Other studies assess international trade policy, private market and of-ficial financing for developing countries, exchange and payments systems, export credit policies, and issues discussed in the WorldEconomic Outlook. Please consult the IMF Publications Catalog for a complete listing of currently available World Economic andFinancial Surveys.
Available by series subscription or single title (including back issues); academic rate available only to full-time university faculty and students.For earlier editions please inquire about prices.
The IMF Catalog of Publications is available on-line at the Internet address listed below.Please send orders and inquiries to:
International Monetary Fund, Publication Services, 700 19th Street, N.W.Washington, D.C. 20431, U.S.A.
Tel.: (202) 623-7430 Telefax: (202) 623-7201E-mail: [email protected]: http://www.imf.org