Embed Size (px)
Citation preview

Global Financial Stability Report, October 2007
Global Financial Stability Report Global Financial Stability Report
Financial Market TurbulenceCauses, Consequences, and Policies
World Economic and Financia l Surveys
I N T E R N A T I O N A L M O N E T A R Y F U N D
07OC
T
IMF
OCT
07

World Economic and Financial Surveys
Global Financial Stability ReportFinancial Market TurbulenceCauses, Consequences, and Policies
October 2007
International Monetary FundWashington DC
© 2007 International Monetary Fund
Production: IMF Multimedia Services DivisionCover: Jorge Salazar
Figures: Theodore F. Peters, Jr.Typesetting: Julio Prego
ISBN 978-1-58906-676-2ISSN 0258-7440
Price: US$57.00(US$54.00 to full-time faculty members and
students at universities and colleges)
Please send orders to:International Monetary Fund, Publication Services
700 19th Street, N.W., Washington, D.C. 20431, U.S.A.Tel.: (202) 623-7430 Telefax: (202) 623-7201
E-mail: [email protected]: http://www.imf.org

iiiiii
Preface vii
Executive Summary ix
Chapter 1. Assessing Risks To Global Financial Stability 1
Global Financial Stability Map 2Credit Indiscipline in Mature Markets 7Weaker Credit and Market Discipline Warrants Increased Surveillance in Emerging Markets 22Investment Infl ows into Emerging Markets—Do They Destabilize Local Markets? 27Policy Challenges 33Annex 1.1. The Global Financial Stability Map 39Annex 1.2. Sovereign Wealth Funds 45References 50
Chapter 2. Do Market Risk Management Techniques Amplify Systemic Risks? 52
VaR and Other Risk Management Techniques 54Assessing Amplifi cation Effects in a Stylized Market Risk Management Framework 57Developments in Market Risk Management Practices by Banks and Hedge Funds 63Observations 69Policy Implications 71Conclusions 73References 74
Chapter 3. The Quality of Domestic Financial Markets and Capital Infl ows 77
Does Domestic Financial Development Help Determine Capital Infl ows? 79Challenges Associated with Capital Infl ows and Policy Responses: Case Studies 85Key Results and Conclusions 90Annex 3.1. Estimation Specifi cation and Results 93Annex 3.2. Experiences with Recent Capital Infl ows: Brazil, India, Romania,
South Africa, and Vietnam 100Annex 3.3. Experiences with Recent Capital Infl ows: Selected Countries 105References 108
Glossary 110
Annex: Summing Up by the Acting Chair 117
Statistical Appendix 121
CONTENTS

CONTENTS
iv
Boxes
1.1 Estimates of Nonprime Mortgage Losses 121.2 Concerns in the Asset-Backed Commercial Paper Market 181.3 Equity Infl ows and Emerging Markets 291.4 The Role of Hedge Funds in Emerging Asia 341.5 Sovereign Wealth Funds: A Statistical Perspective 462.1 Criticism of VaR-Based Risk Management Models and Alternatives 552.2 The Basics for Constructing VaR Measures 562.3 Risk Measurement and Disclosure Practices of Financial Institutions 652.4 The Amaranth Hedge Fund Failure and Liquidity Risk 683.1 Recent Developments with Capital Flows in Emerging Asia and Latin America 803.2 Discussions with Investors into Emerging Markets: Do “Micro” Financial Factors Attract
International Capital? 833.3 How Investors Gain Exposure to an Emerging Market in the Presence of Capital Controls:
The Case of India 91
Tables
1.1 Weakening Discipline in Subprime Lending is Mirrored in Leveraged Buyouts 141.2 Private Equity Deal Scenarios 171.3 Stylized Example of a Forced Unwind of Leverage 211.4 Typical Haircuts: Bond, Leveraged Loan, and ABS and CDO 221.5 Structure of External Financing and Banking System Soundness and Ownership 251.6 Changes in Risks and Conditions Since the April 2007 Global Financial Stability Report 391.7 Size and Structure of Major Sovereign Wealth Funds 482.1 Selected Correlation Coeffi cients Between Asset Classes in the Interactive Model 643.1 Panel Least-Squares Estimation of the Determinants of Total Capital Infl ows 823.2 Panel Generalized Method of Moments Estimation of the Determinants of the Standard Deviation of Total Capital Infl ows, 1998–2006 853.3 Indicators for Selected Countries, 2001 and 2006 873.4 Descriptive Statistics for Variables Used in Panel Regressions, 1975–2006 953.5 Fixed-Effects Panel Least-Squares Estimation of the Determinants of Capital Infl ows (All Countries, Full Sample) 963.6 Fixed-Effects Panel Least-Squares Estimation of the Determinants of Capital Infl ows (Emerging Market Economies, Full Sample) 973.7 Fixed-Effects Panel Least-Squares Estimation of the Determinants of Capital Infl ows (All Countries, 1998–2006) 983.8 Fixed-Effects Panel Least-Squares Estimation of the Determinants of Capital Infl ows (Emerging Market Economies, 1998–2006) 99
Figures
1.1 Global Financial Stability Map 2 1.2 Selected Asset Class Returns 2 1.3 U.S. High-Yield Corporate Bond Spreads Index 3 1.4 Probability of Multiple Defaults in Select Portfolios 4 1.5 Gross Debt Issuance by Sector 6

CONTENTS
v
1.6 Nonprime 60-Day Delinquencies by Mortgage Vintage Year 7 1.7 Monthly Mortgage Rate Resets 8 1.8 Rising Number of Downgrades of Mortgage-Related Products 8 1.9 Representative Spreads of Mortgage-Backed ABS and ABS CDOs 101.10 Mortgage Market Flows and Risk Exposures 111.11 Buyers of ABS CDOs 151.12 U.S. CDO Outstanding Volume 161.13 Number of Covenant-Lite Loans to Total Number of Institutional Term Loans 161.14 Average Bid Price for U.S. and European Leveraged Loans 161.15 Interest Coverage Statistics on Private Equity 161.16 U.S. Money Market Interest Rates, 2007 201.17 Emerging Market Private Loan Placements 231.18 Growth in External Funding of Banks and Private Sector Credit in 2006 231.19 Correlation of Credit Growth with Growth in Foreign Financing of Banks, 2004–06 241.20 Emerging Asia: Short-Term Foreign-Currency-Denominated Borrowing 261.21 Korea: Foreign-Currency-Denominated Loans of Commercial, Special, and Foreign Banks 261.22 Price/Earnings Ratios 271.23 Correlation of Emerging and Mature Market Equities 271.24 Net Flows into Emerging Market Equities, May–June 2006 321.25 Emerging Market Hedge Fund Allocations 321.26 Global Financial Stability Map: Monetary and Financial Conditions 421.27 Global Financial Stability Map: Risk Appetite 421.28 Global Financial Stability Map: Macroeconomic Risks 421.29 Global Financial Stability Map: Emerging Market Risks 431.30 Global Financial Stability Map: Credit Risks 431.31 Global Financial Stability Map: Market and Liquidity Risks 44 2.1 Implied Volatility Indices 53 2.2 Backtesting Results: Broad Portfolio, October 1997 to October 1998 58 2.3 Backtesting Results: Broad Portfolio, June 2006 to June 2007 58 2.4 VaR in an Era of Declining Volatilities 59 2.5 VaR Measures: Historical Simulation versus EWMA 60 2.6 Asian Crisis: Stressed VaR Estimates at the 99 Percent Confi dence Level 60 2.7 August 1998: VaR Estimates at the 99 Percent Confi dence Level 61 2.8 Long-Term Capital Management Scenario: EWMA versus Historical Simulation,
March 2007 61 2.9 Asset Price Dynamics Under Alternative Model Specifi cations 632.10 Selected Asset Volatilities Under the Interactive Model 63 3.1 Total Capital Infl ows 78 3.2 Composition of Capital Infl ows 79 3.3 Market Infrastructure and Volatility of Total Capital Infl ows 86

CONTENTS
vi
The following symbols have been used throughout this volume:. . . to indicate that data are not available;— to indicate that the fi gure is zero or less than half the fi nal digit shown, or that the
item does not exist;– between years or months (for example, 1997–99 or January–June) to indicate the
years or months covered, including the beginning and ending years or months;/ between years (for example, 1998/99) to indicate a fi scal or fi nancial year.“Billion” means a thousand million; “trillion” means a thousand billion.“Basis points” refer to hundredths of 1 percentage point (for example, 25 basis points are equivalent to !/4 of 1 percentage point).“n.a.” means not applicable.Minor discrepancies between constituent fi gures and totals are due to rounding.As used in this volume the term “country” does not in all cases refer to a territorial entity that is a state as understood by international law and practice. As used here, the term also covers some territorial entities that are not states but for which statistical data are maintained on a separate and independent basis.

viivii
The Global Financial Stability Report (GFSR) assesses global fi nancial market developments with a view to identifying systemic vulnerabilities. By calling attention to potential fault lines in the global fi nancial system, the report seeks to play a role in preventing crises, thereby contributing to global fi nancial stability and to sustained economic growth of the IMF’s member countries.
The analysis in this report has been coordinated in the Monetary and Capital Markets Department (MCM) under the general direction of Jaime Caruana, Counsellor and Director. The project has been directed by Hung Q. Tran, Deputy Director; Peter Dattels and Laura Kodres, Division Chiefs; and L. Effi e Psalida, Deputy Division Chief, all of MCM. The report benefi ted from comments and suggestions from Christopher Towe, Deputy Director, and Mahmood Pradhan, Assistant Director, both of MCM.
Primary contributors to this report also include Brian Bell, Sean Craig, Udaibir S. Das, John Kiff, Ulrich Klueh, Rebecca McCaughrin, Paul Mills, Christopher Morris, Shinobu Nakagawa, Mustafa Saiyid, Olaf Unteroberdoerster, and Christopher Walker. Other contributors include Roberto Benelli, Turgut Kisinbay, Annamaria Kokenyne, Gillian Nkhata, Seiichi Shimizu, Tao Sun, Leslie Teo, and Judit Vadasz. Professors Jon Danielsson and Badi Baltagi provided consultancy support. Martin Edmonds, Oksana Khadarina, Yoon Sook Kim, Ned Rumpeltin, and Kalin Tintchev provided analytical support. Shannon Bui, Norma Cayo, and Christy Gray were responsible for word processing. David Einhorn of the External Relations Department edited the manuscript and coordinated production of the publication.
This particular issue draws, in part, on a series of discussions with banks, securities fi rms, asset management companies, hedge funds, pension funds, credit rating agencies, fi nancial consultants, and academic researchers, as well as regulatory and other public authorities in major fi nancial centers and countries. The report refl ects information available up to September 4, 2007.
The report benefi ted from comments and suggestions from staff in other IMF departments, as well as from Executive Directors following their discussion of the Global Financial Stability Report on Septem-ber 14, 2007. However, the analysis and policy considerations are those of the contributing staff and should not be attributed to the Executive Directors, their national authorities, or the IMF.
PREFACE


ixix
Since the April 2007 Global Financial Stabil-ity Report (GFSR), global fi nancial stabil-ity has endured an important test. Credit
and market risks have risen and markets have become more volatile. Markets are recognizing the extent to which credit discipline has dete-riorated in recent years—most notably in the U.S. nonprime mortgage and leveraged loan markets, but also in other related credit markets. This has prompted a retrenchment from some risky assets and deleveraging, causing a widening of credit spreads in riskier asset classes and more volatile bond and equity markets. The absence of prices and secondary markets for some struc-tured credit products, and concerns about the location and size of potential losses, has led to disruptions in some money markets and funding diffi culties for a number of fi nancial institutions, as some counterparties have been reluctant to extend credit to those thought to hold lower quality, illiquid assets. The resulting disruption has required extraordinary liquidity injections by a number of central banks to facilitate the orderly functioning of these markets.
The potential consequences of this episode should not be underestimated and the adjust-ment process is likely to be protracted. Credit conditions may not normalize soon, and some of the practices that have developed in the structured credit markets will have to change. At the same time, the global economy entered this turbulent period exhibiting solid growth, especially in emerging market countries. Sys-temically important fi nancial institutions began this episode with adequate capital to manage the likely level of credit losses. So far, despite the signifi cant ongoing correction in fi nancial mar-kets, global growth remains solid, though some slowdown could be expected. Downside risks have increased signifi cantly and, even if those risks fail to materialize, the implications of this period of turbulence will be signifi cant and far
reaching. Eventually, lessons for both the private sector and the regulatory and supervisory arenas will have to be drawn in order to strengthen the fi nancial system against future strains.
The threat to fi nancial stability increased as the uncertainty became manifest in the money markets that provide short-term fi nancing (espe-cially commercial paper markets). At the center of the turmoil is a funding mismatch whereby medium-term, illiquid, and hard-to-value assets, such as structured credit securities, were being funded by very short-term money market securities—often asset-backed commercial paper. The market illiquidity and the diffi culty in valu-ing the complex, structured products held as assets has compounded the risks of the fund-ing mismatch. Thus, while potentially helping protect the fi nancial system from concentrations of credit risk in banks, the dispersal of struc-tured credit products has substantially increased uncertainty about the extent of the risks and where they are ultimately held.
This funding mismatch was undertaken by a signifi cant number of conduits and special purpose vehicles that had assumed they could hold their illiquid assets to maturity. Many have been associated with regulated banks, and to a large extent their funding strategies were backed by contingent liquidity lines from those banks. When doubts about the quality of some of the underlying assets emerged and the high ratings were perceived as less reliable, prices of the assets fell, the rollover of associated asset-backed commercial paper became very diffi cult, and funding began to be squeezed. As a consequence, what had been contingent, off-balance-sheet liabilities for regulated banks threatened to move “on balance sheet.” The funding diffi culties were fi rst felt in Europe and, subsequently, in a number of other places. The rapid transmission of disturbances in one part of the fi nancial system to other parts, sometimes
EXECUTIVE SUMMARY
EXECUTIVE SUMMARY
x
through opaque and intertwined channels, has surprised both market participants and the offi cial sector. The uncertainty about where off- balance-sheet bank exposures will materialize next has led to a tiering of interbank lending rates. Banks that are believed to either have structured credit product losses, or that need to satisfy contingent credit lines to their con-duits or special purpose vehicles, face higher interbank rates. In some cases, the fl ows in the interbank market are stymied by some large banks’ desire to hold onto liquidity in case they need to fi nance other activities, such as the large pipeline of leveraged buyouts scheduled for the remainder of the year. Overall, there has been a sharp rise in perceived counterparty risk, and a desire to keep the additional liquidity on hand, at least for now.
The April 2007 GFSR fl agged the underlying causes of the current correction. The weakening of credit discipline and the potential compla-cency, which were highlighted in that edition, led to a buildup of credit risks in the U.S. mortgage market, leveraged buyout market, and some lending to emerging markets. The benign economic and fi nancial conditions of recent years weakened incentives to conduct due dili-gence on borrowers and counterparties. More-over the “originate and distribute” model used for credit products by many fi nancial institutions meant that many such institutions could choose not to hold the credit risk they originated, reducing their incentives to monitor borrowers. Investors in the distributed securities may have relaxed their due diligence in assessing liquidity and leverage risks or chosen to rely excessively on ratings agencies to analyze risks in complex fi nancial instruments. Stress in the U.S. housing market then weakened mortgage-backed securi-ties, an important component of the global fi nancial system. The resulting multiple credit downgrades of these securities by ratings agen-cies led to downward pressure on their prices and started to deepen the repricing episode that began some time ago.
Leverage has played a key role in amplifying the disturbances. The ease with which some
banks and other investment vehicles, includ-ing hedge funds, were able to borrow against diffi cult-to-price collateral traded in illiquid markets severely aggravated conditions when market liquidity evaporated, resulting in a process of forced deleveraging at “fi re sale” prices and the failure of some funds. Institutions that have suffered the most have had strategies that were based on high levels of leverage and had assumed continued liquidity in secondary markets.
A long period of abnormally low market volatility likely exacerbated the episode. Risk premia in many markets had fallen to histori-cally low levels as more and more investors bet on a continuation of the benign, low-volatility environment. Returns became more correlated. As markets fell, risk premia expanded quickly. Similar risk management techniques, common investors, and similar positions may have exac-erbated the situation. Losses were magnifi ed as many market participants tried to exit similar positions simultaneously.
Chapter 1 of this report summarizes the over-all assessment of stability using the global fi nan-cial stability map introduced in the April 2007 GFSR. Extending the work in the last GFSR, the chapter focuses on the fallout from weakening credit discipline in the U.S. nonprime mort-gage market and the leveraged buyout market (including the market turbulence of August 2007, which resulted in a drying up of term lending in money markets), and details linkages across markets. The chapter explains how volatil-ity has been amplifi ed by high leverage and how risks are transmitted between institutions. Itgathers evidence on where the risks now reside, and what might be the impact on banks, corpo-rations, and households as losses surface.
The chapter also examines the global aspects of the lack of credit discipline. Overall, emerg-ing market risks remain fi nely balanced, with many countries benefi ting from improved macroeconomic fundamentals and better poli-cymaking frameworks. External sovereign debt has been reduced and debt structures are better managed. Nonetheless, offsetting these posi-tive aspects, credit growth has been rapid in a
EXECUTIVE SUMMARY
xi
number of emerging markets, with some banks (both domestic and foreign) borrowing abroad in foreign currency to lend domestically, taking on indirect credit risks through their foreign-currency-denominated loans. In addition, the low yields in mature markets and high risk appe-tite have allowed emerging market corporates easy access to foreign capital, including through synthetic and structured products to generate higher yields.
Chapter 1 also looks at some of the routes taken by foreign investors to gain access to cer-tain emerging markets where there are capital account restrictions. The chapter cautions that some emerging markets are vulnerable to a pull-back in the availability of capital, and that this pullback could continue even after the mature market funding diffi culties subside. To under-stand in greater depth the stability implica-tions of foreign participation in local emerging markets, the chapter provides empirical work on foreign equity fl ows into several different emerg-ing markets in order to distinguish between institutional investors and others. Lastly, the chapter reviews the growth in the activities of hedge funds in emerging markets.
Chapter 1 also includes an annex exploring some aspects of sovereign wealth funds (SWFs). The growth of these entities can be seen as the result of the strong accumulation of foreign assets by the offi cial sector—in part, due to high natural resources prices or prompted by large balance of payments surpluses and capital infl ows. SWFs are becoming an important inves-tor group, and questions have been raised about the impact of their cross-border asset allocations. The annex attempts to clarify some of the dis-cussion surrounding their structures and goals by providing a taxonomy of sovereign wealth funds and their asset allocation frameworks.
Although the recent episode of turbulence is ongoing, and it is too early to make defi nitive conclusions, it is already clear from the analy-sis in Chapter 1 that several areas will require increased attention. The fi rst is the important role of uncertainty and lack of information. Accurate and timely information about underly-
ing risks are critical components in the market’s ability to differentiate and properly price risk. This would include both qualitative and quanti-tative information about how risks are managed, valued, and accounted for, especially in areas of risk transfer. Greater transparency is also needed on links between systemically important fi nan-cial institutions and some of their off- balance-sheet vehicles. Only by disclosing fully their interrelationships with asset managers, conduits, and special purpose entities will investors be able to assess the true creditworthiness of the institutions with which they deal. However, given the volume and complexity of the information that could potentially be provided, and the cost of providing it, it will be important to carefully consider the appropriate amount and type of disclosure needed to alleviate the problems evident in this episode.
Second, while securitization, and fi nancial innovation more generally, through enhanced risk distribution have made markets more effi -cient, there is a need to understand how they may have contributed to the current situation. In particular, it is important to consider the extent to which the incentive structure, in the context of very benign times, may have diluted the incentives for originating lenders to monitor risk. In the U.S. mortgage market, the public sector costs associated with the lack of supervi-sory oversight of some mortgage originators will need to be balanced against the improved access to credit that some households received. Gener-ally, the relationship between checks and bal-ances throughout the supply chain of structured products may require some rethinking.
Third, there is a need to examine risk analysis of credit derivatives and structured products and the role of ratings agencies. Ratings and ratings agencies will continue to be a fundamental com-ponent in the functioning of fi nancial markets. However, there is some concern about the rating methodology of complex products, particularly when securities, with very different structures, assumptions, and liquidity characteristics, receive the same ratings. Ratings of complex structured products may have become too connected to

EXECUTIVE SUMMARY
xii
facilitating origination. In periods of turbulence, the rapid downgrades then raise questions about the reliability of these ratings and their useful-ness for the investors. We repeat the call from the April 2006 GFSR for a more differentiated scale of ratings for structured products. Inves-tors also have an obligation and responsibility to understand the dynamics and liquidity risks asso-ciated with the products they buy—they wrongly assumed that a low probability of default meant a low likelihood of losses from market move-ments. In the case of complex structured credit products, investors need to look behind the ratings—they should not assume that the simple letter ratings provided by ratings agencies show equivalent risks as those for other asset classes. Differentiation and transparency in the underly-ing assumptions and construction of the various structures would facilitate appropriate due diligence by investors.
Fourth, the valuation of complex products in the context of a market where liquidity is insuf-fi cient to provide reliable market prices requires more consideration. When purchasing complex products, investors will need to consider the asso-ciated liquidity aspects and include an appropri-ate liquidity risk “premium” as part of the price. Financial institutions holding such securities as collateral will need to assign a “haircut” that factors in liquidity characteristics. Importantly, fi nancial institutions need to make sure that they have robust funding strategies appropriately suited for their business model and that such funding strategies can accommodate stressful conditions. More generally, the rapid growth of some illiquid instruments raises questions about whether originators of such securities should be expected to provide secondary markets to con-tribute to the valuation process.
Fifth, the relevant perimeter of risk consoli-dation for banks has proved to be larger than the usual accounting or legal perimeters. There are two notable examples: (1) reputational risk may force banks to internalize losses of legally independent entities; and (2) new instruments or structures may mask off-balance-sheet or contingent liabilities. The result is that risks that
appear to have been distributed may yet return in various forms to the banks that distributed them. The relevant perimeter is not only an issue for supervisors, but also for the fi nancial institutions themselves—their risk management systems, audit processes and internal oversight and governance structures.
Policymakers now face a delicate balancing act. They must establish frameworks that encour-age investors to maintain high credit standards and strengthen risk management systems in good times as well as bad. Actions should only be undertaken if the public policy benefi ts outweigh the costs, taking care to thoroughly examine pos-sible unintended consequences. In general, the current regulatory systems have proven resilient to date, and regulators must be continually mind-ful that households and fi rms have benefi ted greatly from the fi nancial innovation and solid growth and fi nancial stability of recent years.
* * *
Chapters 2 and 3 examine two respective issues that are the outcome of the lengthy period of low mature market yields and unusu-ally low fi nancial market volatility over the last several years. Chapter 2 examines the extent to which market risk management methods may have encouraged more risk-taking during this relatively benign period, perhaps resulting in a more rapid withdrawal from risky assets than would otherwise be the case as conditions change. In light of rapid capital fl ows to emerg-ing market countries, Chapter 3 investigates how countries can best deal with capital fl ow volatility in the medium term by improving the depth, liquidity, and institutional quality of their domes-tic fi nancial markets.
Chapter 2 specifi cally examines market risk management techniques to see whether their common usage, while seemingly prudent for individual institutions, could exacerbate mar-ket volatility during periods of stressful market conditions. The question is examined in two ways. The fi rst is by using a stylized version of the most common market risk model, value-at-risk (VaR), which is the estimated loss a fi rm is

EXECUTIVE SUMMARY
xiii
unlikely to exceed at a given degree of confi -dence. For instance, a fi rm’s one-day estimated VaR of $10 million at a confi dence level of 95 percent implies that the fi rm would expect to lose more than $10 million on its portfolio only fi ve days out of 100. A stylized model is used to demonstrate how VaR declines during a lower volatility environment, but rises when higher volatility returns. The stylized portfolios are then “stressed” by examining how VaR would respond with data from previous episodes of fi nancial market turbulence. Lastly, simulations are con-ducted in which several fi rms are hypothesized to use the same, or slightly different, VaR mod-els, also during periods of stress. Results suggest that such fi rms, acting according to their own models to contain risks, could collectively make markets more volatile, especially if risk aversion is low. The simulations also show, however, that a greater diversity of models would help to reduce such potential instability.
Chapter 2 also examines risk management procedures of investment banks and hedge funds to see whether they conform to the pre-conditions necessary to amplify market volatil-ity in practice. While all fi rms maintain that they would not rigidly follow their VaR models in stressful circumstances, there are a number of ways in which VaR metrics, or related risk limits, could act to amplify market volatility. In fact, recent turbulence suggests some of these techniques may be contributing to the current turbulent conditions to some degree. Overall, VaR and other risk management techniques will encourage fi nancial institutions to respond more rapidly to changes in risk. Normally, this will facilitate early detection and prompt cor-rection of risks deemed excessive by the institu-tion. However, the use of similar techniques across institutions during periods of stress can lead to larger price movements than would occur if different techniques were used. It is thus worthwhile for regulators and supervi-sors to acknowledge the benefi ts of discretion when implementing risk management systems (including new ways to incorporate credit and liquidity risks) and to promote the use of “stress
testing”—encouraging all fi rms to consider their interactive effects during periods of stress, as some do already. A diversity of investment positions and types of participants is even more important to help stabilize markets. Regulators and supervisors would also do well to consider more concretely than they do now how they would respond to the amplifying effects when individual fi rms naturally attempt to protect their fi rm’s franchise value.
Chapter 3 empirically analyzes a common view—whether, in addition to strong macro-economic fundamentals, a well-functioning domestic fi nancial market encourages capital infl ows and reduces their volatility over the medium term. A panel estimation technique is used to examine the factors that determine the volume and volatility of annual capital infl ows for a sample of developed and emerging market economies from 1977 to 2006. The factors include fi nancial variables such as equity market depth and liquidity and fi nancial openness, and a shorter sample also includes institutional quality variables such as corporate governance quality and accounting standards. The results of the empirical work show that the liquidity of equity markets and fi nancial openness positively infl uence the level of capital infl ows. Moreover, the panel estimations show that more fi nancial openness reduces the volatility of infl ows. Sepa-rately, the chapter shows that improvements in a broad set of institutional quality variables are correlated with lower volatility.
Chapter 3 also examines how fi ve emerging market countries have coped with the recent rise in capital infl ows and discusses some of their pol-icy options. These fi ve country examples reveal the diffi culty of fi nding a common set of fi nancial policies that help deal with capital infl ows. Gener-ally, policies that encourage fi nancial market development over the medium term—including a well-regulated system, better transparency and broader institutional quality, and improved risk management for fi nancial institutions—will likely cushion the fi nancial system from the potentially destabilizing effects of abrupt capital outfl ows better than will short-term fi xes.


Following an extended period of exception-ally favorable fi nancial market conditions, international markets have entered a dif-
fi cult period. The current episode of turbulence represents the fi rst signifi cant test of several categories of innovative fi nancial instruments used to distribute credit risks broadly. Although the dislocations, especially to short-term fund-ing markets, have been large and in some cases unexpected, the event hit during a period of above-average global growth. Credit repricing and the constriction of liquidity experienced to date will likely slow the global expansion. Systemically important fi nancial institutions began this episode with more than adequate capital to absorb the likely level of credit losses. Corporations have, for the most part, been able to secure the fi nancing they need to maintain their operations. However, the adjustment period is continuing, and if the intermediation process stalls and fi nancial conditions deterio-rate further, the global fi nancial sector and real economy could experience more serious nega-tive repercussions.
This chapter fi rst summarizes our overall assessment of global fi nancial stability using
the global fi nancial stability map introduced in the April 2007 GFSR (IMF, 2007a). Although the stability map treats the various risk factors and underlying conditions as separate so as to facilitate their formal analysis, the latest episode highlights their interrelatedness in practice—with liquidity risks, both market and funding liquidity, at the forefront of the current episode of turbulence. What began as a deterioration in credit quality altered the market liquidity of a number of structured credit products. Market illiquidity, in turn, produced uncertainty about those products’ valuations, which translated into a disruption in the underlying funding markets. Thus, monetary and fi nancial conditions, as well as the risk appetite of market participants, have been adversely affected.
This chapter delves into some of the relevant areas in more detail, examining how weakening credit discipline in the U.S. mortgage mar-ket—especially the subprime market—and the overly rapid expansion of the leveraged buyout market have extended to the broader structured fi nance sector. The ensuing disruptions in the short-term funding markets are then examined. Global linkages are addressed with particular attention to the impact that investment fl ows to emerging markets have on fi nancial stability. Lastly, the chapter highlights a number of con-clusions that emerge from the analysis.
Financial risks have increased and underlying conditions have worsened since the April 2007 Global Financial Stability Report (GFSR). The period ahead may be difficult, as bouts of turbulence are likely to recur and the adjustment process will take some time. Uncertainty about the final size of losses, and when and where they will be revealed, will likely continue to keep market sentiment and conditions unsettled in the near term. This chapter outlines a number of the causes and consequences of the recent episode of turmoil and offers some initial thoughts on possible responses that the private and public sectors might consider to help improve global financial resilience.
Note: This chapter was written by a team led by Peter Dattels comprising Brian Bell, Sean Craig, John Kiff, Rebecca McCaughrin, Christopher Morris, Mustafa Saiyid, Olaf Unteroberdoerster, and Christopher Walker.
1CHAPTER
11
ASSESSING RISKS TO GLOBAL FINANCIAL STABILITY

CHAPTER 1 ASSESSING RISKS TO GLOBAL FINANCIAL STABILITY
2
Creditrisks
Market andliquidity risks
Riskappetite
Monetary andfinancial
Macroeconomicrisks
Emerging marketrisks
Conditions
Risks
Figure 1.1. Global Financial Stability Map
April 2007GFSR
Source: IMF staff estimates.Note: Closer to center signifies less risk or tighter conditions.
Current(October 2007)
Emerging market equities
G-7 government debt
Gold
Mature market equities
Emerging market sovereign debt
Carry trades
U.S. high-grade bonds
Dollar index (DXY)
U.S. crossover CDS
Leveraged loan CDS*
Europe crossover CDS
Subprime mortgage CDS*
–80 –70 –60 –50 –40 –30 –20 –10 0 10
Performance forJuly–August 2007
Performance forJanuary–August 2007
Sources: Bloomberg L.P.; JPMorgan Chase & Co.; Merrill Lynch; and IMF staff estimates.Note: DXY is a weighted average of the dollar exchange rate vis-à-vis six major world
currencies. CDS = credit default swaps; crossover CDS indices consist of mostly speculative grade and some higher yielding investment grade entities. *From inception date of index.
Figure 1.2. Selected Asset Class Returns(In percent)
Global Financial Stability Map
The global fi nancial stability map (Figure 1.1) presents an overall assessment of how changes in underlying conditions and risk factors are expected to bear on global fi nancial stability in the period ahead.1
Credit risks have increased signifi cantly.The largest increase in risks is represented by
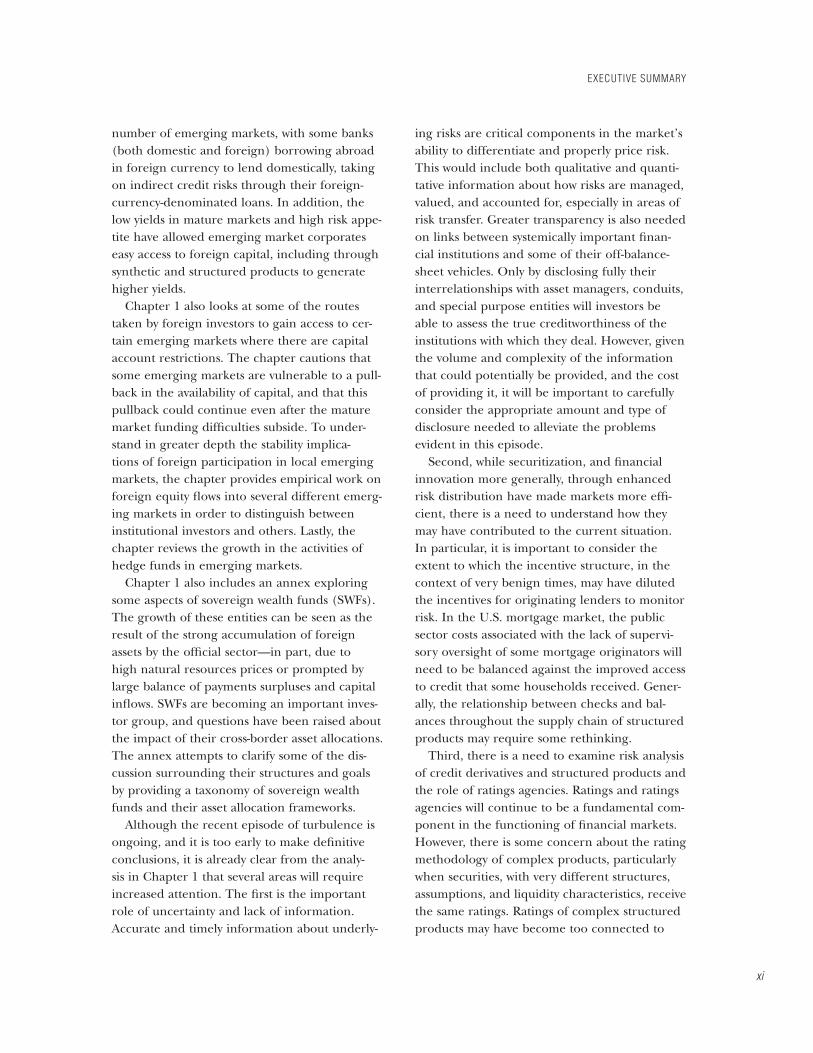
an increase in our assessment of credit risks.2 The April 2007 GFSR highlighted rising credit risk in U.S. mortgage-related instruments, a loosening of credit standards across a range of markets, and risks of spillovers to other credit markets. Since then, these credit risks have materialized and intensifi ed, with ratings agencies downgrad-ing signifi cant amounts of mortgage-related securities, and spreads on mortgage-related securities widening (Figure 1.2). These risks have been exacerbated by signs of similar credit indiscipline in the leveraged buyout (LBO) sector. Through mid-2007, there had been a marked rise in covenant-lite loans, less credit-worthy deals, leverage, and price multiples on acquisitions. Moreover, now that ratings agen-cies are revising their model assumptions for structured products collateralized by mortgages, uncertainty has risen about the ratings of the broader structured credit market, including collateralized loan obligations (CLOs) that dis-tribute leveraged loan fi nancing to institutions. Refl ecting the broader repricing of credit risk, spreads on high-yield corporate debt have wid-ened from the tight levels reached earlier in the year (Figure 1.3). Although aggregate corporate leverage remains relatively low, its increase over the past year, particularly for those entities that
1Annex 1.1 details how indicators that compose the rays of the map are measured and interpreted. The map provides a schematic presentation that incorporates a degree of judgment, serving as a starting point for fur-ther analysis. See the April 2007 GFSR for a fuller discus-sion of indicators and their placement in the map.
2Credit risks measure changes in credit quality that have the potential for creating losses resulting in stress in systemically important fi nancial institutions.
3
GLOBAL FINANCIAL STABILITY MAP
292725232119171513119753190
100
110
120
130
140
150
160
170
Sources: Merrill Lynch; and IMF staff estimates.Note: Spreads are normalized to 100 at the beginning of the crisis.
Figure 1.3. U.S. High-Yield Corporate Bond SpreadsIndex
Number of days since the start of the correction
August–September 1998
July–August 2007
May–June 2006
February–March 2007
have been the subject of buyouts, has height-ened vulnerabilities, especially as fi nancial, and possibly economic, conditions turn less benign.
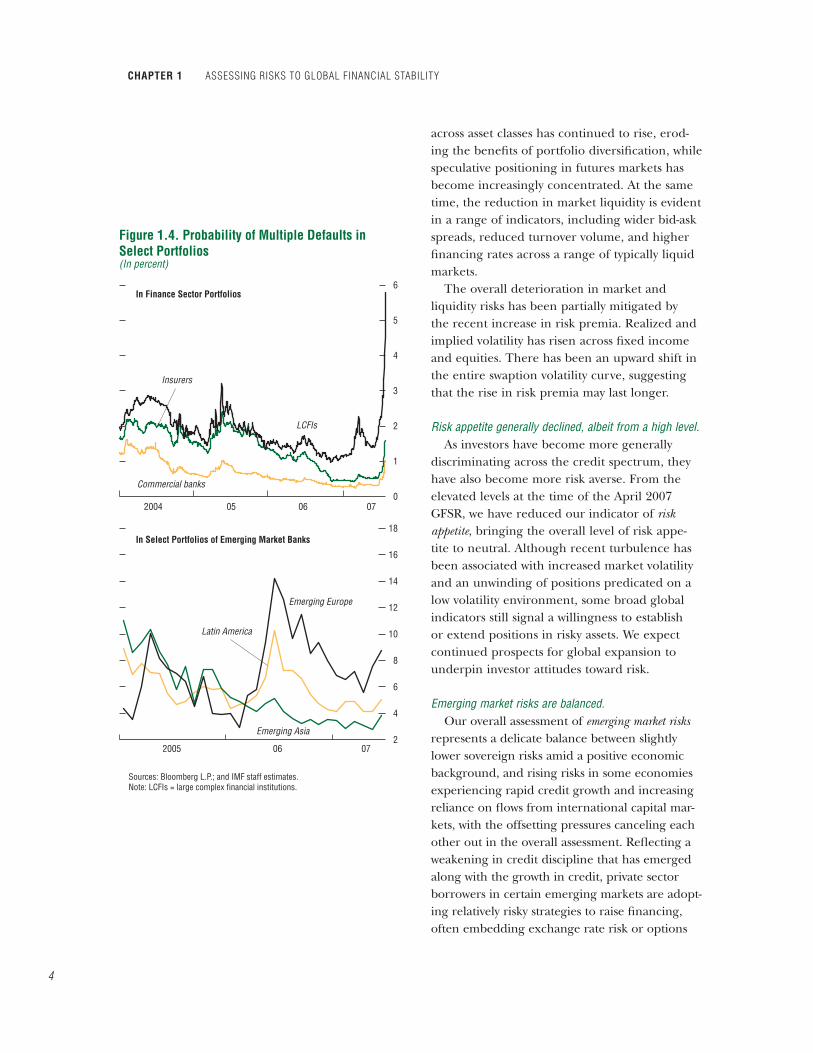
Meanwhile, mature market fi nancial system default risk, as refl ected in credit derivatives referencing large complex fi nancial institu-tions (LCFIs), has risen sharply (Figure 1.4).3
The rise was driven mainly by large U.S. invest-ment banks that are especially exposed to the nonprime mortgage and leveraged loan mar-kets. The widening in interest rate swaps and credit default swaps (CDS) referencing some investment banks illustrates market concerns of deeper stress for fi nancial institutions. While potential losses appear to be manageable and banks appear well capitalized to weather more severe stress, there is at present considerable uncertainty regarding the magnitude and distri-bution of losses stemming from the correction in credit markets, and their possible impact on broader fi nancial stability.
Uncertainty regarding overall losses and exposure has raised market and liquidity risks, with potentially broader implications for fi nancial institutions.
Refl ecting the potential rise in market losses, we have raised our assessment of market and liquidity risks.4 Uncertainty regarding ultimate losses has increased market risks associated with a wide range of assets, beyond structured credit products. In the face of this uncertainty and higher volatility, lenders have raised margins, even for highly rated borrowers, and lowered the mark-to-market value of collateral. Other indicators also suggest that market risks have risen. For instance, the correlation of returns
3This issue of the GFSR continues to use credit derivatives-based credit risk indicators to review the evolution of market perceptions of default risk in mature market fi nancial systems. The mature market credit risk indicators measure the probability of multiple defaults within three groups of 11 fi nancial institutions, implied from the prices of credit default swaps (IMF, 2005, Chap-ter II). The three groups are LCFIs, commercial banks, and insurance companies.
4Market and liquidity indicators measure the potential for instability in pricing risks that could result in broader spillovers and/or mark-to-market losses.
CHAPTER 1 ASSESSING RISKS TO GLOBAL FINANCIAL STABILITY
4
0
1
2
3
4
5
6
2
4
6
8
10
12
14
16
18
Sources: Bloomberg L.P.; and IMF staff estimates.Note: LCFIs = large complex financial institutions.
Figure 1.4. Probability of Multiple Defaults inSelect Portfolios(In percent)
In Finance Sector Portfolios
In Select Portfolios of Emerging Market Banks
2004
2005 06 07
05 06 07
LCFIs
Insurers
Commercial banks
Emerging Europe
Latin America
Emerging Asia
across asset classes has continued to rise, erod-ing the benefi ts of portfolio diversifi cation, while speculative positioning in futures markets has become increasingly concentrated. At the same time, the reduction in market liquidity is evident in a range of indicators, including wider bid-ask spreads, reduced turnover volume, and higher fi nancing rates across a range of typically liquid markets.
The overall deterioration in market and liquidity risks has been partially mitigated by the recent increase in risk premia. Realized and implied volatility has risen across fi xed income and equities. There has been an upward shift in the entire swaption volatility curve, suggesting that the rise in risk premia may last longer.
Risk appetite generally declined, albeit from a high level.As investors have become more generally
discriminating across the credit spectrum, they have also become more risk averse. From the elevated levels at the time of the April 2007 GFSR, we have reduced our indicator of riskappetite, bringing the overall level of risk appe-tite to neutral. Although recent turbulence has been associated with increased market volatility and an unwinding of positions predicated on a low volatility environment, some broad global indicators still signal a willingness to establish or extend positions in risky assets. We expect continued prospects for global expansion to underpin investor attitudes toward risk.
Emerging market risks are balanced.Our overall assessment of emerging market risks
represents a delicate balance between slightly lower sovereign risks amid a positive economic background, and rising risks in some economies experiencing rapid credit growth and increasing reliance on fl ows from international capital mar-kets, with the offsetting pressures canceling each other out in the overall assessment. Refl ecting a weakening in credit discipline that has emerged along with the growth in credit, private sector borrowers in certain emerging markets are adopt-ing relatively risky strategies to raise fi nancing, often embedding exchange rate risk or options

5
GLOBAL FINANCIAL STABILITY MAP
and thus increasing their exposure to volatility. Most noticeably, in some countries in Eastern Europe and Central Asia, banks are increasingly using capital market fi nancing to help fi nance credit growth. Nevertheless, generally benign emerging market banking system default risk indicators continue to refl ect market perceptions of healthy capitalization and profi tability, as well as diverse earnings sources and sound asset qual-ity (Figure 1.4).5 These trends warrant increased surveillance, as circumstances vary considerably across countries. Authorities in some emerging markets need to ensure that vulnerabilities do not build to more systemic levels. Across all emerging market countries, policies that support continued resilience should help, as global market condi-tions are likely to remain volatile.
Financial and monetary conditions have tightened…Since the April 2007 GFSR, policy rates have
risen further across a number of countries, while the ongoing repricing in credit markets has tightened fi nancing conditions for some segments—specifi cally, for less creditworthy U.S. households seeking mortgage credit and for highly leveraged corporate borrowers. Refl ecting these developments and their likely continua-tion, we have shifted our assessment of monetary and financial conditions to signify slightly tighter conditions.
…posing potential downside risks to the macroeconomy.
Tighter monetary and credit conditions could reduce economic activity through a few chan-nels. First, a tightening of the supply of credit to
5This issue of the GFSR introduces a set of equity market-based credit risk indicators to review the evolution of market perceptions of default risk in emerging market fi nancial systems. The emerging market credit risk indicators measure the probability of multiple defaults within three groups of fi ve banks, implied by Moody’s KMV Expected Default Frequencies (EDFs™). EDFs™ are constructed using balance sheet and equity price data using a Merton-type structural model for estimating the probability of default (Kealhofer, 2003). The three geo-graphic groupings are emerging Asia, emerging Europe, and Latin America.
weaker household borrowers could exacerbate the downturn in the U.S. housing market. Sec-ond, falling equity prices could reduce spending through the wealth effect and a weakening of consumer sentiment. Third, capital spending could be curtailed owing to a higher cost of cap-ital for the corporate sector. Last, and perhaps most importantly, the dislocations in credit and funding markets during the period of market turbulence could restrict the overall provision and channeling of credit.
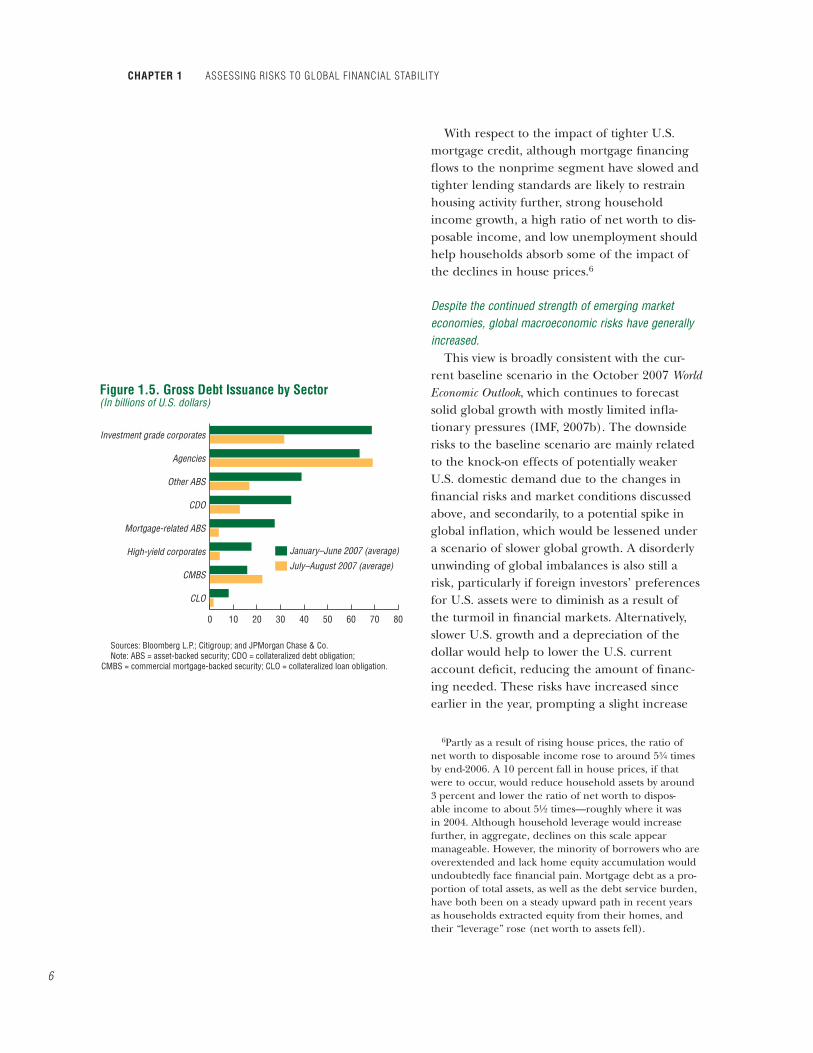
The chances of a more severe tightening of credit conditions cannot be dismissed. Such a tightening could have signifi cant global macro-economic consequences, with the incidence of such tightening falling most heavily on more marginally creditworthy borrowers. For this reason, the United States may experience a more signifi cant impact given the importance, for instance, of U.S. high-yield corporates as recipients of credit. By August, debt issuance by high-yield corporates and issuance of asset-backed securities (ABS) and collateralized loan obligations had slowed sharply (Figure 1.5). By contrast, high-grade issuance in the month of August rebounded. To some extent, the eco-nomic impact of any reduction in borrowing on U.S. capital investment spending may be muted, given that recent borrowing has been focused more on increasing leverage in the capital structure (through share buybacks and LBOs) than on business investment. In Europe, where there is greater reliance on bank lending, debt issuance has been less affected than in the United States. The LBO boom was less advanced in continental Europe than in the United States, so any slowing of buyout activity will have a more modest impact. However, European banks appear to have greater contingent exposures to asset-backed commercial paper (ABCP), sug-gesting one channel whereby European banks may have to tighten credit conditions more than their U.S. counterparts. Given all these consid-erations, it is unclear at this point what are the prospects for tightening credit conditions, and the consequent impact, in the United States versus Europe.
CHAPTER 1 ASSESSING RISKS TO GLOBAL FINANCIAL STABILITY
6
0 10 20 30 40 50 60 70 80
July–August 2007 (average)
January–June 2007 (average)
CLO
CMBS
High-yield corporates
Mortgage-related ABS
CDO
Other ABS
Agencies
Investment grade corporates
Sources: Bloomberg L.P.; Citigroup; and JPMorgan Chase & Co. Note: ABS = asset-backed security; CDO = collateralized debt obligation;
CMBS = commercial mortgage-backed security; CLO = collateralized loan obligation.
Figure 1.5. Gross Debt Issuance by Sector(In billions of U.S. dollars)
With respect to the impact of tighter U.S. mortgage credit, although mortgage fi nancing fl ows to the nonprime segment have slowed and tighter lending standards are likely to restrain housing activity further, strong household income growth, a high ratio of net worth to dis-posable income, and low unemployment should help households absorb some of the impact of the declines in house prices.6
Despite the continued strength of emerging market economies, global macroeconomic risks have generally increased.
This view is broadly consistent with the cur-rent baseline scenario in the October 2007 World Economic Outlook, which continues to forecast solid global growth with mostly limited infl a-tionary pressures (IMF, 2007b). The downside risks to the baseline scenario are mainly related to the knock-on effects of potentially weaker U.S. domestic demand due to the changes in fi nancial risks and market conditions discussed above, and secondarily, to a potential spike in global infl ation, which would be lessened under a scenario of slower global growth. A disorderly unwinding of global imbalances is also still a risk, particularly if foreign investors’ preferences for U.S. assets were to diminish as a result of the turmoil in fi nancial markets. Alternatively, slower U.S. growth and a depreciation of the dollar would help to lower the U.S. current account defi cit, reducing the amount of fi nanc-ing needed. These risks have increased since earlier in the year, prompting a slight increase
6Partly as a result of rising house prices, the ratio of net worth to disposable income rose to around 5#/4 timesby end-2006. A 10 percent fall in house prices, if that were to occur, would reduce household assets by around 3 percent and lower the ratio of net worth to dispos-able income to about 5½ times—roughly where it was in 2004. Although household leverage would increase further, in aggregate, declines on this scale appear manageable. However, the minority of borrowers who are overextended and lack home equity accumulation would undoubtedly face fi nancial pain. Mortgage debt as a pro-portion of total assets, as well as the debt service burden, have both been on a steady upward path in recent years as households extracted equity from their homes, and their “leverage” rose (net worth to assets fell).

7
CREDIT INDISCIPLINE IN MATURE MARKETS
0
2
4
6
8
10
12
14
16
200620052004
2003200220012000
0
0.5
1.0
1.5
2.0
2.5
3.0
3.5
Figure 1.6. Nonprime 60-Day Delinquencies byMortgage Vintage Year(In percent of original balance)
Subprime
Alt-A
0 6 12 18 24 30 36 42Months after origination
0 6 12 18 24 30 36 42 48 54 60 66 72 78 84Months after origination
48 54 60 66 72 78 84
Sources: Merrill Lynch; and Intex.
in our assessment of macroeconomic risks. By contrast, the continued strong performance of emerging market economies provides the poten-tial for further upward surprises to growth.
Credit Indiscipline in Mature Markets
The U.S. nonprime mortgage market has experienced signifi cant stress, with further deterioration likely.7
Since the April 2007 GFSR, the U.S. nonprime mortgage market has continued to suffer from rising delinquencies on principal and interest payments.8 As detailed in that report, the deterio-ration refl ects a combination of lax underwriting standards, “risk layering,” and adverse trends in employment and income in certain regions.9
Delinquencies on the 2006 vintage of subprime loans have climbed above 13 percent of the origi-nal balance, while alt-A loan delinquencies have also risen (Figure 1.6). Subprime delinquencies on the 2006 vintage have exceeded delinquen-cies on loans originated in 2000 at comparable seasoning (loan age)—the worst performing vintage in the recent past—and are expected to rise further if the historical pattern holds.10
Loans originated in 2007 do not have suffi cient
7Nonprime refers primarily to subprime and alternative-A (alt-A) mortgages. Subprime loans are typically made to borrowers with one or more of the following characteris-tics: weak credit histories that include payment delin-quencies and bankruptcies; reduced repayment capacity as measured by credit scores or debt-to-income ratios; or incomplete credit histories. Alt-A mortgages, though of higher quality than subprime mortgages, are considered lower credit quality than prime mortgages due to one or more nonstandard features related to the borrower, property, or loan.
8Other measures of mortgage credit show a similar deterioration, including early payment defaults (mort-gage loans that are more than 30 days delinquent within six months of the start of the mortgage) and foreclosures.
9“Risk layering” refers to the practice whereby mort-gage lenders combine nontraditional mortgages with weaker credit controls, for instance, by accepting high combined loan-to-value ratios, reduced documentation, and little or no downpayment.
10Delinquencies tend to peak roughly at 24 to 30 months after origination. Some market participants estimate that subprime delinquencies on the 2006 vintage will peak at 20 to 25 percent of the original balance during 2008.
CHAPTER 1 ASSESSING RISKS TO GLOBAL FINANCIAL STABILITY
8
Option adjustable rate
Subprime
Alt-A
Prime
Agency
0
5
10
15
20
25
30
35
40
45
Figure 1.7. Monthly Mortgage Rate Resets(First reset in billions of U.S. dollars)
2007 2009 2011 2013 2015
Source: Credit Suisse.
ABS CDO
Mortgage-related ABS
0
100
200
300
400
500
600
Sources: Bloomberg L.P.; and IMF staff estimates.Note: ABS = asset-backed security; CDO = collateralized debt obligation.
Figure 1.8. Rising Number of Downgrades ofMortgage-Related Products
Jan. Feb. Mar. Apr.2007
May Jun. Jul. Aug. Sep.
seasoning to gauge overall performance, but the loan attributes are similar to those issued on loans in 2006. Thus, some of the same risk layer-ing characteristics endemic to the 2006 vintage appear to have persisted at least through the fi rst half of 2007, despite reportedly tighter underwrit-ing standards.11
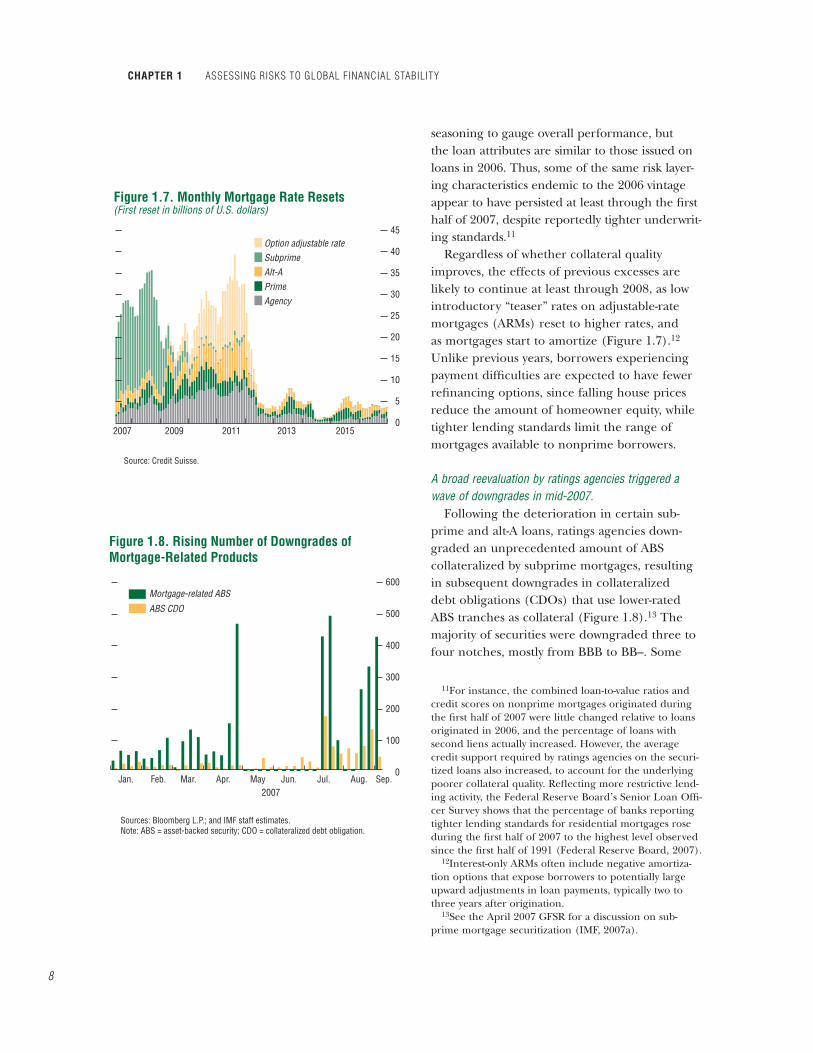
Regardless of whether collateral quality improves, the effects of previous excesses are likely to continue at least through 2008, as low introductory “teaser” rates on adjustable-rate mortgages (ARMs) reset to higher rates, and as mortgages start to amortize (Figure 1.7).12
Unlike previous years, borrowers experiencing payment diffi culties are expected to have fewer refi nancing options, since falling house prices reduce the amount of homeowner equity, while tighter lending standards limit the range of mortgages available to nonprime borrowers.
A broad reevaluation by ratings agencies triggered a wave of downgrades in mid-2007.
Following the deterioration in certain sub-prime and alt-A loans, ratings agencies down-graded an unprecedented amount of ABS collateralized by subprime mortgages, resulting in subsequent downgrades in collateralized debt obligations (CDOs) that use lower-rated ABS tranches as collateral (Figure 1.8).13 The majority of securities were downgraded three to four notches, mostly from BBB to BB–. Some
11For instance, the combined loan-to-value ratios and credit scores on nonprime mortgages originated during the fi rst half of 2007 were little changed relative to loans originated in 2006, and the percentage of loans with second liens actually increased. However, the average credit support required by ratings agencies on the securi-tized loans also increased, to account for the underlying poorer collateral quality. Refl ecting more restrictive lend-ing activity, the Federal Reserve Board’s Senior Loan Offi -cer Survey shows that the percentage of banks reporting tighter lending standards for residential mortgages rose during the fi rst half of 2007 to the highest level observed since the fi rst half of 1991 (Federal Reserve Board, 2007).
12Interest-only ARMs often include negative amortiza-tion options that expose borrowers to potentially large upward adjustments in loan payments, typically two to three years after origination.
13See the April 2007 GFSR for a discussion on sub-prime mortgage securitization (IMF, 2007a).

9
CREDIT INDISCIPLINE IN MATURE MARKETS
AAA-rated tranches were downgraded multiple notches as well. Market participants expect further downgrades as the underlying loans con-tinue to age, resets take effect, and delinquen-cies convert to foreclosures.
The ratings agencies cited various factors that contributed to the weaker-than-expected performance of mortgage loans, especially those issued in recent years, and noted, in particular, the impact of risk layering and poor data quality. These problems may have been compounded by a high incidence of fraud, resulting at least in part from limited borrower income documenta-tion, and aggressive lending practices, such as offering short-term, below-market interest rates so as to qualify borrowers.
In response, the ratings agencies revised their methodologies to include higher loss sever-ity assumptions, more severe stress tests, and increased monitoring of fraud prevention by lenders, thus effectively increasing the default risk of ABS and ABS CDOs. The agencies now estimate that home prices will fall more signifi -cantly than previously anticipated. Higher esti-mates of the magnitude of home price declines suggest lower recovery and higher losses from foreclosures. The agencies are also increasing loss estimates on loans that are not yet delin-quent and are assuming lower prepayments from underlying mortgage loans, and therefore lower protection for subordinated securities.
Even with these changes, there remain broader problems with the structured credit product rating methodologies and processes.
First, structured credit products are likely to suffer more severe, multiple-notch downgrades relative to the typically smoother downgrade paths of corporate bonds, which calls into ques-tion the use of corporate bond rating scales.14
Second, the assumptions regarding the default correlations on mortgages in the ABS and CDO collateral pools can signifi cantly
14See Violi (2004) for an analysis of structured credit product credit rating migration risk, and Fender and Mitchell (2005) for a discussion of how CDO structural risk increases the potential for multi-notch downgrades.
affect their value.15 The higher the correlation, the more likely defaults are to impact senior tranches, so if the correlation assumption is too low, the AAA and AA tranches could be over-rated. While ratings agencies typically assume higher correlations for subprime mortgages than for other typical CDO assets (e.g., corpo-rate bonds and loans), some analysts question whether they are high enough. Little empiri-cal work has been done on this issue, largely because the market is too young to provide suffi cient data.
Third, in the case of ABS CDOs, the ratings agencies assess credit risk based on default prob-abilities and loss severities associated with the rated ABS rather than the underlying mort-gages. Thus, the CDO rating reaction to deterio-rating underlying mortgage performance may be delayed by the need to await the downgrades of the component ABS and an analysis of the CDOs’ often complex cash fl ow dynamics.
Finally, credit ratings evaluate only default risk, and not market or liquidity risks, and this seems to have been underappreciated by many investors.
Loss estimates are highly uncertain.Even before the series of ratings down-
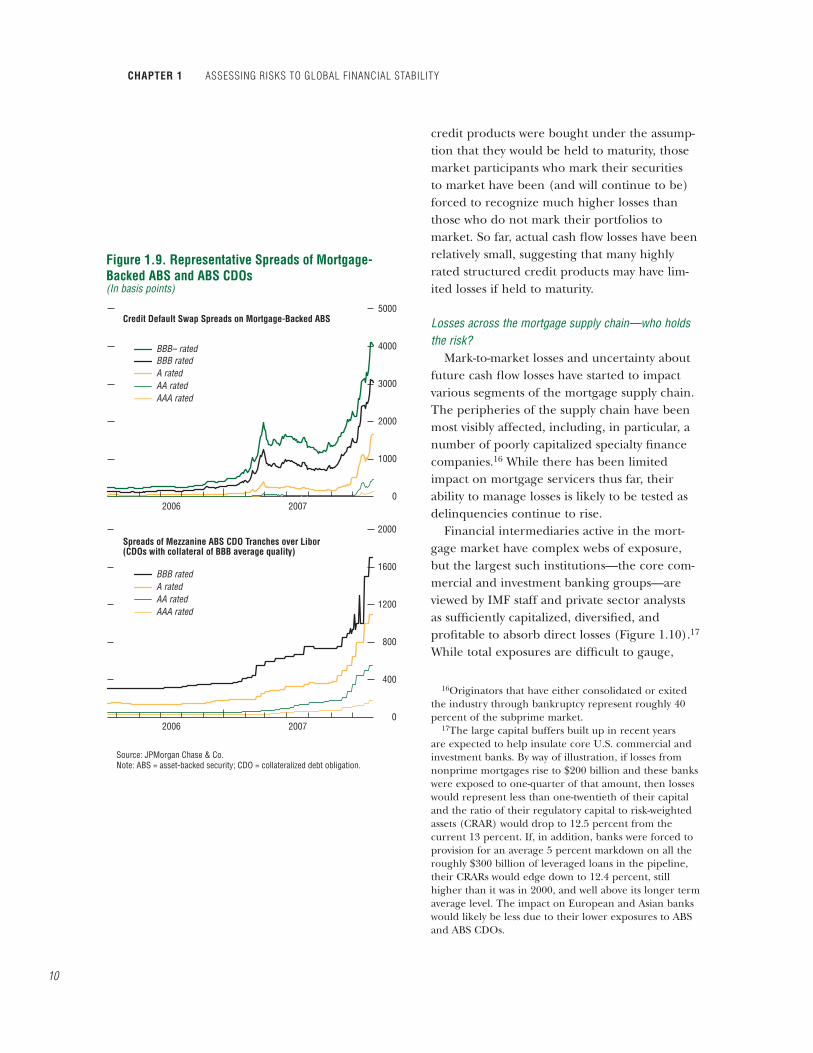
grades occurred, market participants began to increase their expectations for nonprime mortgage-related losses. This was refl ected in a pronounced widening in cash and CDS spreads on ABS and CDOs backed by recently originated subprime mortgages, beginning in early 2007. Spreads have since widened across the capital structure, especially on lower-rated ABS and ABS CDO tranches, but also on AAA-rated senior tranches (Figure 1.9). Implied losses based on these spreads total roughly $200 billion, exceed-ing the high end of estimated realized losses by roughly $30 billion—an indication that market uncertainty and liquidity concerns may have pushed down prices further than warranted by fundamentals (Box 1.1). While many structured
15Default correlation measures the extent to which defaults are expected to occur in clusters.
CHAPTER 1 ASSESSING RISKS TO GLOBAL FINANCIAL STABILITY
10
0
1000
2000
3000
4000
5000
AAA ratedAA ratedA ratedBBB rated
AAA ratedAA ratedA ratedBBB rated
BBB– rated
0
400
800
1200
1600
2000
Source: JPMorgan Chase & Co.Note: ABS = asset-backed security; CDO = collateralized debt obligation.
Figure 1.9. Representative Spreads of Mortgage-Backed ABS and ABS CDOs(In basis points)
Credit Default Swap Spreads on Mortgage-Backed ABS
Spreads of Mezzanine ABS CDO Tranches over Libor(CDOs with collateral of BBB average quality)
2006 2007
2006 2007
credit products were bought under the assump-tion that they would be held to maturity, those market participants who mark their securities to market have been (and will continue to be) forced to recognize much higher losses than those who do not mark their portfolios to market. So far, actual cash fl ow losses have been relatively small, suggesting that many highly rated structured credit products may have lim-ited losses if held to maturity.
Losses across the mortgage supply chain—who holds the risk?
Mark-to-market losses and uncertainty about future cash fl ow losses have started to impact various segments of the mortgage supply chain. The peripheries of the supply chain have been most visibly affected, including, in particular, a number of poorly capitalized specialty fi nance companies.16 While there has been limited impact on mortgage servicers thus far, their ability to manage losses is likely to be tested as delinquencies continue to rise.
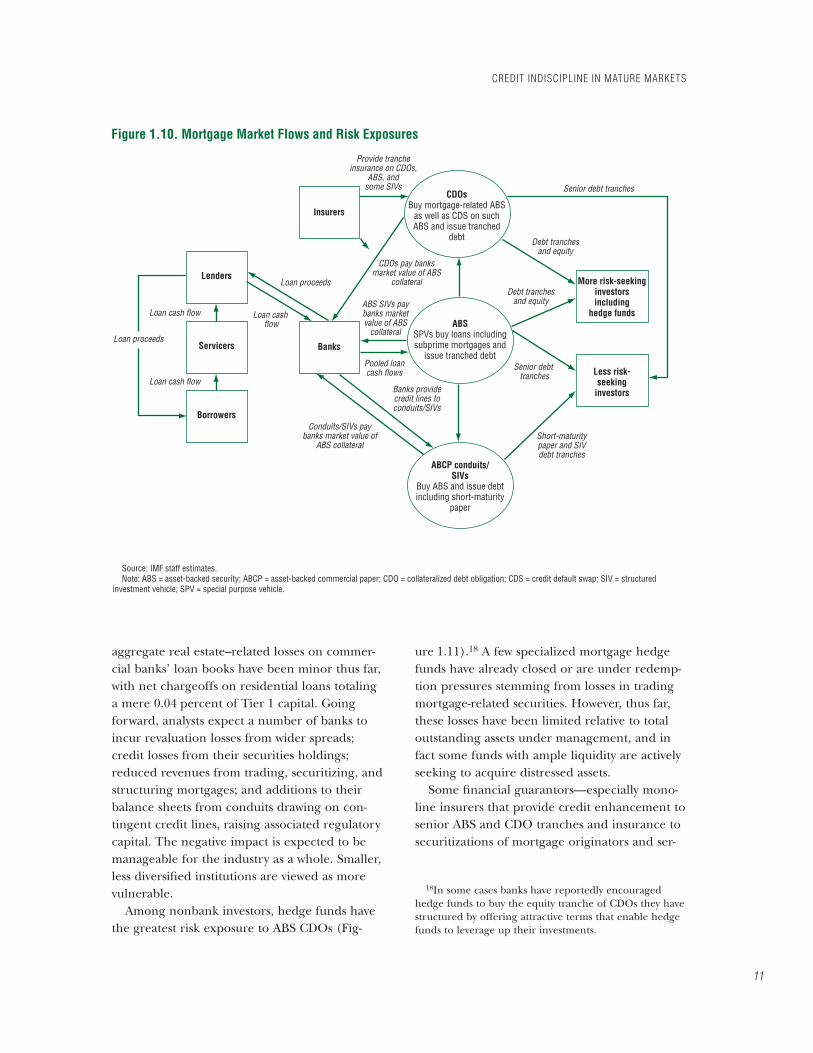
Financial intermediaries active in the mort-gage market have complex webs of exposure, but the largest such institutions—the core com-mercial and investment banking groups—are viewed by IMF staff and private sector analysts as suffi ciently capitalized, diversifi ed, and profi table to absorb direct losses (Figure 1.10).17
While total exposures are diffi cult to gauge,
16Originators that have either consolidated or exited the industry through bankruptcy represent roughly 40 percent of the subprime market.
17The large capital buffers built up in recent years are expected to help insulate core U.S. commercial and investment banks. By way of illustration, if losses from nonprime mortgages rise to $200 billion and these banks were exposed to one-quarter of that amount, then losses would represent less than one-twentieth of their capital and the ratio of their regulatory capital to risk-weighted assets (CRAR) would drop to 12.5 percent from the current 13 percent. If, in addition, banks were forced to provision for an average 5 percent markdown on all the roughly $300 billion of leveraged loans in the pipeline, their CRARs would edge down to 12.4 percent, still higher than it was in 2000, and well above its longer term average level. The impact on European and Asian banks would likely be less due to their lower exposures to ABS and ABS CDOs.
11
CREDIT INDISCIPLINE IN MATURE MARKETS
Lenders
Servicers
Loan cash flow Loan cash flow
Pooled loancash flows
Conduits/SIVs paybanks market value of
ABS collateral
Banks providecredit lines toconduits/SIVs
ABS SIVs paybanks marketvalue of ABS
collateral
CDOs pay banksmarket value of ABS
collateral
Loan cash flow
Loan proceeds
Loan proceeds
Senior debt tranches
Senior debt tranches
Short-maturitypaper and SIVdebt tranches
Debt tranchesand equity
Debt tranchesand equity
Provide trancheinsurance on CDOs,
ABS, andsome SIVs
Borrowers
Insurers
CDOsBuy mortgage-related ABS
as well as CDS on suchABS and issue tranched
debt
ABSSPVs buy loans includingsubprime mortgages and
issue tranched debt
ABCP conduits/SIVs
Buy ABS and issue debtincluding short-maturity
paper
Banks
Less risk-seeking
investors
More risk-seekinginvestorsincluding
hedge funds
Figure 1.10. Mortgage Market Flows and Risk Exposures
Source: IMF staff estimates.Note: ABS = asset-backed security; ABCP = asset-backed commercial paper; CDO = collateralized debt obligation; CDS = credit default swap; SIV = structured
investment vehicle; SPV = special purpose vehicle.
aggregate real estate–related losses on commer-cial banks’ loan books have been minor thus far, with net chargeoffs on residential loans totaling a mere 0.04 percent of Tier 1 capital. Going forward, analysts expect a number of banks to incur revaluation losses from wider spreads; credit losses from their securities holdings; reduced revenues from trading, securitizing, and structuring mortgages; and additions to their balance sheets from conduits drawing on con-tingent credit lines, raising associated regulatory capital. The negative impact is expected to be manageable for the industry as a whole. Smaller, less diversifi ed institutions are viewed as more vulnerable.
Among nonbank investors, hedge funds have the greatest risk exposure to ABS CDOs (Fig-
ure 1.11).18 A few specialized mortgage hedge funds have already closed or are under redemp-tion pressures stemming from losses in trading mortgage-related securities. However, thus far, these losses have been limited relative to total outstanding assets under management, and in fact some funds with ample liquidity are actively seeking to acquire distressed assets.
Some fi nancial guarantors—especially mono-line insurers that provide credit enhancement to senior ABS and CDO tranches and insurance to securitizations of mortgage originators and ser-
18In some cases banks have reportedly encouraged hedge funds to buy the equity tranche of CDOs they have structured by offering attractive terms that enable hedge funds to leverage up their investments.

CHAPTER 1 ASSESSING RISKS TO GLOBAL FINANCIAL STABILITY
12
vicers—are also exposed to the downturn in the mortgage market. While the net par exposure of the industry as a whole to mortgage originators’ and servicers’ assets appears to be limited, and capital suffi cient, fi nancial guarantor exposure could have important implications for broader
structured credit markets and the market for municipal bonds.19
19See Fitch Ratings (2007a) and Standard & Poor’s (2007a). There is a high concentration of fi nancial guar-antors referenced in synthetic corporate CDOs. Financial guarantors also play a key role in U.S. municipal bond markets through the provision of default insurance.
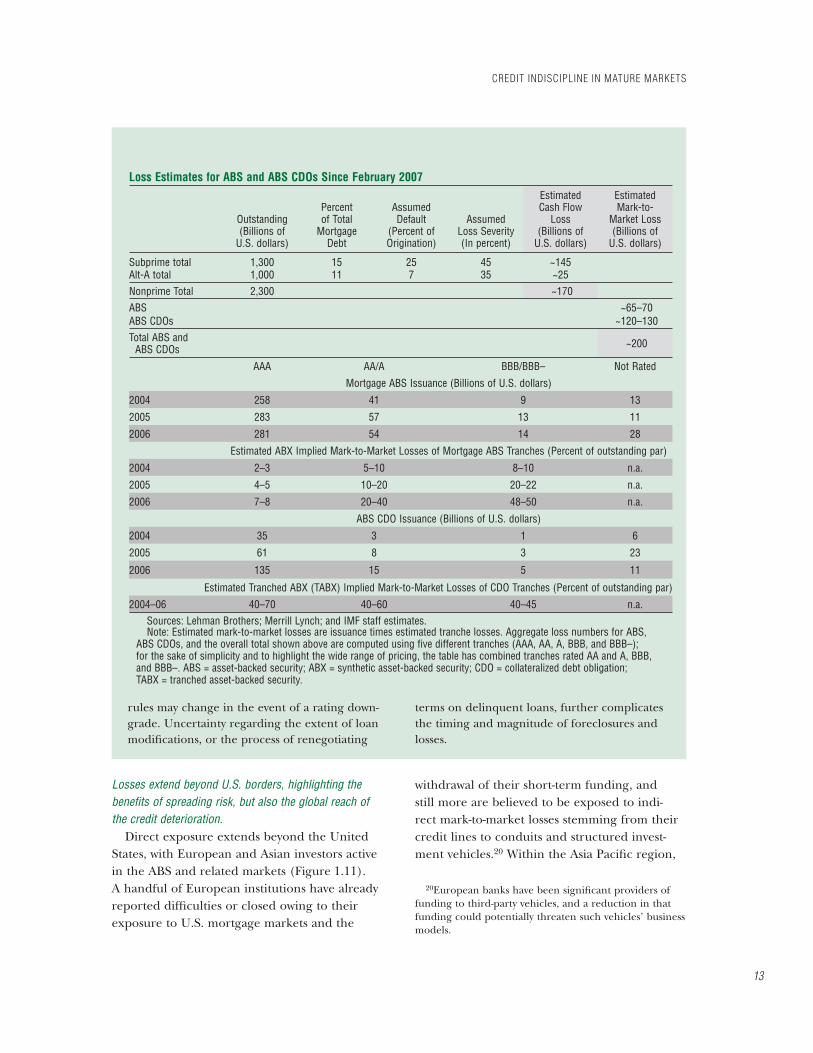
This box presents the loss estimates on U.S. subprime and alt-A mortgages based on two approaches. The first estimates losses over the lifetimes of the mortgages, and the second estimates mark-to-market losses.
Loss estimates on mortgages vary consider-ably, in part due to the different assumptions about inputs and differences in valuation methods. The top panel of the table estimates lifetime losses based on a scenario in which house prices decline by 5 percent over the fi rst year and then stabilize.1 In this scenario, 25 percent of the subprime mortgages and 7 percent of the alt-A mortgages are assumed to eventually default, and average loss severities (amounts ultimately not received) are assumed to be, respectively, 45 and 35 percent. Of the resulting $170 billion of estimated losses, about 25 percent would be directly absorbed by the banking system, and the other $130 billion by ABS and ABS CDOs.
The lower panel estimates the mark-to-market losses since February 2007 on all outstand-ing nonprime mortgage-related securities. Admittedly, they might represent worst-case devaluations, because they assume that all ABS and ABS CDOs issued in 2004 through 2006 remain outstanding, ignoring the impact of prepayments and defaults. Also, the securities are priced off ABX indices (for the ABS) and TABX tranches (for the ABS CDOs), which may
Note: This box was authored by John Kiff and Mustafa Saiyid.
1Potential losses on nonprime mortgages tend to be highly correlated with the path of future house prices, so assumptions on house prices are a key input to forecasted losses.
represent worst-case prices.2 On the other hand, the estimates do not include potential losses on nonprime mortgage-backed synthetic CDOs, which are diffi cult to estimate given the opacity of these markets. However, keeping all of this in mind, the table estimates mark-to- market losses of about $200 billion.
In addition to differences in input assump-tions and valuation methods, other factors increase the uncertainty of the magnitude and timing of estimated losses. The magnitude of losses is uncertain because delinquencies on recently originated nonprime loans signifi -cantly exceed the prior trend, making historical relationships of limited use. The proliferation of various derivations of mortgage securities, including ABS CDOs, CDOs of CDOs, CDS on CDOs, etc., each with unique cash fl ow distri-bution rules, further complicates the process of calculating the impact of collateral losses on securities.3 The timing of cash fl ow losses is similarly uncertain, since structured securities tend to delay the transmission of losses from the underlying collateral, and cash fl ow distribution
2The ABX is an index of credit default swaps linked to 20 underlying subprime mortgages. The TABX is an index that tranches synthetic CDOs based on the BBB- and BBB ABX indices. The TABX is fairly illiquid, and does not refl ect the impact of collateral management on the cash ABS and ABS CDOs being priced in the table. In fact, analysis has shown that ABS CDO collateral managers have minimized expo-sure to the worst-performing 2006 vintages.
3For instance, the impact of loan losses on cash fl ows to these securities is reduced by credit enhancement mechanisms, such as subordination of securities, excess servicing, over-collateralization, and credit insurance.
Box 1.1. Estimates of Nonprime Mortgage Losses
13
Losses extend beyond U.S. borders, highlighting the benefi ts of spreading risk, but also the global reach of the credit deterioration.
Direct exposure extends beyond the United States, with European and Asian investors active in the ABS and related markets (Figure 1.11).A handful of European institutions have already reported diffi culties or closed owing to their exposure to U.S. mortgage markets and the
withdrawal of their short-term funding, and still more are believed to be exposed to indi-rect mark-to-market losses stemming from their credit lines to conduits and structured invest-ment vehicles.20 Within the Asia Pacifi c region,
20European banks have been signifi cant providers of funding to third-party vehicles, and a reduction in that funding could potentially threaten such vehicles’ business models.
CREDIT INDISCIPLINE IN MATURE MARKETS
rules may change in the event of a rating down-grade. Uncertainty regarding the extent of loan modifi cations, or the process of renegotiating
terms on delinquent loans, further complicates the timing and magnitude of foreclosures and losses.
Loss Estimates for ABS and ABS CDOs Since February 2007
Outstanding(Billions of
U.S. dollars)
Percent of Total
MortgageDebt
AssumedDefault
(Percent of Origination)
AssumedLoss Severity (In percent)
EstimatedCash Flow
Loss(Billions of
U.S. dollars)
EstimatedMark-to-
Market Loss (Billions of
U.S. dollars)
Subprime total 1,300 15 25 45 ~145 Alt-A total 1,000 11 7 35 ~25 Nonprime Total 2,300 ~170 ABS ~65–70 ABS CDOs ~120–130 Total ABS and ABS CDOs ~200
AAA AA/A BBB/BBB– Not Rated
Mortgage ABS Issuance (Billions of U.S. dollars)
2004 258 41 9 13
2005 283 57 13 11
2006 281 54 14 28
Estimated ABX Implied Mark-to-Market Losses of Mortgage ABS Tranches (Percent of outstanding par)
2004 2–3 5–10 8–10 n.a.
2005 4–5 10–20 20–22 n.a.
2006 7–8 20–40 48–50 n.a.
ABS CDO Issuance (Billions of U.S. dollars)
2004 35 3 1 6
2005 61 8 3 23
2006 135 15 5 11
Estimated Tranched ABX (TABX) Implied Mark-to-Market Losses of CDO Tranches (Percent of outstanding par)
2004–06 40–70 40–60 40–45 n.a.Sources: Lehman Brothers; Merrill Lynch; and IMF staff estimates.Note: Estimated mark-to-market losses are issuance times estimated tranche losses. Aggregate loss numbers for ABS,
ABS CDOs, and the overall total shown above are computed using five different tranches (AAA, AA, A, BBB, and BBB–); for the sake of simplicity and to highlight the wide range of pricing, the table has combined tranches rated AA and A, BBB, and BBB–. ABS = asset-backed security; ABX = synthetic asset-backed security; CDO = collateralized debt obligation; TABX = tranched asset-backed security.

CHAPTER 1 ASSESSING RISKS TO GLOBAL FINANCIAL STABILITY
14
various market analyses suggest that exposure to mortgage-related products is concentrated in Japan, Australia, Taiwan Province of China, and Korea, but their overall exposure has been char-acterized as manageable and that region appears to be insulated from default risk.21
There has been a parallel weakening of credit discipline in the corporate segment…
There are similarities between the credit weak-ening in the nonprime mortgage market and that in the leveraged loan market (Table 1.1). This weakening, by extension, affects the market for CLOs, structured fi nance vehicles managed to invest primarily in senior leveraged loans (Figure 1.12).22 The current leveraged buyout boom entered a new, more aggressive phase in 2006 that intensifi ed in early 2007.
Underwriters and debt markets continued to increase leverage. Leverage levels rose to eight to 10 times EBITDA and purchase price-to-earnings ratios were in excess of 10.23
21See Standard & Poor’s (2007b); and Moody’s (2007).22A leveraged loan is typically defi ned as any loan that
has a debt rating below Baa3/BBB– from Moody’s and Standard & Poor’s, respectively, has a debt-to-EBITDA ratio of 3.0 times or greater, and tends to be priced at least 125 basis points over LIBOR at issue. (EBITDA stands for earn-ings before interest, taxes, depreciation, and amortization.) As detailed in the April 2007 GFSR, the expansion in the leveraged loan market has been in part driven by the matu-ration of the CLO market. Instead of retaining leveraged loans to fund buyouts on its balance sheet, a bank can sell such loans into the CLO market, thus freeing up capital to extend new loans to other private equity fi rms.
23Previously, leverage levels averaged about 4.5 times and average purchase price multiples were about 7.5 times. By late 2005, many observers thought such levels had gone as high as they safely could.
Analogous to the innovation in the nonprime mortgage market, fi nancing innovations—such as covenant-lite loans and incurrence cove-nants24—allowed more marginal fi rms to be con-sidered as targets, and encouraged deal sponsors to buy companies at higher earnings multiples. By the second quarter of 2007, more than a third of the companies that were the subject of buyout deals were rated split-B or below (rated B or lower by two ratings agencies), and around 30 percent of leveraged loans were covenant-lite (Figure 1.13).
…exposing banks to increased underwriting, marketing, and syndication risks, as short-term risks and uncer-tainty have increased and the pipeline of LBO deals has swelled.
As credit market strains emerged over the summer of 2007, lenders began to demand better terms, and spreads on leveraged loans, high-yield bonds, and related derivative indices widened sharply, prompting the postponement of several pending deals. Secondary market trading of leveraged loans weakened, with many deals trading at a signifi cant discount to their issue prices (Figure 1.14). An estimated $300 billion of leveraged loans was planned
24Unlike traditional covenants (called “maintenance covenants”), incurrence-only loans are similar to those in high-yield bonds in that the company is only in default if it breaches the set threshold and takes some deliberate corporate action that exacerbates the situation. For exam-ple, a company could have fallen below the minimum cash set out in its cash interest cover ratio covenant, but, were it an incurrence covenant, would only be in breach if it subsequently issued a dividend, or raised additional borrowing.
Table 1.1. Weakening Discipline in Subprime Lending Mirrored in Leveraged BuyoutsSubprime Leveraged Buyouts
Higher loan-to-value ratios Higher debt/EBITDA
Interest-only, negative amortizing loans Covenant-lite and pay-in-kind toggle notes
Cash-out refinancing Dividend re-cap
Zero percent down Lenders providing equity bridges
Home price appreciation Purchase multiple expansion
Source: IMF staff estimates.Note: EBITDA = earnings before interest, taxes, depreciation, and amortization.
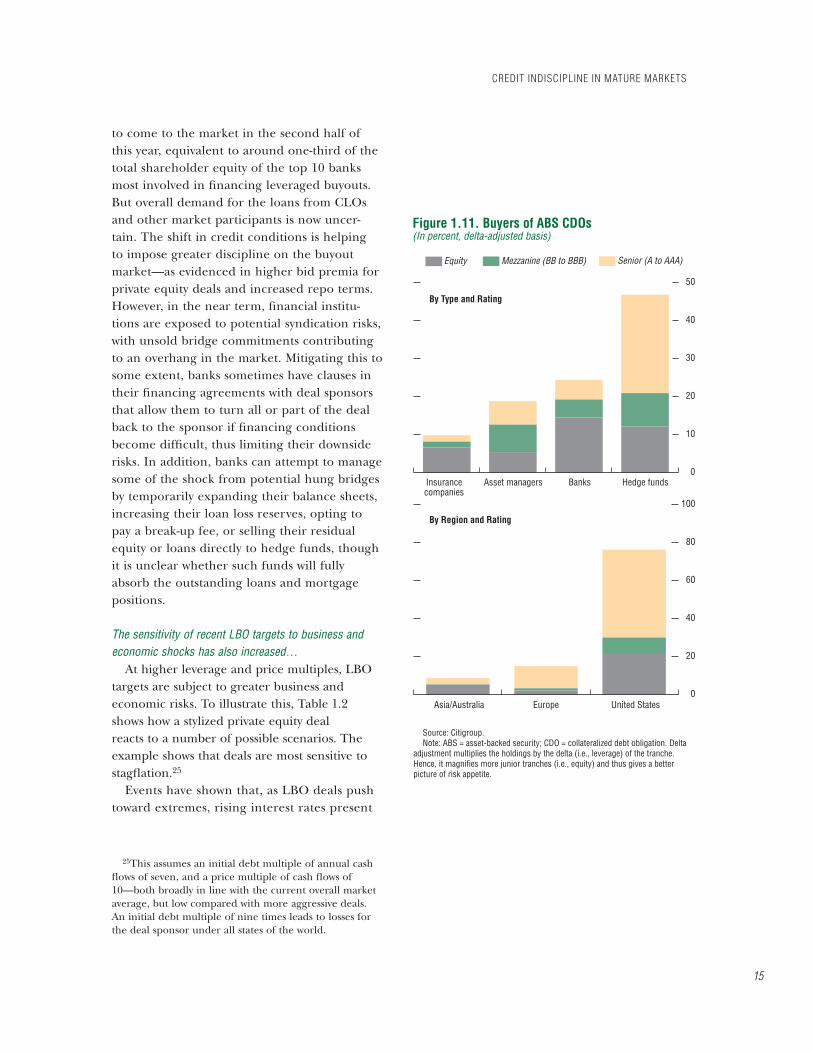
15
CREDIT INDISCIPLINE IN MATURE MARKETS
0
10
20
30
40
50
Senior (A to AAA)Mezzanine (BB to BBB)Equity
0
20
40
60
80
100
Source: Citigroup.Note: ABS = asset-backed security; CDO = collateralized debt obligation. Delta
adjustment multiplies the holdings by the delta (i.e., leverage) of the tranche. Hence, it magnifies more junior tranches (i.e., equity) and thus gives a better picture of risk appetite.
Figure 1.11. Buyers of ABS CDOs(In percent, delta-adjusted basis)
By Type and Rating
By Region and Rating
Insurancecompanies
Asia/Australia Europe United States
Asset managers Banks Hedge funds
to come to the market in the second half of this year, equivalent to around one-third of the total shareholder equity of the top 10 banks most involved in fi nancing leveraged buyouts. But overall demand for the loans from CLOs and other market participants is now uncer-tain. The shift in credit conditions is helping to impose greater discipline on the buyout market—as evidenced in higher bid premia for private equity deals and increased repo terms. However, in the near term, fi nancial institu-tions are exposed to potential syndication risks, with unsold bridge commitments contributing to an overhang in the market. Mitigating this to some extent, banks sometimes have clauses in their fi nancing agreements with deal sponsors that allow them to turn all or part of the deal back to the sponsor if fi nancing conditions become diffi cult, thus limiting their downside risks. In addition, banks can attempt to manage some of the shock from potential hung bridges by temporarily expanding their balance sheets, increasing their loan loss reserves, opting to pay a break-up fee, or selling their residual equity or loans directly to hedge funds, though it is unclear whether such funds will fully absorb the outstanding loans and mortgage positions.
The sensitivity of recent LBO targets to business and economic shocks has also increased…
At higher leverage and price multiples, LBO targets are subject to greater business and economic risks. To illustrate this, Table 1.2 shows how a stylized private equity deal reacts to a number of possible scenarios. The example shows that deals are most sensitive to stagfl ation.25
Events have shown that, as LBO deals push toward extremes, rising interest rates pre sent
25This assumes an initial debt multiple of annual cash fl ows of seven, and a price multiple of cash fl ows of 10—both broadly in line with the current overall market average, but low compared with more aggressive deals. An initial debt multiple of nine times leads to losses for the deal sponsor under all states of the world.

CHAPTER 1 ASSESSING RISKS TO GLOBAL FINANCIAL STABILITY
16
95
96
97
98
99
100
101
102
Europe
United States
Sources: Markit Loans; and Standard & Poor’s Leveraged Commentary & Data.Note: Pricing for commonly traded loans.
Figure 1.14. Average Bid Price for U.S. and EuropeanLeveraged Loans
2002 03 04 05 06 07
Source: Credit Suisse.Note: CDO = collateralized debt obligation; ABS = asset-backed security; CLO =
collateralized loan obligation. CDOs are defined as high-grade or mezzanine on the basis of the average rating of the underlying collateral. The collateral of high-grade CDOs is usually rated AA/A while that of mezzanine CDOs is BBB. CDO-squared entities are those CDOs whose collateral includes tranches of other CDOs.
Figure 1.12. U.S. CDO Outstanding Volume($900 billion through July 2007)
Mezzanine ABS CDOs$159 billion
17%
CDO-squared$28 billion
3%
Other CDOs$265 billion
29%
CLOs$270 billion
30%
High-grade ABS CDOs$189 billion
21%
0
2
4
6
8
10
12
14
Source: Standard & Poor’s Leveraged Commentary & Data.1First half of 2007.
Figure 1.13. Number of Covenant-Lite Loans toTotal Number of Institutional Term Loans(In percent)
1997 99 2001 03 05 0710
0.5
1.0
1.5
2.0
2.5
3.0
3.5
4.0
1997 99 2001 03 05 07Q1
07Q2
Source: Standard & Poor’s Leveraged Commentary & Data.Note: EBITDA = earnings before interest, tax, depreciation, and amortization.
Figure 1.15. Interest Coverage Statistics on PrivateEquity(U.S. deals with cash flows [EBITDA] greater than $50 million)
Ratio of cash flows to cash interest payments
Ratio of cash flows after capital expendituresto cash interest payments
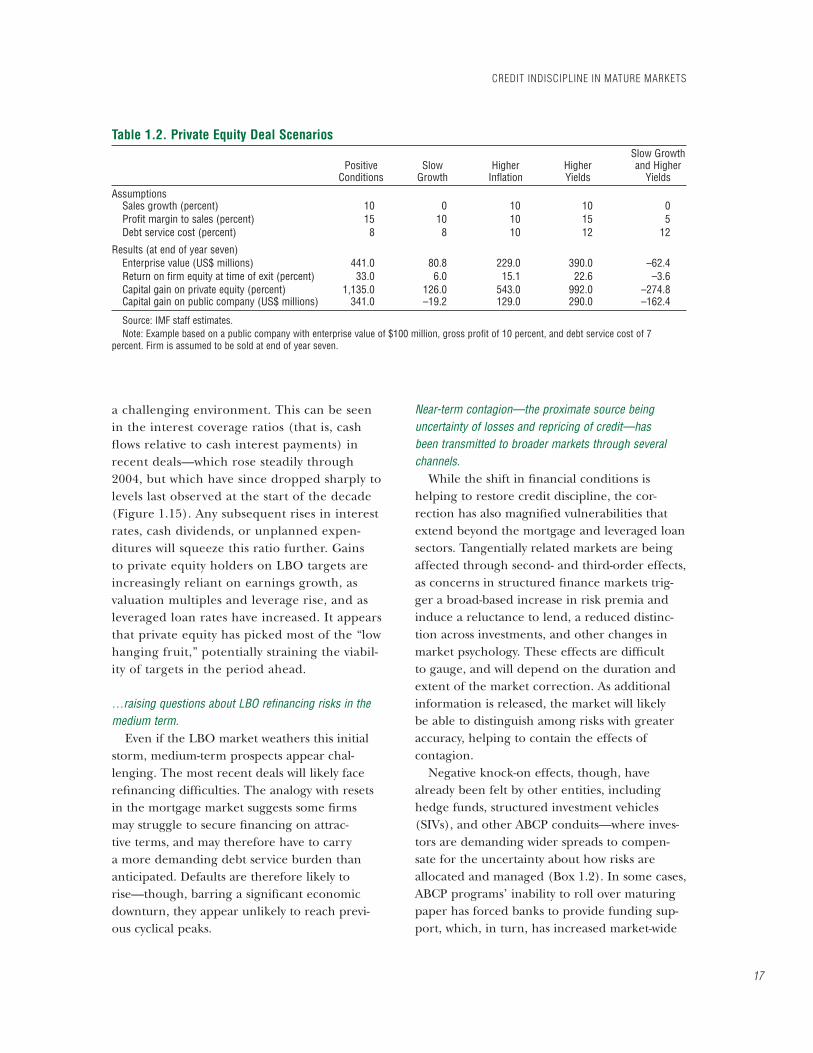
17
a challenging environment. This can be seen in the interest coverage ratios (that is, cash fl ows relative to cash interest payments) in recent deals—which rose steadily through 2004, but which have since dropped sharply to levels last observed at the start of the decade (Figure 1.15). Any subsequent rises in interest rates, cash dividends, or unplanned expen-ditures will squeeze this ratio further. Gains to private equity holders on LBO targets are increasingly reliant on earnings growth, as valuation multiples and leverage rise, and as leveraged loan rates have increased. It appears that private equity has picked most of the “low hanging fruit,” potentially straining the viabil-ity of targets in the period ahead.
…raising questions about LBO refi nancing risks in the medium term.
Even if the LBO market weathers this initial storm, medium-term prospects appear chal-lenging. The most recent deals will likely face refi nancing diffi culties. The analogy with resets in the mortgage market suggests some fi rms may struggle to secure fi nancing on attrac-tive terms, and may therefore have to carry a more demanding debt service burden than anticipated. Defaults are therefore likely to rise—though, barring a signifi cant economic downturn, they appear unlikely to reach previ-ous cyclical peaks.
Near-term contagion—the proximate source being uncertainty of losses and repricing of credit—has been transmitted to broader markets through several channels.
While the shift in fi nancial conditions is helping to restore credit discipline, the cor-rection has also magnifi ed vulnerabilities that extend beyond the mortgage and leveraged loan sectors. Tangentially related markets are being affected through second- and third-order effects, as concerns in structured fi nance markets trig-ger a broad-based increase in risk premia and induce a reluctance to lend, a reduced distinc-tion across investments, and other changes in market psychology. These effects are diffi cult to gauge, and will depend on the duration and extent of the market correction. As additional information is released, the market will likely be able to distinguish among risks with greater accuracy, helping to contain the effects of contagion.
Negative knock-on effects, though, have already been felt by other entities, including hedge funds, structured investment vehicles (SIVs), and other ABCP conduits—where inves-tors are demanding wider spreads to compen-sate for the uncertainty about how risks are allocated and managed (Box 1.2). In some cases, ABCP programs’ inability to roll over maturing paper has forced banks to provide funding sup-port, which, in turn, has increased market-wide
CREDIT INDISCIPLINE IN MATURE MARKETS
Table 1.2. Private Equity Deal Scenarios
PositiveConditions
SlowGrowth
HigherInflation
HigherYields
Slow Growth and Higher
YieldsAssumptions
Sales growth (percent) 10 0 10 10 0Profit margin to sales (percent) 15 10 10 15 5Debt service cost (percent) 8 8 10 12 12
Results (at end of year seven) Enterprise value (US$ millions) 441.0 80.8 229.0 390.0 –62.4Return on firm equity at time of exit (percent) 33.0 6.0 15.1 22.6 –3.6Capital gain on private equity (percent) 1,135.0 126.0 543.0 992.0 –274.8Capital gain on public company (US$ millions) 341.0 –19.2 129.0 290.0 –162.4
Source: IMF staff estimates.Note: Example based on a public company with enterprise value of $100 million, gross profit of 10 percent, and debt service cost of 7
percent. Firm is assumed to be sold at end of year seven.

CHAPTER 1 ASSESSING RISKS TO GLOBAL FINANCIAL STABILITY
18
The deterioration in the mortgage market has magnified funding difficulties in the short-term credit market. This box discusses the key entities that issue asset-backed commercial paper and the vehicles most vulnerable to the reduction in liquidity in that market.
Similar to asset-backed securities (ABS), asset-backed commercial paper (ABCP) programs repackage pools of assets into special purpose vehicles that are funded by issuing short-maturity debt. These vehicles use the proceeds from the debt to fund purchases of fi nancial assets. The three most common vehicles are traditional conduits, which generally use the debt to fi nance receivables, leases, and loans; structured investment vehicles (SIVs), which buy mainly longer-maturity corporate bonds and lower-rated structured credit products; and security arbitrage conduits (SACs), which use the debt proceeds to invest in highly rated struc-tured credit. Unlike conduits, SIVs and SACs are tranched: any losses are fi rst absorbed by equity holders, and only subsequently by holders of medium-term notes and commercial paper.
As of early September 2007, the size of the U.S. dollar–denominated ABCP market was around $1 trillion, representing more than one-half of the outstanding commercial paper market, though outstandings dropped in the weeks that followed. ABCP-funded conduits and SIVs have been especially popular among banks in North America and Europe, in part due to the potential reduction in required regulatory capital on highly rated instruments.1
Most ABCP programs have well-diversifi ed assets, but some have signifi cant mortgage-related exposure. Conduits have about an 11 percent exposure to mortgage loans and a further 11 percent exposure to ABS securities, some of which are mortgage-related securities.
Note: This box was authored by John Kiff and Mustafa Saiyid.
1Vaguely defi ned clauses governing funding arrangements for some ABCP vehicles were partly responsible for recent rollover failures in Canada. At issue was the defi nition of a “general market disrup-tion” that resulted in bank funding requests of some Canadian ABCP issuers being denied.
SIVs and SACs have about a 20 to 25 percent exposure to residential mortgage-related securi-ties and an 11 percent exposure to collateral-ized debt obligations (CDOs), some of which may be mortgage-related CDOs. A subset of SIVs—SIV lites—are almost entirely invested in mortgage-related securities. The mort-gage-related exposure is diversifi ed globally, including the United States, United Kingdom, Germany, Australia, and the Netherlands.
ABCP programs face important liquidity risks.2 If an ABCP program cannot roll over or extend commercial paper coming due, it must achieve some sort of short-term fi nancing or else dissolve itself and sell the underlying assets. In some cases, this risk is mitigated by having backstop funding arrangements. The avail-ability of a liquidity provider does not prevent the assets from being sold, but it gives time to achieve an orderly liquidation.
A loss of market liquidity in the market for U.S. mortgage-related credit was largely to blame for diffi culties in rolling maturing ABCP, prompting a sharp widening in spreads. Down-grades and lower mark-to-market valuations of the underlying collateral further compounded
2The maturity of such short-term debt averages 45 days but can be as long as 364 days (or more in the case of “extendible” commercial paper).
Box 1.2. Concerns in the Asset-Backed Commercial Paper Market
0
50
100
150
200
250
300
2005 2006 2007
Asset-backed
Dealer commercial paper
Commercial Paper Spreads(30-day paper, in basis points over repo rate)
Source: Bloomberg L.P.

19
funding pressures, calling for a broadening of allowable collateral and extraordinary liquid-ity injections from central banks (Figure 1.16). To some extent, these legal structures have transformed credit risk into counterparty and funding risk. For example, some of the risk that is transferred out of the banking system to
hedge funds could return to the system as prime broker counterparty risks. Similarly, risks trans-ferred to SIVs and other conduits are return-ing to the banking system via funding support facilities.
In addition, concerns regarding “ratings migration” have channeled uncertainty to a
CREDIT INDISCIPLINE IN MATURE MARKETS
diffi culties. SIVs and SACs tend to be more vulnerable to losses resulting from forced liqui-dation of assets than conduits. First, any losses from forced liquidation of underlying assets are magnifi ed to holders of equity in SIVs and SACs as a result of leverage.3 In this respect, they are similar to CDOs, though with lower lever-age. Second, SIVs and SACs are more heavily exposed to mortgage-related collateral—the key source of market concern—compared with other types of vehicles.
3Any losses from liquidation are fi rst absorbed by equity holders of the SIV and subsequently by subordi-nated notes before they reach the commercial paper, the most senior liability.
Diffi culties in the ABCP market have the potential to impact capital markets broadly, as has been amply demonstrated by recent bank liquidity problems. Bank exposure to some CDOs may have been transferred to off-balance-sheet conduits, but bank credit lines to those conduits will likely put risk back onto bank bal-ance sheets. As a result of short-term illiquidity, some banks could become insolvent, requiring bailouts. In addition, market uncertainty about the size of potential losses for holders of com-mercial paper could lead to redemptions from money market funds that hold mostly commer-cial paper. The market for super-senior tranches of corporate CDOs could be affected, as these securities are typically purchased by conduits.
Key Types of Asset-Backed CommercialPaper Vehicles
Sources: Bank for International Settlements; JPMorgan Chase & Co.; and IMF staff estimates.
Note: Outstanding par of global asset-backed commercial paper. SIVs (structured investment vehicles) are short-term liabilities only.
1Approximately, United States, $1,000 billion; Europe, $300 billion; and Canada, $100 billion.
Asset-Backed Commercial Paper
˜ $1,400 billion1
Cash Flow Structures
Conduits
˜ $1,100 billionSIVs
˜ $100 billionSecurityArbitrageConduits
$200 billion
Mark-to-Market Structures
SIV Lite
˜ $10–15billion
800
900
1000
1100
1200
Jan Feb Mar Apr May Jun Jul Aug
Asset-backed
Nonasset-backed
U.S. Commercial Paper Outstanding, 2007(In billions of U.S. dollars)
Source: Board of Governors of the Federal Reserve System.

CHAPTER 1 ASSESSING RISKS TO GLOBAL FINANCIAL STABILITY
20
broad range of rated products. The ratings agen-cies acknowledged signifi cant failures in their ABS and ABS CDO models, assumptions, and methodologies, and this sparked concern that such failures may extend to the broader struc-tured fi nance market, introducing uncertainty regarding the validity of other ratings.
The forced unwinding of leverage in an envi-ronment of reduced market liquidity represents another means through which volatility is trans-mitted across markets (see Chapter 2). A modest decline in value can have a dramatic impact on a portfolio that layers leverage on top of products that already have embedded leverage. For instance, in the simple hypothetical example in Table 1.3, a small loss in value can force funds to sell large amounts of assets as liquida-tions to meet margin calls and, simultaneously, their redemptions, increase.26 Such “fi re sales” could lead to vicious circles of forced sales, as the widening of spreads forces hedge funds and others who mark portfolios to market to post losses, possibly sparking investor withdrawals and further forced sales. Already, the liquidations of several hedge funds with high concentrations of exposure to mortgage credit have increased the risk of further margin calls, in turn spark-ing a spiral of widening spreads across other markets.27 Such episodes highlight the reliance of funds holding illiquid structured products on
26The initial drop in value reduces equity in the fund, which automatically pushes up leverage. The broker (or repo desk) makes a margin call that forces the fund to sell assets to bring leverage back to its initial level. However, in addition, the prime broker (or repo desk) now imposes a higher margin (or “haircut”) to refl ect the fact that the assets are now riskier. This requires the fund to reduce borrowing further. Last, redemptions require further asset sales. This example is liberal in that it assumes the maximum use of available leverage, but it is conservative in that it considers only fi rst-round effects, not second-round declines in value from the sale of the collateral.
27Similar scenarios apply to other investor types. For instance, downgrades of ABS CDO tranches could force some investors (e.g., pension funds, insurance compa-nies) that face credit ratings-based constraints to sell the downgraded securities.
3.75
4.00
4.25
4.50
4.75
5.00
5.25
5.50
5.75
6.00
6.25
Apr May Jun Jul Aug Sep
Asset-backed commercial paper
Libor
Treasury repo
Source: Bloomberg L.P.
Figure 1.16. U.S. Money Market Interest Rates, 2007(90-day rates, in percent)

21
CREDIT INDISCIPLINE IN MATURE MARKETS
their ability to obtain continuous liquidity for funding their leveraged positions.28
In a similar vein, uncertainty has led to con-cerns regarding a further reduction in market liquidity through “haircut contagion,” increas-ing funding rates in a broader range of mar-kets beyond structured credit products.29 This could create a cycle of declining asset values, withdrawal of market liquidity, forced sales, and further valuation declines in unrelated markets until some market participants with ample cash and a willingness to buy step in to provide a fl oor (Table 1.4). Participants such as pension funds, insurance companies, and sovereign wealth funds with longer investment horizons and little if any leverage could be expected to help put a lower bound on price declines (see Annex 1.2 on characteristics of sovereign wealth funds.)
Strains in the mortgage market have also revealed the importance of reputational risk
28For instance, when liquidity dried up, Bear Stearns provided a back-up facility for its asset management arm, and the other affected funds were pushed into forced liquidations and deleveraging. The Bear Stearns-managed funds quickly lost value within a few weeks.
29A “haircut” refers to the deduction from the market value to account for the risk that the asset will be worth less if it needs to be sold when the investor pledging the security has diffi culties. The size of a haircut changes depending on the class of a security, its market risk, and the time to maturity. For instance, haircuts fl uctuate from 0 to 30 percent (on equities) to 100 percent (for securi-ties with past-due delivery). A higher haircut lowers the value of the asset being fi nanced.
as a transmission mechanism. Firms may feel obligated to support legally separated entities fi nancially in order to maintain their reputa-tion as viable fi rms. Thus, risk can be trans-mitted from a peripheral unit to, perhaps, a systemically important institution. Given the large number of separate asset management companies, special purpose vehicles, and conduits, this is an important consideration, particularly for the boards of directors of the sponsoring institutions, where oversight of these entities needs to be based on accurate and relevant information about their risks and returns.30
The rapid deterioration in the U.S. nonprime mortgage sector has also led to con-cerns about dislocations in non-U.S. mortgage markets, especially in the U.K. nonconforming mortgage sector and, to a lesser extent, the Australian subprime sector. A number of other countries have overvalued housing markets and are vulnerable to a downturn in house prices but have small nonconforming mortgage sectors.31 The U.K. nonconforming mortgage market is signifi cantly smaller than the U.S.
30For instance, Bear Stearns Cos Inc. had only very small direct stakes in the hedge funds that collapsed under Bear Stearns Asset Management. Even so, when the funds were on the point of collapse, Bear Stearns Cos Inc. provided back-up fi nancing to the funds that carried its name.
31See Box 1.2 in the October 2007 World Economic Out-look (IMF, 2007b).
Table 1.3. Stylized Example of a Forced Unwind of Leverage
Asset Value Equity Borrowing Leverage Margin (%)At start 100.0 15.0 85.0 5.7 15.0After loss of value 95.0 10.0 85.0 8.5 10.5After margin call 66.7 10.0 56.7 5.7 15.0After increase in margin 40.0 10.0 30.0 3.0 25.0After sales to meet redemptions 36.0 9.0 27.0 3.0 25.0
Source: IMF staff estimates.
Initial margin 15%Loss in value 5%New margin at lower value 25%Redemptions 10%
Modest loss of value and higher haircuts generate large forced sales

CHAPTER 1 ASSESSING RISKS TO GLOBAL FINANCIAL STABILITY
22
subprime market and there is limited evidence to suggest that U.K. loans shared the same combination of risk layering, poor underwrit-ing standards, and declining home prices as in the United States. Nonetheless, these concerns (together with higher domestic interest rates) have pushed U.K. mortgage rates higher on more recent vintages and reportedly led lend-ers to withdraw their more risky mortgage products.32
32For instance, the average combined loan-to-value ratios on U.K. nonconforming loans in 2006 (76 percent) is signifi cantly lower than those for U.S. 2006 subprime loans (85 percent), and there is minimal adverse credit lending in the U.K. market, refl ecting tighter underwrit-ing standards. Expectations of loss severity in the United Kingdom are around one-third of those in the United States, mainly due to lower foreclosure costs. Meanwhile, in contrast to the U.S. market, the underlying perfor-mance of recently-originated U.K. nonconforming loans has been stronger compared with prior vintages. The Australian subprime market is small, and Australian real estate loans give the lender greater structural protection than U.S. lenders enjoy.
Weaker Credit and Market Discipline Warrants Increased Surveillance in Emerging Markets
Overall, emerging market risks remain low relative to historical experience, with many countries benefi ting from improved macro-economic fundamentals and strong external balances. Nonetheless, developments in mature markets raise concerns that vulnerabilities may be growing in emerging markets related to a weakening of credit and market discipline in global markets, with some emerging market countries more exposed than others. This sec-tion highlights fi ve such concerns.
First, it considers the growing market of privately placed syndicated loans to emerging markets, which shares similar evidence of credit indiscipline as in the leveraged loan segment.
Second, in some regions, emerging market banks—both domestic and foreign banks acting on behalf of subsidiaries—are relying increas-ingly on international borrowing to fi nance rapid domestic credit growth. This develop-ment—fl agged in the April 2007 GFSR—is a growing vulnerability.
Third, emerging market corporates appear increasingly engaged in carry-trade-style external borrowing that could pose losses if carry trades rapidly unwind.
Fourth, emerging market fi nancial institu-tions in some countries are increasingly using structured and synthetic instruments to increase returns, potentially exposing them to losses as volatility rises.
Finally, the section explores whether foreign investors in emerging market equities increase the risks for volatility or the mispricing of emerging market equities.
Emerging market corporations have enjoyed easy access to international markets for some time, and credit disci-pline appears to be weakening.
The private placement loan market has experienced rapid growth in emerging Europe, the Middle East, and Africa (EMEA) and, to a lesser extent in Asia, partly at the expense of
Table 1.4. Typical Haircuts: Bond, Leveraged Loan, and ABS and CDO(In percent)
Rating January–May 2007 July–Aug 2007
Bond
Investment grade 0–3 3–7
High-yield 0–5 10+
Leveraged Loan
Senior 10–12 15–20
2nd lien 15–20 20–30
Mezzanine 18–25 30+
ABS and CDO
AAA 2–4 8–10
AA 4–7 20
A 8–15 30
BBB 10–20 50
Equity 50 100Source: Citigroup.Note: ABS = asset-backed security; CDO = collateralized
debt obligation.
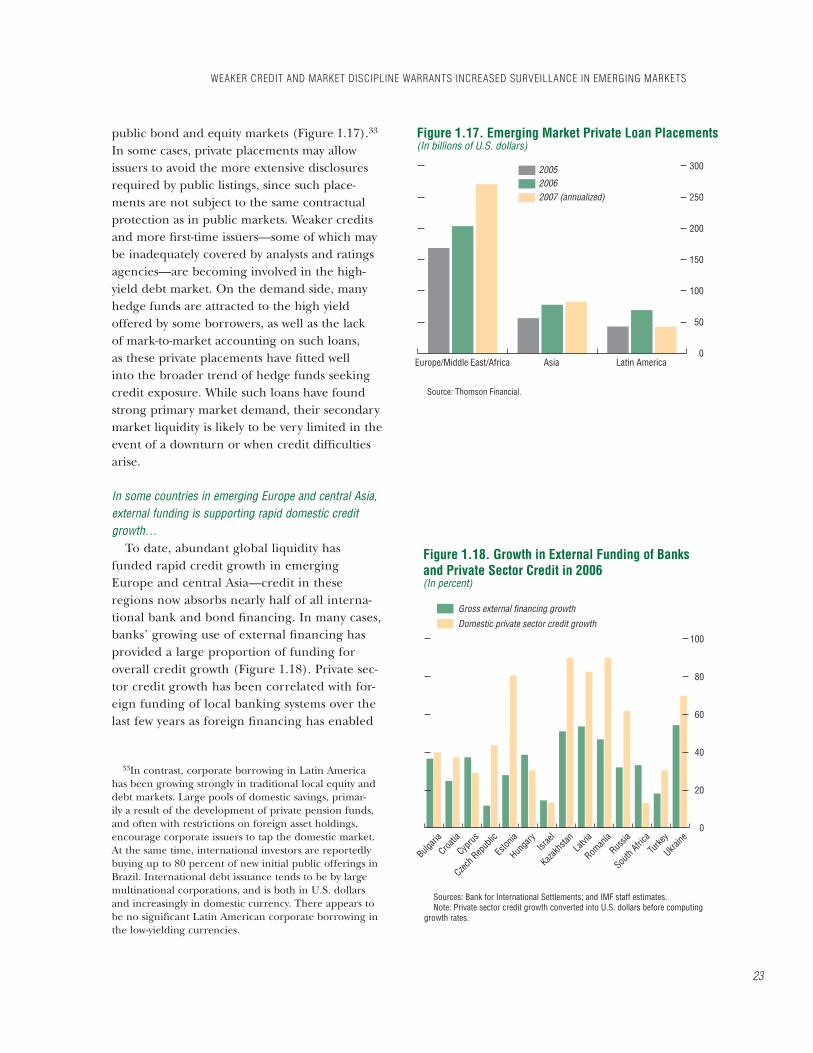
23
WEAKER CREDIT AND MARKET DISCIPLINE WARRANTS INCREASED SURVEILLANCE IN EMERGING MARKETS
0
50
100
150
200
250
300
2007 (annualized)20062005
Europe/Middle East/Africa Asia Latin America
Source: Thomson Financial.
Figure 1.17. Emerging Market Private Loan Placements(In billions of U.S. dollars)
public bond and equity markets (Figure 1.17).33
In some cases, private placements may allow issuers to avoid the more extensive disclosures required by public listings, since such place-ments are not subject to the same contractual protection as in public markets. Weaker credits and more fi rst-time issuers—some of which may be inadequately covered by analysts and ratings agencies—are becoming involved in the high-yield debt market. On the demand side, many hedge funds are attracted to the high yield offered by some borrowers, as well as the lack of mark-to-market accounting on such loans, as these private placements have fi tted well into the broader trend of hedge funds seeking credit exposure. While such loans have found strong primary market demand, their secondary market liquidity is likely to be very limited in the event of a downturn or when credit diffi culties arise.
In some countries in emerging Europe and central Asia, external funding is supporting rapid domestic credit growth…
To date, abundant global liquidity has funded rapid credit growth in emerging Europe and central Asia—credit in these regions now absorbs nearly half of all interna-tional bank and bond fi nancing. In many cases, banks’ growing use of external fi nancing has provided a large proportion of funding for overall credit growth (Figure 1.18). Private sec-tor credit growth has been correlated with for-eign funding of local banking systems over the last few years as foreign fi nancing has enabled
33In contrast, corporate borrowing in Latin America has been growing strongly in traditional local equity and debt markets. Large pools of domestic savings, primar-ily a result of the development of private pension funds, and often with restrictions on foreign asset holdings, encourage corporate issuers to tap the domestic market. At the same time, international investors are reportedly buying up to 80 percent of new initial public offerings in Brazil. International debt issuance tends to be by large multinational corporations, and is both in U.S. dollars and increasingly in domestic currency. There appears to be no signifi cant Latin American corporate borrowing in the low-yielding currencies.
Domestic private sector credit growth
Gross external financing growth
0
20
40
60
80
100
Bulgari
a
Croatia
Cyprus
Czech R
epub
lic
Eston
ia
Hunga
ryIsr
ael
Kazakh
stan
Latvi
a
Roman
ia
Russia
South
AfricaTu
rkey
Ukraine
Sources: Bank for International Settlements; and IMF staff estimates.Note: Private sector credit growth converted into U.S. dollars before computing
growth rates.
Figure 1.18. Growth in External Funding of Banksand Private Sector Credit in 2006(In percent)
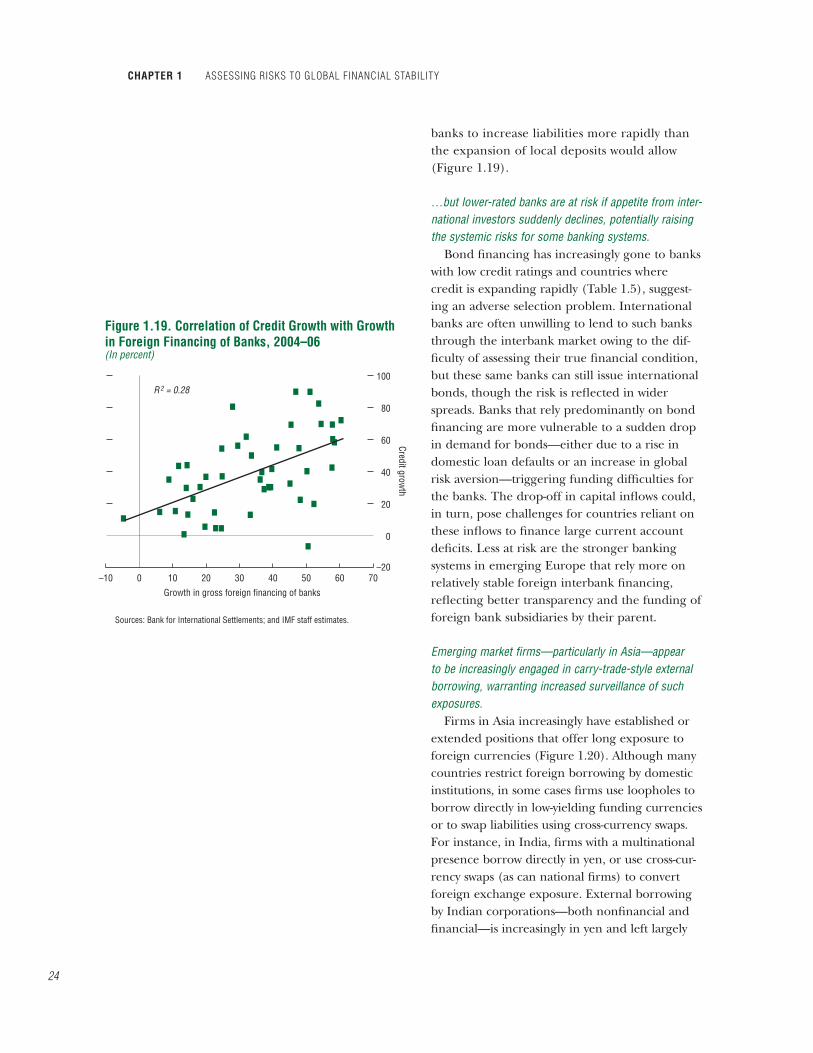
CHAPTER 1 ASSESSING RISKS TO GLOBAL FINANCIAL STABILITY
24
–10 0 10 20 30
Growth in gross foreign financing of banks
Credit growth
40 50 60 70–20
0
20
40
60
80
100
Sources: Bank for International Settlements; and IMF staff estimates.
Figure 1.19. Correlation of Credit Growth with Growthin Foreign Financing of Banks, 2004–06(In percent)
R 2 = 0.28
banks to increase liabilities more rapidly than the expansion of local deposits would allow (Figure 1.19).
…but lower-rated banks are at risk if appetite from inter-national investors suddenly declines, potentially raising the systemic risks for some banking systems.
Bond fi nancing has increasingly gone to banks with low credit ratings and countries where credit is expanding rapidly (Table 1.5), suggest-ing an adverse selection problem. International banks are often unwilling to lend to such banks through the interbank market owing to the dif-fi culty of assessing their true fi nancial condition, but these same banks can still issue international bonds, though the risk is refl ected in wider spreads. Banks that rely predominantly on bond fi nancing are more vulnerable to a sudden drop in demand for bonds—either due to a rise in domestic loan defaults or an increase in global risk aversion—triggering funding diffi culties for the banks. The drop-off in capital infl ows could, in turn, pose challenges for countries reliant on these infl ows to fi nance large current account defi cits. Less at risk are the stronger banking systems in emerging Europe that rely more on relatively stable foreign interbank fi nancing, refl ecting better transparency and the funding of foreign bank subsidiaries by their parent.
Emerging market fi rms—particularly in Asia—appear to be increasingly engaged in carry-trade-style external borrowing, warranting increased surveillance of such exposures.
Firms in Asia increasingly have established or extended positions that offer long exposure to foreign currencies (Figure 1.20). Although many countries restrict foreign borrowing by domestic institutions, in some cases fi rms use loopholes to borrow directly in low-yielding funding currencies or to swap liabilities using cross-currency swaps. For instance, in India, fi rms with a multinational presence borrow directly in yen, or use cross-cur-rency swaps (as can national fi rms) to convert foreign exchange exposure. External borrowing by Indian corporations—both nonfi nancial and fi nancial—is increasingly in yen and left largely
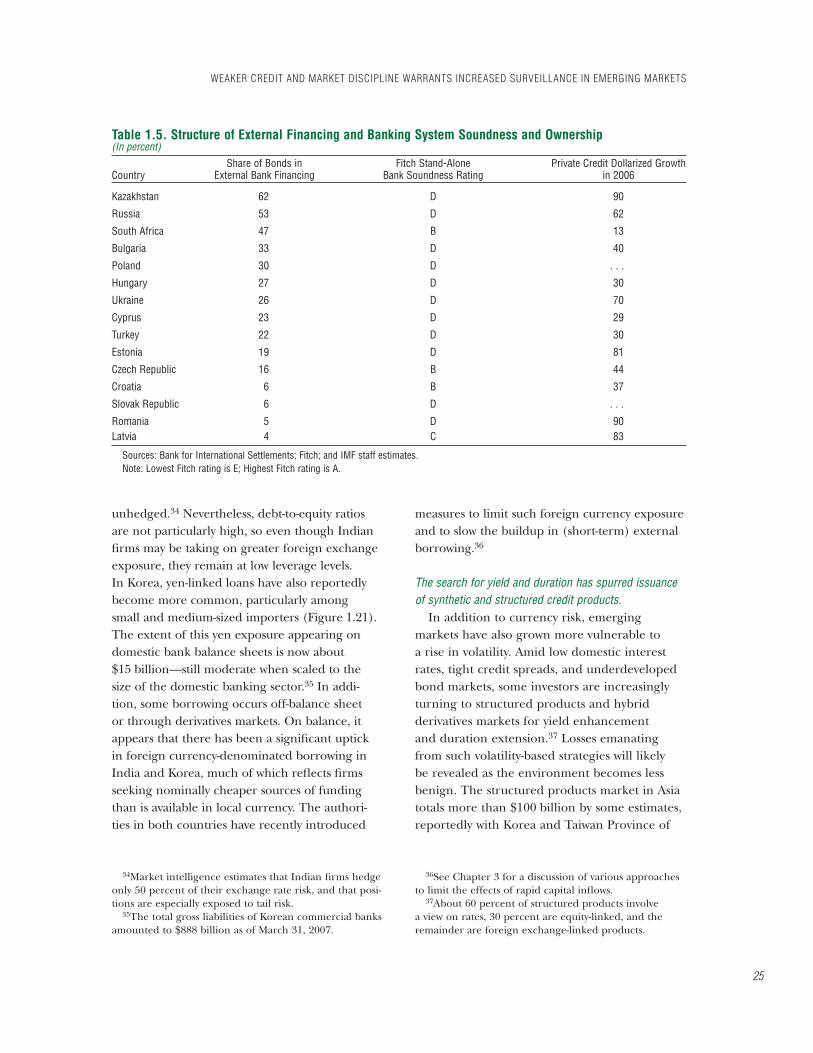
25
WEAKER CREDIT AND MARKET DISCIPLINE WARRANTS INCREASED SURVEILLANCE IN EMERGING MARKETS
unhedged.34 Nevertheless, debt-to-equity ratios are not particularly high, so even though Indian fi rms may be taking on greater foreign exchange exposure, they remain at low leverage levels. In Korea, yen-linked loans have also reportedly become more common, particularly among small and medium-sized importers (Figure 1.21). The extent of this yen exposure appearing on domestic bank balance sheets is now about $15 billion—still moderate when scaled to the size of the domestic banking sector.35 In addi-tion, some borrowing occurs off-balance sheet or through derivatives markets. On balance, it appears that there has been a signifi cant uptick in foreign currency- denominated borrowing in India and Korea, much of which refl ects fi rms seeking nominally cheaper sources of funding than is available in local currency. The authori-ties in both countries have recently introduced
34Market intelligence estimates that Indian fi rms hedge only 50 percent of their exchange rate risk, and that posi-tions are especially exposed to tail risk.
35The total gross liabilities of Korean commercial banks amounted to $888 billion as of March 31, 2007.
measures to limit such foreign currency exposure and to slow the buildup in (short-term) external borrowing.36
The search for yield and duration has spurred issuance of synthetic and structured credit products.
In addition to currency risk, emerging markets have also grown more vulnerable to a rise in volatility. Amid low domestic interest rates, tight credit spreads, and underdeveloped bond markets, some investors are increasingly turning to structured products and hybrid derivatives markets for yield enhancement and duration extension.37 Losses emanating from such volatility-based strategies will likely be revealed as the environment becomes less benign. The structured products market in Asia totals more than $100 billion by some estimates, reportedly with Korea and Taiwan Province of
36See Chapter 3 for a discussion of various approaches to limit the effects of rapid capital infl ows.
37About 60 percent of structured products involve a view on rates, 30 percent are equity-linked, and the remainder are foreign exchange-linked products.
Table 1.5. Structure of External Financing and Banking System Soundness and Ownership(In percent)
CountryShare of Bonds in
External Bank FinancingFitch Stand-Alone
Bank Soundness RatingPrivate Credit Dollarized Growth
in 2006
Kazakhstan 62 D 90
Russia 53 D 62
South Africa 47 B 13
Bulgaria 33 D 40
Poland 30 D . . .
Hungary 27 D 30
Ukraine 26 D 70
Cyprus 23 D 29
Turkey 22 D 30
Estonia 19 D 81
Czech Republic 16 B 44
Croatia 6 B 37
Slovak Republic 6 D . . .
Romania 5 D 90Latvia 4 C 83
Sources: Bank for International Settlements; Fitch; and IMF staff estimates.Note: Lowest Fitch rating is E; Highest Fitch rating is A.

CHAPTER 1 ASSESSING RISKS TO GLOBAL FINANCIAL STABILITY
26
0
5
10
15
20
25
30
35
40
Mar Jun Mar JunSep2005 2006 2007
Dec Mar Jun Sep Dec
Sources: Bloomberg L.P.; and IMF staff estimates.Note: Includes borrowing in Japanese yen, U.S. dollars, euros, or British pounds,
with maturities up to 12 months.
Figure 1.20. Emerging Asia: Short-Term Foreign-Currency-Denominated Borrowing(In billions of U.S. dollars)
0
5
10
15
20
25
30
2001Q4
02Q4
03 04 05 06
Japanese yen loans
Other currency loans
U.S. dollar loans
Source: Bank of Korea.Note: Includes loans of commercial, special, and foreign banks. Data for 2007 are
not publicly available.
Figure 1.21. Korea: Foreign-Currency-DenominatedLoans of Commercial, Special, and Foreign Banks(In billions of U.S. dollars)
China having the largest markets.38 A range of investors—including retail investors—are involved in the market, but Taiwanese insur-ance companies and, to a lesser extent, Korean companies appear particularly exposed to such structures.39 Taiwanese insurance companies are subject to asset allocation limits of 5 percent on structured products and 45 percent on foreign currency products, though some market partici-pants have suggested that these requirements can be circumvented. The Taiwanese Financial Supervisory Commission recently increased the ceiling on foreign investment for insurance com-panies and is considering further liberalization, including lifting allowable overseas investments to 50 percent of total assets and allowing insur-ers to raise debt as well as more actively manage investment-linked accounts.40
In Korea, life insurance companies, banks, pension funds, and retail investors are the larg-est consumers of structured products, generally demanding yields of 7 percent with a preference for local currency-denominated structures and an average maturity of 10 years. In practice, many of these instruments are callable by the issu-ing banks, and this limits their yield-enhancing potential. The most popular trades include power spread notes and various types of range accrual
38Taiwan Province of China was among the fi rst mar-kets in the region to authorize investment in ABS, includ-ing residential mortgage-backed securities, commercial mortgage-backed securities, and collateralized fi xed-income products. More recently, Taiwanese investors have turned to more exotic products and are applying greater leverage.
39Range accrual instruments are especially popular among Taiwanese life insurance companies that are expe-riencing a mismatch in duration and depressed profi tabil-ity. With such products, an enhanced payoff is received if an asset remains within a predetermined range during the life of the note. If the rate moves outside the range, no payout is received through maturity. Such products originated in dollar-denominated markets, but have started to migrate into local currency markets.
40There are no offi cial statistics on Taiwanese life insur-ers’ structured product holdings, but the average CDO exposure of two of the top three insurers is reported to be around 2 percent of funds invested.
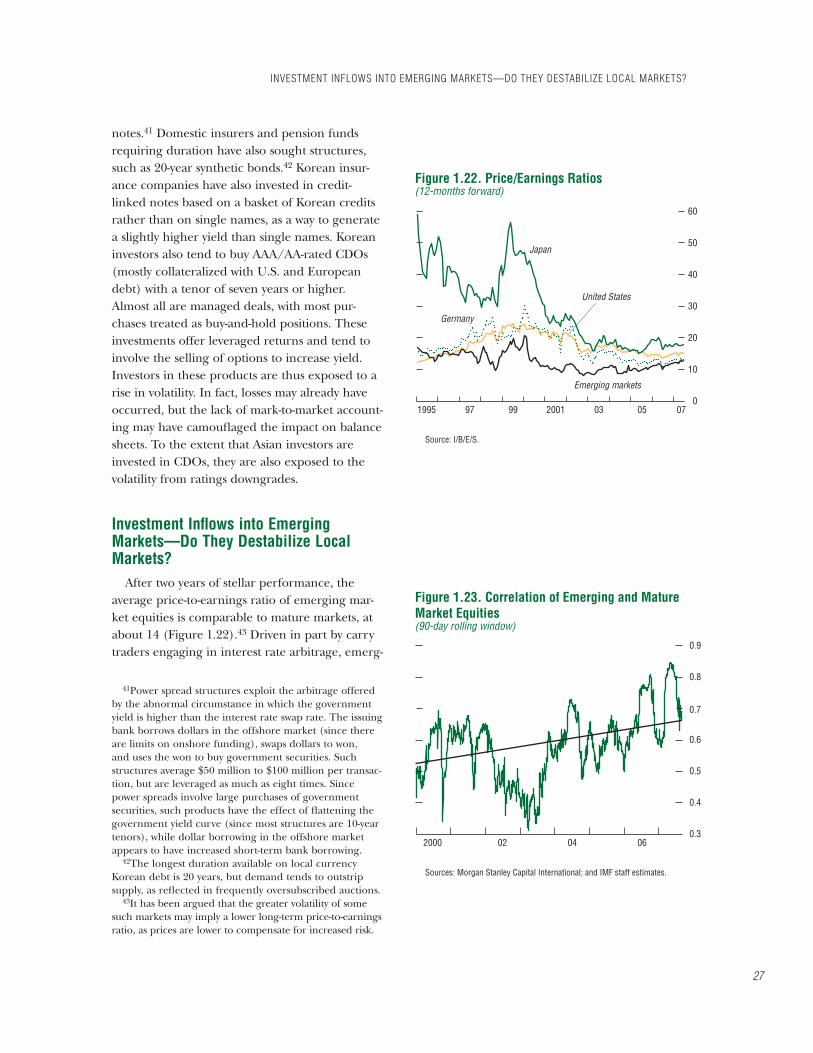
27
INVESTMENT INFLOWS INTO EMERGING MARKETS—DO THEY DESTABILIZE LOCAL MARKETS?
0
10
20
30
40
50
60
1995 97 99 2001
Japan
Germany
Emerging markets
United States
03 05 07
Source: I/B/E/S.
Figure 1.22. Price/Earnings Ratios(12-months forward)
0.3
0.4
0.5
0.6
0.7
0.8
0.9
2000 02 04 06
Sources: Morgan Stanley Capital International; and IMF staff estimates.
Figure 1.23. Correlation of Emerging and MatureMarket Equities(90-day rolling window)
notes.41 Domestic insurers and pension funds requiring duration have also sought structures, such as 20-year synthetic bonds.42 Korean insur-ance companies have also invested in credit-linked notes based on a basket of Korean credits rather than on single names, as a way to generate a slightly higher yield than single names. Korean investors also tend to buy AAA/AA-rated CDOs (mostly collateralized with U.S. and European debt) with a tenor of seven years or higher. Almost all are managed deals, with most pur-chases treated as buy-and-hold positions. These investments offer leveraged returns and tend to involve the selling of options to increase yield. Investors in these products are thus exposed to a rise in volatility. In fact, losses may already have occurred, but the lack of mark-to-market account-ing may have camoufl aged the impact on balance sheets. To the extent that Asian investors are invested in CDOs, they are also exposed to the volatility from ratings downgrades.
Investment Infl ows into Emerging Markets—Do They Destabilize Local Markets?
After two years of stellar performance, the average price-to-earnings ratio of emerging mar-ket equities is comparable to mature markets, at about 14 (Figure 1.22).43 Driven in part by carry traders engaging in interest rate arbitrage, emerg-
41Power spread structures exploit the arbitrage offered by the abnormal circumstance in which the government yield is higher than the interest rate swap rate. The issuing bank borrows dollars in the offshore market (since there are limits on onshore funding), swaps dollars to won, and uses the won to buy government securities. Such structures average $50 million to $100 million per transac-tion, but are leveraged as much as eight times. Since power spreads involve large purchases of government securities, such products have the effect of fl attening the government yield curve (since most structures are 10-year tenors), while dollar borrowing in the offshore market appears to have increased short-term bank borrowing.
42The longest duration available on local currency Korean debt is 20 years, but demand tends to outstrip supply, as refl ected in frequently oversubscribed auctions.
43It has been argued that the greater volatility of some such markets may imply a lower long-term price-to-earnings ratio, as prices are lower to compensate for increased risk.

CHAPTER 1 ASSESSING RISKS TO GLOBAL FINANCIAL STABILITY
28
ing market bond yields have also converged with mature market levels. Not surprisingly, over the same period, correlations between the returns on emerging market assets and other assets have increased (Figure 1.23). The confl uence of higher correlation with lower expected returns suggests that some global investors may be inclined to reassess the diversifi cation benefi ts available from emerging market investments. The corollary is that emerging markets may become more sensitive to global developments as the “cushion” of excess returns is reduced.
Against this backdrop and strong infl ows from global investors over the last several years, this section presents preliminary work on the poten-tial for the behavior of foreign institutional and hedge fund investors to destabilize emerging market equities.
A study of high-frequency data on equity fl ows into emerging markets supplied by the Bank of New York (BONY) points to some useful conclu-sions about the nature and short-term impact of emerging market infl ows.44 The data largely refl ect the activities of institutional investors such as pension funds, mutual funds, and insur-ance companies, and can therefore be used to study the behavior of some types of foreign fl ows on prices. This section examines the impact of these foreign fl ows on local equity price levels, as well as coincident changes in local equity prices and their relation to “herding” across countries within a region by foreign institutional investors. The positions of institutional investors versus leveraged investors during a market cor-rection are then compared.
Surprisingly, institutional infl ows appear to have little impact on equity prices...
Contrary to what might be expected from reports of foreign investors crowding into small local markets, the measurable effect of foreign infl ows on domestic equity price levels is not
44With the proliferation of markets open to foreign infl ows and new fi nancial products for investing in those markets, it is diffi cult to make universal claims about the nature of other infl ows.
readily apparent (Box 1.3). Reinforcing the fi nding, tests performed on markets grouped by region show little or no indication of the net effect of infl ows on prices. One explanation is that local markets may have become deeper and better able to absorb fl ows over time as domestic investors have increased their trading activ-ity and their role in price determination (see Chapter 3).
...but there are indications of “imported” volatility.At the same time, there is support for the
widely held perception that foreign investors are sometimes inclined to herd into individual mar-kets, in some cases switching from one country to another within a specifi c region. Foreign inves-tors’ position changes are also correlated with higher volatility, a potentially undesirable charac-teristic for an asset market. Even so, as suggested above, the evidence suggests that foreigners are not feeding local equity bubbles, since they have no appreciable effect on price levels.
Foreign institutional investors appear to behave differ-ently from hedge funds in times of stress.
During recent periods of market turbulence in May–June 2006 and February–March 2007, evidence suggests that sales by some foreign investors did have a strong effect on the prices of several types of assets, including equities. The activities of hedge funds, which are sometimes seen as market bellwethers, appear to fall into this category. Leveraged investors, such as hedge funds and bank proprietary desks, often need to operate positions with stops to limit exces-sive capital losses as a result of the leverage that they employ (see Chapter 2). This tends to force liquidations when prices move sharply down. Indirect evidence of this is found by compar-ing the behavior of institutional and foreign investors during the May–June 2006 correction. Institutional investors were less likely on aver-age to exit equity market positions than foreign investors were as a whole (Figure 1.24).45 This
45Figure 1.24 uses data for those emerging market countries that have both BONY and offi cial foreign equity

29
INVESTMENT INFLOWS INTO EMERGING MARKETS—DO THEY DESTABILIZE LOCAL MARKETS?
This box makes use of high-frequency data supplied by the Bank of New York (BONY) on equity flows into 16 major emerging markets over a period of more than five years in order to provide insights into these flows and their effects.1
The fi ndings here suggest that the effect of foreign infl ows on domestic equity price levels is not statistically apparent. Impulse response functions calculated from panel vector autore-gressions employing scaled equity infl ows and percentage changes in equity prices as the two endogenous variables show either an insig-nifi cantly positive or a zero net cumulative response of prices to infl ows for the full panel of 16 emerging markets (see figure).2 Reinforc-ing the fi nding, there is no signifi cant regional variation in the results, with impulse response functions calculated for each of the three main emerging market regions (Asia; Latin America; and Europe, the Middle East, and Africa) also indicating little or no net effect of infl ows on prices. That stands in contrast to the fi ndings of the study by Froot, O’Connell, and Seasholes (2001), pointing to a change in investor behav-ior between the earlier 1990s and the most recent fi ve-year period.
Persistence—a possible sign of herding behavior—is one prominent and readily observable feature of the BONY fl ows. Variance ratio tests, which are widely used in analysis of fi nancial time series, show clear autocorrela-
Note: The main author of this box is Chris Walker.1Daily data over a period of fi ve years for 16 coun-
tries, yielding about 22,000 individual observations. In many cases, the BONY data provide more detail on fl ows into a given market than is available from public or national sources. Where aggregate daily data on overall foreign net fl ows into a given market are avail-able, the pattern of the BONY fl ows broadly matches that of the aggregate foreign infl ows, accounting, on average, for about 1 to 5 percent of the fl ows into the given market. Correlation coeffi cients are all positive, ranging from 0.05 in the case of Indonesia to 0.38 for Korea. Correlation coeffi cients range from –1 (full negative correlation) to +1 (full positive correlation).
2In the orthogonalization of error terms, the time t shock to fl ows is assumed to precede the time t priceshock.
tion in fl ows at both short and long lags (see table).3 Moreover, the substantially higher rates of autocorrelation at the longer lags indicate that herding of investors into a given market is a process that takes place over several days, weeks, or even months. This is notably the case for Latin American markets, for which the 20-day variance ratio exceeds seven. Previous studies of fl ows into emerging markets also identifi ed clear persistence of approximately the same degree as that reported here (Froot, O’Connell, and Seasholes, 2001).
Investors also show some inclination to chase returns. Making use of the same panel vector
3In the simplest, single-period lag case the vari-ance ratio statistic VR(2) is equivalent to VR(2) = Var(rt+rt+1)/2Var(rt) = (2Var(rt)+2Cov(rt,rt+1))/2Var(rt)= 1 + ρ, where ρ=σxy/σx
2 is the coeffi cient in a fi rst-order autoregression of r. Note that a VR(2) statistic greater than 1 indicates persistence/autocorrelation at a single lag. At longer lags (e.g., VR (5)), the statis-tic is equivalent to summing across autocorrelations at the intermediate lag intervals, and will yield higher values than the VR(2) statistic if the true underlying process is autoregressive (AR(n)) at an order higher than 1.
Box 1.3. Equity Infl ows and Emerging Markets
–6
–4
–2
0
2
4
6
543210
5% confidence interval
95% confidence interval
Response of returns to flow shock
Impulse Response of Returns to a OneStandard Deviation Increase in Foreign Inflows(Percentage change)
Days after shock
Source: IMF staff estimates.Note: Panel vector autoregressions are run over 16 emerging
market countries (a total of 9,779 observations).

CHAPTER 1 ASSESSING RISKS TO GLOBAL FINANCIAL STABILITY
30
autoregressions used to assess the impact of fl ows on prices, impulse response functions were calculated to measure the impact of price changes on fl ows. This impact turned out to be signifi cant and persistent over a period of several days, implying that an unexpected positive movement in equity prices leads to higher-than-average foreign infl ows over a period of several days. These results are also similar to those obtained by Froot, O’Connell, and Seasholes (2001).
Volatility tests provide some support for occa-sional claims by policymakers of a connection between volatile foreign infl ows and volatil-ity in domestic markets. The tests performed here, however, using the popular generalized autoregressive conditional heteroscedasticity (GARCH) model, cannot assign a direction of causation. That is, they show a strong, statisti-cally signifi cant, positive correlation between the contemporaneous volatility of fl ows and that of returns. But they do not, on their own, pro-vide a way of determining where the volatility shock originates, or, indeed, if it originates with a third omitted variable. However, assuming that prices respond more quickly to shocks than do fl ows (i.e., quantities), an observer might infer that it is volatility in foreign fl ows that leads to asset price volatility, rather than the converse.
Market reports of investment fl ows sometimes cite a tendency of foreign investors to shift focus from one emerging market to a neighboring market, as assets become fully valued or eco-nomic policies are adjusted. Examples include a shift away from Korean equities in the latter part of 2005, following strong infl ows into that market over the previous two years, even as capital
infl ows to other Asian nations remained robust. There are also accounts of switching among European, Middle Eastern, and African markets as specifi c problems arise in individual markets. To test for such activity, variance ratio statistics for entire regions were computed by summing across fl ows into each of the markets within that region. The results provide some modest evidence of switching behavior within regions, notably in Latin America, where the persistence of fl ows to the region as a whole exceeds that of fl ows to the constituent economies. Signifi cantly, the exercise also showed persistence of fl ows to emerging markets overall as being greater than that of fl ows to the separate regions.4
Contrary to an earlier study, it does not appear that foreign infl ows have regularly driven up equity prices in recent years (Froot, O’Connell, and Seasholes, 2001). However, the tests here suggest that equity fl ows into emerging markets are consistent with a herding pattern, with periods of above-normal infl ows persisting for many days at a time. There is also evidence that foreign investors chase returns and switch between markets. In addition, the study fi nds some evidence of “volatility con-tagion,” with volatility of infl ows refl ected in contemporaneous equity price volatility.
A key point is that foreign fl ows do not neces-sarily represent a shift in foreign demand in and of itself. For example, an increase in domestic demand could result in foreign outfl ows (as foreigners sell shares to domestic investors), together with a domestically driven increase in equity prices—the opposite combination to what would be expected if the fl ows only result from an increase in foreign demand for domes-tic equities. If, as suggested in Chapter 3, equity
4In the two-market case, switching should arise only if there is a positive correlation between fl ows into market 1 at time t and fl ows into market 2 at time t+1 that is not fully explained by contemporaneous time t correlations between the two fl ow series, after controlling for the autocorrelations of each series. In other words, there must be some tendency of investors to move funds from one market to another within the group.
Box 1.3 (continued)
Relationship of Flow Variance to the Variance of Returns(GARCH model)
Coeffi cientCoeffi cient
ValueStandard
Error T-Statistic
β2 (fl ow variance) 6.12 2.0 3.06
α 0.06 0.02 3.25
β1 0.90 0.03 26.94
Model: σ2msci,t = w + αε2
t–1 + β1σ2msci,t–1 + β2 σ2
fl ow,t

31
is consistent with the often-reported view that institutional investor fl ows tend to be more sticky than hedge fund fl ows.
However, the line between hedge funds and institutional investors is becoming more blurred.
On the one hand, institutional investors are increasingly allowed to invest in derivatives,
fl ow data that appear broadly consistent, and where there was a signifi cant outfl ow of foreign money in the equity market during the May–June 2006 correction.
such as CDS, and many now have some fl exibil-ity within their mandate to sell short. In addi-tion, some institutional investors can also now leverage their positions through structures, such as so-called 130/30 funds.46 On the other hand, hedge funds have increasingly refocused their investment strategies in emerging markets away from traditional fi xed-income investments,
46130/30 funds allow a maximum 30 percent short position, the proceeds of which can be used to fund up to a 130 percent long exposure.
INVESTMENT INFLOWS INTO EMERGING MARKETS—DO THEY DESTABILIZE LOCAL MARKETS?
markets have become deeper and more liquid in recent years, that could explain why the esti-mated impact from foreign fl ows to prices has declined or disappeared. Importantly, the Chap-ter 3 analysis does not apply to short-term equity
price volatility. Regardless of whether foreign or domestic demand becomes more volatile, the model suggests that this volatility is transmitted directly to equity prices, and that this impact is likely to be detectable.
Box 1.3 (concluded)
Persistence in Daily Bank of New York Portfolio Flows: Variance Ratio (VR) Tests, January 2002 to May 2007VR(2) VR(5) VR(20)
RatioStandard
error RatioStandard
error RatioStandard
errorAsia 1.26 0.004 3.75 0.011 5.88 0.032
India 1.20 0.010 3.70 0.024 7.72 0.060Indonesia 1.32 0.005 3.86 0.013 5.28 0.039Hong Kong SAR 1.24 0.004 3.60 0.010 5.96 0.029Korea 1.16 0.005 3.21 0.013 4.18 0.034Malaysia 1.28 0.004 3.87 0.012 6.76 0.043Philippines 1.32 0.012 4.13 0.028 6.71 0.059Singapore 1.20 0.011 3.41 0.023 5.57 0.050Thailand 1.30 0.022 3.71 0.047 5.70 0.076Taiwan Province of
China 1.23 0.004 3.32 0.010 5.21 0.029
Latin America 1.39 0.021 4.09 0.049 7.16 0.094Brazil 1.37 0.025 3.92 0.055 6.61 0.106Mexico 1.22 0.009 3.16 0.021 4.99 0.049
Europe, Middle East and Africa 1.38 0.011 4.07 0.025 6.19 0.061Turkey 1.38 0.035 4.12 0.075 5.30 0.119Poland 1.30 0.008 3.63 0.019 5.65 0.051Hungary 1.15 0.097 2.84 0.189 3.60 0.260Czech Republic 1.25 0.011 3.54 0.024 5.10 0.066South Africa 1.32 0.009 4.07 0.022 7.45 0.048
Emerging Markets Total 1.39 0.005 4.29 0.012 7.71 0.038Source: IMF staff estimates.Note: Variance ratio test using 1, 4, and 19 lags for VR(2), VR(5), VR(20), respectively. Regional flows are based on the sum of
country flows in that region.
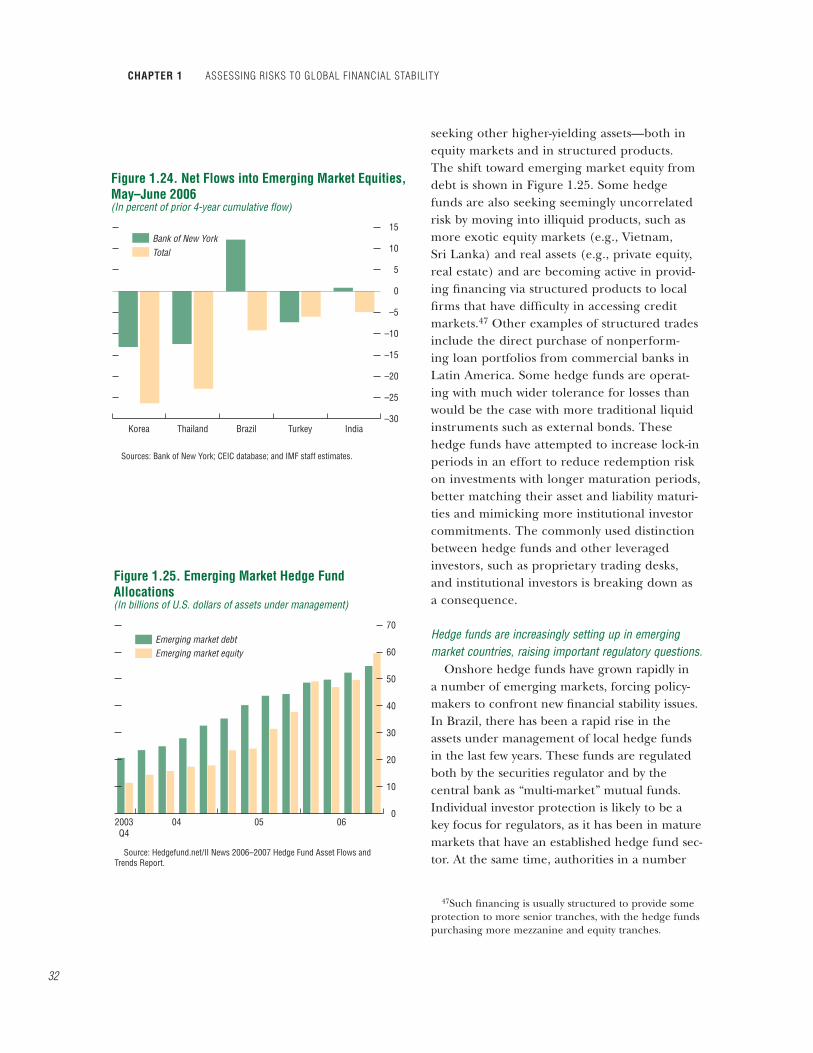
CHAPTER 1 ASSESSING RISKS TO GLOBAL FINANCIAL STABILITY
32
TotalBank of New York
IndiaTurkeyBrazilThailandKorea–30
–25
–20
–15
–10
–5
0
5
10
15
Sources: Bank of New York; CEIC database; and IMF staff estimates.
Figure 1.24. Net Flows into Emerging Market Equities,May–June 2006(In percent of prior 4-year cumulative flow)
Emerging market equityEmerging market debt
0
10
20
30
40
50
60
70
2003Q4
04 05 06
Source: Hedgefund.net/II News 2006–2007 Hedge Fund Asset Flows and Trends Report.
Figure 1.25. Emerging Market Hedge FundAllocations(In billions of U.S. dollars of assets under management)
seeking other higher-yielding assets—both in equity markets and in structured products. The shift toward emerging market equity from debt is shown in Figure 1.25. Some hedge funds are also seeking seemingly uncorrelated risk by moving into illiquid products, such as more exotic equity markets (e.g., Vietnam, Sri Lanka) and real assets (e.g., private equity, real estate) and are becoming active in provid-ing fi nancing via structured products to local fi rms that have diffi culty in accessing credit markets.47 Other examples of structured trades include the direct purchase of nonperform-ing loan portfolios from commercial banks in Latin America. Some hedge funds are operat-ing with much wider tolerance for losses than would be the case with more traditional liquid instruments such as external bonds. These hedge funds have attempted to increase lock-in periods in an effort to reduce redemption risk on investments with longer maturation periods, better matching their asset and liability maturi-ties and mimicking more institutional investor commitments. The commonly used distinction between hedge funds and other leveraged investors, such as proprietary trading desks, and institutional investors is breaking down as a consequence.
Hedge funds are increasingly setting up in emerging market countries, raising important regulatory questions.
Onshore hedge funds have grown rapidly in a number of emerging markets, forcing policy-makers to confront new fi nancial stability issues. In Brazil, there has been a rapid rise in the assets under management of local hedge funds in the last few years. These funds are regulated both by the securities regulator and by the central bank as “multi-market” mutual funds. Individual investor protection is likely to be a key focus for regulators, as it has been in mature markets that have an established hedge fund sec-tor. At the same time, authorities in a number
47Such fi nancing is usually structured to provide some protection to more senior tranches, with the hedge funds purchasing more mezzanine and equity tranches.

33
POLICY CHALLENGES
of countries are actively planning to change the regulatory structure that onshore hedge funds face as part of plans to develop the fi nancial sec-tor. Asia, in particular, has seen a rapid expan-sion of the local hedge fund industry (Box 1.4). In response to this expansion, Hong Kong SAR has simplifi ed licensing procedures to encour-age hedge funds to set up or relocate to their jurisdiction, while Korea has recently unveiled a road map that envisages allowing onshore hedge funds as of 2012 as part of its plan to transform the country into a fi nancial hub.
Policy Challenges
Policymakers need to better detect and understand how risks develop within the modern fi nancial system…
The turbulence in global credit markets has been rooted in the weakening of credit dis-cipline, a buildup of leverage in segments of the fi nancial system, and investor complacency that had developed during the period of ample liquidity and benign fi nancial conditions. Fea-tures of the modern fi nancial landscape make it diffi cult to detect the location of these risks. When losses materialized, leverage and a lack of transparency in some segments made the impact worse. Structured products have spread those losses, but some market participants were ill equipped to handle the risks they assumed.
Overseers of fi nancial stability need to strengthen their tools to identify such situations and prevent them from recurring. Stronger systems for monitoring and analyzing both the direct and embedded leverage that systemically important fi nancial institutions are using or granting would help to anticipate challenges to fi nancial stability.48 Also, to reduce the fi nancial transmission of disturbances, it is particularly important to have a degree of diversity in terms
48Metrics should include mortgage loan-to-value ratios, buyout debt levels and price multiples, prime brokerage margins and repo haircuts, and embedded leverage and over-collateralization levels in credit derivatives and fund-ing vehicles.
of investor bases, markets, strategies, investment horizons, risk management systems, counterpar-ties, and returns among market participants. Long periods of stability should sensitize regula-tors and private institutions to the dangers of complacency. The trend toward transferring risks should be a focus, and regulators and those responsible for fi nancial stability could probe further how credit risk transfer techniques may have reshaped stability risks.
In all of this analysis, regulators and supervi-sors should look at both on- and off-balance-sheet exposures of the institutions they are regulating and evaluate the array of risks that might eventually migrate to these institutions during a time of market strain. If these linkages were known, market discipline could function better, counterparty risk assessments could be improved, and policymakers and central banks would be better prepared.
…and help sustain market discipline by ensuring that fi nancial intermediaries have adequate risk management capabilities to assess risks associated with complex structured products.
Many investment products are much more complex than in the past, especially in credit markets. Regulators need to renew efforts to test the capacity of their regulated institutions to manage the risks they are assuming. Regu-lated fi nancial institutions should thoroughly explore the dynamics and sensitivities of the assets they hold and use as collateral, particu-larly if they are hard to value and have illiquid secondary markets, being aware of various “tail-risk” scenarios. Supervisors can better audit the risk management systems employed by such institutions to verify that they are appropriately tailored to their individual risks (see Chapter 2).
Supervisors will want to check that counter-party risk is being given high priority. In par-ticular, the relationship between prime brokers and the hedge funds they service should remain in focus. The fi nancial system relies heavily on that relationship working properly to ensure that hedge funds do not borrow to assume
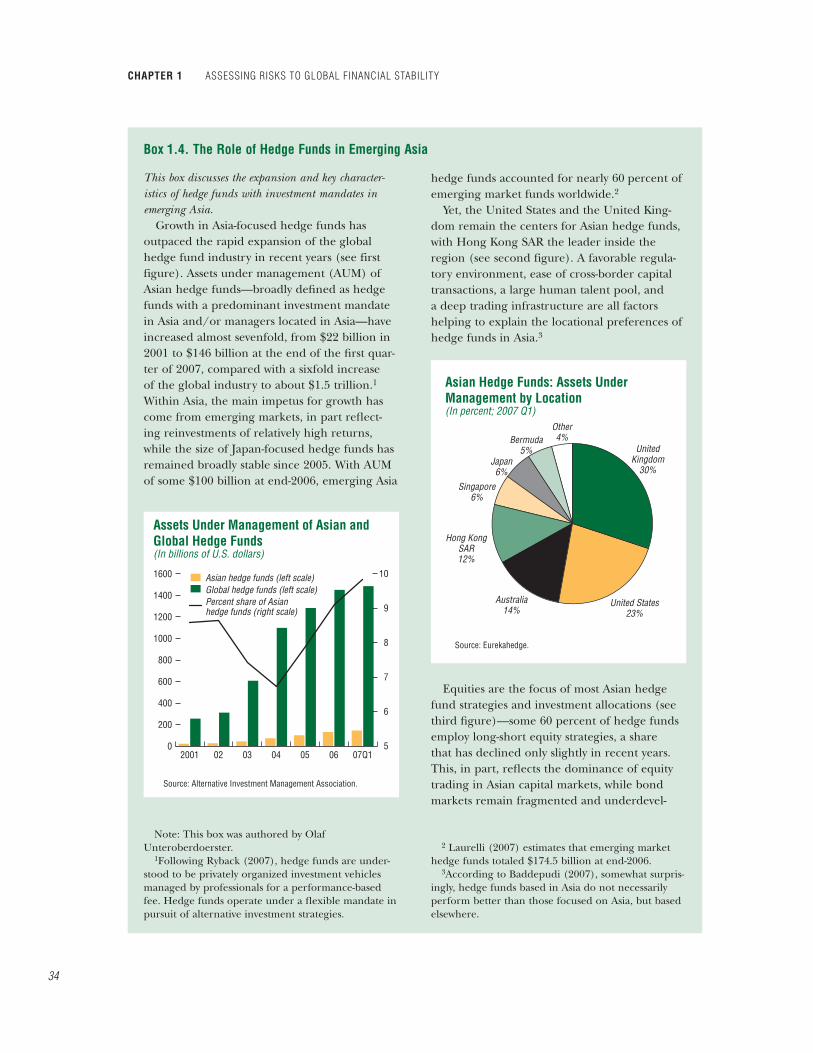
CHAPTER 1 ASSESSING RISKS TO GLOBAL FINANCIAL STABILITY
34
This box discusses the expansion and key character-istics of hedge funds with investment mandates in emerging Asia.
Growth in Asia-focused hedge funds has outpaced the rapid expansion of the global hedge fund industry in recent years (see first figure). Assets under management (AUM) of Asian hedge funds—broadly defi ned as hedge funds with a predominant investment mandate in Asia and/or managers located in Asia—have increased almost sevenfold, from $22 billion in 2001 to $146 billion at the end of the fi rst quar-ter of 2007, compared with a sixfold increase of the global industry to about $1.5 trillion.1
Within Asia, the main impetus for growth has come from emerging markets, in part refl ect-ing reinvestments of relatively high returns, while the size of Japan-focused hedge funds has remained broadly stable since 2005. With AUM of some $100 billion at end-2006, emerging Asia
Note: This box was authored by Olaf Unteroberdoerster.
1Following Ryback (2007), hedge funds are under-stood to be privately organized investment vehicles managed by professionals for a performance-based fee. Hedge funds operate under a fl exible mandate in pursuit of alternative investment strategies.
hedge funds accounted for nearly 60 percent of emerging market funds worldwide.2
Yet, the United States and the United King-dom remain the centers for Asian hedge funds, with Hong Kong SAR the leader inside the region (see second figure). A favorable regula-tory environment, ease of cross-border capital transactions, a large human talent pool, and a deep trading infrastructure are all factors helping to explain the locational preferences of hedge funds in Asia.3
Equities are the focus of most Asian hedge fund strategies and investment allocations (see third fi gure)—some 60 percent of hedge funds employ long-short equity strategies, a share that has declined only slightly in recent years. This, in part, refl ects the dominance of equity trading in Asian capital markets, while bond markets remain fragmented and underdevel-
2 Laurelli (2007) estimates that emerging market hedge funds totaled $174.5 billion at end-2006.
3According to Baddepudi (2007), somewhat surpris-ingly, hedge funds based in Asia do not necessarily perform better than those focused on Asia, but based elsewhere.
Box 1.4. The Role of Hedge Funds in Emerging Asia
0
200
400
600
800
1000
1200
1400
1600
07Q1060504030220015
6
7
8
9
10Asian hedge funds (left scale)Global hedge funds (left scale)Percent share of Asianhedge funds (right scale)
Assets Under Management of Asian andGlobal Hedge Funds(In billions of U.S. dollars)
Source: Alternative Investment Management Association.
Source: Eurekahedge.
Asian Hedge Funds: Assets UnderManagement by Location(In percent; 2007 Q1)
UnitedKingdom
30%
United States23%
Australia14%
Singapore6%
Japan6%
Bermuda5%
Other4%
Hong KongSAR12%

35
more risk than is prudent. Parties lending against hard-to-price collateral should verify that adequate mechanisms are in place for limiting the buildup of leverage. The hedge fund dele-veraging seen in July and August 2007 brings
into question the adequacy of repo collateral requirements. Lenders that applied unusually small haircuts for repo fi nancing in an effort to win business suffered greater losses than those that imposed more traditional levels of haircuts.
POLICY CHALLENGES
oped. Regarding leverage, 40 percent of the self-described hedge funds in Hong Kong SAR do not use any leverage, while the majority (85 percent) of other funds report leverage of less than 200 percent of the reported net asset value.4 AUM of Asian-focused hedge funds only represent a very small fraction of asset markets in Asia, often less than 1 percent in selected markets. Relative to debt securities in emerg-ing Asia, the ratio increases to over 2½ percent, refl ecting the slower development of bond markets in the region.
However, one factor that is not easily cap-tured by available data is the capacity of hedge funds to take leveraged positions and employ derivatives. Their active trading also implies a much higher share in market turnover than is suggested by their size alone. In 2006, hedge funds globally were estimated to account for nearly 60 percent of trading volume in credit derivatives, and nearly half of the trading vol-umes in distressed debt and emerging market debt (Fitch Ratings, 2007b).
In line with global trends, the hedge fund industry is moving away from its traditional role in identifying pricing anomalies and exploit-ing arbitrage opportunities. Hedge funds are becoming increasingly like merchant banks, offering syndicated loans (Irvine, 2007), asset-backed fi nance and structured products (such as collateralized debt obligations), or enter-ing “specialty situations” as co-investors with
4According to the Hong Kong SAR Securities and Futures Commission, various calculations of leverage were reported, with the more common defi nition applied being: (long market value + short market value)/net asset value. Still, these fi gures do not account for the leverage embedded in assets bought by hedge funds.
traditional private equity fi rms. Asia, Australia, Japan, Singapore, and Hong Kong SAR are the only jurisdictions that offer a legal framework for structured products and hence growth in this area. Amid the abundance of capital fl ow-ing into the region, funds’ fi nancial strength continues to grow and their lock-in periods are becoming longer, thereby facilitating the trend into credit derivatives and less liquid markets. Increasingly hedge funds have been able to negotiate directly as capital providers building on their own structuring capability, and thus bypass investment banks. At the same time, mutual funds and other institutional investors are beginning to emulate hedge fund strategies by setting up funds with limited leverage and with performance-based fees.
0
20
40
60
80
100
OtherCredit/distressed debt
Relative valueEvent driven
Multi-strategiesLong/short equities
Hong Kong SARAsia
Distribution of Investment Strategies(In percent of number of hedge funds)
Sources: Eurekahedge; and Hong Kong SAR, Securities and Futures Commission.

CHAPTER 1 ASSESSING RISKS TO GLOBAL FINANCIAL STABILITY
36
Some of the risk is thereby transferred to prime brokers from hedge funds.
Greater transparency is needed with regard to the links between on- and off-balance-sheet entities.
Off-balance-sheet entities play a key role in modern fi nance. They can be a useful tool for managing risks and for ensuring that risk capital is used effi ciently. However, the fi rms themselves and their investors need to be able to see the full range of links between the parent institution and the other entities with which it is involved. Regulators will need to consider the issue of pro-viding greater clarity than at present as regards the links between various investment entities and institutions that sponsor them, benefi t from them, provide services to them, or stand to offer support to them under certain circumstances. Banks and regulators alike need to assess the contingent draws on funding channels that can occur and assess the risks that such funding might result ultimately in credit exposure where collateral is hard to price. Consideration might also need to be given to whether capital charges on such standby credit lines are suffi cient. The relevant perimeter of risk consolidation for banks may need to be reconsidered, as the usual accounting and legal perimeters appeared to be insuffi cient to guarantee adequate risk controls.
Although the collapse of a major hedge fund is not likely to pose a systemic threat (unless the failure impairs systemically important institu-tions), recent developments have shown that confi dence can easily be shaken in a situation where losses are unknown and conduits and off-balance-sheet commitments are not transparent. One lesson of this experience, therefore, is the need for greater disclosure of relationships and potential exposures of major banks with SIVs and other conduits to funding diffi culties.
It is especially important to examine short-term funding markets for potential risks from liquidity mismatches.
The short-term money markets used for wholesale funding, including, in particular, commercial paper and asset-backed commer-cial paper, play a vital role in the global fi nan-
cial system, but are often overlooked. Signs of market strains often show up in these markets before they materialize elsewhere, and it is fre-quently the loss of access to funding that moves an institution from illiquidity to insolvency. The authorities should therefore continue to intensely monitor the functioning of the repo and money markets for any signs of distress and be ready to raise a warning fl ag when signs of strain emerge. They will also want to verify that systemically important entities operating in the wholesale funding business have adequate con-trols and practices for assessing collateral.
One dimension of the recent episode of turbulence was the degree to which funding markets have been linked globally, as problems were transmitted and amplifi ed because of, for instance, the extent to which banks in one country/continent required access to short-term offshore markets. This was evident when some banks had diffi culty accessing foreign currency swaps to channel liquidity in the currency where liquidity demands had increased. As well, the broad mismatch of liquidity of ABCP conduits and SIVs should be assessed as a source of sys-temic concern where confi dence in such struc-tures became challenged, and where in some cases credit lines served as false insurance (to the vehicle) or as a channel of credit contagion. It was also clear that investors in money market funds were surprised to fi nd the degree to which they were subject to losses on portfolios promis-ing higher returns.
The need for a differentiated scale of credit ratings has again been made apparent.
The fallout in the mortgage market has drawn attention to the role of credit ratings agencies in structured credit markets. Less sophisticated investors, who were content to delegate the risk assessment of their positions to the credit ratings agencies, were negatively surprised by the inten-sity of downgrades. Previous GFSRs have pointed out that structured credit products are likely to suffer more severe, multiple-notch downgrades relative to the typically smoother downgrade paths of corporate bonds (IMF, 2006). The
37
POLICY CHALLENGES
experience of the past year has underscored the need for further efforts to inform investors of these risks, but better still would be the intro-duction by ratings agencies of a more differenti-ated scale for structured credit products. For example, a special rating scale for structured credits could be introduced to highlight to investors that they should expect a higher speed of migration between ratings than on a tradi-tional corporate bond.
On a related point, in the case of structured credit products that reference other structured credit products (e.g., ABS CDOs, ABCP, and “CDO-squareds”), investors should be mindful of the compounding effect of downgrades. More-over, when ratings agencies are slow to recognize the deterioration of the performance of assets that underlie some structured credit products, investors should be aware that downgrades could be delayed and more severe.
Institutional investors, as buyers of structured credit products, must ensure that their invest-ment mandates do not lead to an over-reliance on agency letter ratings, and that they do not (implicitly) delegate the job of examining complex assets to ratings agencies. Due to their embedded leverage, the prices of CDOs tend to be more volatile than similarly rated corporate bonds, which is refl ected in higher spreads on the former. Hence, investors and brokers should delve beneath the published credit ratings to understand the price dynamics of the instru-ments. They should seek to understand the likely speed and intensity by which the value of the asset can change. Where possible, they should undertake their own analysis to verify their understanding of the main drivers of the value to the asset, and its sensitivity to changes in those variables, including scenario tests for extreme values. Investors should also seek to understand the liquidity of the market for the asset, both in good times and bad, and the likely ease or diffi culty they might have in exiting the position. Ideally, investors should use real-time price quotations of the underlying collateral to mark the assets to market.
At the same time, regulators should seek to strike a balance between protecting consumers and facilitating innovation.
Although new origination and funding technology appears to have made the fi nancial system more stable for the United States, it has exposed holes in the U.S. consumer protection regulatory framework—and other countries could usefully take note. Policymakers need to tighten lending standards and restrictions on aggressive lending, while preserving a model that successfully disperses exposure to higher-risk mortgages away from the banking system. For example, supervisory agencies have tight-ened their guidance on appropriate subprime lending practices and how to better oversee mortgage originators that are not under the usual bank supervision umbrella. However, some proposals suggest that banks involved in securiti-zation, and even the holders of mortgage-related securities, should be liable for any “predatory” loans they handle or hold. If potential liability were uncapped, there is a danger that few, if any, subprime loans would be originated or securitized.
Emerging markets need to ensure that policies support continued resilience should global market conditions remain volatile.
Policies should take into account that emerg-ing markets with current account defi cits fi nanced with short-term capital fl ows could be particularly vulnerable to rapid shifts in global risk appetite. In addition, those coun-tries that have either engaged in, or been a destination for, carry-trade-related activities may be impacted by adjustments in exchange rates resulting from an unwinding of global carry trades. This would include, for example, countries in emerging Europe where household mortgages have been denominated in Swiss francs. More generally, the repricing of credit will raise the cost of capital to emerging market corporates borrowing externally, creating a drag on growth.

CHAPTER 1 ASSESSING RISKS TO GLOBAL FINANCIAL STABILITY
38
Emerging markets need to step up surveillance of risks of credit indiscipline and related vulnerabilities.
The vulnerabilities that may be building as a result of the weakening of credit and market dis-cipline represent an area for attention. In some cases, private sector borrowers in emerging markets are adopting relatively risky strategies to raise fi nancing, often taking exchange rate risk, and thus increasing their exposure to volatility. Capital market fi nancing has supported rapid credit growth, but investors may not be willing in the event of continued turbulence to lend to weaker banks. As well, emerging markets are facing other challenges related to surging capi-tal infl ows. Thus, even as the funding liquidity disruptions in mature markets work themselves out, deleveraging and a pullback from risky assets is likely to continue. While these develop-ments may be offset to some degree by high GDP growth and improved macroeconomic policies, authorities in some emerging markets could intensify monitoring and strengthen poli-cies to ensure that risks remain manageable.
Greater external borrowing by emerging market corporations and exposure to foreign currency risk require increased surveillance, as does the exposure of domestic fi nancial institutions to synthetic and struc-tured products.
Many emerging market central banks collect information on foreign borrowing by local cor-porations. However, the growth of cross- currency swap markets and the availability of various means of transforming currency exposure mean that monitoring systems need to be strengthened. Regulators should be proactive in gathering market intelligence that can reveal the underly-ing scale and motivations for capital fl ows. In addition, fi nancial engineering that takes credit exposures offshore through various entities may not be fully captured by offi cial data. Financial institutions in countries where local markets are underdeveloped or have low yields have found structured and synthetic instruments alluring. While these instruments have their rightful place under sound asset and liability management practices, users of them need to be aware of risks
should volatility disrupt pricing and returns. Regulators could try to ensure that exposures to interest rate and currency derivatives that embed features that enhance yield are well understood by local investors and borrowers, and that expo-sures are seen as manageable.
With numerous two-way channels open to international markets, and the growth of derivative-related transac-tions, capital controls may be offering less insulation.
Expectations of exchange rate apprecia-tion can increase short-term debt-related fl ows into emerging markets. These can complicate policymaking, leading to imbalances in domestic markets and increasing external fi nancing risks. This makes it more diffi cult for policymakers to set independent paths for interest rates and/or exchange rates. Offi cial restrictions on offshore-onshore trading offer some protection against speculative fl ows. However, persistent imbal-ances between onshore and offshore rates tend to encourage circumvention, as has been the case in a number of Asian and Latin American markets. Efforts to strictly enforce barriers have had mixed results (see Chapter 3).
Addressing structural weaknesses and fragilities in local markets and strengthening the framework for monetary operations are a critical focus.
Capital infl ows can pose signifi cant challenges for policymakers, at times overwhelming foreign exchange and money markets. Market volatility in the short term—some of which is attributable to rapid infl ows—can hamper banks’ efforts to man-age their assets and liabilities, as hedging becomes more diffi cult. Policymakers need to develop fl ex-ible monetary operation frameworks and remove remaining rigidities in money markets to avoid inadvertently inviting speculative infl ows.
In sum, recent events have suggested a number of areas requiring the attention of both the public and private sectors. Some initial lessons and possible policy responses are provided above, but there is still much to learn, since events are still unfolding. It will be important for policymakers to weigh the benefi ts of rapid responses against the longer-term costs (perhaps unintended) that they may entail.

39
Annex 1.1. The Global Financial Stability Map
This annex outlines the indicators selected for each of the broad risks and conditions in the global fi nancial stability map. To complete the map, these indicators are supplemented by mar-ket intelligence and judgment that cannot be adequately represented with available indicators.
To begin construction of the stability map, we determine the percentile rank of the cur-rent level of each indicator relative to its history to guide our assessment of current conditions, relative both to the April 2007 GFSR and over a longer horizon. Where possible, we have therefore favored indicators with a reasonable time series history. However, the fi nal choice of positioning on the map is not mechanical and represents the best judgment of IMF staff. The stability map remains a work in progress and will be developed further in future GFSRs. As the concepts underlying the risks and conditions are refi ned, alternative indicators that represent them more effectively could replace some of those discussed below.49
Table 1.6 shows how each indicator has changed since the April 2007 GFSR and our overall assessment of the movement in each risk and condition.
Monetary and Financial Conditions
The availability and cost of funding linked to global monetary and financial conditions (Fig-ure 1.26). To capture movements in general monetary conditions in mature markets, we begin by examining the cost of central bank liquidity, measured as the average level of real short rates across the G-7. From there, we take a broad measure of excess liquidity, defi ned as the difference between broad money growth and estimates for money demand. Realizing that the channels through which the setting of monetary policy is transmitted to fi nancial
49Bell and Dattels (forthcoming) provides a fuller discussion of the concepts and construction of the global fi nancial stability map.
markets are complex, some researchers have found that including capital market measures more fully captures the effect of fi nancial prices and wealth on the economy. We therefore also use a fi nancial conditions index that incorpo-rates movements in exchange rates, interest rates, credit spreads, and asset market returns.
ANNEX 1.1. THE GLOBAL FINANCIAL STABILITY MAP
Table 1.6. Changes in Risks and Conditions Since the April 2007 Global Financial Stability Report
Conditions and RisksChange since April
2007 GFSR
Monetary and Financial Conditions ↓• G-7 average real short rate ↓• G-3 excess liquidity ↑• Financial conditions index ↓• Growth in official reserves ↑Risk Appetite ↓↓• Investor survey of risk appetite ↓• State Street investor confidence ↑• Flows into emerging market bond
and equity funds ↓• Risk aversion index ↓Macroeconomic Risks ↑• World Economic Outlook global
growth risks ↑• G-3 confidence indices ↔• Economic surprise index ↓Emerging Market Risks ↔• Fundamental EMBIG spread ↔• Sovereign ratings upgrades/
downgrades ↔• Private sector credit growth ↑• Inflation volatility ↔Credit Risks ↑↑↑• Global high-yield index spread ↑• Credit quality composition
of high-yield index ↑• Speculative default rate forecast ↑• LCFI portfolio default probability ↑Market and Liquidity Risks ↑↑• Hedge fund estimated leverage ↓• Speculative positions in futures
markets ↑• Common component of asset returns ↑• World implied equity risk premia ↔• Composite volatility measure ↑• Financial market liquidity index ↑
Note: Changes are defined for each risk/condition such that ↑signifies more risk or easier conditions and ↓ signifies the converse. ↔ indicates no appreciable change. EMBIG = Emerging Markets Bond Index Global; LCFI = large complex financial institutions.

CHAPTER 1 ASSESSING RISKS TO GLOBAL FINANCIAL STABILITY
40
Rapid increases in offi cial reserves held by the central bank create central bank liquidity in the domestic currency and in global markets. In recent years, the investment of a large share of these reserves into U.S. treasuries and agencies has contributed to the low yields in global fi xed-income markets. To measure this, we look at the growth of offi cial international reserves held at the Federal Reserve.
Risk Appetite
The willingness of investors to take on additional risk by increasing exposure to riskier asset classes, and the consequent potential for increased losses (Figure 1.27). We aim to measure the extent to which investors are actively taking on more risk. A direct approach to this exploits survey data that explicitly seek to determine the risk-taking behavior of major institutional investors. The Merrill Lynch Investor Survey asks more than 300 fund managers what level of risk they are currently taking relative to their benchmark. We then track the net percentage of investors reporting higher-than-benchmark risk-taking. An alternative approach is to examine institutional holdings and fl ows into risky assets, on the basis that an increase in such positions signals an increased willingness of institutional inves-tors, relative to individual domestic investors, to take on risk. The State Street Investor Confi -dence Index uses changes in investor holdings of equities relative to safer assets to measure risk appetite, covering portfolios with around 15 percent of the world’s tradable assets. In addition, we take account of fl ows into emerging market equity and bond funds as these repre-sent another risky asset class. Risk appetite may also be inferred indirectly by examining price or return data. As an example of this approach, the Goldman Sachs Risk Aversion Index measures investors’ willingness to invest in risky assets as opposed to risk-free securities, building on the premises of the Capital Asset Pricing Model. By comparing returns between treasury bills and equities, the model allows the level of risk aver-sion to move over time. Taken together, these
measures cover various aspects of risk-taking and provide a broad indicator of risk appetite.
Macroeconomic Risks
Macroeconomic shocks with the potential to trigger a sharp market correction, given existing conditions in capital markets (Figure 1.28). Our principal assess-ment of the macroeconomic risks is based on the analysis contained in the World Economic Out-look and is consistent with the overall conclusion reached in that report on the outlook for, and risks associated with, global growth. We comple-ment that analysis by examining measures that focus on movements in confi dence about the overall economic outlook. First, we look at the GDP-weighted sum of confi dence indices across the major mature markets to determine whether business and consumers are optimistic or pes-simistic about the economic outlook. Second, we examine an index of economic activity surprises. This index shows whether data releases are consistently surprising fi nancial markets on the upside or downside to capture the extent to which informed participants are likely to have to revise their outlook for economic growth in light of realized outcomes.
Emerging Market Risks
Underlying fundamentals in emerging markets and vulnerabilities to external risks (Figure 1.29).These risks are conceptually separate, though closely linked to macroeconomic risks, as they focus on emerging markets only as opposed to the global environment. Using the model of emerging market sovereign spreads presented in previous GFSRs, we can identify the move-ment in Emerging Markets Bond Index Global (EMBIG) spreads accounted for by changes in the fundamentals of emerging market countries as opposed to the spread changes resulting from external factors. These fundamental factors account for changes in economic, political, and fi nancial risks within the country. This is then complemented by examining the trend in sov-ereign rating actions of Standard & Poor’s and

41
Moody’s. Such a measure attempts to capture improvements in both the macroeconomic envi-ronment facing such economies and progress in reducing vulnerabilities arising from exter-nal fi nancing needs. We also want to measure fundamental conditions in emerging market countries that are separate from those related to sovereign debt, particularly given the reduced need for such fi nancing across many emerging market countries. Consequently, we examine the growth in private sector credit across emerging market countries. Rapid rates of credit growth have the potential to lead to fi nancial sector and household vulnerabilities and upward infl ation-ary pressures. Finally, we examine the volatility of infl ation rates across emerging markets to capture the extent to which domestic monetary policies are successfully controlling infl ation.
Credit Risks
Changes in and perceptions of credit quality that have the potential to create losses resulting in stress in systemically important financial institutions (Figure 1.30). Spreads on a global high-yield index provide a market price-based measure of investors’ assessments of corporate credit risk. We recognize, however, that such an assessment forms only part of the pricing of such assets, and that prices can deviate from fundamental valuation over extended periods of time. Consequently, we also focus on more direct measures of credit quality. To do this, we examine the credit quality composition of the high-yield index to identify whether it is increasingly made up of higher or lower quality issues. To be precise, we report the percentage of the index comprised of CCC or lower rated issues. This captures two distinct effects: fi rst, a change in the ratings of corporate issues already in the index, and second, differences in the quality of new issues that are entering the index compared with the current constituents. Both are important in measuring the overall level of credit quality. We also examine forecasts of the global speculative default rate produced by Moody’s. While forecast default rates depend
on the robustness of the underlying economet-ric model, they at least conceptually present a forward-looking measure of defaults as opposed to the traditional trailing-realized default rates. Finally, we use the credit risk indicator for LCFIs to highlight market perceptions of systemic default risk in the fi nancial sector, given our remit of focusing on fi nancial stability.
Market and Liquidity Risks
The potential for instability in pricing risks that could result in broader spillovers and/or mark-to-mar-ket losses (Figure 1.31). An indicator attempting to capture the extent of market sensitivity of hedge fund returns provides a market risk indicator for this important trading group. We also produce a speculative positions index, constructed from the noncommercial average absolute net positions relative to open interest across a range of futures contracts covering most asset classes as reported to the Commodity Futures Trading Commission. This measure will rise when speculators are taking large positional bets on futures markets relative to com-mercial traders. Next, we estimate the proportion of return variance across a range of asset classes that can be explained by a common factor. Higher correlations across asset classes tend to increase the risks of a more disorderly correction of market prices in the face of a shock. We also look at an estimate of equity risk premia in mature markets using a three-stage dividend discount model. Low ex ante equity risk premia may suggest that investors are underestimating the risk attached to equity returns and so increase potential market risks. We also look at a measure of implied volatil-ity across a range of assets to assess the extent of market concern over risk, though it may also indicate the extent to which markets are too complacent about those risks. Finally, we attempt to capture funding, secondary market trading, and perceptions of counterparty risks in core markets. To measure this aspect, we examine the spread between major mature market government securi-ties yields and interbank rates, bid-ask spreads on major mature market currencies, and daily return-to-volume ratios of equity markets.
ANNEX 1.1. THE GLOBAL FINANCIAL STABILITY MAP

CHAPTER 1 ASSESSING RISKS TO GLOBAL FINANCIAL STABILITY
42
–1
0
1
2
3
4
5
–2
–1
0
1
2
3
4
5
6
7
95
96
97
98
99
100
101
–20
–10
0
10
20
30
40
Sources: Bloomberg L.P.; Goldman Sachs; OECD; and IMF staff estimates.Note: Dashed lines are period averages. Vertical lines represent data as of the April 2007
GFSR.1A GDP-weighted average of China, the euro area, Japan, and United States. Each country
index represents a weighted average of 3-month LIBOR (35% weight), the 10-year swap rate plus the 10-year credit default swap or CDX (55%), the Goldman Sachs nominal trade-weighted dollar index (5%), and the S&P 500 stock price index (5%). Prior to October 2003, the Moody’s A-rated corporate bond index is used for corporate bond yields.
Figure 1.26. Global Financial Stability Map: Monetary andFinancial Conditions
G-7 Real Short-TermInterest Rate(GDP-weighted average,in percent)
G-3 Excess Household andCorporate Liquidity(In percent)
Composite GoldmanSachs GlobalFinancial ConditionsIndex1
(January 1991 = 100)
Custodial Reserve Holdings atthe Federal ReserveBank of New York(In percent,12-month growth)
1991 1990 94 98 2002 0695 99 2003 07
1991 1997 2000 03 0695 99 2003 07
–40
–30
–20
–10
0
10
20
30
60
70
80
90
100
110
120
–0.6
–0.4
–0.2
0
0.2
0.4
0.6
0.8
1.0
0
2
4
6
8
10
Sources: Emerging Portfolio Fund Research, Inc.; Goldman Sachs; Merrill Lynch; State Street Global Markets; and IMF staff estimates.
Note: Dashed lines are period averages. Vertical lines represent data as of the April 2007 GFSR.
Figure 1.27. Global Financial Stability Map: Risk AppetiteMerrill Lynch Fund Manager SurveyQuestion on Risk Appetite(Net percent of investorsreporting higher risk-takingthan benchmark)
Total Inflows into EmergingMarket Bond and Equity Funds(In percent of assetsunder management,13-week movingaverage)
State Street InvestorConfidence Index
Goldman Sachs Risk AversionIndex
2001 1999 2001 03 05 0703 05 07
2001 1990 93 96 99 2002 05 0703 05 07
–30
–20
–10
0
10
20
30
–15
–10
–5
0
5
10
15
Sources: Bloomberg L.P.; Dresdner Kleinwort; and IMF staff estimates.Note: Dashed lines are period averages. Vertical lines represent data as of the April 2007 GFSR.
Figure 1.28. Global Financial Stability Map:Macroeconomic Risks
G-3 Average ConfidenceIndicator(GDP-weighted average ofdeviatons from the average)
Dresdner Kleinwort GlobalEconomic Activity Surprise Index(Net number of positive lessnegative data surprises, on arolling 6-month cumulative basis)
1997 2000 02 04 0699 2001 03 05 07

43
0
200
400
600
800
1000
1200
1400
1600
–80
–60
–40
–20
0
20
40
60
80
0
5
10
15
20
25
30
35
0
0.5
1.0
1.5
2.0
2.5
3.0
Sources: Bloomberg L.P.; IMF, International Financial Statistics; JPMorgan Chase & Co.; The PRS Group; and IMF staff estimates.
Note: Dashed lines are period averages. Vertical lines represent data as of the April 2007 GFSR.
1EMBIG = Emerging Markets Bond Index Global. The model and its output exclude Argentina because of breaks in the data series related to debt restructuring. Owing to short data series, the model also excludes Indonesia and several smaller countries. The analysis thus includes 32 countries.
2Net actions of upgrades (+1 for each notch), downgrades (–1 for each notch), changes in outlooks (+/– 0.25), reviews and creditwatches (+/– 0.5).
3Using data of 44 countries.4Average of 12-month rolling standard deviations of consumer price changes in
25 emerging markets.
Figure 1.29. Global Financial Stability Map: EmergingMarket Risks
Adjusted EMBIG Spreads: Actual and Fundamentals Model Estimates1
(In basis points)
Emerging Market SovereignCredit Quality: Net CreditRatings Changes2
(12-month rolling sum of netratings upgrades lessdowngrades)
Emerging Market PrivateSector Credit Growth3
(GDP-weighted average in percent)
Median Volatility of InflationAcross Emerging MarketCountries4
(In percent)
1998
1996 98 2000 02 04 06 1996 98 2000 02 04 06
1997 99 2001 03 05 072000 02 04 06
Actual spreads(adjusted)
Fundamentalsmodel spreads
ANNEX 1.1. THE GLOBAL FINANCIAL STABILITY MAP
0
200
400
600
800
1000
1200
1400
0
5
10
15
20
25
30
35
0
2
4
6
8
10
12
14
0
1
2
3
4
5
6
Sources: Bloomberg L.P.; Merrill Lynch; Moody’s; and IMF staff estimates.Note: Dashed lines are period averages. Vertical lines represent data as of the April 2007
GFSR. LCFIs = large complex financial institutions.
Figure 1.30. Global Financial Stability Map: Credit Risks
Merrill Lynch Global High-Yield Index Spread(In basis points)
Share of CCC or Lower RatedCorporate Securities inMerrill Lynch Global High-Yield Index (In percent)
Moody’s Speculative GradeDefault Rate and 12-MonthForecast Rate (In percent)
Probability of MultipleDefaults in Select Portfoliosfor LCFIs(In percent)
1998 1999 2001 03 05 072000 02 04 06
1998 2000 2004 05 06 0702 04
Forecastdefault
rate
Actual defaultrate
06 08
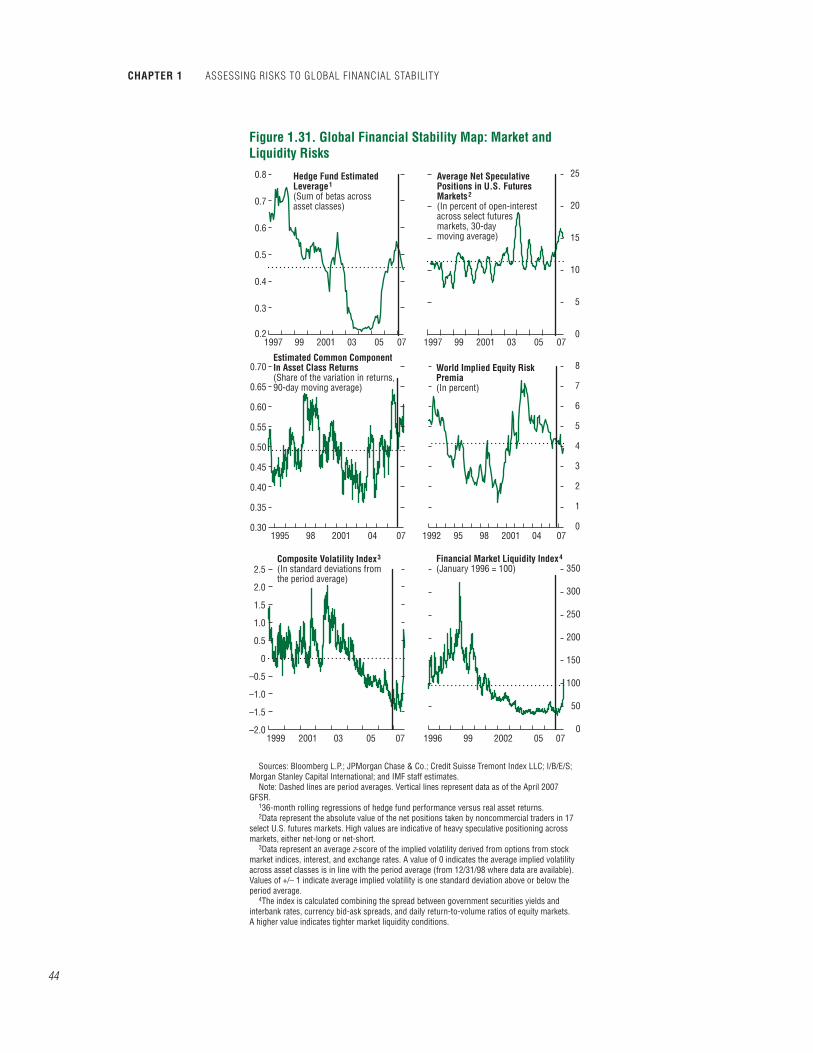
CHAPTER 1 ASSESSING RISKS TO GLOBAL FINANCIAL STABILITY
44
0.2
0.3
0.4
0.5
0.6
0.7
0.8
0
5
10
15
20
25
0.30
0.35
0.40
0.45
0.50
0.55
0.60
0.65
0.70
0
1
2
3
4
5
6
7
8
–2.0
–1.5
–1.0
–0.5
0
0.5
1.0
1.5
2.0
2.5
Figure 1.31. Global Financial Stability Map: Market andLiquidity Risks
Hedge Fund EstimatedLeverage1
(Sum of betas acrossasset classes)
Estimated Common ComponentIn Asset Class Returns(Share of the variation in returns,90-day moving average)
World Implied Equity RiskPremia(In percent)
Financial Market Liquidity Index4
(January 1996 = 100)Composite Volatility Index3
(In standard deviations fromthe period average)
Average Net SpeculativePositions in U.S. FuturesMarkets2
(In percent of open-interestacross select futuresmarkets, 30-daymoving average)
1997
1995
1999 1996 99 2002 05 072001 03 05 07
1992 95 98 2001 04 0798 2001 04 07
99 2001 03 05 07 1997 99 2001 03 05 07
Sources: Bloomberg L.P.; JPMorgan Chase & Co.; Credit Suisse Tremont Index LLC; I/B/E/S; Morgan Stanley Capital International; and IMF staff estimates.
Note: Dashed lines are period averages. Vertical lines represent data as of the April 2007 GFSR.
136-month rolling regressions of hedge fund performance versus real asset returns.2Data represent the absolute value of the net positions taken by noncommercial traders in 17
select U.S. futures markets. High values are indicative of heavy speculative positioning across markets, either net-long or net-short.
3Data represent an average z-score of the implied volatility derived from options from stock market indices, interest, and exchange rates. A value of 0 indicates the average implied volatility across asset classes is in line with the period average (from 12/31/98 where data are available). Values of +/– 1 indicate average implied volatility is one standard deviation above or below the period average.
4The index is calculated combining the spread between government securities yields and interbank rates, currency bid-ask spreads, and daily return-to-volume ratios of equity markets. A higher value indicates tighter market liquidity conditions.
0
50
100
150
200
250
300
350

45
Annex 1.2. Sovereign Wealth FundsNote: This annex was prepared by a Monetary and
Capital Markets Department staff team led by Udaibir S. Das, with inputs from the Fiscal Affairs and Statis-tics Departments.
Tentative estimates of foreign assets held by sovereigns include $5.6 trillion of interna-tional reserves and between $1.9 trillion and $2.9 trillion in types of sovereign wealth fund (SWF) arrangements. These amount to about 10 times less than the assets under manage-ment of mature market institutional inves-tors ($53 trillion) and modestly higher than those managed by hedge funds ($1 trillion to $1.5 trillion) (Financial Stability Forum, 2007). Current IMF projections are that sover-eigns (predominantly emerging markets) will continue to accumulate international assets at the rate of $800 billion to $900 billion per year, which could bring the aggregate foreign assets under sovereign management to about $12 trillion by 2012. Against the backdrop of this expected growth, this annex provides a taxonomy of SWFs, discusses their asset alloca-tion frameworks, and highlights some opera-tional issues.
Overview
The growth of SWF-type institutional arrange-ments can be seen as a policy response to the strong accumulation of foreign assets by the offi cial sector. However, SWFs are not new, espe-cially in countries rich in natural resources (e.g., oil). SWFs have recently gained prominence in several (non-oil) emerging markets and commodity-based developing countries, refl ect-ing large balance of payments surpluses.
Large current account surpluses and capital infl ows have prompted an ongoing debate on sovereigns’ underlying policies and possible adjustments, such as the appropriate level of exchange rate fl exibility, the “optimal” level of reserves, and the potential allocation of foreign assets to SWFs.
The growth in sovereign assets is turning the offi cial sector into an active investor group.50
Sovereigns’ cross-border asset allocation choices are assuming importance in the context of prudent management of public fi nancial assets. The recent literature on SWFs has focused on (1) issues of transparency in the external and government accounts; (2) different objectives of the funds, and approaches toward risk and longer-term investment horizons; and (3) the emphasis on “return” rather than “liquidity” for balance of payment needs. In particular, questions remain as to the potential impact of countries’ asset allocations and strategic invest-ments on international capital movements and asset prices.
Sovereign Wealth Funds: One Type or Several?
The reporting of sovereign fi nancial assets has focused thus far on the appropriate meth-odological treatment of reserve assets (Box 1.5). Although there is no universally agreed-upon defi nition, SWFs can generally be defi ned as special investment funds created or owned by governments to hold foreign assets for long-term purposes. SWFs can be classifi ed accord-ing to at least two criteria: (1) the sources of sovereign wealth, and (2) their policy objectives (Table 1.7).
Sources of Sovereign Wealth Funds
The funding of SWFs comes from different sources, which can be combined. Some funds are byproducts of fi scal budget surpluses accu-mulated due to a combination of revenues from exports and spending restraint. Fiscal surpluses and public savings generated domestically, such as privatization receipts, can also be sources for SWFs, as can large balance of payment sur-pluses, with or without a corresponding budget surplus.51
50See Chapter 2 of the April 2007 GFSR (IMF, 2007a).51SWFs from public savings and privatization are more
akin to nonrenewable resource funds, as they represent an increase in net fi nancial wealth.
ANNEX 1.2. SOVEREIGN WEALTH FUNDS

CHAPTER 1 ASSESSING RISKS TO GLOBAL FINANCIAL STABILITY
46
A Taxonomy Based on Policy Objectives
The following types of funds can be distin-guished, based on their dominant objectives:• Stabilization funds are set up by countries rich
in natural resources to insulate the budget and economy from volatile commodity prices (usually oil). The funds build up assets during the years of ample fiscal revenues to prepare for leaner years.
• Savings funds are intended to share wealth across generations. For countries rich in natural resources, savings funds transfer non-renewable assets into a diversified portfolio of international financial assets to provide for future generations, or other long-term objec-tives (IMF, 2007c).52
• Reserve investment corporations are funds estab-lished as a separate entity either to reduce the negative cost-of-carry of holding reserves or to pursue investment policies with higher
52See IMF (2007c). While newer oil funds pre-dominantly focus on stabilization objectives, the recent increase in oil prices has added emphasis to savings objec-tives, and in some cases, enhanced asset management.
returns. Often, the assets in such arrange-ments are still counted as reserves.
• Development funds allocate resources for fund-ing priority socioeconomic projects, such as infrastructure.
• Pension reserve funds have identified pension and/or contingent-type liabilities on the government’s balance sheet.53
Additional objectives include enhancing transparency in the management of revenues from (commodity) exports and fi scal policy. In practice, SWFs typically have multiple or gradually changing objectives. For example, some countries set up funds for both stabiliza-tion and savings objectives. As circumstances change, the objectives of the funds may also change. This is especially true for countries that export natural resources. Initially, a stabilization fund is established to smooth fi scal revenue or sterilize foreign currency infl ows. As the assets
53To some extent, development funds and even pen-sion reserve funds can be considered as subsets of SWFs that are (explicitly or implicitly) linked to long-term fi scal commitments.
Statistical and data issues raised by the use of sover-eign wealth funds (SWFs) are currently being studied by the International Monetary Fund. This box pro-vides some information about these issues.
The draft sixth edition of the Balance of Pay-ments and International Investment Position Manual (BPM6) includes a methodology for determin-ing whether foreign assets held in SWFs should be included in reserve assets. To be included in reserves, the foreign assets of the SWF need to be readily available to the monetary authorities and be a liquid claim in foreign currency on nonresidents.
A specifi c issue for SWFs is whether there is some legal or administrative guidance that results in the assets being encumbered in a way that precludes their ready availability to the monetary authorities. If the SWF’s external assets are on
the books of the central bank or an agency of the central government that exercises control over the disposition of funds, then the presump-tion is that the assets are international reserves, provided all other criteria for being a reserve asset are met, particularly liquidity (BPM6). If, however, the funds are held in a long-term fund separately incorporated, the presumption is that they should not be included in reserves. But any fi nal determination of whether an asset can be classifi ed as a reserve asset depends upon close examination of the circumstances.
Assets held in a resident SWF that are claims on nonresidents but do not meet the criteria to be classifi ed as reserve assets are classifi ed in the fi nancial accounts (transactions) and interna-tional investment position under the appropri-ate instrument and functional category.
Box 1.5. Sovereign Wealth Funds: A Statistical Perspective

47
in the fund continue to grow beyond the level needed for the purpose of stabilization, country authorities may revisit the objectives and rede-sign the structure of the fund to broaden the objective. This often leads to assets being split into several tranches for different objectives, or to the creation of separate funds with different objectives.54
Sovereign Wealth Funds and Strategic Asset Management
Two major considerations usually guide the allocation and distribution of SWF assets. Thefi rst is the accumulation and withdrawal rules regarding the fund’s future cash fl ows where applicable. The second is the fund’s objec-tives. Together, these considerations drive the strategic asset allocation (SAA), which refl ects the return objective, risk tolerance, and identi-fi ed constraints (such as liquidity and fi nancing needs, investment horizon, and legal and regula-tory requirements).
SWFs may hold assets with negative correla-tion to the country’s major exports (e.g., oil) or offset the price risk of future imports (depend-ing on the country’s risk profi le) via its SAA decisions. Funds without identifi ed liabilities allow for a more exclusive focus on a return objective and acceptable level of risk. However, for some SWFs, sterilization instruments used to mop up excess liquidity may need to be consid-ered as liabilities, especially from an integrated asset and liability management perspective.55
The objectives of SWFs could be undermined
54The institutional arrangements for managing these different types of arrangements are broadly of three categories. The fi rst two pertain to those managed by the central bank and/or an independent agency. A third cat-egory of SWFs consist of those funds already established that acquire the modality of “tiers of accounts,” that is, separate funds for different purposes. In some instances, the central bank transfers funds to the SWF, while in other cases funds are transferred to the central bank for management purposes.
55Returns on the SWFs are therefore net of interest payments to the holders of the sterilization instruments. At the same time, the currency mismatch, often resulting from issuing domestic currency liabilities, would need
by the accumulation of liabilities elsewhere in the public sector.56 Some funds, such as pension reserve funds, may have identifi ed liabilities to be matched within the SAA framework to allow for a clear operational framework and transpar-ent objectives.
SWFs’ allocations of sovereign reserve assets to domestic investments have macroeconomic implications, especially for developing and emerging market economies. To invest domesti-cally, SWFs would typically need to convert part of their accumulated assets back into domestic currency, possibly reversing the economic poli-cies that led to reserve accumulation. Investing domestically could stimulate domestic demand with infl ationary consequences. Issues of fi scal accounting, transparency, and risk could also emerge if those investments are actually gov-ernment spending operations that should take place within the budget. Therefore, domestic investments are generally seen to be ruled out in SWFs.
Different types of SWFs could have markedly different SAAs refl ective of their different objec-tives and constraints. Stabilization funds, for instance, are generally conservative in their SAA, using shorter investment horizons and low risk-return profi les, or other instruments (perhaps longer-term) that vary inversely with the risk the fund is meant to cover. Typically, such funds are designed to insulate the budget from terms-of-trade shocks and to meet contingent fi nancing requirements. In this regard, they are akin to reserves, which are managed for safety and liquidity, and it is only after such considerations are satisfi ed that higher risk/return objectives are set.
SWFs with long-term objectives, such as savings funds, may be better able to accom-modate short-term volatility in asset returns. Nonetheless, savings funds and pension reserve
to be taken into consideration when setting the SWF’s investment strategy.
56Accumulating assets in an SWF may not affect the net wealth of the public sector if, for instance, the fund is being fi nanced by issuance of public debt.
ANNEX 1.2. SOVEREIGN WEALTH FUNDS

CHAPTER 1 ASSESSING RISKS TO GLOBAL FINANCIAL STABILITY
48
Table 1.7. Size and Structure of Major Sovereign Wealth Funds
Country Fund Name AssetsSource of
Funds
Ownership andInvestment
Management
Investment Strategy andStrategic Asset Allocation
(SAA)
United Arab Emirates
Abu Dhabi Investment Authority (ADIA)/Abu Dhabi Investment Council (ADIC)
$250 billion to $875 billion1
Oil Owned by the emirate of Abu Dhabi, ADIA has been the primary conduit for investing oil surpluses in overseas assets since 1976. Recently a separate legal entity, the ADIC, was established to encourage competition with the ADIA. Abu Dhabi’s surpluses will now be allocated to both the ADIA and ADIC.
Major global investor. Investment strategy and asset allocation is unknown.
Norway Government Pension Fund—Global
$308 billion(as of March 31, 2007)
Oil Owned by the government and managed by Norges Bank Investment Management.
Global asset allocation with 40 percent in equities and 60 percent in global fi xed income.
Saudi Arabia No designated name $250+ billion2 Oil Saudi Arabia Monetary Agency manages the foreign assets: $225 billion is held on its own balance sheet, a portion of which is designated as reserves, and $51 billion is managed on behalf of various government agencies.
Major global investor. Although the size of assets is known, the investment strategy and SAA is not known beyond broad indications.
Kuwait Kuwait Investment Authority (KIA)
General Reserve Fund (GRF) and Future Generations Fund (FGF)
$160 billion to $250 billion1
Oil The KIA is an autonomous government body responsible for the management of the GRF and FGF, as well as any other funds entrusted to it on behalf of the government of Kuwait.
The GRF is invested in the local, Arab, and international fi nancial markets. The FGF has a global asset allocation based on investment guidelines approved by the FGF board.
Singapore Government Investment Corporation (GIC)
Temasek Holdings
$100+ billion
$100+ billion
Other
Other
Separate investment corporation established in 1981, fully owned by the government.
Temasek Holdings is a private company, set up in 1974 to hold and manage investment previously held by the principal shareholder, the Ministry of Finance.
Global asset allocation (not made public). Invests in all major asset classes.
SAA weights unknown. Geographical distribution as of March 2006 was 38 percent Singapore assets, 40 percent in rest of Asia, 20 percent in the Organization for Economic Cooperation and Development, and 2 percent in “other” countries.
China State Foreign Exchange Investment Corporation3
$200 billion Other To be determined. To be determined.
Russia Oil Stabilization Fund4 $127 billion(as of August 1, 2007)
Oil Owned by the government and managed by the Russian Central Bank.
Invests largely in fi xed-income assets, with 44 percent in U.S. dollars, 46 percent in euros, and 10 percent in pound sterling.

49
Table 1.7 (concluded)Australia Australian Future Fund $42 billion
(as of May 1, 2007)
Other Established in 2006. Owned by the government and managed by the Future Fund Management Agency. The aim is to underwrite the government’s future superannuation liabilities.
Australia
UnitedStates(Alaska)
Alaska Permanent Reserve Fund
$35 billion(as of June 30, 2007)
Oil and minerals
Owned by the state of Alaska, established in 1976, and managed by the state-owned Alaska Permanent Fund Corporation.
SAA consists of 53 percent equities, 29 percent fi xed income, 10 percent real estate, and 8 percent alternative assets.
Brunei Brunei Investment Authority General Reserve Fund1
$30 billion Oil Owned by the government and managed by the Brunei Investment Agency.
Invests in a large global portfolio of fi nancial and real assets. SAA not made public.
Korea Korea Investment Corporation
$20 billion Other Launched in 2005 to manage $20 billion of entrusted foreign exchange reserves, of which $17 billion is from Bank of Korea and $3 billion from the government.
Plans to invest in a global asset allocation. SAA not yet available.
Canada Alberta Heritage Savings Trust Fund
$15 billion(as of March 31, 2007)
Oil Owned by the government of the Province of Alberta, managed by Alberta Finance.
Invests in a global SAA with 30 percent fi xed income, 45 percent equities, 10 percent real estate, and 15 percent alternative assets.
Chile Economic and Social Stabilization Fund
$9.83 billion (as of July 31,
2007)
Copper Established in 2006. Owned by the government and managed by the Central Bank of Chile as a fi scal agent.
SAA consists of 72 percent government bonds and 28 percent money market instruments in U.S. dollars, euros, and yen.
Pension Reserve Fund $1.37 billion (as of July 31,
2007)
Copper Established in 2006. Owned by the government and managed by the Central Bank of Chile as a fi scal agent.
SAA consists of 79 percent government bonds and 21 percent money market instruments in U.S. dollars, euros, and yen.
Botswana Pula Fund2 $5+ billion Diamonds Owned jointly by the government and the Bank of Botswana. The government’s share of the Pula Fund is accounted for on the balance sheet of the Bank of Botswana.
The fund invests in public equity and fi xed-income instruments in industrialized economies. The fund does not invest in emerging markets, as they may be highly dependent on commodities.
Sources: Public information from websites; IMF; and Morgan Stanley Research.Note: Other countries with known sovereign wealth funds include Azerbaijan, Kingdom of Bahrain, Chad, Ecuador, Equatorial Guinea, Gabon,
Islamic Republic of Iran, Ireland, Kazakhstan, Kiribati, Libya, Malaysia, Mauritania, Mexico, Oman, Qatar, Sudan, Taiwan Province of China, Timor-Leste, Trinidad and Tobago, Uganda, and Venezuela.
1Estimates by Morgan Stanley Research and PIMCO.2In some countries, such as Saudi Arabia and Botswana, there is no formal sovereign wealth fund but the monetary agency manages
foreign assets on behalf of various government agencies.3Announced on March 9, 2007, the fund may be established at the end of 2007.4Starting in February 2008, the Oil Stabilization Fund will be divided into two separate funds with distinct policy objectives (Stabilization
Fund versus National Welfare Fund).
ANNEX 1.2. SOVEREIGN WEALTH FUNDS

CHAPTER 1 ASSESSING RISKS TO GLOBAL FINANCIAL STABILITY
50
funds also aim to preserve a minimum amount of capital, in real terms, so that the purchas-ing power of the funds is guaranteed. Pension reserve funds with explicit liabilities typically design SAA benchmarks that preserve their solvency.
Some Issues for Consideration
The cross-border asset holdings of SWFs raise issues similar to those faced by other interna-tional market participants, including their role in global fi nancial markets.
One view is that SWFs enhance market liquidity and fi nancial resource allocation. This view recognizes that SWFs, especially the larger ones, typically use a mix of well-trained in-house expertise and well-regarded international exter-nal fund managers, and have longer investment horizons that can accommodate short-term vola-tility. Consequently, their investment operations may dampen asset price volatility and lower liquidity risk premia, compared with a situation in which these assets were to be managed with shorter duration.
Another view holds, however, that the limited publicly available information on some SWFs, their multiplicity of objectives, and a lack of clarity on their institutional structure and invest-ment management, make it diffi cult to assess the SWFs’ asset management activities and their impact on the capital markets. Without more public accountability, funds may alter their gov-ernance structures, perhaps as a result of losses, which, in turn, could lead to sharp changes in investment policies, possibly exacerbating mar-ket volatility in some asset classes. The public ownership of SWFs (and other state-owned enti-ties) also raises questions about possible capital account restrictions initiated in recipient coun-tries, especially to avoid certain types of foreign direct investment.
As their size, number, and use grows, and as domestic and international public attention directed toward them increases, SWFs may be faced with several institutional and operational challenges, including:
• Defining objectives and setting and implementing sovereign asset allocation. A well-defined SAA within a clearly articulated investment policy is a critical operational component for public investment funds, and as new developments arise, a reassessment of existing objectives and constraints might be needed and reflected in the overall risk tolerance.
• Institutional arrangements, including withdrawal and accumulation rules that reflect risk-sharing arrangements between the govern-ment and the SWF, or the central bank, and establishing responsibility for investment deci-sions and their outcomes.57
• Accountability arrangements, including fiduciary duty to citizens, the legal foundation, and the internal governance structure. In practice, the public disclosure of SWFs varies significantly in terms of the nature of information and its timeliness, providing for more or less public scrutiny of the sovereign assets.There are a number of voluntary transparency
initiatives that are relevant to SWFs.58 These include the IMF’s Guidelines for Foreign Exchange Reserve Management, Balance of Payments and Inter-national Investment Position data, as well as the Coordinated Portfolio Investment Survey, the Code of Good Practices on Fiscal Transparency, and the Guide on Resource Revenue Transparency. More targeted initiatives include the Joint Oil Data Initiative and the Extractive Industries Transpar-ency Initiative.
ReferencesBaddepudi, Rajeev, 2006, “Key Trends in Asian
Hedge Funds,” The Hedge Fund Journal, Issue 21 (October). Available via the Internet: http://www.thehedgefundjournal.com/commentary/index.php?articleid=26332327.
57For instance, in the case of some oil-related SWFs, it is often diffi cult to determine on which institutions’ bal-ance sheet the assets appear.
58Further advice on setting up SWFs or alternative uses of reserves is also being provided by the IMF as part of technical cooperation advice or by addressing specifi c requests from countries.

51
Bell, Brian, and Peter Dattels, forthcoming, “The Global Financial Stability Map: Concepts and Construction,” IMF Working Paper (Washington: International Monetary Fund).
Federal Reserve Board, 2007, “The 2007 Senior Loan Offi cer Opinion Survey on Bank Lending Prac-tices” (Washington, July). Available via the Internet: http://www.federalreserve.gov/boarddocs/SnloanSurvey/200708/default.htm.
Fender, Ingo, and Janet Mitchell, 2005, “Structured Finance: Complexity, Risk and the Use of Ratings,” Bank for International Settlements Quarterly Review(June), pp. 67–79. Available via the Internet: http://www.bis.org/publ/qtrpdf/r_qt0506f.pdf.
Financial Stability Forum, 2007, “Update of the FSF Report on Highly Leveraged Institutions” (Basel: Bank for International Settlements, May 19). Avail-able via the Internet: http://www.fsforum.org/publications/HLI_Update-fi nalwithoutembargo19May07.pdf.
Fitch Ratings, 2007a, “Subprime Worries? Financial Guarantors Exposure to Weaker RMBS Originator/Servicers,” Special Report (March 14). Available via the Internet: http://www.afgi.org/pdfs/Subprime Worries_FG_3.14.07.pdf.
–––––, 2007b, “Hedge Funds: The Credit Market’s New Paradigm,” Special Report (June 5). Available via the Internet: http://www.fi tchrating.com/corpo-rate/reports/report_frame.cfm?rpt_id=299928.
Froot, Kenneth A., Paul G.J. O’Connell, and Mark S. Seasholes, 2001, “The Portfolio Flows of Interna-tional Investors,” Journal of Financial Economics, Vol. 59 (February), pp. 151–93.
International Monetary Fund (IMF), 2005, GlobalFinancial Stability Report, World Economic and Financial Surveys (Washington, April). Available via the Internet: http://www.imf.org/External/Pubs/FT/GFSR/2005/01/index.htm.
–––––, 2006, Global Financial Stability Report, World Eco-nomic and Financial Surveys (Washington, April). Available via the Internet: http://www.imf.org/External/Pubs/FT/GFSR/2006/01/index.htm.
–––––, 2007a, Global Financial Stability Report, World Economic and Financial Surveys (Washington,
April). Available via the Internet: http://www.imf.org/External/Pubs/FT/GFSR/2007/01/index.htm.
–––––, 2007b, World Economic Outlook, World Economic and Financial Surveys (Washington, October).
–––––, 2007c, “The Role of Fiscal Institutions in Man-aging the Oil Revenue Boom,” IMF Policy Paper (Washington, March 5), SM/07/88. Available via the Internet: http://www.imf.org/external/np/pp/2007/eng/030507.pdf.
Irvine, Steven, 2007, “Why ‘Syndicated Investing’ Is the New Big Thing,” Finance Asia.com (May 8).
Kealhofer, Stephen, 2003, “Quantifying Credit Risk I: Default Prediction,” Financial Analysts Journal, Vol. 59 (January/February), pp. 30–44.
Laurelli, Peter, 2007, “Hedge Fund Industry Asset Flows and Trends,” Hedge Fund Asset Flows & Trends Report No. 11 (New York: Channel Capital Group, Inc.). Available via the Internet: http://www.iialternatives.com/AIN/fundfl ows/sample.pdf.
Moody’s, 2007, “U.S. Subprime Market Crisis: Limited Impact on Asian Banks Due to Small Exposures,” Special Comment (August). Available via the Internet: http://www.moodys.com/moodys/cust/research/MDCdocs/02/2006800000444201.pdf
Ryback, William, 2007, “Hedge Funds in Emerging Markets,” Banque de France Financial Stability Review,Special Issue on Hedge Funds, No. 10 (April).
Standard & Poor’s, 2007a, “U.S. Bond Insurers With-stand Subprime Stress,” RatingsDirect (August 2). Available via the Internet: http://www2.standardandpoors.com/portal/site/sp/en/us/page.article/3,1,1,0,1148446441747.html.
–––––, 2007b, “U.S. Subprime Impact Limited on Rated Asia-Pacifi c Banks and Insurers,” RatingsDirect(August 3). Available via the Internet: http://www2.standardandpoors.com/portal/site/sp/en/us/page.article/3,1,1,0,1148446442262.html.
Violi, Roberto, 2004, “Credit Ratings Transition in Structured Finance” (Basel, Switzerland: Bank for International Settlements, Committee on the Global Financial System Working Group on Ratings in Structured Finance, December). Available via the Internet: http://www.bis.org/publ/cgfs23violi.pdf.
REFERENCES

5252
2CHAPTER
From 2002 to early 2007, the decline in vola-tility in the global economy and fi nancial markets was refl ected in lower measures of
market risk, which encouraged fi rms to increase their risk-taking, thereby enhancing market liquidity and resulting in even lower levels of vola-tility (Figure 2.1). Conversely, shocks in an envi-ronment of heightened risk-taking could result in a rapid deterioration of such a benign envi-ronment, as reductions in risky positions lead to rising volatility and asset correlations, a reduction in market liquidity, and a further retrenchment in risk-taking.1 As similar market risk measure-ment techniques spread across more institutions, the question arises as to whether the potential for reinforcing behavior has increased, given that past and current episodes of stress indicate that many fi nancial institutions react by following the basic tenets of their risk management systems by selling risky assets, calling in higher-quality collat-eral, and increasing margin requirements.2
Note: This chapter was written by John Kiff, Laura Kodres, Ulrich Klueh, and Paul Mills, with the aid of Jon Danielsson on risk modeling. Yoon Sook Kim provided research support.
1See Persaud (2000 and 2003) for early expressions of this possibility.
2This chapter focuses primarily on market risk in the trading books of large investment and commercial banks.
Certainly, over the last decade, the risk man-agement techniques of fi nancial institutions have greatly improved, been used more broadly, and may, along with specialized instruments, have con-tributed to the lower volatility and less pronounced disruptions of markets. Over time, fi nancial institutions have taken a more holistic view of their risks and have instituted better risk management practices. These have included improved internal and external reporting of various types and mea-sures of risk, better decision-making structures, and greater involvement of boards of directors in setting the risk appetite of the fi rm and overseeing risk management policies. Moreover, the use of more rigorous risk modeling has made fi rms more sensitive to, and aware of, their risks—the fi rst defense against systemic problems.
Value-at-risk (VaR) methods are now used almost universally by banks, as well as by many hedge funds, to measure market risk. Put simply,
Trading book positions are held with the intention of profi ting from transaction fees or short-term changes in valuations. Banks hold credit and interest rate risk (a component of market risk) in their banking books, where the intention is to hold the position for more than one year. For many commercial banks this can be where their greatest risks lie. Aggregation problems across risk catego-ries are discussed later in this chapter.
This chapter assesses how market risk management techniques may have contrib-uted to the benign financial environment of recent years, and whether seemingly prudent behavior by individual firms, reacting to similar market risk systems, could serve to amplify market volatility in periods of stress beyond what would otherwise have occurred. Based on simulations and observed risk management practice, there are grounds for believing that this could be the case. Results of the simulations suggest that, in a period of stress, having a variety of risk mod-els is more stabilizing than uniformity. Perhaps more important, however, is the presence of a variety of types of financial institutions with differing investment horizons and risk appetites, as well as the scope to take offsetting positions when prices overshoot and “fire sales” occur.
DO MARKET RISK MANAGEMENT TECHNIQUES AMPLIFY SYSTEMIC RISKS?

53
VaR is an estimate of the expected loss that an institution is unlikely to exceed in a given period with a particular degree of confi dence. VaR is usually supplemented with other tools, and risk managers say that they do not (and will not) react to the signals from any one of their risk models mechanistically. Nonetheless, most market participants maintain position limits, some of which are connected to the measures discussed in this chapter, and these and similar risk mitigation techniques may reinforce the natural inclination for fi rms to close positions during periods of price pressures and liquidity strains.
This chapter focuses particularly on VaR not only because it has become the most widely used measure for market risk management among banks, but also because it is an archetype of other risk management techniques—the fac-tors that infl uence VaR also drive other risk measures. In addition, VaR forms the basis for a number of risk controls (e.g., position limits and margin requirements) as well as for regu-latory market risk capital, and shares many of the same traits as banks’ economic risk capital (ERC) models.3 Showing what happens to VaR measures in benign and stressful periods should illustrate the signals other risk management measures are giving to banks and hedge funds. For instance, the characteristics of standard-ized VaR techniques––their backward-looking nature and treatment of tail events—are shared by other approaches that, if used instead, could also lead to the amplifi cation of volatility.
The fi rst part of this chapter reports the results of VaR simulations to demonstrate that, even when calculated with differing sets of parameters, VaR measures react similarly in periods of both low volatility and stress. This sug-
3ERC models measure the amount of capital required to absorb losses from extremely unlikely events over long time horizons. For example, typical ERC models use con-fi dence intervals of up to 99.97 percent (versus 95 to 99 percent for VaR models) and horizons of up to one year (versus one to 10 days for VaR models). ERC calculations account not just for market risk, but also for credit and operational risks, and may make provision for liquidity, legal, and reputational risks.
0
50
100
150
200
250
2000 02 04 06
Source: Bloomberg L.P.Note: VIX is the Chicago Board Options Exchanges S&P Volatility Index. MOVE is
the Merrill Lynch Option Volatility Estimate Index. The JPMorgan VXY index measures volatility in a basket of G-7 currencies.
Figure 2.1. Implied Volatility Indices(January 2000 = 100)
Equities (VIX)
Interest rates (MOVE)
G-7 currencies (VXY)

CHAPTER 2 DO MARKET RISK MANAGEMENT TECHNIQUES AMPLIFY SYSTEMIC RISKS?
54
gests that risk management systems could lead to similar reactions by market participants. A new type of exercise is then described in which a set of fi rms adjust their asset holdings in response to risk perceptions based on VaR estimates. The collective impact of their reactions demonstrates that market price dynamics can be amplifi ed by the models during stressful times.
The second part of the chapter investigates the extent to which market risk measures may be adhered to during stressful periods and how they could amplify market stresses. Given that the simulation results are only suggestive, the connections between market risk models and fi rms’ behavior are critical to understanding the potential for amplifi cation of volatility and herding behavior.4 It is comforting that most risk managers say they understand the shortcom-ings of their models and believe that they have the latitude to make an independent assessment of their risk-taking during a period of stress. However, some fi rms have less well-developed risk management systems and may be prone to interpret their models more rigidly.
To circumvent the potential for a mechanistic reaction to risk model signals to amplify shocks, rather than just a diversity of risk models, it seems more important to have a range of underlying positions being taken by fi nancial institutions, or other market participants who are able to step in, with suffi cient capital, to take risky positions during such periods. Hedge funds are one such set of institutions where market risk models are used more fl exibly and position limits tend to be less binding. While not the focus of this chapter, other institutions—such as pension funds and insurance companies—also have different invest-ment horizons and strategies, which may allow them to ride out a stressful period without adding to dislocations (IMF, 2004).
Three important policy implications fl ow from this chapter’s examination of market risk management techniques and models:
4“Herding” arises in fi nancial markets when market participants’ investment decisions are made on the basis of the short-term actions of others, rather than on funda-mental characteristics.
• While continuing to raise the overall quality of market risk management, supervisors and other policymakers need to acknowledge and encourage risk management approaches that reflect firms’ particular business and risk pro-files and that can be tested with relevant stress scenarios.
• Financial institutions could be more transparent and disclose to investors and counterparties how their market risk management systems would react and could be managed in a stressed envi-ronment, rather than simply reporting aspects of a single risk metric, such as VaR.
• Policymakers should recognize that a diversity of market participants with differing invest-ment strategies and horizons, and with differ-ent risk management systems, is more likely to be conducive to market stability.To help mitigate the collective action prob-
lems potentially caused by the similarity of responses to market risk models (or risk limits) in periods of systemic stress, more fi nancial insti-tutions need to become aware beforehand that such events can take place and make provision for such circumstances, allowing them to react more fl exibly at such moments.
VaR and Other Risk Management Techniques
While typical market risk management frame-works use a complex set of different techniques, the VaR measure is at the heart of current practice in most fi nancial institutions. VaR was fi rst used by major fi nancial institutions in the late 1980s. JPMorgan’s release of its VaR meth-odology as RiskMetrics™ in 1994 brought it into mainstream practice. Since then it has become the primary quantitative measure of market risk within most fi nancial institutions—especially for fi xed-income, equity, and foreign exchange positions—and is the cornerstone of the 1996 market risk amendment to the Basel Accord (BIS, 1996). VaR is a useful standardized yard-stick across portfolios within a fi rm over time, and its basic concepts have been extended to more recent ERC measures (Box 2.1).

VAR AND OTHER RISK MANAGEMENT TECHNIQUES
55
Technically, VaR is an estimated portfolio loss that a fi rm or portfolio is unlikely to exceed, over a given time horizon, at a given probability level. It is expressed in the monetary units of the fi rm’s accounts or the portfolio’s value. For instance, if a fi rm’s one-day estimated VaR is $10 million, at a confi dence level of 95 percent, this implies that a loss of $10 million or greater is expected on fi ve trading days out of 100. The
time horizon chosen usually ranges from one to 10 days, depending on how long it is estimated it would take to liquidate or hedge a position or portfolio. The level of statistical confi dence is usually set at between 95 and 99 percent—the higher the confi dence level, the more cautious the measure. The Basel II Accord stipulates that, for the purpose of establishing bank regulatory market risk capital, a 99 percent (one-tailed)
While VaR constitutes the cornerstone of most market risk management systems, it has been criticized for saying nothing about the size of potential large gains or losses in the tail of the profi t and loss (P&L) distribution. This has prompted a number of efforts to examine the more extreme possible outcomes.
Expected shortfall (ES), which measures the expected loss if losses exceed the VaR, has been suggested as an alternative that overcomes this criticism (Artzner and others, 1999). Whereas VaR at a given confi dence level, α, is defi ned as the maximum loss expected to occur with prob-ability, p = (1–α), ES is the conditional expecta-tion of loss given that the loss is beyond the VaR level. Liang and Park (2007) fi nd that hedge fund returns are better explained by ES because they are more likely to be exposed to the tails of P&L distributions.1
VaR may also not be appropriate for P&L distributions with “fat” and “super fat” tails—portfolios containing assets that change very little in price most of the time but occasionally jump, such as loans that rarely default and some option positions (Danielsson and others, 2006). Much of the academic literature has therefore focused on improving VaR through the use of more appropriate distributional assumptions and extreme value theory. Bams, Lehnert, and Wolff (2005) evaluate a number of these approaches against more standard techniques.
1See Lo (2001) for a list of other reasons why VaR may not be an appropriate hedge fund risk measure.
However, their fi ndings suggest that more sophisticated tail modeling often leads to VaR being estimated with a higher degree of uncer-tainty because there are too few underlying tail observations for precise estimates.2
Generally, these other measurement tech-niques have not been widely applied in fi nancial institutions. Many fi rms recognize that VaR does not adequately capture episodes of extreme volatility and market illiquidity, but the alter-natives are typically data intensive, diffi cult to verify through backtesting, and hard to explain to senior management. Thus, fi nancial institu-tions tend to complement VaR measures with more straightforward stress tests to assess the impact of tail events.
2See ECB (2007) for a more detailed review of alternatives to VaR, and Bervas (2006) for a summary of recent work on VaR measures that incorporate liquidity risk (“L-VaRs”).
Box 2.1. Criticism of VaR-Based Risk Management Models and Alternatives
0
0.1
0.2
0.3
0.4
0.5
ProfitLoss
Conditionalexpectation
VaR
Expected shortfall (ES)
VaR (95%) = –1.64
ES = –2.06
Probability
Profit-lossdistribution
(Standard normal:μ = 0, σ = 1)
α = 0.05

CHAPTER 2 DO MARKET RISK MANAGEMENT TECHNIQUES AMPLIFY SYSTEMIC RISKS?
56
confi dence interval be used over a 10-day horizon.5
To calculate a VaR, one needs two elements—a set of positions in fi nancial instruments (the portfolio) and their prospective returns (or price changes). Typically, the positions are taken as fi xed for the time horizon under consid-eration (e.g., for one or 10 days), and so the critical assumption concerns the distribution of expected price changes. Different assumptions
5The accord also stipulates that the probability calcu-lation’s statistical inputs (market value volatilities and correlations) be based on at least one year of profi t and loss data—if calculated over shorter horizons, banks must scale them up to a 10-day horizon by the “square root of time rule.” For example, a $100 million one-day VaR is scaled up to a $316 million 10-day VaR by multiplying by the square root of 10 (3.16). See Danielsson and Zigrand (2006) for a critique of this scaling rule.
give rise to alternative measurements of VaR (see Box 2.2 for the two measures used below).
VaR is best suited to quantify portfolio risks under typical market conditions. And, as is true of most statistical models, VaR assumptions about future price changes are derived from actual changes in the recent past, suffering similar weaknesses as other models (Box 2.1). Stress tests are a way to assess potential portfo-lio impacts of atypical events (BIS, 2005) and entail either scenario or sensitivity analysis.6
6When the IMF conducts a Financial Sector Assess-ment Program (FSAP) of a member country’s fi nancial system, country authorities and IMF staff jointly conduct “stress tests.” These, however, differ from banks’ usual scenario or sensitivity analyses in that they test a (cont.)country’s vulnerability over the medium term to a macro-economic or system-wide shock, rather than a short-term extreme movement in market prices.
In the simulation exercises reported, two alternative ways of constructing VaR are consid-ered: exponentially weighted moving average and historical simulation. In each method, the proportions of the assets in the portfolio are considered fi xed and the price changes (return) variances and their covariances across the assets take on different assumptions.
Exponentially weighted moving average: This method assumes that each asset’s price change (or return) can be characterized by a variance that changes over time. The variance is updated each day using a weighted average of yesterday’s estimated variance and yesterday’s squared return of the asset:
ht = λ ht–1 + (1 – λ) rt–12,
where ht is the variance of the asset at time t and rt–1 is the return at time t–1. An initial variance, h0, is constructed using an early part of the sample, say, the fi rst 30 days. The weight (λ), usually between 0.86 and 0.98, is chosen to put more weight on the most recently estimated variances. A similar method weights the covari-ance between every two assets in the portfolio. These variances and covariances, along with the
portfolio proportions, are used to construct a portfolio value and variance. This conditional variance, along with an assumption of normal-ity, is used to construct the VaR estimate for the next day. Typically a 95th or a 99th percentile of a normal distribution is used.
Historical simulation: The second approach assumes that the history of price changes for the assets in the portfolio over some past period (say the last 300 days) is a good guide to what the price changes will be tomorrow. These price changes are then applied to the portfolio’s posi-tions to produce a range (or distribution) of possible portfolio outcomes. From that distribu-tion, the 95th or the 99th percentile defi nes the VaR obtained by taking the 15th smallest observations from the historical sample (in the case of the 95th percentile VaR with a sample size of 300 days). The historical data “window” moves through time so the most recent days are used. A long enough window is needed so that the 95th (or other percentile) corresponds to an integer data observation with at least a few other tail observations to reduce statistical uncertainty.
Box 2.2. The Basics for Constructing VaR Measures

57
Scenario analysis usually draws from histori-cally stressful events such as the October 1987 stock market crash, the 1997 Asian crisis, or the bursting of the technology stock bubble and estimates the current portfolio’s maximum loss and/or VaR if similar circumstances were to be repeated. Sensitivity analysis quantifi es the impact of standardized large movements in the relevant fi nancial instruments, so that vulner-abilities to hypothetical extreme events can be identifi ed.
Assessing Amplifi cation Effects in a Stylized Market Risk Management Framework7
Analytical Framework
The objectives of this section are twofold: fi rst, to analyze the behavior and performance of VaR measures for different portfolios in two types of environments—the recent period of falling volatility and a hypothetical stressful period; and second, to examine whether VaR-based risk management procedures have the potential to destabilize price dynamics. To set such cycles in motion, linkages between VaR-type measures and trading behavior would need to function, at least partly, in a mechanistic way, through trading limits based on VaR, margin requirements and capital regulation, or behavioral channels. In addition, risk measures across institutions would need to become suffi ciently similar, resulting in more correlated behavior than otherwise. Finally, the VaR measures would then need to react to the market dynamics resulting from the corre-lated behavior to produce a feedback mechanism.
The fi rst exercise gauges the sensitivity of VaR measures to changes in the volatility of the market environment by examining two distinct scenarios:8
7This discussion summarizes the methodology and results of a VaR simulation exercise. A fuller descrip-tion and analysis is provided in Danielsson, Klueh, and Zigrand (forthcoming).
8This fi rst exercise builds on the approach taken in Bank of England (2007).
• The decline in volatility of many financial assets over the past several years. To what extent has falling volatility resulted in declining VaR measures on unchanged portfolios? Are different portfolios characterized by similar adjustment paths, and how does the choice of alternative VaR techniques affect the results?
• An episode of financial market distress, when volatilities and correlations strongly increase in an abrupt fashion. What are the adjustment paths and liquidation pressures that unfold during extended periods of distress, and how are these dynamics influenced by the choice of sample period and other assumptions?The exercise is conducted with three port-
folios that resemble stylized positions that may be taken by an investment bank’s proprietary trading desk:9
• A broad portfolio with wide-ranging asset classes, including long positions in mature market stocks from several countries, emerg-ing market stocks, 10-year fixed-income securities, exposures to commodity price fluctuations, and long foreign currency and two-year interest rate swap positions;
• A portfolio with greater exposure to emerging market risks, with a geographic focus on Asia and Latin America;10 and
• A portfolio with greater exposure to riskier mature market instruments, particularly equi-ties and high-yield debt instruments.The VaR of a portfolio refl ects daily profi t
and loss (P&L) (reported here in U.S. dollars), meaning that currencies have to be added as an additional asset for each nondollar asset. The value of each portfolio is fi xed at $1,000. The two choices of VaR methodology were guided by actual industry practice and the need for suffi -ciently distinct approaches to generate meaning-ful comparisons (Box 2.2):
9None of the portfolios involve options or other posi-tions with nonlinear payoffs.
10These regions were chosen to represent emerging markets where investment banks and hedge funds had greatest exposures over the data period, which includes the Asian and Long-Term Capital Management crises.
ASSESSING AMPLIFICATION EFFECTS IN A STYLIZED MARKET RISK MANAGEMENT FRAMEWORK

58
• The historical simulation (HS) methodology assumes that recent price changes will be representative of changes in the future. It uses actual P&L observations over the previous 400 days to estimate the theoretical quantiles of the P&L distribution one day into the future.
• The exponentially weighted moving average (EWMA) methodology applies exponentially declining weights to the underlying variances and covariances of the asset returns. A higher value for the weighting parameter, λ, implies a more persistent reaction to a given shock. Here, λ is set to 0.94—a standard market practice inspired by RiskMetrics™ (JPMorgan, 1993). The covariance matrix, combined with an assumption of conditional normality, is then used to calculate a VaR forecast one day into the future.A number of validation exercises (referred to
as “backtesting”) confi rm that the number of loss exceptions to the estimated VaR is generally in line with the model’s intended construction. For example, at a confi dence level of 95 per-cent, losses exceeding the one-day VaR should occur on around fi ve days out of 100.
VaR at the Firm Level in a Period of Declining Volatility
While the decline in volatility over recent years is well established for many asset classes, it is interesting to see how it translates into lower VaR estimates, and how the observed adjustment paths of VaR depend on the actual estimation approach. The backtesting exercises show how the decline in historical asset vola-tilities affects the number of VaR exceptions. Using the HS method and constant propor-tions of assets in the broad portfolio, there is a clustering of exceptions during the turbulent 1997–98 episode (Figure 2.2) and a paucity of violations during the recent calmer period (Figure 2.3).
For all portfolios, both HS (upper panel of Figure 2.4) and EWMA (lower panel of Fig-ure 2.4) methods yield a decrease in the VaR. It
–0.03
–0.02
–0.01
0
0.01
0.02
0.03
1997 1998
Sources: Bloomberg L.P.; and IMF staff estimates.Note: HS VaR = historical simulation of value-at-risk. Yellow squares indicate VaR
violations.
Figure 2.2. Backtesting Results: Broad Portfolio,October 1997 to October 1998
Portfolio return
Implied by 95% HS VaR
–0.03
–0.02
–0.01
0
0.01
0.02
2006 2007
Sources: Bloomberg L.P.; and IMF staff estimates.Note: HS VaR = historical simulation of value-at-risk. Yellow squares indicate VaR
violations.
Figure 2.3. Backtesting Results: Broad Portfolio,June 2006 to June 2007
Portfolio return
Implied by 95% HS VaR
CHAPTER 2 DO MARKET RISK MANAGEMENT TECHNIQUES AMPLIFY SYSTEMIC RISKS?
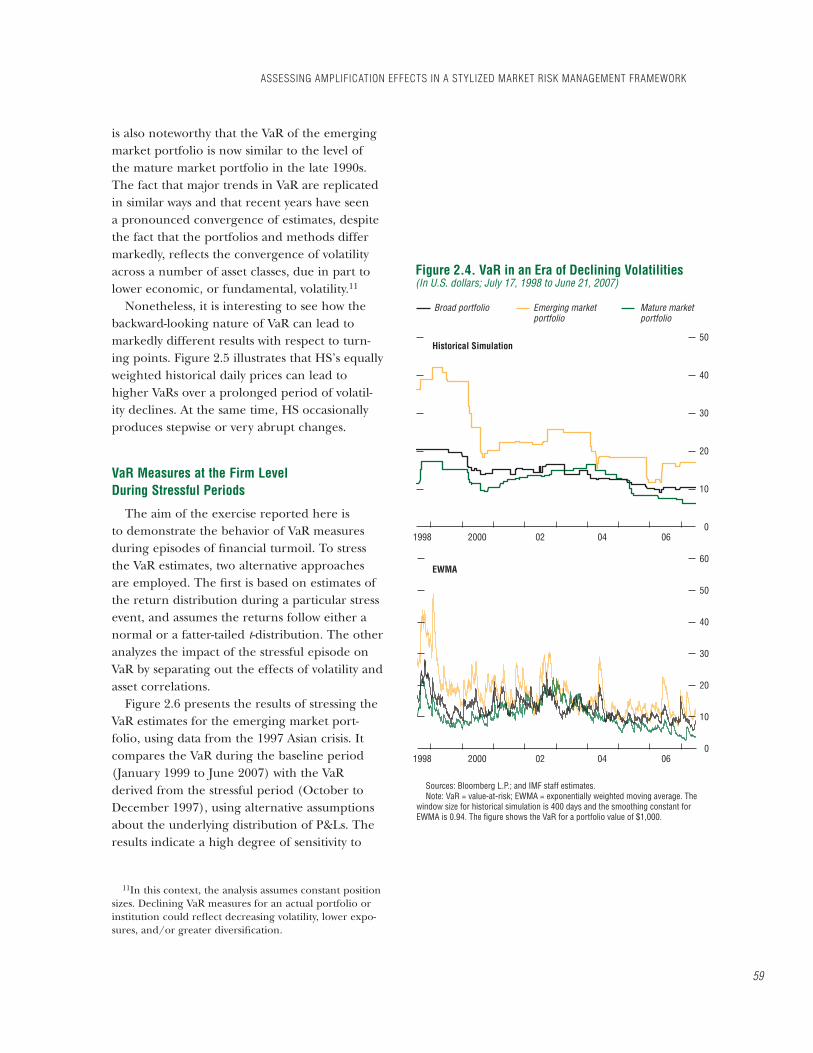
59
is also noteworthy that the VaR of the emerging market portfolio is now similar to the level of the mature market portfolio in the late 1990s. The fact that major trends in VaR are replicated in similar ways and that recent years have seen a pronounced convergence of estimates, despite the fact that the portfolios and methods differ markedly, refl ects the convergence of volatility across a number of asset classes, due in part to lower economic, or fundamental, volatility.11
Nonetheless, it is interesting to see how the backward-looking nature of VaR can lead to markedly different results with respect to turn-ing points. Figure 2.5 illustrates that HS’s equally weighted historical daily prices can lead to higher VaRs over a prolonged period of volatil-ity declines. At the same time, HS occasionally produces stepwise or very abrupt changes.
VaR Measures at the Firm Level During Stressful Periods
The aim of the exercise reported here is to demonstrate the behavior of VaR measures during episodes of fi nancial turmoil. To stress the VaR estimates, two alternative approaches are employed. The fi rst is based on estimates of the return distribution during a particular stress event, and assumes the returns follow either a normal or a fatter-tailed t-distribution. The other analyzes the impact of the stressful episode on VaR by separating out the effects of volatility and asset correlations.
Figure 2.6 presents the results of stressing the VaR estimates for the emerging market port-folio, using data from the 1997 Asian crisis. It compares the VaR during the baseline period (January 1999 to June 2007) with the VaR derived from the stressful period (October to December 1997), using alternative assumptions about the underlying distribution of P&Ls. The results indicate a high degree of sensitivity to
11In this context, the analysis assumes constant position sizes. Declining VaR measures for an actual portfolio or institution could refl ect decreasing volatility, lower expo-sures, and/or greater diversifi cation.
0
10
20
30
40
50
0
10
20
30
40
50
60
Sources: Bloomberg L.P.; and IMF staff estimates.Note: VaR = value-at-risk; EWMA = exponentially weighted moving average. The
window size for historical simulation is 400 days and the smoothing constant for EWMA is 0.94. The figure shows the VaR for a portfolio value of $1,000.
Figure 2.4. VaR in an Era of Declining Volatilities(In U.S. dollars; July 17, 1998 to June 21, 2007)
Historical Simulation
EWMA
1998 2000 02 04 06
1998 2000 02 04 06
Broad portfolio Emerging marketportfolio
Mature marketportfolio
ASSESSING AMPLIFICATION EFFECTS IN A STYLIZED MARKET RISK MANAGEMENT FRAMEWORK
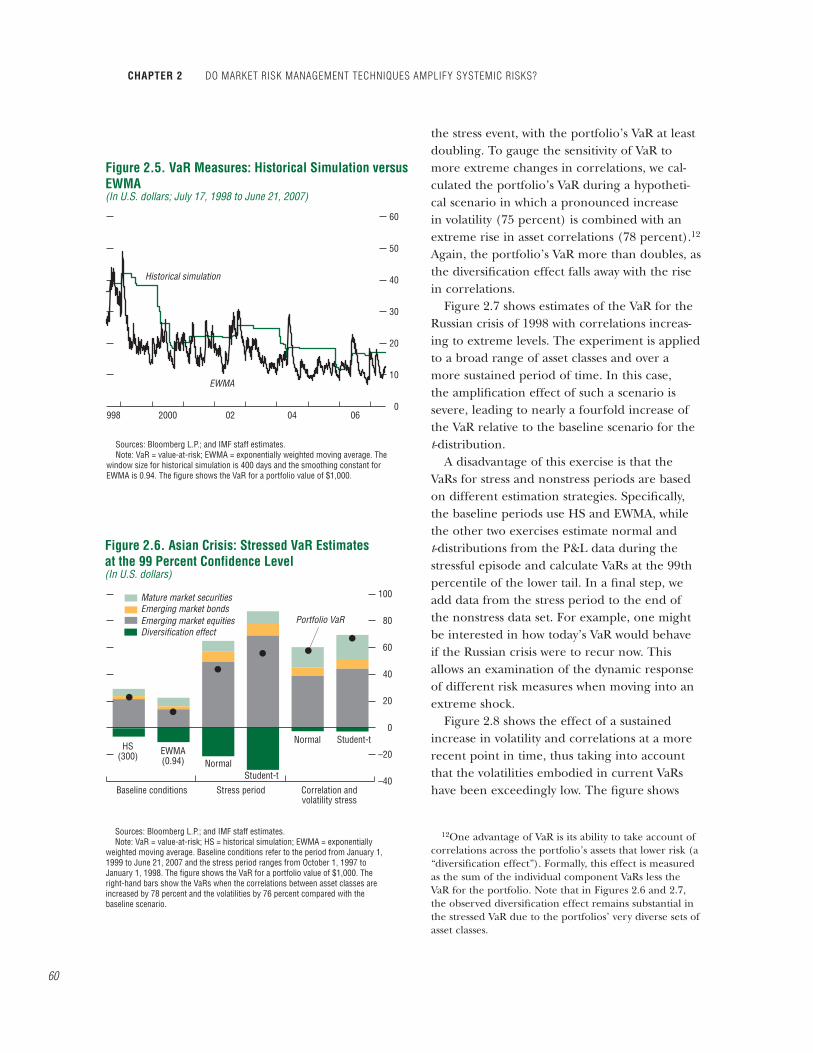
CHAPTER 2 DO MARKET RISK MANAGEMENT TECHNIQUES AMPLIFY SYSTEMIC RISKS?
60
the stress event, with the portfolio’s VaR at least doubling. To gauge the sensitivity of VaR to more extreme changes in correlations, we cal-culated the portfolio’s VaR during a hypotheti-cal scenario in which a pronounced increase in volatility (75 percent) is combined with an extreme rise in asset correlations (78 percent).12
Again, the portfolio’s VaR more than doubles, as the diversifi cation effect falls away with the rise in correlations.
Figure 2.7 shows estimates of the VaR for the Russian crisis of 1998 with correlations increas-ing to extreme levels. The experiment is applied to a broad range of asset classes and over a more sustained period of time. In this case, the amplifi cation effect of such a scenario is severe, leading to nearly a fourfold increase of the VaR relative to the baseline scenario for the t-distribution.
A disadvantage of this exercise is that the VaRs for stress and nonstress periods are based on different estimation strategies. Specifi cally, the baseline periods use HS and EWMA, while the other two exercises estimate normal and t-distributions from the P&L data during the stressful episode and calculate VaRs at the 99th percentile of the lower tail. In a fi nal step, we add data from the stress period to the end of the nonstress data set. For example, one might be interested in how today’s VaR would behave if the Russian crisis were to recur now. This allows an examination of the dynamic response of different risk measures when moving into an extreme shock.
Figure 2.8 shows the effect of a sustained increase in volatility and correlations at a more recent point in time, thus taking into account that the volatilities embodied in current VaRs have been exceedingly low. The fi gure shows
12One advantage of VaR is its ability to take account of correlations across the portfolio’s assets that lower risk (a “diversifi cation effect”). Formally, this effect is measured as the sum of the individual component VaRs less the VaR for the portfolio. Note that in Figures 2.6 and 2.7, the observed diversifi cation effect remains substantial in the stressed VaR due to the portfolios’ very diverse sets of asset classes.
0
10
20
30
40
50
60
Sources: Bloomberg L.P.; and IMF staff estimates.Note: VaR = value-at-risk; EWMA = exponentially weighted moving average. The
window size for historical simulation is 400 days and the smoothing constant for EWMA is 0.94. The figure shows the VaR for a portfolio value of $1,000.
Figure 2.5. VaR Measures: Historical Simulation versusEWMA(In U.S. dollars; July 17, 1998 to June 21, 2007)
Historical simulation
EWMA
998 2000 02 04 06
–40
–20
0
20
40
60
80
100
HS(300)
Normal
Baseline conditions Stress period Correlation andvolatility stress
Normal
Student-t
Student-tEWMA(0.94)
Sources: Bloomberg L.P.; and IMF staff estimates.Note: VaR = value-at-risk; HS = historical simulation; EWMA = exponentially
weighted moving average. Baseline conditions refer to the period from January 1, 1999 to June 21, 2007 and the stress period ranges from October 1, 1997 to January 1, 1998. The figure shows the VaR for a portfolio value of $1,000. The right-hand bars show the VaRs when the correlations between asset classes are increased by 78 percent and the volatilities by 76 percent compared with the baseline scenario.
Figure 2.6. Asian Crisis: Stressed VaR Estimatesat the 99 Percent Confidence Level(In U.S. dollars)
Mature market securitiesEmerging market bondsEmerging market equitiesDiversification effect
Portfolio VaR

ASSESSING AMPLIFICATION EFFECTS IN A STYLIZED MARKET RISK MANAGEMENT FRAMEWORK
61
that the EWMA picks up the increasingly unstable environment at the outset, while the HS remains constant over most of the episode. However, when more extreme movements occur toward the end of the observation period, the HS-VaR increases abruptly, and by a similar magnitude to the EWMA-VaR. The fact that both measures, though based on different estimation strategies, produce a jump that occurs simulta-neously, suggests that the use of different VaR estimation techniques would not necessarily pre-vent a common result arising from market stress.
When a Number of Firms Use VaR Measures
Having analyzed VaR measurement at an individual fi rm level, a new stylized model of the interaction between different institutions employing VaR-based techniques is now devel-oped. The purpose is twofold.
First, the model demonstrates how the mecha-nistic application of risk management systems could give rise to unduly large price movements and feedback effects. The analysis employs a model that derives institutions’ demands for specifi c assets using a standard portfolio choice model (mean-variance optimization) and by specifying a given risk appetite. Institutions also attempt to maintain a certain level of capital in accordance with perceived risks. A shock to prices changes their VaR measure, which then alters their preferred portfolio (including for a risk-free security linked to their desired capital level). The changes in demand for risky and risk-free assets result in changes in market prices and a feedback to VaR measures.
Second, the model is able to consider the effects of VaR model heterogeneity. To this end, two cases are considered, one in which all actively trading institutions use the same approach, and one in which different segments of the market use alternative models.
The model setup is such that, each day, a fi nancial institution compares its actual level of capital with its desired level. The latter is a com-bination of its required capital—expressed as a multiple of the fi nancial institution’s VaR—plus
–20
–10
0
10
20
30
40
50
HS(300) Normal
Baseline conditions Stress period Correlation andvolatility stress
Normal
Student-t
Student-t
EWMA(0.94)
Sources: Bloomberg L.P.; and IMF staff estimates.Note: VaR = value-at-risk; HS = historical simulation; EWMA = exponentially
weighted moving average. Baseline conditions refer to the period January 1, 1999 to June 21, 2007 and the stress period ranges from July 10, 1998 to August 10, 1998. The figure shows the VaR for a portfolio value of $1,000. The right-hand bars show the VaRs when the correlations between asset classes are increased by 80 percent and the volatilities by 95 percent compared with the baseline scenario.
Figure 2.7. August 1998: VaR Estimates at the 99Percent Confidence Level(In U.S. dollars)
Currencies and swapsCommoditiesBondsEmerging market equitiesMature market equitiesDiversificationeffect
Portfolio VaR
–2.0
–1.5
–1.0
–0.5
0
0.5
1.0
1.5
0
2
4
6
8
10
12
14
16
18
20
Sources: Bloomberg L.P.; and IMF staff estimates.Note: EWMA = exponentially weighted moving average. The window size for
historical simulation is 400 days and the smoothing constant for EWMA is 0.94. The figure shows the value-at-risk for a portfolio value of $1,000. For historical simulation and EWMA, the LTCM scenario for March 2007 is calculated for a 99th percentile VaR.
Figure 2.8. Long-Term Capital Management Scenario:EWMA versus Historical Simulation, March 2007(Value-at-risk)
Historical simulation(in U.S. dollars, right scale)
Return(in percent,left scale)
EWMA(in U.S. dollars,
right scale)
1 8 15March
22 29

CHAPTER 2 DO MARKET RISK MANAGEMENT TECHNIQUES AMPLIFY SYSTEMIC RISKS?
62
a buffer. This then directly links an institution’s VaR to its demand for risky assets and capital.13
A reduction in VaR due to lower volatilities frees capital and enables the institution to increase its holdings of risky assets. Conversely, an increase in VaR implies undercapitalization relative to the target level, inducing the institution to exchange risky for safe assets. Since the institution is assumed to be a signifi cant market participant, its trading decisions will alter prices by an additional amount, relative to the average-sized participant, under normal market conditions.
The basic idea is that an adverse shock to the covariance matrix of returns (i.e., higher absolute correlations of returns) results in higher VaR estimates and thus higher target capital levels, inducing sales of risky assets by one institution. This then results in an excess supply of risky assets, assuming other institutions do not increase their holdings by at least the same amount, implying prices of risky assets will fall to clear the market. The institution’s action to rebalance its portfolio thus results in addi-tional price pressures. In the model, such price changes also lead to an increase in correlations, as the institution simultaneously sells different types of risky assets. These effects, in turn, feed back into revised VaR measures and renewed portfolio rebalancing.
Results
The impact of the activity described above using a broad portfolio is distinguished for three different situations: one in which all institutions employ HS, one in which all rely on an EWMA measure, and one in which both methods are used in equal proportions. The main focus is on the price dynamics during periods of stress and so, to this end, the data for August 1998 are extracted from the entire sample period and provide the baseline for the exercise.
13The multiple used in the model (three) is the same as the Basel market risk framework, in which regulatory capital is three times the VaR measure.
In addition to the parameterization of VaR techniques (the choice of HS window size and EWMA smoothing constant), it is necessary to specify both the institution’s risk tolerance and the degree of price impact the institution has in the market. All else being equal, if risk tolerance is very low, the institution will exit the market at the fi rst sign of uncertainty; if risk tolerance is very high, the institution will always seek to increase its risk. Similarly, if its price impact is low, the institution does not affect prices, whereas if its price impact is very high, its trades will dominate price movements. Alterna-tive parameter values can produce both cases in which multiple institutions have no interactive effects and cases in which destabilizing behavior is observed. Parameter values were chosen to refl ect information obtained from actual users and industry practice.
The model fi ndings can be summarized as follows:• Having institutions that employ the same
risk model is destabilizing both in terms of covariance structure and volatility of returns, relative to the historical baseline. Conversely, there is a greater tendency toward stability if institutions use different models. As can be seen from Figure 2.9 for the case of one particular asset price, deviations from the his-torical series are negligible in the case where some institutions use EWMA and others use HS measurement techniques. In contrast, the model with universal use of HS yields mark-edly different selling and buying patterns when volatility surpasses a certain level.
• Relative to the historical baseline, the model shows how institutions’ actions, in accor-dance with their use of different VaR models, affect the correlation structure of returns (Table 2.1). The positive correlation across the risky assets (the S&P 500 and FTSE 100 indices) increases markedly, while the correla-tions between this group and the safe asset (10-year U.S. treasuries) generally decline, as the “flight to quality” effect is intensified.
• Volatilities tend to increase relative to the baseline, but only marginally if both VaR

63
methods are used in equal proportion (Fig-ure 2.10). If only one type of VaR method is employed, volatilities increase dramatically for the risky assets.
• Lower levels of risk tolerance imply a more pronounced tendency toward destabilization. This effect is particularly strong when both institutions employ the same risk model.Overall, the results of both simulation models
show that VaR-based systems provide the scope for self-reinforcing mechanisms to arise. The model in which fi rms interact shows that diver-sity across VaR measures is helpful in dampen-ing asset volatility.
Developments in Market Risk Management Practices by Banks and Hedge Funds
This section reviews market risk measure-ment and management practices, as disclosed in publicly available documents and through staff discussions with individuals from commercial and investment banks, hedge funds, and rating agencies.
Risk Appetite and Governance
Investment banks and commercial banks active in fi nancial markets explicitly recognize that their business is to take informed risks. To establish its “risk appetite,” a board of directors typically reviews the fi rm’s risk-taking periodi-cally in terms of a VaR or ERC framework, while entertaining bids for risk capital (or the risk “budget”) from business unit managers refl ect-ing the opportunities they see.
Risk managers today are increasingly involved in assessing risk-taking proposals by business units. Ten years ago, risk management was viewed as a compliance function to police risk limits on traders. Risk managers now increas-ingly and appropriately regard themselves as being on an equal footing with traders, working to promote and control profi table risk-taking. They often articulate their main objectives as ensuring that there are no P&L “surprises”
90
140
190
240
290
340
2003 04 05 06 07
Sources: Bloomberg L.P.; and IMF staff estimates.Note: EWMA = exponentially weighted moving average; HS = historical simulation.
The price indices refer to the Commodity Research Bureau energy futures index, one of the assets included in the VaRs of the simulated financial institutions.
Figure 2.9. Asset Price Dynamics Under AlternativeModel Specifications(Index; April 1, 2003 = 100)
Historical price index
Price index from model in which EWMA and HS are usedin equal proportionsPrice index from model in whichall entities use HS
0
0.5
1.0
1.5
2.0
2.5
3.0
S&P 500 FTSE EMBI Global10-year U.S.treasuries
Sources: Bloomberg L.P.; and IMF staff estimates.Note: EWMA = exponentially weighted moving average; HS = historical
simulation. The standard deviation is calculated over the stress period August 1998.
Figure 2.10. Selected Asset Volatilities Underthe Interactive Model(Standard deviations; in percent)
Historical price indexPrice index from model in whichall entities use EWMA
Price index from model in whichall entities use HSPrice index from model in whichEWMA and HS are used in equalproportions
DEVELOPMENT IN MARKET RISK MANAGEMENT PRACTICES BY BANKS AND HEDGE FUNDS

CHAPTER 2 DO MARKET RISK MANAGEMENT TECHNIQUES AMPLIFY SYSTEMIC RISKS?
64
outside the board’s risk tolerance and that their traders have risk- taking capacity when opportu-nities arise.
A hedge fund’s risk appetite and management culture derives primarily from how it markets itself to investors—its desired risk-return trade-off and resultant strategies—as articulated in the initial offer document and periodic reports. As a whole, hedge funds tend to view their risk appetite more fl exibly, with some deliberately positioning themselves to take advantage of volatile or unstable conditions. The absence of direct regulation of the funds facilitates the rela-tive freedom of their approach.
Hedge fund risk managers appear to work more closely with traders than do regulated enti-ties. They modify risk-taking in light of market opportunities, while reinforcing the discipline to stay out of markets if profi table opportunities do not exist (Bookstaber, 2007). Where funds employ purely quantitative strategies, risk con-trol is often built into the process of strategy selection and implementation.
Risk Measurement and Analysis
All of the major investment banks now use VaR as one of their market risk measures, primarily using an HS methodology (Box 2.2) with signifi cance levels ranging from 95 to 99 percent, and holding periods of one to 10 days. Banks use from one to fi ve years of market data to calculate risk factors, with some giving more weight to the most recent observations. Others deliberately use longer time horizons in order to capture more volatile periods.
Published VaRs cannot be meaningfully compared between fi rms due to the different assumptions that go into their calculations. However, they can provide a useful consoli-dated guide to a fi rm’s risk profi le over time if calculated on a consistent basis (Box 2.3). Also, investment banks have become increas-ingly transparent and sophisticated in publish-ing their VaR out-turns and P&L exceptions, although further details—particularly of stress test results—would help investors and credi-
Table 2.1. Selected Correlation Coeffi cients Between Asset Classes in the Interactive Model
S&P 500 FTSE 10010-Year
U.S. Treasuries EMBI GlobalBaseline Results
S&P 500 1.00 0.34 0.35 –0.25FTSE 100 1.00 –0.14 –0.0610-year U.S. treasuries 1.00 0.22EMBI Global 1.00
All Entities Use EWMAS&P 500 1.00 0.79 –0.02 0.05FTSE 100 1.00 –0.26 0.1210-year U.S. treasuries 1.00 0.16EMBI Global 1.00
All Entities Use HSS&P 500 1.00 0.79 0.19 0.14FTSE 100 1.00 –0.07 0.2010-year U.S. treasuries 1.00 0.22EMBI Global 1.00
EWMA and HS Used in Equal ProportionsS&P 500 1.00 0.45 0.20 –0.26FTSE 100 1.00 –0.22 –0.0710-year U.S. treasuries 1.00 0.21EMBI Global 1.00
Sources: Bloomberg L.P.; and IMF staff estimates.Note: EWMA = exponentially weighted moving average; HS = historical simulation.
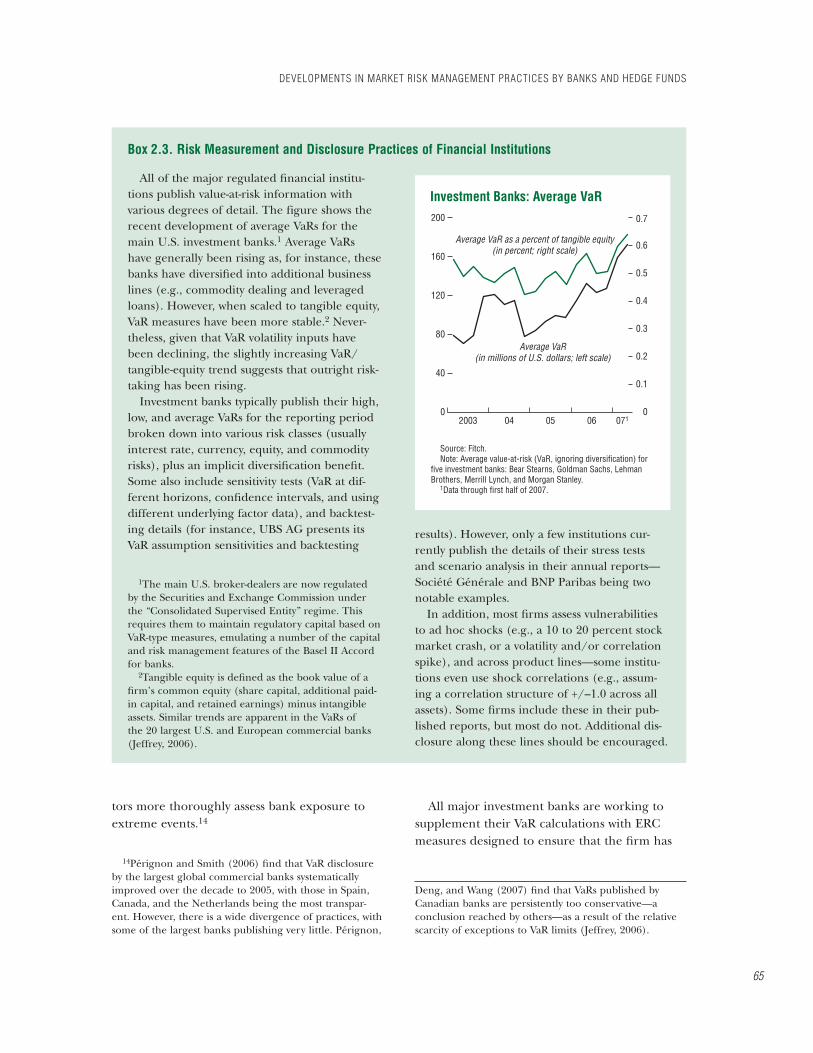
DEVELOPMENTS IN MARKET RISK MANAGEMENT PRACTICES BY BANKS AND HEDGE FUNDS
65
tors more thoroughly assess bank exposure to extreme events.14
14Pérignon and Smith (2006) fi nd that VaR disclosure by the largest global commercial banks systematically improved over the decade to 2005, with those in Spain, Canada, and the Netherlands being the most transpar-ent. However, there is a wide divergence of practices, with some of the largest banks publishing very little. Pérignon,
All major investment banks are working to supplement their VaR calculations with ERC measures designed to ensure that the fi rm has
Deng, and Wang (2007) fi nd that VaRs published by Canadian banks are persistently too conservative—a conclusion reached by others—as a result of the relative scarcity of exceptions to VaR limits (Jeffrey, 2006).
All of the major regulated fi nancial institu-tions publish value-at-risk information with various degrees of detail. The figure shows the recent development of average VaRs for the main U.S. investment banks.1 Average VaRs have generally been rising as, for instance, these banks have diversifi ed into additional business lines (e.g., commodity dealing and leveraged loans). However, when scaled to tangible equity, VaR measures have been more stable.2 Never-theless, given that VaR volatility inputs have been declining, the slightly increasing VaR/ tangible-equity trend suggests that outright risk-taking has been rising.
Investment banks typically publish their high, low, and average VaRs for the reporting period broken down into various risk classes (usually interest rate, currency, equity, and commodity risks), plus an implicit diversifi cation benefi t. Some also include sensitivity tests (VaR at dif-ferent horizons, confi dence intervals, and using different underlying factor data), and backtest-ing details (for instance, UBS AG presents its VaR assumption sensitivities and backtesting
1The main U.S. broker-dealers are now regulated by the Securities and Exchange Commission under the “Consolidated Supervised Entity” regime. This requires them to maintain regulatory capital based on VaR-type measures, emulating a number of the capital and risk management features of the Basel II Accord for banks.
2Tangible equity is defi ned as the book value of a fi rm’s common equity (share capital, additional paid-in capital, and retained earnings) minus intangible assets. Similar trends are apparent in the VaRs of the 20 largest U.S. and European commercial banks (Jeffrey, 2006).
results). However, only a few institutions cur-rently publish the details of their stress tests and scenario analysis in their annual reports—Société Générale and BNP Paribas being two notable examples.
In addition, most fi rms assess vulnerabilities to ad hoc shocks (e.g., a 10 to 20 percent stock market crash, or a volatility and/or correlation spike), and across product lines—some institu-tions even use shock correlations (e.g., assum-ing a correlation structure of +/–1.0 across all assets). Some fi rms include these in their pub-lished reports, but most do not. Additional dis-closure along these lines should be encouraged.
Box 2.3. Risk Measurement and Disclosure Practices of Financial Institutions
0
40
80
120
160
200
0
0.1
0.2
0.3
0.4
0.5
0.6
0.7
Average VaR as a percent of tangible equity(in percent; right scale)
Average VaR(in millions of U.S. dollars; left scale)
Investment Banks: Average VaR
2003 04 05 06 071
Source: Fitch.Note: Average value-at-risk (VaR, ignoring diversification) for
five investment banks: Bear Stearns, Goldman Sachs, Lehman Brothers, Merrill Lynch, and Morgan Stanley.
1Data through first half of 2007.

CHAPTER 2 DO MARKET RISK MANAGEMENT TECHNIQUES AMPLIFY SYSTEMIC RISKS?
66
suffi cient capital to survive extreme and pro-longed market stress events and meet regulatory requirements, although far less is published about such calculations. The ERC measures are based on VaR principles, but include a wider set of risks (e.g., credit, liquidity, operational, legal, and reputational risks) assessed at higher confi dence intervals. These ERC measures are then used to allocate capital to various business units of the institution, linking the expected rate of return and its risk. A few fi rms are starting to relate traders’ remuneration to their ERC measures, rather than outright P&L, given that traders should be rewarded according to their risk-adjusted returns rather than absolute profi t if risk measures accurately measure the riskiness of returns and cannot easily be manipulated.
Simulations and stress tests are now nearly universally used by banks to investigate the extreme tails of possible P&L distributions and to condition their risk appetite or add capital. Investment banks tend to run very similar suites of historical stress tests and hypothetical simula-tions, in part because senior management may dismiss very extreme scenarios as unrealistic. Typical episodes usually include recent equity market crashes or downturns (e.g., 1987, 2001–02), fi xed-income and credit stresses (e.g., 1994, 2005), emerging market crises (especially 1997), liquidity stresses (e.g., the collapse of Long-Term Capital Management, the 9/11 terrorist attacks), an oil price shock, and sometimes a pandemic fl u scenario.
Sophisticated fi rms select scenarios that are most suitable for exploring the risks specifi c to their portfolios and positions. They also adapt historical data from stress periods to take account of market innovations and develop-ments, and make allowance for liquidity risk by assuming that they are unable to trade their position for a period, often at least 10 days, in stressed circumstances. However, there is a ten-dency to assume that monetary authorities will act to mitigate the severity of a crisis through the provision of emergency liquidity.
The connection between the use of VaR, ERC, and stress tests and limitations on market risk-
taking is complex. Position limits are the most common. Investment banks tend to set relatively conservative position limits for untested trad-ers, making sure either the VaR limit or a “stress limit” (or other limit) is close enough to actual positions that it induces periodic and prompt discussions between risk offi cers and traders about whether further risk-taking is warranted, with somewhat more lenient limits for experi-enced, successful traders. While fl exibility to raise limits at short notice is often delegated to managers, a sharp or sustained rise in volatility is likely to trigger multiple limit breaches across the fi rm and require a fi rm-wide reassessment of appropriate exposures.
Most hedge funds calculate a VaR measure, but they tend to put less emphasis on it as a risk measure than do the banks and securities fi rms, adding other measures to reports to investors. This is because VaR fails to adequately capture the liquidity or credit risks associated with some funds’ strategies and positions. Accord-ing to recent survey evidence, 46 percent of the larger hedge funds use VaR as their primary market risk measure, 40 percent use some sort of volatility metric, and 9 percent use potential future exposure—that is, the potential amount of credit exposure that could be subject to loss following a future default, and so most appro-priate for credit funds (Mercer Oliver Wyman, 2006). Other measures can include net asset value (NAV) volatility, leverage (measured by gross assets to NAV), and exposure to changes in market rates (e.g., yield curve shifts).
Since the collapse of Long-Term Capital Management, hedge funds have placed more emphasis than investment banks on stress tests and scenario analyses relative to VaR. Funds frequently supplement the historically stressful scenarios by a suite of hypothetical scenarios that are tailored to the specifi c risks faced by the fund. Hedge funds are often able to subject their positions to more complex and numerous stress tests with greater frequency than banks, as a result of having far fewer trading positions, more integrated risk management informa-tion technology systems, and shorter reporting

DEVELOPMENTS IN MARKET RISK MANAGEMENT PRACTICES BY BANKS AND HEDGE FUNDS
67
lines than the trading desks of regulated banks. Compared with most investment banks, hedge funds tend to control risk more fl exibly, setting more generous position limits for trusted, active traders to take advantage of opportunities that may arise.
Market Risk Management Challenges
Market Liquidity Risk Management
While both investment banks and hedge funds are fully cognizant of the risks of being caught in “crowded trades,” it is diffi cult to manage liquidity risk in a quantitative manner.15
Some banks and funds try to assess competitor dynamics when setting limits on their own posi-tions and use various metrics (bid-offer spreads, turnover, surveys of investor risk appetite, and observed order fl ow) to do so. However, these factors tend not to be formally incorporated into their market risk measures, with most insti-tutions focusing on limiting their own exposure relative to the total market and not taking into account potentially interactive effects. (See Box 2.4 for a review of the Amaranth hedge fund case.) Many use similar, often simple, rules of thumb to constrain position-taking (e.g., a maximum position of 10 percent of average daily turnover in an emerging market security). Comfort from such limitations could prove illusory if a large number of institutions follow the same rule.16 Indeed, if average turnover is assessed using only the most recent data, posi-tion limits could be relaxed as market turnover rises in a crowded trade, only to tighten rapidly when turnover drops in a stressed environment. Risk managers need to factor in the conse-quences if others follow similar rules for posi-tion limits—not all can be the fi rst to exit the burning building.
15In a recent survey of large fi nancial institutions, a majority of fi rms had yet to include liquidity risk in their ERC calculations (Deloitte, 2007a).
16See IMF (2007a, p. 92) for a description of the crowded trade that developed in the Brazilian infl ation-linked government bond market in May–June 2006.
To protect themselves against forced liquida-tions in illiquid markets, prudent institutions try to carefully manage their maximum liquid-ity requirements. For most, this is achieved by keeping a proportion of assets invested, unlev-eraged, and in liquid assets, and by factoring in extra time that may be required to liquidate assets. For hedge funds, requiring investors to submit to initial lock-ups and three-to-six-month notice periods for withdrawals, and retaining the ability to impose “gates” that limit total withdrawals per month as a proportion of NAV, are also used. However, some hedge funds are concerned that their counterparts operate with too great a liquidity mismatch— providing their investors with the ability to withdraw funds too quickly relative to the illiquidity of their assets (e.g., structured credit products), which can potentially lead to panic selling if redemptions are abnormally high.17 Some hedge funds—especially funds of funds and those trading in liquid markets—offer monthly redemptions to investors and could quickly fi nd themselves forced to liquidate positions in fall-ing markets if investors were to seek withdraw-als en masse.
Trading and Banking Book Risks
One of the greatest challenges currently fac-ing investment bank risk offi cers is how to con-sistently evaluate and aggregate risks across both their trading and banking books. This can be an issue of methodology—it is not appropriate, for instance, simply to add market and credit VaRs together, but calculating an aggregated VaR is technically challenging. More importantly, with the growing use of securitization and credit derivatives, credit risk is less exclusively a bank-
17The problems of the Bear Stearns–sponsored high-yield hedge funds in the summer of 2007 were prompted by requested investor withdrawals and margin calls requiring the potential sale of illiquid asset-backed securi-ties collateralized debt obligations (ABS CDOs) (see Chapter 1). A recent study of 60 hedge funds found that a third did not monitor their liquidity requirements at all (Deloitte, 2007b). About 54 percent of hedge funds use gates or locks to manage investor withdrawals (Mercer Oliver Wyman, 2006).

CHAPTER 2 DO MARKET RISK MANAGEMENT TECHNIQUES AMPLIFY SYSTEMIC RISKS?
68
ing book risk and could legitimately be allocated to the trading book.
A particular issue at present is the appropriate treatment of leveraged loans and commitments.
Investment banks’ credit exposure in such transactions is intended to be short-term and so would naturally be included in the trading book, but since the commitments cannot be traded
In September 2006, the multistrategy hedge fund Amaranth Advisors lost approximately $6 billion of its $9 billion net asset value (NAV) through trading losses incurred in the natural gas futures markets. This resulted in the fund liq-uidating its remaining positions to crystallize the largest NAV loss incurred by a hedge fund. What went wrong with Amaranth’s risk management?
The fund appears to have signifi cantly under-estimated the magnitude of potential losses dur-ing an extreme liquidation event. Amaranth’s primary trading strategy at the time involved natural gas calendar spread trades (e.g., long March and short April contracts). Forensic risk analysis indicates that its positions had become massive compared with the prevailing open interest in the exchange-traded gas futures mar-kets. For example, Chincarini (2007) estimated that Amaranth’s positions may have represented up to 80 percent of the natural gas deriva-tives open interest on the NYMEX, although potentially spread between positions on two exchanges and over-the-counter transactions. Also, some of Amaranth’s positions are esti-mated to have been hundreds of times greater than average daily trading volumes in some con-tracts. Liquidity risk may have been particularly acute in some of the fund’s 2008–10 positions (Finger, 2006). Once Amaranth’s initial losses became known, the terms being offered to unwind its positions deteriorated signifi cantly.
However, Amaranth’s positions were neverthe-less consistent with running a substantial VaR. Chincarini (2007) estimated that Amaranth’s losses were consistent with a 99 percent one-day VaR of between $3 billion and $4 billion on its $9.2 billion of assets, depending on the assump-tions used regarding its daily P&L probability distribution. The fund was estimated to be lever-aged seven times over. This was incurred in pur-suit of a $1 billion expected monthly profi t. In other words, “they were chasing an 11% return...for a ‘worst-case’ [1 percent probability] scenario of a loss of 36%” (Chincarini, 2007, p. 22). In a similar analysis, Finger (2006, p. 5) concluded that the actual $6 billion loss was “well within the realm of the large moves that policies built on [VaR] models are meant to address.” Perusal of the fund’s monthly P&L data would have indicated that a $6 billion monthly loss was not a remote possibility (Till, 2006).
The absence of wider market disruption from Amaranth’s September 2006 closure resulted from the willingness of other market participants with suffi cient capital to assume the fund’s positions with relative ease. The episode highlights the importance of making allowance for liquidity risk. Nevertheless, if a fi rm’s princi-pals are determined to take substantial risks to achieve high returns, the potential for failure exists, however sophisticated the risk manage-ment procedures.
Box 2.4. The Amaranth Hedge Fund Failure and Liquidity Risk
“We viewed the probability of market movements such as those that took place in September [2006] as highly remote, and our energy-risk models correspondingly discount the [Amaranth] Funds’ exposures to the losses associated with such scenarios...But sometimes, even the highly improbable happens...It was not, however, for lack of applying resources or personnel to energy risk analysis that our funds experienced this severe drawdown. For as long as we have had a signifi cant energy business, we have assigned full-time, well-credentialed and experienced risk professionals to model and monitor our energy portfolio’s risks.”
– From the transcript of a conference call between Nick Maounis,Amaranth CEO, and fund investors, on September 22, 2006

69
or easily hedged it is diffi cult to include them in the market VaR calculation. It appears that most banks assess these transactions on an ad hoc basis, taking into account the existing credit exposure to the borrower and concentration of potential commitments. Nevertheless, the dan-ger is that reported VaR numbers signifi cantly understate the risk that banks are incurring through leveraged loan activities.
Recent events in credit markets have under-scored the diffi culties risk managers face in adapting their systems to the increased ability to trade credit risk, while taking account of the potential fragility of market liquidity under stressful circumstances.
ObservationsWhile diffi cult to generalize across banks and
hedge funds, there seem to be a number of trends observable in risk management approaches from which one can draw policy implications.
Overall, risk management systems at the largest institutions are varied, and risk manag-ers appear cognizant of the implications of the risk measurement models they employ. This increases risk awareness and prevents problems from building up. That said, there are a number of factors that tend toward narrowing the range of risk management practices and approaches, particularly at commercial and investment banks:• The Basel I and II Accords, as well as other
regulatory influences, tend to focus on minimum standards that banks must meet to satisfy risk management requirements—these raise the standard at smaller institutions but could then result in less well-resourced institutions just settling for the minimum risk management systems;
• Rating agencies scrutinize banks’ risk manage-ment processes using a prescribed methodol-ogy as an important element in the rating process;18
18An example is Standard & Poor’s (2005). The dif-fi culty for supervisors in retaining experienced risk
• Banks employ similarly-trained risk model-ers from a limited number of academic institutions;
• Best practices are transferred between institu-tions through the job mobility of risk profes-sionals; and
• Medium-sized and small banks employ a limited range of risk consultancies to design and build their risk management systems, with a tendency to use “off-the-shelf” risk manage-ment packages.Undoubtedly, these factors raise the quality of
risk management at many individual fi rms and increase their resilience to fi rm-specifi c shocks for a given level of capital. But while the risk management “bar” is being raised, the variance around that bar may have narrowed somewhat, especially as new entrants to some markets strive to compete with existing players. This suggests that, if a signifi cant market-wide stress event occurs, the likelihood of a number of the banks acting in similar ways may have increased.
The diversity of strategies and fl exibility with regard to risk management approaches used by hedge funds has helped to stabilize markets when stressed in the recent past. For instance, hedge funds bid for distressed assets in the resolution of the Refco brokerage insolvency in 2005 and the Amaranth liquidation in 2006. However, even here, the growing institutional-ization of investors (through the participation of pension funds and funds of funds), and the small but growing number of funds issuing publicly traded securities and seeking ratings, could lead to greater similarities in risk manage-ment approaches. Regarding systemic stability, this highlights the importance of hedge funds retaining fl exibility over strategy or risk-taking in periods of market stress.
The fundamental question is whether this pos-sible convergence of some types of risk manage-ment technique actually matters in practice when it comes to amplifying systemic risk. The key issue
management expertise may also encourage a “check-box” approach rather one that can fully analyze a range of idiosyncratic models.
OBSERVATIONS

CHAPTER 2 DO MARKET RISK MANAGEMENT TECHNIQUES AMPLIFY SYSTEMIC RISKS?
70
is how each fi rm’s senior management and risk offi cers interpret their risk measures to condition their risk appetite in volatile or crisis conditions. Indeed, when asked directly, both banks and hedge funds maintain that they will not mechanis-tically follow VaR-based risk limits when deciding how to react to volatile conditions.
Even if these intentions are carried out, there are a number of other routes whereby risk man-agement techniques could reduce fi rms’ collec-tive ability to take risk in stressful circumstances.
Margin calls. When setting margin require-ments for hedge funds and other counterparties, prime brokers often use VaR-based approaches and therefore require a lower percentage of up front collateral if the volatility of the underlying asset is low. This permits counterparties to incur positions with greater leverage. If asset values then fall and volatility spikes up, “variation” margin calls are made fi rst, as the borrower’s exposure increases, and margin requirements are raised in the future, as the asset has become riskier. The result is that borrowers are forced to fi nd cash or liquidate other assets to meet the increased margin calls, and lending conditions are tightened, just as asset market conditions become more volatile.19 If margin requirements were initially set more conservatively, but were less risk sensitive, market dynamics would be more stable.
Large hedge funds address this potential danger by negotiating margin “locks” with their prime brokers. In return for relatively higher margin ratios, prime brokers concede the right to increase margin requirements at short notice, which also cements longer-term relationships with the counterparty.20
19The process could be exacerbated further by the practice of some brokers that use VaR-based margining across the portfolio of a counterparty’s exposures. This saves margin at the outset as the counterparty receives the benefi ts of netting and diversifi cation in its exposure to a broker, but means that margin requirements could rise swiftly in stressed circumstances if the volatility or correlation of those positions rises.
20A similar outcome results if prime brokers calculate average market volatility over prolonged data periods and set the initial margin on the basis of “stressed” liquidity
However, such long-term behavior is likely to be followed only by the well-established prime brokers and their most creditworthy counter-parts. Recent competition to provide brokerage services to hedge funds has allegedly resulted in more generous up front margin require-ments from new entrants, although the banks concerned fully expect to tighten these require-ments as volatility rises, and in some recent cases have allegedly done so.21
The commonality of stress tests. As noted earlier, major banks tend to run a similar suite of stress scenarios. However, to prepare adequately for an unprecedented stressful event, an individual fi rm would need much higher levels of capital to protect itself fully. In the process, the fi rm could become uncompetitive.
Regulatory capital requirements. With the growing adoption of risk-based bank capital requirements, there is the potential that adverse movements in market risk factors could result in a coincident erosion of regulatory capital—at least among those fi rms primarily exposed to market risk. Hypothetically at least, suffi ciently adverse market moves could begin to erode the cushion of ERC that fi rms hold above regula-tory minima. In turn, this may prompt fi rms to raise additional capital or reduce the riskiness of their operations (e.g., by closing their most risk capital-intensive positions or assets).22 Market-makers will fi nd inventory more capital- intensiveto hold in volatile conditions and so widen
(so reducing the likelihood of having to increase the margin in volatile conditions).
21In June 2007, the volatility of the ABX (an index of ABS credit default swaps with signifi cant U.S. subprime exposure) settled at 10 times higher than its pre-February 2007 level (Rosenberg, 2007). As a result, King (2007) estimates that initial margin requirements on the various ABS tranches rose between two and fi ve times.
22A comparable scenario transpired in the United King-dom in 2002–03 when life insurance regulatory require-ments interacted with equity declines to encourage insurers to sell equities into falling markets due to their relatively high capital charge. The decision by the Finan-cial Services Authority to offer waivers from the regime prior to reform (Tiner, 2003) contributed to stabilizing the U.K. equity market.

71
spreads or quote smaller size available to trade as a result, thus reducing market liquidity.
Automatic position and stop-loss risk limits. Theprevalence of automated portfolio insurance trading strategies, whereby equities were auto-matically sold if prices fell a specifi ed amount, exacerbated the equity market sell-off in Octo-ber 1987.23 A similar self-reinforcing dynamic could be recreated if suffi cient numbers of fi rms and funds were to manage liquidity risk through automated position limits relative to market turnover or through automated stop-loss orders.24
Risk managers’ reaction to signifi cant market losses. Ultimately, whatever the degree of sophis-tication of risk measurement, the behavior of fi rms will depend on how bank risk committees react to recent signifi cant losses resulting from market volatility. Much depends, of course, on the fi rm’s peer group, regulators’ expectations, equity analyst reactions, and the margin of risk capital above regulatory minima. For example, if a regulated entity experiences a cluster of VaR exceptions, an initial reaction may be to reduce risky positions to avoid having to explain the violations to the regulator.
Hedge funds’ ability to react fl exibly. Hedge fund reactions will depend on how they have expressed their risk appetite and limits to investors. If these are relatively tightly defi ned around specifi ed risk measures or leverage usage, then the franchise value of the fund will depend on adhering to these prior commit-ments to investors and potentially closing out their long or short positions in stressful condi-tions. Conversely, hedge funds with greater risk tolerance, low exposures, or access to resilient sources of capital or funding could well take the opportunity to increase their risk-taking positions.
23Presidential Task Force on Market Mechanisms (1988); New York Stock Exchange (1990).
24Garleanu and Pedersen (2007) describe a model whereby markets in which traders are constrained by VaR-based risk limits display lower prices when volatility increases.
Policy ImplicationsSystemic risk is addressed both by improving
risk management at individual fi nancial institu-tions (to reduce counterparty risk for others) and by facilitating diversity in terms of both the risk management approach and market partici-pants, with a view to broadening the scope for contrarian behavior during periods of stress.25
In addition, while some institutions have spe-cifi c plans in place, others would benefi t from considering beforehand how they would react to stressful scenarios and making provision in benign periods for such events.
A number of implications for policymakers and risk managers arise from the preceding analysis.
Stress tests to augment market risk models more systematically. Banks’ market risk-based models can be augmented with stress tests to establish the appropriate level of capital. As has been shown in this chapter, VaR and related ERC models generally cope well when outcomes remain within the normal range of experi-ence, but they have well-known limitations when stressed. Hence, as is becoming standard practice, regulators need to use their discretion under the second pillar of the Basel II Accord to ensure that their systemically important institu-tions assess their exposure to extreme events. As product innovation enables more of a bank’s banking book to be hedged or traded, stressing risk exposures (both on- and off-balance-sheet) for credit spread widening and liquidity shocks will become especially important, including attempting to anticipate the actions of other fi rms when modeling liquidity shocks.26
25Stabilizing speculators need both available risk capital and appetite to enter into volatile markets to take positions when they believe prices are signifi cantly different from their fundamental value. If risk capital is unavailable, prices may diverge from fundamentals for prolonged periods (Shleifer and Vishny, 1997).
26“Liquidity-adjusted” VaRs were conceptualized in the late 1990s and are now being implemented. At their sim-plest, L-VaRs impose limits on trading positions linked to the markets’ underlying turnover. At their most complex, L-VaRs incorporate liquidity-inspired adjustments into the VaR’s volatility and correlation structures.
POLICY IMPLICATIONS

CHAPTER 2 DO MARKET RISK MANAGEMENT TECHNIQUES AMPLIFY SYSTEMIC RISKS?
72
Stress tests to be adapted to the most relevant scenarios. Some regulators are already aware of the tendency of fi rms to take suggestions from regulators as to what the scenarios are that they are “expected” to run rather than the threats most relevant to their institution, and thus avoid providing such suggestions. For their part, authorities need to maintain a “construc-tive ambiguity” about their reaction in a crisis to ensure that fi rms do not automatically assume in their stress tests that intervention or regulatory relief will automatically be forthcoming.
Reactions to stressful events better anticipated.Supervisors and central banks can consider how they would expect fi nancial institutions to react in stress scenarios and what their own response would be. Given the potential for fi rms’ col-lectively to be vulnerable to systemic stress, it would be prudent for monetary authorities and bank regulators to include within their own private risk management plans scenarios where system-wide liquidity injections and regulatory relief may be necessary, and to have thought through the circumstances in which such action may be appropriate (e.g., in internal “crisis simulations”).
Supervisors remain fl exible when assessing risk management systems and models. When assessing banks’ capital models and risk management systems, regulators can recognize the tenden-cies that push fi rms toward standardization on what is currently believed to be best practice. While maintaining sound minimum require-ments, bank supervisors can avoid being too rules-based with regard to model details and use the discretion they retain under interna-tional agreements to allow fi rms to tailor mod-els to their own requirements and parameters in order to foster innovation and a diversity of approaches.
Banks improve their risk management report-ing. Consistent with the spirit of the second pillar of the Basel II Accord, banks themselves can further improve the comprehensiveness of their risk management reporting in order to provide assurance to counterparties, creditors, and shareholders as regards their exposure
to tail events and the contingency plans and preparations they have made. In particular, external assessment of the robustness of VaR models would be aided by publishing more results of backtesting exercises and exception reporting.27 Also, the understanding of a fi rm’s vulnerability to tail events would be facilitated by publishing the details and results of a selec-tion of stress tests (Box 2.3) as well as a fi rm’s VaR under a hypothetical extreme market stress event.28
Stabilizing benefi ts of hedge funds be taken into account. Regulatory authorities can consider the stabilizing benefi ts that hedge funds can bring in times of stress when assessing risk manage-ment requirements. Unregulated liquidity providers (i.e., hedge funds) often provide bids or offers in stressed circumstances when assets are deemed to be fundamentally misval-ued and they have access to suffi cient capital. Because they are not required to calculate and hold a minimum of economic capital, such pools of private capital can have the freedom to take advantage of the possible herd behav-ior of others that could result from those that apply more rigid risk management procedures required of regulated institutions. Naturally, some hedge funds have managed risk injudi-ciously, and no doubt others will occasionally do so, and it is not yet clear whether, overall, hedge funds have a stabilizing or destabiliz-ing infl uence in markets. But it is the primary responsibility of their investors and counter-parties to ensure that hedge funds’ risk man-
27As an example of how detailed stress test disclosure can be, Société Générale’s annual report lists 11 of its 18 historical stress tests and displays the year-end potential losses associated with these and seven other extreme, but plausible, hypothetical scenarios.
28In order roughly to approximate “stressed VaRs” to compare across fi rms, rating agencies are forced simply to add VaRs across business units, assuming correlation structures go to unity in a crisis (Fitch Ratings, 2007). When considering U.S. bank holding companies with large trading operations, Hirtle (2007) fi nds that greater transparency, particularly over stress test results and VaR components, is associated with signifi cantly higher risk-adjusted returns by the bank—although the direction of causation was not determined.

73
agement systems are suffi ciently robust, and they should require that such information be available for this purpose. Consequently, care needs to be taken when devising industry or supervisory “codes of hedge fund best practice” to ensure that those codes do not inadver-tently restrict how funds model and manage their risk-taking, while appropriately providing guidance in other areas, such as disclosure and customer protection.
ConclusionsDo market risk management techniques
amplify systemic risks?Not surprisingly, there is no straightforward
answer to this question. First, it is important to emphasize that, particularly in less vola-tile environments, fi nancial systems are more stable if fi rms are risk-sensitive and react to the signals their models are sending. If fi rms were not generally risk-sensitive, the likelihood of asset bubbles and crises would be even greater. VaR-type techniques reveal aspects of a fi rm’s risk-taking, particularly regarding correlated exposures, that would not necessarily be appar-ent if risks were managed in silos within a fi rm.
Having said this, risk management tech-niques are not a panacea for all ills. The mod-eling work presented in this chapter suggests that a VaR-type risk management framework certainly has the potential to encourage fi rms to increase their risk appetite in a benign envi-ronment, as well as to reverse it when volatil-ity returns. This result holds with a surprising degree of uniformity even when varying the timeframe over which the data are selected or the weights given to recent data. The model of price dynamics involving multiple fi rms using VaR measures also demonstrates that there is potential for a destabilizing feedback mecha-nism to develop whereby the movement of mar-ket prices is amplifi ed. Results from the model indicate that a diversity of risk management models can be a stabilizing infl uence.
The question is: Do the principal institutions actually operate in ways whereby these theo-
retical results could hold? To put it another way: Will enough fi rms be constrained to follow their risk management measures suf-fi ciently closely to amplify market volatility by their actions? When risk managers at major institutions are asked the question directly, the answer is most defi nitely that they do not follow their risk management systems infl exibly. They claim to understand the limitations of their VaR and ERC models and to apply judgment to these outputs when deciding whether the fi rm’s risk appetite should be curtailed in stressed circumstances.
Other evidence, however, suggests that price pressures and risk management systems could interact in a destabilizing manner. First, VaR-type measures are now nearly universal in banks, and nearly all use short time-period HS.
Second, published investment bank VaRs have been generally rising over the past three to four years despite falling volatility, indicating they have added to their risky positions. The surprising lack of exceptions to their daily VaR limits that fi rms publish indicates that either (1) their models are too conservative and are not calibrated fi nely enough to show excep-tions in practice; (2) banks prefer to show a high VaR with few exceptions; or (3) their models have been overly infl uenced by benign conditions to report low VaR usage in practice. The danger is that, with the recent move to higher volatility, some fi rms will recognize that their underlying positions were much riskier than they perhaps realized and cut them.
Third, as described above, there are a num-ber of indirect ways in which greater volatility can encourage selling into falling markets—from automatic stop-loss triggers and rules of thumb to ERC minimum requirements. It is worth highlighting the potential interaction of the exposure of some leveraged hedge funds to increasing volatility, triggering both mar-gin calls from prime brokers and redemption requests from investors at a time of reduced trading liquidity. Long-Term Capital Manage-ment and Amaranth highlighted how quickly supposedly well-resourced risk management
CONCLUSIONS

CHAPTER 2 DO MARKET RISK MANAGEMENT TECHNIQUES AMPLIFY SYSTEMIC RISKS?
74
architectures can be overwhelmed in unfavor-able market conditions. Given the diffi culty of incorporating liquidity risk into the market risk management systems of large trading institu-tions, more risk managers also need to consider what the market dynamics will be if the major-ity of their counterparts are also following similar rules.
One should not lose sight of the improve-ments in risk measurement and control over the last decade and the positive role of these improvements in reducing the likelihood of idiosyncratic failure from uninformed risk-taking. These advances should induce greater risk sensitivity on the part of fi nancial institu-tions, leading to early unwinding of unantici-pated exposures and better risk control. At the same time, it is important not to place undue confi dence in all aspects of fi rms’ risk manage-ment systems—for instance, the ability to mea-sure and assess vulnerability to extreme events is still not well developed. Also, the co-vulner-ability of fi rms seems to have increased so that, when systemic fi rms come under pressure, they are more likely to be under stress together rather than alone (Chan-Lau, Mitra, and Ong, 2007; and IMF, 2007b). Raising the general quality of market risk management, while reducing its variance, has probably reduced the likelihood of failure of individual systemically important institutions, while possibly increasing the tendency of institutions to act similarly in stressful periods. In such circumstances, from a systemic perspective, it is important to ensure that there are market participants that are either suffi ciently disparate in their holdings and strategies, or are able to take large contrar-ian positions during periods of stress. Over the medium term, the general trend toward greater involvement of an increasing variety of play-ers in global fi nancial markets should help to improve market resilience.
ReferencesArtzner, Philippe, Freddy Delbaen, Jean-Marc Eber,
and David Heath, 1999, “Coherent Measures of Risk,” Mathematical Finance, Vol. 9, No. 3, pp. 203–28.
Bams, Dennis, Thorsten Lehnert, and Christian C.P. Wolff, 2005, “An Evaluation Framework for Alterna-tive VaR-Models,” Journal of International Money and Finance, Vol. 24 (October), pp. 944–58.
Bank for International Settlements (BIS), 1996, “Amendment to the Capital Accord to Incorporate Market Risks” (Basel: Basel Committee on Banking Supervision, January).
———, Committee on Global Financial System (CGFS), 2005, “Stress Testing at Major Financial Institutions: Survey Results and Practice,” CGFS Publication No. 24 (Basel, January).
Bank of England, 2007, “Assessing the Sensitivity of Value-at-Risk to Measures of Stress,” Financial Stabil-ity Report, Vol. 21 (April), p. 33.
Bervas, Arnaud, 2006, “Market Liquidity and Its Incor-poration into Risk Management,” Financial Stability Review, No. 8 (May), pp. 63–79.
Bookstaber, Richard, 2007, A Demon of Our Own Design: Markets, Hedge Funds, and the Perils of Financial Innovation (Hoboken, New Jersey: John Wiley and Sons).
Chan-Lau, Jorge A., Srobana Mitra, and Li Lian Ong, 2007, “Contagion Risk in the International Banking System and Implications for London as a Global Financial Center,” IMF Working Paper 07/74 (Washington: International Monetary Fund).
Chincarini, Ludwig B., 2007, “The Amaranth Debacle: A Failure of Risk Measures or Failure of Risk Management?” Social Science Research Network Working Paper (April). Available via the Internet: http://ssrn.com/abstract=952607.
Danielsson, Jon, and Jean-Pierre Zigrand, 2006, “On Time-Scaling of Risk and the Square-Root-of-Time Rule,” Journal of Banking & Finance, Vol. 30 (Octo-ber), pp. 2701–13.
Danielsson, Jon, Ulrich Klueh, and Jean-Pierre Zigrand, forthcoming, “Asset Price Volatility, Corre-lation, and Value-at-Risk-Based Capital Constraints,” IMF Working Paper (Washington: International Monetary Fund).
Danielsson, Jon, Bjorn N. Jorgensen, Mandira Sarma, and Casper G. de Vries, 2006, “Comparing Down-side Risk Measures for Heavy Tailed Distributions,” Economics Letters, Vol. 92 (August), pp. 202–08.

REFERENCES
75
Deloitte, 2007a, “Global Risk Management Sur-vey: Accelerating Risk Management Practice” (Deloitte Research, 5th ed.). Available via the Internet: http://www.deloitte.com/dtt/article/0,1002,cid%253D151057,00.html.
———, 2007b, “Risk Management and Valuation Prac-tices in the Global Hedge Fund Industry: Precau-tions That Pay Off” (Deloitte Research, January). Available via the Internet: http://www.deloitte.com/dtt/research/0,1015,cid%253D141897,00.html.
European Central Bank (ECB), 2007, “Market Risk Measurement: Beyond Value at Risk,” FinancialStability Review (June), pp. 108–10.
Finger, Christopher C., 2006, “The Lights Are On,” RiskMetrics Group Research Monthly (October). Available via the Internet: http://www.riskmetrics.com/research_monthly.html?article_id=84.
Fitch Ratings, 2007, “Securities Firms: YE06 Peer Data,” Fitch Ratings Special Report (March).
Garleanu, Nicolae B., and Lasse H. Pedersen, 2007, “Liquidity and Risk Management,” NBER Work-ing Paper No. 12887 (Cambridge, Massachusetts: National Bureau of Economic Research).
Hirtle, Beverly, 2007, “Public Disclosure, Risk, and Performance at Bank Holding Companies,” Staff Report No. 293 (New York: Federal Reserve Bank of New York, July).
International Monetary Fund (IMF), 2004, “Risk Man-agement and the Pension Fund Industry,” Chapter III, Global Financial Stability Report, World Economic and Financial Surveys (Washington, September). Available via the Internet: http://www.imf.org/External/Pubs/FT/GFSR/2004/02/index.htm
———, 2007a, “Changes in the International Inves-tor Base and Implications for Financial Stability,” Chapter II, Global Financial Stability Report, World Economic and Financial Surveys (Washington, April). Available via the Internet: http://www.imf.org/External/Pubs/FT/GFSR/2007/01/index.htm.
———, 2007b, “The Globalization of Financial Institu-tions and Its Implications for Financial Stability,” Chapter III, Global Financial Stability Report, World Economic and Financial Surveys (Washington, April). Available via the Internet: http://www.imf.org/External/Pubs/FT/GFSR/2007/01/index.htm.
Jeffrey, Christopher, 2006, “VAR Breakdown,” RiskManagement (July), pp. 43–48. Available via the Internet: http://www.risk.net/public/showPage.
html?validate=0&page=risknet_login2&url=%2Fpublic%2FshowPage.html%3Fpage%3D335597.
King, Matt, 2007, “Short Back and Sides: Subprime Haircuts––Too Much off the Top?” (Citigroup Research, July 3).
Liang, Bing, and Hyuna Park, 2007, “Risk Measures for Hedge Funds: A Cross-Sectional Approach,” European Financial Management, Vol. 13 (March), pp. 333–70.
Lo, Andrew W., 2001, “Risk Management for Hedge Funds: Introduction and Overview,” FinancialAnalysts Journal, Vol. 57 (November/December), pp. 16–33.
Mercer Oliver Wyman, 2006, “Risk-Taking and Risk Management in the Hedge Fund Industry: Review of Market Practices” (unpublished; New York, July).
New York Stock Exchange, 1990, “Market Volatil-ity and Investor Confi dence Panel,” Report to the Board of Directors of the New York Stock Exchange, Inc. (New York, June).
Pérignon, Christophe, and Daniel R. Smith, 2006, “The Level and Quality of Value-at-Risk Disclosure by Commercial Banks,” Social Science Research Network Working Paper (December). Available via the Internet: http://ssrn.com/abstract=952595.
Pérignon, Christophe, Zi Yin Deng, and Zhi Jun Wang, 2007, “Do Banks Overstate Their Value-at-Risk?” Social Science Research Network Working Paper (May). Available via the Internet: http://ssrn.com/abstract=929750.
Persaud, Avinash D., 2000, “Sending the Herd off the Cliff Edge: The Disturbing Interaction Between Herding and Market-Sensitive Risk Management Practices” (Washington: Institute of International Finance, December). Available via the Internet: www.erisk.com/ResourceCenter/ERM/persaud.pdf.
———, 2003, “Market Liquidity and Risk Manage-ment,” in Liquidity Black Holes: Understanding, Quan-tifying and Managing Financial Liquidity Risk, ed. by A. Persaud (London: Risk Books).
Presidential Task Force on Market Mechanisms, 1988, Report of the Presidential Task Force on Market Mecha-nisms: Submitted to the President of the United States, the Secretary of the Treasury, and the Chairman of the Federal Reserve Board (Washington: U.S. Government Printing Offi ce).
Rosenberg, Jeffrey, 2007, “The Repo Man,” Cross Product Debt Research, Bank of America, June 22, pp. 3–7 (unpublished).

CHAPTER 2 DO MARKET RISK MANAGEMENT TECHNIQUES AMPLIFY SYSTEMIC RISKS?
76
Shleifer, Andrei, and Robert Vishny, 1997, “The Limits of Arbitrage,” Journal of Finance, Vol. 52 (March), pp. 35–55.
Standard & Poor’s, 2005, Enterprise Risk Management for Financial Institutions: Rating Criteria and Best Practices (New York: McGraw-Hill).
Till, Hilary, 2006, “EDHEC Comments on the Amaranth Case: Early Lessons from the Debacle” (Nice, France: École de Hautes Études Commerciales du Nord, Risk
and Asset Management Research Centre, October). Available via the Internet: http://www.edhec-risk.com/features/RISKArticle.2006-10-02.0711/view.
Tiner, J., 2003, “Required Minimum Margin: Letter to CEOs of Life Insurance Companies,” FSAP Press Release (London: Financial Services Authority, January 31). Available via the Internet: http://www.fsa.gov.uk/Pages/Library/Communication/PR/2003/017.shtml.

7777
3CHAPTER
This chapter finds that—over the medium term—a more developed domestic financial market increases the volume and helps reduce the volatility of capi-tal flows to emerging markets. Specifically, the estimation results find that, although growth is the primary determinant of the level of capital inflows, equity market liquidity and financial openness also help attract capital inflows. Moreover, financial openness is associated with lower capital inflow volatility. These results, which are consistent with the views expressed by institutional investors, point to the advantages of focusing on the medium-term goal of improving the quality of domestic financial markets. By adopting such a focus, emerging market countries will be in a better position to maximize the benefits of capital inflows while dealing with their potential volatility.
The recent surge in capital fl ows to emerg-ing market economies has stirred an intense debate about the appropriate
policy response to this development. On the one hand, capital infl ows are welcome because they encourage investment, help deepen fi nancial intermediation, and, therefore, enhance economic development. However, in large sums over short time spans they can also impose policy challenges relating to upward pressure on the exchange rate, overheating of the economy, and asset price bub-bles. They also pose the risk of an abrupt reversal, potentially having negative real economic effects.
This chapter analyzes the domestic determi-nants of capital infl ows, with a view to assessing what actions emerging market countries can take to maximize the benefi ts of those infl ows while minimizing the threat to fi nancial stability. In particular, the chapter examines the infl u-ence of domestic fi nancial markets on capital infl ows, putting the large capital infl ow increases to emerging markets that have occurred since 2002 within a medium-term perspective.
Beginning in 2002, capital fl ows have been on a strong upward trend worldwide in both
gross and net terms, with fl ows to emerging markets growing almost sixfold in fi ve years (Figure 3.1).1 Contrary to the early 1990s, the recent surge of capital fl ows to emerg-ing markets has coincided with generally stronger economic policies and performance in those markets, including current account surpluses and improved debt management. In terms of composition, bonds and bank loans account for the bulk of the growth in capital fl ows; for emerging markets, although foreign direct investment (FDI) fl ows continue to be the single largest and relatively stable part of infl ows, the FDI contribution to total infl ows has declined as the other components have been rising more rapidly in recent years (Figure 3.2).2 As noted in Global Development Finance, capital fl ows to all developing coun-tries have continued to shift in composition from offi cial to private sources, and from debt to equity fi nancing (World Bank, 2007). FDI
1For a sample of 56 developed and emerging market economies (comprising 81 percent of world capital infl ows in 2005), and 41 emerging market economies, respectively.
2The lines between FDI and portfolio investment are becoming increasingly blurred because some portfolio-type infl ows show up as FDI. This may partly explain why FDI fl ows have not always been stable.
Note: This chapter was written by Shinobu Nakagawa and L. Effi e Psalida with research assistance provided by Oksana Khadarina. Badi Baltagi provided consultancy support.
THE QUALITY OF DOMESTIC FINANCIAL MARKETS AND CAPITAL INFLOWS

CHAPTER 3 THE QUALITY OF DOMESTIC FINANCIAL MARKETS AND CAPITAL INFLOWS
78
infl ows continue to expand, keeping pace with strong GDP growth, while in 2006 portfolio equity fl ows reached record levels. As fi nancial markets become increasingly integrated, capital infl ows are often matched by emerging market outward investment, particularly in Asia but also in Latin America (Box 3.1).
Despite the growth of outward emerging mar-ket investment, large capital infl ows pose policy challenges to many emerging markets. These fl ows can be explained both by stronger domestic performance (pull factors) and by global fi nancial factors such as the high liquidity, low volatility, and compressed yields of recent years (push factors).3
However, although there may be cyclical down-turns, over the longer term countries will need to cope with rising capital fl ows, as globalization is likely to proceed apace. The question posed here, therefore, is: What fi nancial policy actions can emerging market countries themselves take to best deal with capital fl ows over the longer term?
Specifi cally, this chapter asks whether—in addition to strong macroeconomic fundamentals—a well-functioning domestic fi nancial market increases the level of capital infl ows and reduces their volatility. This issue is analyzed in two ways.
First, the chapter identifi es and estimates domestic “micro” fi nancial factors that help deter-mine the volume and volatility of capital infl ows for a sample of 56 economies over 30 years. Panel regression estimations are used, the results of which are discussed later in the chapter.
This long-term empirical analysis is then augmented by examining the ongoing challenges and risks associated with the recent bout of capital infl ows for countries that are at different stages of domestic fi nancial market development. Their fi nancial policy options are discussed by concentrating on fi ve country examples.
The chapter fi nishes with a discussion of the key results, and draws some policy conclusions.
3See Chapter II of the April 2007 GFSR for a discussion of the supply factors determining capital fl ows and the broadening and diversifi cation of the international inves-tor base into emerging markets (IMF, 2007a).
0
1000
2000
3000
4000
5000
6000
7000
0
100
200
300
400
500
600
700
Source: IMF, International Financial Statistics database.
Figure 3.1. Total Capital Inflows(In billions of U.S. dollars)
Developed and Emerging Market Economies
Emerging Market Economies
1994 96 98 2000 02 04 06
1994 96 98 2000 02 04

79
Does Domestic Financial Development Help Determine Capital Infl ows?
There is an extensive body of applied literature on the growth and investment impact of capital account openness and stock market liberalization, but, contrary to eco-nomic theory, the empirical results—derived primarily from cross-country macroeconomic analysis—are ambiguous and inconclusive.4 In search of more robust results, recent litera-ture has turned to the use of microeconomic data, although this approach is still at an early stage largely due to data limitations.5 Another branch of the applied literature investigates the implications for fi nancial stability of the links between capital fl ows and “micro” domestic fac-tors such as institutional quality.6 This chapter extends the work along this branch of the literature in order to understand the fi nancial and institutional factors that attract capital fl ows to emerging markets. Further, it assesses the implications for fi nancial stability by examining the links between these factors and the volatility of infl ows. The accepted wisdom is that a well-functioning and deep fi nancial system should help attract infl ows and provide less incentive for rapid outfl ows, thereby lower-ing volatility and mitigating any negative effects on the real economy. Although the common wisdom prevails, few empirical studies verifying these conjectures have been conducted to date.
This chapter develops an empirical frame-work for assessing the determinants of the
4See the surveys by Eichengreen (2001) and Prasad and others (2003). The latter note that: “…the literature suggests that there is no strong, robust, and uniform sup-port…that fi nancial globalization per se delivers a higher rate of economic growth” (p. 8). More recently, Henry (2006) fi nds evidence that opening the capital account leads countries to temporarily invest more and grow faster. See also Edison and others (2004), who provide a review of the literature; and IMF (2007b) on the effects of fi nancial globalization.
5See, for example, Smith and Valderrama (2007).6See, for example, Alfaro, Kalemli-Ozcan, and
Volosovych (2005).
DOES DOMESTIC FINANCIAL DEVELOPMENT HELP DETERMINE CAPITAL INFLOWS?
0
500
1000
1500
2000
2500
3000
Bank loansBondsEquityForeign directinvestment
–300
–200
–100
0
100
200
300
400
Source: IMF, International Financial Statistics database.
Figure 3.2. Composition of Capital Inflows(In billions of U.S. dollars)
Developed and Emerging Market Economies
Emerging Market Economies
1994 96 98 2000 02 04 06
1994 96 98 2000 02 04

CHAPTER 3 THE QUALITY OF DOMESTIC FINANCIAL MARKETS AND CAPITAL INFLOWS
80
level and volatility of annual capital infl ows.7
The framework employs a panel specifi cation
7In the fi nancial account of the balance of payment statistics, all transactions are recorded on a net change basis (that is, all infl ows in a given instrument are net-ted against all outfl ows of the same instrument). In this
for 15 developed and 41 emerging market economies. (Annex 3.1 includes a detailed presentation of the data, the specifi cation,
chapter, capital infl ows refer to increases in the liabilities of the countries in the group.
Net capital fl ows to emerging Asia and Latin America are off their highs from a decade ago, even as Central and Eastern Europe are experiencing record net infl ows.1 In 2006, net capital infl ows were about 2 percent of GDP in emerging Asia and near zero in Latin America, down from recent highs of about 4 percent. Broad patterns in the respective regions include the following:• In Asia, gross capital infl ows fell dramatically
during 1997–98. Since then, gross capital infl ows have grown to levels close to their historical highs. However, more recently, gross capital outfl ows from emerging Asia have increased rapidly, exceeding historical levels
Note: Roberto Benelli and Leslie Teo prepared this box.
1Net capital infl ows are defi ned as the sum of gross infl ows (nonresident investment in the domestic econ-omy) and gross outfl ows (resident investment abroad).
and thus leading to lower net capital infl ows. (These broad features mask differences in the region: China and India continue to receive signifi cant net capital infl ows, for instance.)
• In Latin America, gross capital infl ows declined from 1998 to 2002 but subsequently remained fairly stable until 2006. Gross infl ows remained unchanged as purchases of new claims by nonresidents were offset by repayment of public external debt. At the same time, as in Asia, gross outfl ows from the region increased. Very recently, this pattern has shifted, as gross outfl ows have declined while a few countries in Latin America—particularly Brazil—have experienced large capital infl ows in the fi rst half of 2007.Even if tentative, the recent increase in gross
capital outfl ows refl ects fi nancial globaliza-tion, liberalization, and a recycling of current account surpluses, especially in Asia. In both regions, home bias has declined and there has
Box 3.1. Recent Developments with Capital Flows in Emerging Asia and Latin America
–8–6–4–202468
10
Current account
Latin America Developing Asia Central and Eastern Europe
Net capital flows
–8–6–4–2
02468
10
–8–6–4–202468
10
1990 94 98 2002 06 1990 94 98 2002 06 1990 94 98 2002 06
Source: IMF, World Economic Outlook database.
Current Account Balances and Net Capital Flows from a Global Perspective(In percent of GDP)
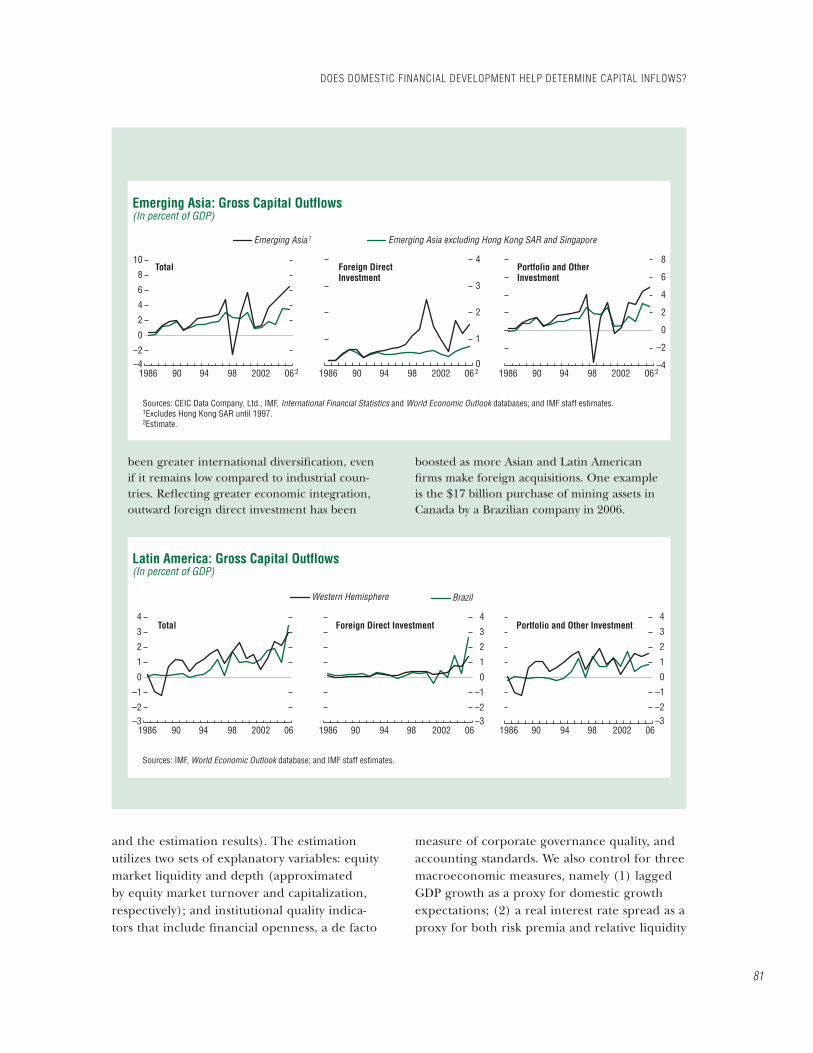
81
and the estimation results). The estimation utilizes two sets of explanatory variables: equity market liquidity and depth (approximated by equity market turnover and capitalization, respectively); and institutional quality indica-tors that include fi nancial openness, a de facto
measure of corporate governance quality, and accounting standards. We also control for three macroeconomic measures, namely (1) lagged GDP growth as a proxy for domestic growth expectations; (2) a real interest rate spread as a proxy for both risk premia and relative liquidity
DOES DOMESTIC FINANCIAL DEVELOPMENT HELP DETERMINE CAPITAL INFLOWS?
been greater international diversifi cation, even if it remains low compared to industrial coun-tries. Refl ecting greater economic integration, outward foreign direct investment has been
boosted as more Asian and Latin American fi rms make foreign acquisitions. One example is the $17 billion purchase of mining assets in Canada by a Brazilian company in 2006.
–3–2
–1
0
1
2
3
4
–3–2
–1
0
1
2
3
4
–3–2
–1
0
1
2
3
4
Brazil
Total Foreign Direct Investment Portfolio and Other Investment
Western Hemisphere
1986 90 94 98 2002 06 1986 90 94 98 2002 06 1986 90 94 98 2002 06
Sources: IMF, World Economic Outlook database; and IMF staff estimates.
Latin America: Gross Capital Outflows(In percent of GDP)
–4–2
0
2
4
6
8
10
Emerging Asia excluding Hong Kong SAR and SingaporeEmerging Asia1
0
1
2
3
4
–4
–2
0
2
4
6
8Total Foreign Direct
InvestmentPortfolio and OtherInvestment
1986 90 94 98 2002 06 2 1986 90 94 98 2002 06 2 1986 90 94 98 2002 06 2
Sources: CEIC Data Company, Ltd.; IMF, International Financial Statistics and World Economic Outlook databases; and IMF staff estimates.1Excludes Hong Kong SAR until 1997.2Estimate.
Emerging Asia: Gross Capital Outflows(In percent of GDP)

CHAPTER 3 THE QUALITY OF DOMESTIC FINANCIAL MARKETS AND CAPITAL INFLOWS
82
conditions; and (3) a measure of global liquid-ity conditions.
The estimation results for the full country sample over the 30-year period (1977–2006) suggest that, for a given country, capital infl ows increase as market liquidity and fi nancial openness increase. This result is also strong and signifi cant for the emerging market sub-sample, indicating, for example, that a 1 percent increase in the growth of equity market liquidity relative to GDP is associated, on average, with a 0.15 percent rise in the ratio of capital infl ows to GDP (Table 3.1). When estimated for the post-Asian crisis period (1998–2006), equity market liquidity, fi nancial openness, and corporate governance quality indicate an even stronger positive effect on the level of capital infl ows for both the full country sample and for emerging markets. As expected, capital infl ows increase as economic growth—one of the control vari-ables—strengthens, a result that holds across all country groupings and both sample periods. In view of the potential for feedback effects or reverse causality—i.e., that capital infl ows may
infl uence equity market capitalization—endoge-neity is accounted for with a number of statisti-cal techniques to ensure that the parameters were purged of the effects of endogeneity.8 The estimation results are consistent with the views expressed during our discussions with institu-tional investors who invest in emerging markets (Box 3.2).
We also examine the effect of fi nancial mar-ket development indicators on the level of the different components of capital fl ows.9 Here, the
8We took one-period lags for all the explanatory vari-ables, except for the institutional quality indicators. We also separately utilized two-period lags and performed two-stage least-squares estimations, but the results did not change signifi cantly in either case. To take dynamics into account, we also performed additional estimations under a different specifi cation, which included one-period lags of the dependent variable in the independent variable set for each equation. These results were not signifi cantly different.
9Most studies of capital fl ows only estimate aggregate fl ows. There are some studies that investigate the com-position of fl ows, although their focus is on the effects of capital controls and sterilized intervention (see, for example, Montiel and Reinhart, 1999).
Table 3.1. Panel Least-Squares Estimation of the Determinants of Total Capital Infl ows1977–2006 1998–2006
All Countries Emerging Markets All Countries Emerging Markets
Financial Development IndicatorsEquity market turnover 0.127 0.150 0.139 0.216
[0.002]*** [0.003]*** [0.003]*** [0.001]***Equity market capitalization 0.027 0.020 0.039 0.018
[0.292] [0.512] [0.312] [0.739]Financial openness 1.647 1.550 3.488 3.164
[0.000]*** [0.000]*** [0.000]*** [0.001]***Corporate governance quality . . . . . . 30.128 16.225
[0.076]* [0.290]Accounting standards . . . . . . 0.019 –10.995
[0.998] [0.647]
Macroeconomic FactorsGrowth expectation 0.489 0.404 0.668 0.782
[0.000]*** [0.000]*** [0.000]*** [0.000]***Interest rate differential 0.043 0.022 0.109 0.086
[0.030]** [0.248] [0.001]*** [0.004]***Global liquidity –0.009 –0.003 0.013 –0.036
[0.849] [0.948] [0.863] [0.353]
Adjusted R2 0.552 0.510 0.616 0.514
Sources: Bloomberg; Chinn and Ito (2006); Datastream; De Nicolò and others (2006); IMF, International Financial Statistics and World Economic Outlook databases; Standard and Poor’s Emerging Markets Database; and World Federation of Exchanges.
Note: Cross-section fixed-effects estimation. Probability values are in square brackets: *** significant at 1 percent level; ** significant at 5 percent level; and * significant at 10 percent level.
83
fi ndings show that, in addition to the aggregate, (1) the levels of total portfolio, FDI, and the “other” component of capital infl ows (primar-ily comprising bank fl ows) increase as equity market liquidity rises, and (2) portfolio and FDI fl ows increase with more fi nancial openness.10,11
10In addition to bank lending, the “other” component of capital infl ows includes fi nancial derivatives for many countries, for which these data are not classifi ed sepa-rately, as well as money market instruments.
11Corporate governance quality and accounting stan-dards are not included in the pre-1998 sample because these indicators are not available for the earlier years. A dummy variable, which is included in the 1977–2006 estimations and which has a signifi cant positive sign for
More fi nancial openness is associated with lower capital volatility. For both the full country sample and for emerging markets, the results indicate that in a given country there will be a signifi cant reduction in infl ow volatility over time (Table 3.2). Although most of the other factors also show a negative relationship with capital volatility, the coeffi cients are not statisti-cally signifi cant, except for global liquidity, for
the period 1998–2006, implies that there are factors (such as structural changes) that cannot be captured by the explanatory variables in the full-period sample. The accounting standards indicator is not statistically signifi cant.
DOES DOMESTIC FINANCIAL DEVELOPMENT HELP DETERMINE CAPITAL INFLOWS?
Discussions with private fi nancial institutions that invest in emerging markets suggest that the quality of a country’s fi nancial market is a contributing factor in those institutions’ deci-sion making as regards asset allocation.1 How-ever, the relative importance of such domestic “micro” fi nancial factors as the liquidity and depth of the domestic fi nancial market and institutional quality, including transparency, cor-porate governance, and market infrastructure, varies across types of investors. As expected, on the whole, long-term investors tend to attach higher importance to such factors than do more active investors.
There are a number of metrics that institu-tional investors use to determine the adequacy of liquidity when considering whether to enter a market. Some investors assess liquidity in an emerging market by the amount of stocks or bonds they can buy and sell within a day, by how big a position they can take with a minimal effect on price, and by how wide the bid/ask spread is. Metrics include the average daily turn-
1This box reports on discussions with a broad range of institutional investors, including hedge funds, mutual funds, investment management companies, and banks.
over of a particular security, how the market has reacted during past periods of stress, and the proportion of the free fl oat of shares. Another important indicator for fi xed-income securities is the liquidity of the repo market, because, without it, trades in the cash market need to be funded, which is a disincentive to investment for some types of investors.2
Other factors in estimating market liquid-ity are the size of the national economy and whether there is a broad and diversifi ed group of domestic institutional investors, who gener-ally provide a stabilizing force when foreign investors sell. Thus, the implementation of structural reforms (regarding the pension system or the insurance sector, for example) that are likely to strengthen the role of domestic investors plays an important role. Mexico was mentioned as an example where the average duration of bond investments has increased because of the issuance of long-maturity bonds, on the supply side, and due to the growing demand for securities by local institutional
2Unfortunately, most of these measures reported by investors are focused on individual securities and are not available on an aggregate basis for many of the countries in our sample over a signifi cant time period.
Box 3.2. Discussions with Investors into Emerging Markets: Do “Micro” Financial Factors Attract International Capital?

CHAPTER 3 THE QUALITY OF DOMESTIC FINANCIAL MARKETS AND CAPITAL INFLOWS
84
which there is on average a 1 percent increase relative to GDP with a 0.13 percent decline in infl ow volatility.12
A broader set of indicators of institutional quality was also found to have a negative rela-tionship with capital fl ow volatility. The panel estimations discussed above are complemented
12There are a number of possible interpretations as to why these coeffi cients are not statistically signifi cant. It may be due to the computing method for volatility (e.g., the fi ve-year rolling window), or the low frequency of the data (annual), which does not capture the actual speed with which capital fl ows may change direction, making statistical signifi cance diffi cult to obtain. Another compu-tation, using the absolute value of capital fl ows divided by GDP, obtained similar results.
by plotting a set of six indicators—regulatory quality, rule of law, control of corruption, voice and accountability, political stability, and gov-ernment effectiveness—against the volatility of capital infl ows.13 As the scatter diagrams suggest, these metrics exhibit a negative correlation with infl ow volatility (Figure 3.3).
13See Kaufmann, Kraay, and Mastruzzi (2007). These indicators are not included in the panel estimations because they show high correlation coeffi cients with the institutional quality indicators that are already included in the regressions; and are available for only fi ve years, suggesting that statistical signifi cance would be compro-mised. The panels in Figure 3.3 show values averaged over these years.
investors, on the demand side. The Brazilian market’s depth is explained in large part by the diversity of domestic investors.
International investors raised the following points regarding the role of institutional quality factors in their asset allocation decisions involv-ing emerging markets:• Transparency is the most important element of
institutional quality. Compared with a decade ago, transparency and predictability of infor-mation (including timely data) and policies have improved, particularly regarding taxa-tion, accounting standards, and regulations. Together with strengthened macroeconomic fundamentals, this improvement has comple-mented the “push” factors of global liquidity, and contributed to bringing emerging mar-kets into the mainstream as an asset class.
• In contrast to a decade ago, the recent surge of capital fl ows can also be partly attributed to improvements in market infrastructure in emerg-ing markets across the board. For example, market participants value the sound banking and regulatory system in Brazil and the high level of human capital (e.g., information tech-nology and the knowledge of English) in India.
• Weak institutional elements may have a nega-tive infl uence. For example, although local
currency bonds are suffi ciently liquid in a particular emerging markets some investors said they would avoid them because they have serious doubts about the independence of the statistical agency and, hence, the reliability of economic data. Other investors reported a large recent sell-off of stocks amid con-cerns about corporate governance, includ-ing minority shareholders’ rights in another market. However, a number of the most active hedge funds noted that they are prepared, in most cases, to participate where there is weak governance, if the asset’s price refl ects an appropriate risk premium.Views differed among investors on the effec-
tiveness of restrictions on capital infl ows. Some investors thought that, under certain circum-stances, restrictions could be effective in the short run. Some noted Malaysia as an example where it was possible to prevent offshore trading of a currency without evasion. Other capital restrictions are only partially effective, such as in cases where a wedge develops between the onshore and offshore rates implied by nonde-liverable forwards. Investors fi nd ways to gain exposure to a desired emerging market destina-tion despite restrictions, through the use of new vehicles and instruments (see Chapter 1).
Box 3.2 (concluded)

85
Challenges Associated with Capital Infl ows and Policy Responses: Case Studies
The empirical work presented in the previ-ous section shows that, over the medium term, deeper and more liquid equity markets and better market infrastructure help attract capital infl ows, and that capital volatility is reduced as a country becomes fi nancially more open. Improvements in institutional quality are also associated with reductions in volatility. But mar-
ket development takes time and countries that experience a surge in capital fl ows are searching for ways to address short-term challenges. This section looks at fi ve country examples—Brazil, India, Romania, South Africa, and Vietnam—and considers whether the challenges associ-ated with large capital infl ows and the policy responses vary if countries are at different stages of domestic fi nancial market development.14
By way of background, the degree of fi nan-cial intermediation varies widely across the fi ve countries. Romania has experienced the highest growth rate in private credit during the past fi ve years, and yet remains the country with the lowest credit-to-GDP as well as broad-money-to-GDP ratios (Table 3.3). Vietnam has had the fastest growth in equity market capitalization, but the ratio of that capitalization to GDP in Vietnam was the lowest of the fi ve countries at end-2006. By comparison, South Africa’s market capitalization is higher than that of the United Kingdom or the United States, when normal-ized by GDP, more than doubling in the past fi ve years from a large base; its equity market is also very liquid, far higher than in the other emerging markets. Despite the different degrees of fi nancial intermediation within the group, in recent years the fi ve countries have all experi-enced a deepening of their internal fi nancial markets and a rise in their market liquidity.
Key Challenges
There are three sets of challenges stemming from a surge of capital infl ows.
Macroeconomic
Fundamentally, countries could face a confl ict of macroeconomic objectives if they attempt to both target a specifi c exchange rate or band and, at the same time, maintain control over their domestic monetary policy. This results in
14Annex 3.2 presents more detailed information on the challenges facing these countries and the measures they have undertaken. Annex 3.3 provides stylized facts for a larger group of countries.
CHALLENGES ASSOCIATED WITH CAPITAL INFLOWS AND POLICY RESPONSES: CASE STUDIES
Table 3.2. Panel Generalized Method of Moments Estimation of the Determinants of the Standard Deviation of Total Capital Infl ows, 1998–2006
Standard Deviation of TotalCapital Inflows/GDP1
Allcountries
Emergingmarkets
Financial Development IndicatorsEquity market turnover 0.003 –0.009
[0.881] [0.784]Equity market capitalization –0.015 –0.014
[0.441] [0.513]Financial openness –2.317 –3.359
[0.018]** [0.002]***Corporate governance quality 5.856 16.530
[0.704] [0.420]Accounting standards –2.428 –27.769
[0.916] [0.395]Macroeconomic Factors
Growth expectation –0.290 –0.133[0.196] [0.568]
Interest rate differential 0.009 0.044[0.883] [0.469]
Global liquidity –0.079 –0.128[0.083]* [0.053]*
J-statistics2 8.206 4.614[0.999] [0.999]
No. of cross-section countries 33 18No. of observations3 254 136Instrument rank4 49 34
Sources: Bloomberg; Chinn and Ito (2006); Datastream; De Nicolò and others (2006); IMF, International Financial Statistics and World Economic Outlook databases; Standard and Poor’s Emerging Markets Database; and World Federation of Exchanges.
1Probability values are in square brackets: *** significant at 1 percent level; ** significant at 5 percent level; and * significant at 10 percent level. Cross-section fixed-effects specification with 2SLS instrument weighting matrix.
2Test statistics for the null hypothesis that the over-identifying restrictions are valid.
3Total number of observations based on the unbalanced panel structure.
4Lagged values of independent variables are used as instruments.
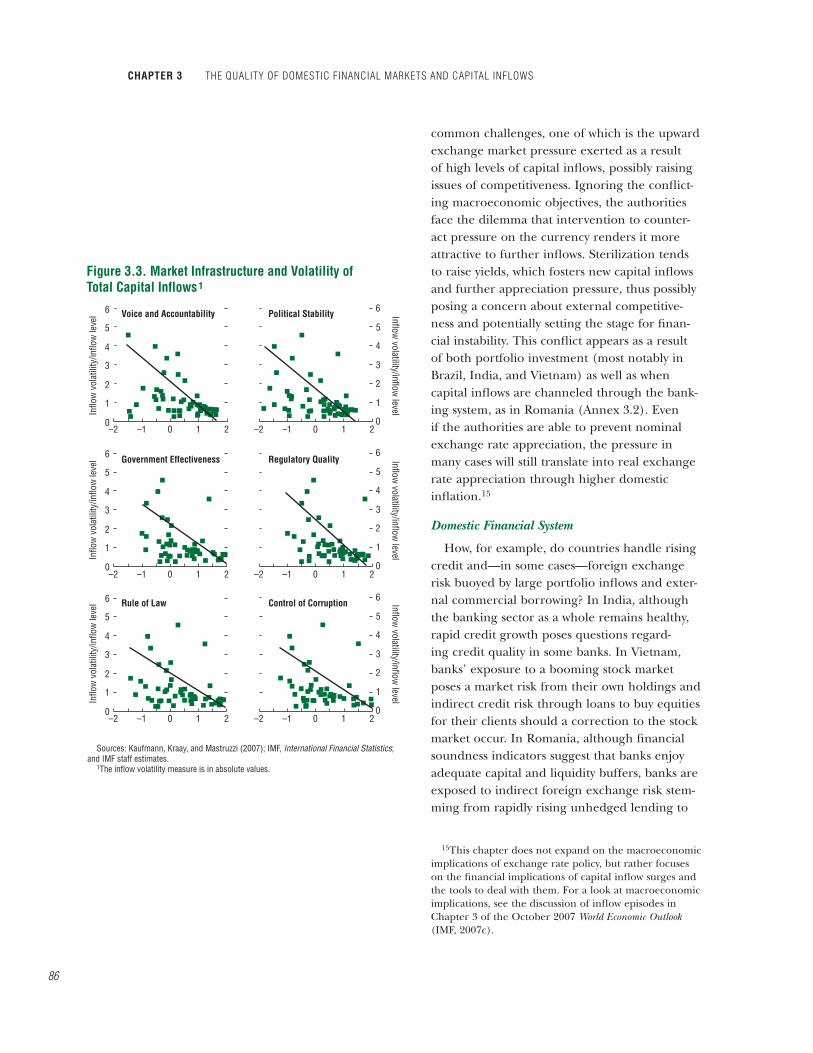
CHAPTER 3 THE QUALITY OF DOMESTIC FINANCIAL MARKETS AND CAPITAL INFLOWS
86
common challenges, one of which is the upward exchange market pressure exerted as a result of high levels of capital infl ows, possibly raising issues of competitiveness. Ignoring the confl ict-ing macroeconomic objectives, the authorities face the dilemma that intervention to counter-act pressure on the currency renders it more attractive to further infl ows. Sterilization tends to raise yields, which fosters new capital infl ows and further appreciation pressure, thus possibly posing a concern about external competitive-ness and potentially setting the stage for fi nan-cial instability. This confl ict appears as a result of both portfolio investment (most notably in Brazil, India, and Vietnam) as well as when capital infl ows are channeled through the bank-ing system, as in Romania (Annex 3.2). Even if the authorities are able to prevent nominal exchange rate appreciation, the pressure in many cases will still translate into real exchange rate appreciation through higher domestic infl ation.15
Domestic Financial System
How, for example, do countries handle rising credit and—in some cases—foreign exchange risk buoyed by large portfolio infl ows and exter-nal commercial borrowing? In India, although the banking sector as a whole remains healthy, rapid credit growth poses questions regard-ing credit quality in some banks. In Vietnam, banks’ exposure to a booming stock market poses a market risk from their own holdings and indirect credit risk through loans to buy equities for their clients should a correction to the stock market occur. In Romania, although fi nancial soundness indicators suggest that banks enjoy adequate capital and liquidity buffers, banks are exposed to indirect foreign exchange risk stem-ming from rapidly rising unhedged lending to
15This chapter does not expand on the macroeconomic implications of exchange rate policy, but rather focuses on the fi nancial implications of capital infl ow surges and the tools to deal with them. For a look at macroeconomic implications, see the discussion of infl ow episodes in Chapter 3 of the October 2007 World Economic Outlook(IMF, 2007c).
0
1
2
3
4
5
6
–2 –1 0 1 2–2 –1 0 1 2
–2 –1 0 1 2–2 –1 0 1 2
–2 –1 0 1 2–2 –1 0 1 2
0
1
2
3
4
5
6
0
1
2
3
4
5
6
0
1
2
3
4
5
6
0
1
2
3
4
5
6
0
1
2
3
4
5
6
Sources: Kaufmann, Kraay, and Mastruzzi (2007); IMF, International Financial Statistics;and IMF staff estimates.
1The inflow volatility measure is in absolute values.
Figure 3.3. Market Infrastructure and Volatility ofTotal Capital Inflows1
Voice and Accountability Political Stability
Government Effectiveness Regulatory Quality
Rule of Law Control of Corruption
Inflo
w v
olat
ility
/inflo
w le
vel
Inflo
w v
olat
ility
/inflo
w le
vel
Inflo
w v
olat
ility
/inflo
w le
vel
Inflow volatility/inflow
levelInflow
volatility/inflow level
Inflow volatility/inflow
level
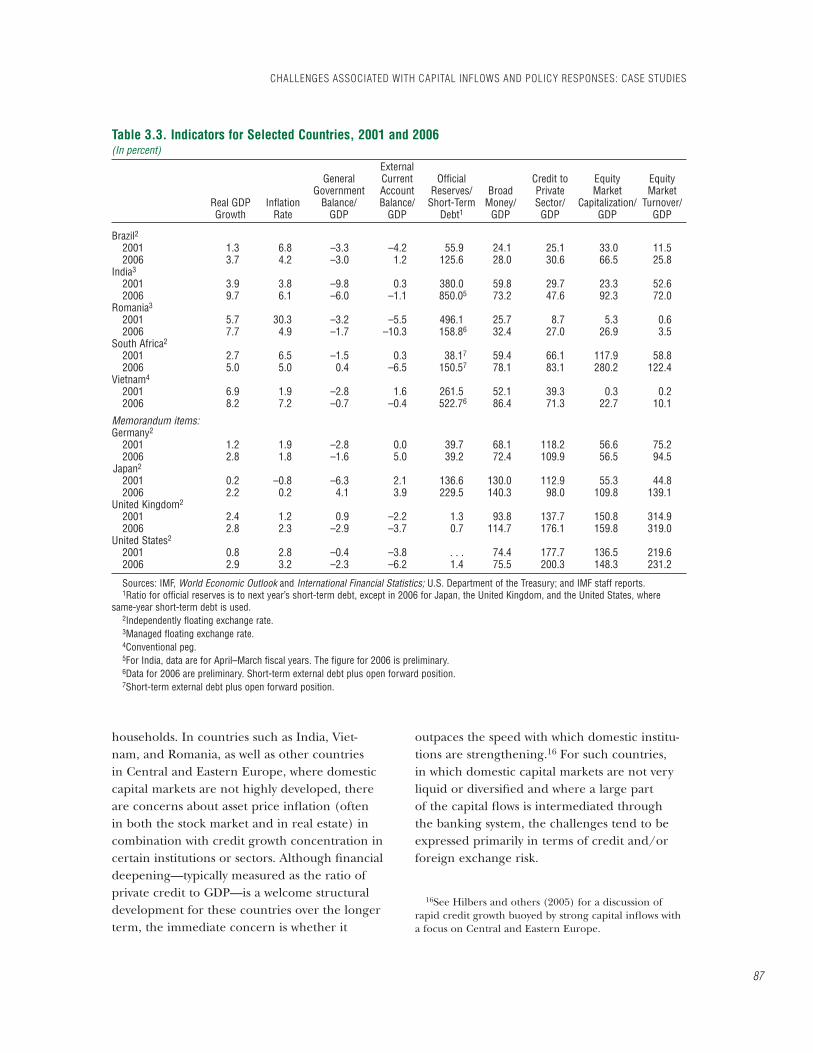
87
households. In countries such as India, Viet-nam, and Romania, as well as other countries in Central and Eastern Europe, where domestic capital markets are not highly developed, there are concerns about asset price infl ation (often in both the stock market and in real estate) in combination with credit growth concentration in certain institutions or sectors. Although fi nancial deepening—typically measured as the ratio of private credit to GDP—is a welcome structural development for these countries over the longer term, the immediate concern is whether it
outpaces the speed with which domestic institu-tions are strengthening.16 For such countries, in which domestic capital markets are not very liquid or diversifi ed and where a large part of the capital fl ows is intermediated through the banking system, the challenges tend to be expressed primarily in terms of credit and/or foreign exchange risk.
16See Hilbers and others (2005) for a discussion of rapid credit growth buoyed by strong capital infl ows with a focus on Central and Eastern Europe.
CHALLENGES ASSOCIATED WITH CAPITAL INFLOWS AND POLICY RESPONSES: CASE STUDIES
Table 3.3. Indicators for Selected Countries, 2001 and 2006(In percent)
Real GDP Growth
InflationRate
GeneralGovernment
Balance/GDP
ExternalCurrentAccountBalance/
GDP
OfficialReserves/
Short-TermDebt1
BroadMoney/
GDP
Credit toPrivateSector/
GDP
EquityMarket
Capitalization/GDP
EquityMarket
Turnover/GDP
Brazil22001 1.3 6.8 –3.3 –4.2 55.9 24.1 25.1 33.0 11.52006 3.7 4.2 –3.0 1.2 125.6 28.0 30.6 66.5 25.8
India3
2001 3.9 3.8 –9.8 0.3 380.0 59.8 29.7 23.3 52.62006 9.7 6.1 –6.0 –1.1 850.05 73.2 47.6 92.3 72.0
Romania3
2001 5.7 30.3 –3.2 –5.5 496.1 25.7 8.7 5.3 0.62006 7.7 4.9 –1.7 –10.3 158.86 32.4 27.0 26.9 3.5
South Africa2
2001 2.7 6.5 –1.5 0.3 38.17 59.4 66.1 117.9 58.82006 5.0 5.0 0.4 –6.5 150.57 78.1 83.1 280.2 122.4
Vietnam4
2001 6.9 1.9 –2.8 1.6 261.5 52.1 39.3 0.3 0.22006 8.2 7.2 –0.7 –0.4 522.76 86.4 71.3 22.7 10.1
Memorandum items: Germany2
2001 1.2 1.9 –2.8 0.0 39.7 68.1 118.2 56.6 75.22006 2.8 1.8 –1.6 5.0 39.2 72.4 109.9 56.5 94.5
Japan2
2001 0.2 –0.8 –6.3 2.1 136.6 130.0 112.9 55.3 44.82006 2.2 0.2 4.1 3.9 229.5 140.3 98.0 109.8 139.1
United Kingdom2
2001 2.4 1.2 0.9 –2.2 1.3 93.8 137.7 150.8 314.92006 2.8 2.3 –2.9 –3.7 0.7 114.7 176.1 159.8 319.0
United States2
2001 0.8 2.8 –0.4 –3.8 . . . 74.4 177.7 136.5 219.62006 2.9 3.2 –2.3 –6.2 1.4 75.5 200.3 148.3 231.2
Sources: IMF, World Economic Outlook and International Financial Statistics; U.S. Department of the Treasury; and IMF staff reports.1Ratio for official reserves is to next year’s short-term debt, except in 2006 for Japan, the United Kingdom, and the United States, where
same-year short-term debt is used.2Independently floating exchange rate.3Managed floating exchange rate.4Conventional peg.5For India, data are for April–March fiscal years. The figure for 2006 is preliminary.6Data for 2006 are preliminary. Short-term external debt plus open forward position. 7Short-term external debt plus open forward position.

CHAPTER 3 THE QUALITY OF DOMESTIC FINANCIAL MARKETS AND CAPITAL INFLOWS
88
External
The external challenges to emerging markets involve an abrupt change in global fi nancial conditions and international investor appetite for risk. South Africa, for example, has expe-rienced high volatility of its exchange rate despite a strong macroeconomic performance and a liquid fi nancial market, as evidenced by the May/June 2006 and February/March 2007 episodes when the rand was one of the most affected emerging market currencies; this was probably also due to the large current account defi cit and a weakening of commodity prices. As for Brazil, the composition of infl ows means that the risk of a sudden withdrawal is high if international investors adjust their portfolios abruptly, since a large part of the infl ows is in the form of short-term portfolio fl ows. How-ever, with strong macroeconomic performance, including an improved debt composition, a well-supervised fi nancial system, and diversifi ed domestic markets, Brazil’s external vulnerability is reduced relative to previous episodes of surges and withdrawals of capital fl ows.
Financial Policies Adopted by the Authorities
In addition to accumulating foreign assets as a fi nancial safety cushion, the fi ve countries discussed here have undertaken a number of reforms that are designed to reduce external vulnerabilities in the long term. Such structural reforms include strengthening the prudential and regulatory framework and market infra-structure, and facilitating a smooth develop-ment of domestic capital markets (Annex 3.2). In South Africa, for example, the authorities relaxed restrictions on outward investment in recent years as the economy moves away from exchange controls and toward a system of prudential-based regulations for institutional investors. Brazil removed withholding taxes on income earned by nonresidents from govern-ment securities holdings, which, although still at an early stage, appears to have attracted larger investor participation. In addition, limits on the outward investment of Brazilian institutional
asset funds were loosened. The measures taken in the two countries of the group with the more developed capital markets have had the ben-efi cial effects of further enlarging the investor base and allowing for greater risk diversifi cation, and have the potential to reduce currency and infl ow volatility.
Other fi nancial measures have been taken with the more immediate aim of reducing the country’s short-term vulnerability stem-ming from capital infl ow surges (and potential withdrawals). Some of these policies have had mixed results, while for others it is too early to draw defi nitive lessons about their effectiveness, since the capital infl ow surge is still unfolding. Measures taken include the following:• Prudential requirements for bank transac-
tions in foreign currency have been tightened (Brazil). On the other hand, a stricter limit to banks’ unhedged foreign currency lending introduced in Romania in 2005 was removed in early 2007 because it was no longer effective.
• Banks’ reserve requirements were raised (India, Romania, Vietnam) and differenti-ated between domestic and foreign currency deposits to encourage a switch to domestic currency lending (Romania). Beginning in 2005, Romania also required the separate classification of unhedged foreign currency loans regardless of their repayment perfor-mance. It is unclear whether these measures have slowed the growth of unhedged foreign exchange household credit or reduced the currency mismatch on bank balance sheets in Romania.
• Addressing specifically the containment of rapid credit growth, India boosted the risk weights for high-growth areas, such as real estate, to above Basel norms.
• Vietnam took a series of administrative steps to address banks’ exposure to the stock mar-ket and to contain the strong equity valuation, including tightening the rules for new bank lending for the purchase of stocks, and rereg-istration and new reporting requirements for foreign investment funds.

89
Financial Policy Options17
There are a number of practices that coun-tries follow to address short-term challenges stemming from capital infl ow pressures. These measures can be administrative or market-based, and may include informal offi cial guidance in cases where the weight of the authorities’ role relative to that of market forces allows it. Such measures include (1) increasing the cost of central bank credit; (2) raising banks’ reserve requirements; (3) varying reserve requirements between domestic and foreign exchange depos-its; (4) placing government deposits with the central bank; and (5) introducing taxes to either level out or create a wedge between the yields of domestic and foreign securities. Although market-based measures are preferable to admin-istrative ones, these policies are—either explic-itly or implicitly—a tax on the fi nancial system and have the potential to increase interest rates and spur additional infl ows. Thus, their cost and potentially distortive side effects ought to be carefully counterbalanced against their effective-ness over time.
As regards prudential measures, they are most effective when they concentrate on what they were intended to achieve, that is, the long-term soundness of the domestic fi nancial system, rather than be stretched to counteract capital infl ow pressures. When proposed, their full implications, including possible side effects, need to be carefully considered. Specifi cally, pruden-tial measures in banking could focus on making sure that banks understand the risks stemming from capital infl ows, that the capital structure of banks is appropriate for the type of infl ows, and that fi nancial institutions are required to set up proper risk management policies and practices to measure and manage aggregate exposures, including those of offshore exposure of domestic fi nancial institutions. It is important to promote a good understanding of risk among borrowers, in particular for loans in foreign exchange where
17For the purposes of this chapter, the discussion focuses on fi nancial or microeconomic rather than mac-roeconomic policies.
exchange rate risk for borrowers can easily trans-late into credit risk for banks.18
Prudential measures relating to the capital markets should aim to strengthen corporate governance, including shareholders’ rights, listing requirements, and the clearance and settlement system. Margin requirements may be established considering such factors as historical volatility, risks of extreme movements, length of the settlement period, and capital adequacy of brokers. These parameters are most effectively established to promote systemic development and stability in the long run, rather than as a short-term response to capital movements.
Another policy designed to reduce pres-sures from large capital infl ows is the easing of controls on capital outfl ows. In addition to Brazil, a number of countries—including Chile, China, and Korea—have recently liberalized rules limiting individual or institutional invest-ments abroad. This has led to a rapid increase in portfolio investment outfl ows, especially in Asia (Box 3.1). It is too early to conclude from the data, however, whether capital outfl ow liberaliza-tion will be effective in relieving infl ow pressure over time. More fundamentally, it is diffi cult to measure the effectiveness of capital outfl ow liberalization given the possible role of other factors in determining the direction and level of capital fl ows. There are also indications that in past episodes of capital infl ow surges the liberal-ization of capital outfl ows was matched by larger infl ows (Reinhart and Reinhart, 1998).
In line with the earlier empirical results that suggest that fi nancial openness encourages infl ows, capital controls, broadly defi ned, are usually unhelpful in managing infl ows. They pose problems of implementation and cir-cumvention, including governance problems, especially for administrative controls, where one authority possesses the right of discretionary
18See Enoch and Ötker-Robe (2007) for a discussion of the use of prudential measures to ensure sound lending practices in cases of rapid credit growth.
CHALLENGES ASSOCIATED WITH CAPITAL INFLOWS AND POLICY RESPONSES: CASE STUDIES

CHAPTER 3 THE QUALITY OF DOMESTIC FINANCIAL MARKETS AND CAPITAL INFLOWS
90
decision making.19 One needs to differenti-ate between countries that already have capital controls in place (including the accompanying infrastructure and reputation) and delay sched-uled liberalization, and countries that impose controls starting from a position of an open capital account regime. In the latter case, capital controls can carry reputational costs, which may be signifi cant if the country meets its fi nancing needs from international capital markets.20
If capital controls are used, they best take the form of market-based controls, and should be used only as a transitional measure to provide breathing space while developing an adequate supervisory and regulatory system or strengthen-ing the regulated fi nancial institutions. Other policy adjustments should be undertaken in par-allel, as the effectiveness of capital controls tends to diminish over time.21 Eventually, investors fi nd ways to assume exposure to a desired emerging market destination, thus blunting a country’s attempts to relieve pressure on the exchange rate (Box 3.3).22 In any case, market-based controls, such as unremunerated reserve requirements, would be preferable to administrative measures.
19This is particularly problematic where transactions or transfers are subject to prior approval by the foreign exchange authority and there are no clear criteria for granting such approval.
20To regain monetary policy independence and stabilize short-term capital fl ows, Malaysia introduced a wide range of direct capital and exchange controls in September 1998. These controls were effective, but, fi ve months later, the costs of weakening investor and market confi dence prompted the authorities to loosen them in the form of an exit levy system (Ariyoshi and others, 2000).
21To limit short-term capital infl ows, Chile introduced capital controls in 1991 in the form of a minimum stay requirement and 20 percent unremunerated reserve requirements (URR). These controls were successful in reducing short-term infl ows. However, until 1998, when the measures were eliminated, the rate and coverage of the URR were changed several times in an effort to close the channels that developed to circumvent the controls (Ariyoshi and others, 2000).
22Brazil introduced various controls during 1993–97 to lengthen the maturity and change the composition of capital infl ows. Since the cost of circumvention declined relative to investors’ incentives, the controls gradually lost effectiveness, resulting in additional alteration of them (Ariyoshi and others, 2000).
Key Results and ConclusionsThe key results from the estimations pre-
sented in this chapter can be summarized as follows:
• Growth and growth prospects are primary domestic determinants of the level of capital inflows.
• Financial market liquidity and financial open-ness help attract capital inflows.
• More financial openness is associated with lower capital volatility.
• Volatility of capital inflows is partly driven by external factors, such as global financial liquidity, which are outside the control of emerging markets.
• Institutional quality, as expressed by a number of diverse indicators, matters. Specifically, better corporate governance is associated with a higher level of inflows, and a number of institutional quality and market infrastructure indicators, including regula-tory quality and the rule of law, are positively associated with a reduction in the volatility of capital inflows.
These results—indicating that the quality of the domestic fi nancial market raises the level and helps reduce the volatility of capital infl ows—lend empirical support to conven-tional wisdom and are consistent with what we learned from discussions with private sector institutional investors, as well as with the fi nd-ings from the fi ve country examples.
Since the surge in capital infl ows is still unfolding, it is hard to draw defi nitive con-clusions on the effectiveness of current fi nancial policies in dealing with the present surges (and possible withdrawals) of capital fl ows. However, even after the current cycle changes direction, the long-term trend toward increased fi nancial integration is such that countries will need to put themselves in a situation that will make it possible to live with the potential volatility of capital fl ows. The chapter has provided some clues concerning the longer-term fi nancial policies that will aid countries in this endeavor.

91
In addition to strong macroeconomic funda-mentals, including sound fi scal policy and more fl exible exchange rates, countries will be better equipped to live with potential capital fl ow volatility if they either possess or demonstrate
progress toward achieving the following long-term structural characteristics:• Deep and liquid equity markets within a well-
regulated system; and• Strong institutional quality across a broad
KEY RESULTS AND CONCLUSIONS
Strong economic performance has increas-ingly attracted the attention of international investors to India. But direct access to the domestic fi xed-income, foreign exchange, and equity markets by international investors is either restricted, through the qualifi ed foreign institutional investor (FII) program, or closed altogether. Several factors constrain investors from entering the Indian market directly. For instance, foreign investors are subject to limits in their holdings of corporate and government securities, cannot participate in the interbank market, and do not have access to local cur-rency instruments for purposes of speculation. In addition, although a level playing fi eld for all investors is welcome, the relatively high with-holding and other taxes and the hurdles for opening and operating a domestic settlement account are administratively burdensome for many foreign investors.
Many international investors are able to acquire exposure to Indian markets while avoid-ing India’s regime of restrictions on foreign participation through an increasing number of channels, particularly as derivatives markets have grown. For example, there is a large and relatively liquid offshore market for India’s interest rates along the full yield curve—up to 10 years.
The growth of derivatives-related and other transactions opens numerous two-way chan-nels for investors who see India as a desired destination:• Foreign investors, including hedge funds,
can gain entry into the Indian equity market through the purchase of participatory notes
offered by registered FIIs. These notes allow offshore participants to gain exposure to Indian equities without registering as an FII.
• The onshore rupee forward market is only available for hedging commercial transac-tions. Hence, to express an outright currency or interest rate view, foreign investors transact through the nondeliverable forwards and interest rate swaps markets. Liquidity in these markets is provided by foreign banks and offshore Indian accounts.
• A borrowing channel for Indian corporates via foreign currency convertible bonds (FCCBs) gets packaged into structured credit products, such as credit-linked notes and collateralized debt obligations. As a rule, Indian subsidiaries offshore purchase the credit portion, while hedge funds, proprietary desks of investment banks, and other international investors prefer the equity option. Indian corporates indicate that access to low-cost fi nancing through FCCBs is worth this minor dilution in their equity stake. More generally, the credit default market in Indian credits is reasonably active, with offshore subsidiaries of Indian banks providing insurance to international investors, in some cases through structured products. In sum, there are opportunities to gain exposure to Indian credit risk offshore.
• Given the existing restrictions on portfolio ownership by foreign investors, private sector participants can take an increasingly more direct ownership avenue through private equity direct investments. In this context, private equity accounts for a growing share of infl ows, much of it targeting real estate-related investments. This development often makes it diffi cult to distinguish between foreign direct and portfolio investment.
Box 3.3. How Investors Gain Exposure to an Emerging Market in the Presence of Capital Controls: The Case of India
Note: The main contributors to this box are Rebecca McCaughrin and Tao Sun.
CHAPTER 3 THE QUALITY OF DOMESTIC FINANCIAL MARKETS AND CAPITAL INFLOWS
92
range of indicators, including corporate governance, accounting standards, the rule of law, and control of corruption.Analysis has demonstrated the importance of
transparency in relation to both policies (macro-economic and microfi nancial) and data. When this transparency is combined with a strong self-assessment of macro and fi nancial vulnerabilities and with sound risk management systems within fi nancial institutions and the public sector, it improves the ability of countries to deal with capital fl ows. Private institutional investors have repeatedly expressed the importance of timely and accurate data, as well as a predictable and transparent way of communicating with the investor base, as factors that contribute to the effective management of capital fl ows.
It is diffi cult to draw blanket recommenda-tions beyond the ones noted above because policy challenges associated with capital infl ows cannot and should not be uniform. Countries differ in their exchange rate regime and the type of capital infl ows they experience, and therefore in the challenges they face. They dif-fer also in the depth and diversifi cation of their fi nancial markets and their institutional and regulatory development, which means that they have a different menu of policy options at their disposal.
There are, however, some general guidelines as regards fi nancial sector policies that are aimed at alleviating the pressures arising from large capital infl ows:• Loosening or eliminating restrictions on resi-
dents’ capital outflows is a tool that can ease pressures from large capital inflows. Outward investment will also lead to internationaliza-tion of capital across emerging markets and, therefore, can be a welcome means of risk diversification. More experience will show whether this policy will have a lasting effect.
• Supervisory and prudential measures have a key role to play in addressing the health and stability of the financial system. Ideally, how-ever, they are best used to address prudential considerations such as rapid credit growth or unhedged foreign exchange exposures; that
is, to ensure the soundness of the domestic financial system, rather than as a response designed to alleviate pressures stemming from capital inflow surges. A well-supervised finan-cial system will help provide safeguards that will permit capital flows to enter and exit the financial system without endangering financial stability.
• Capital controls should be used only as a last resort and as part of a package of macroeco-nomic and prudential measures. They may be able to throw sand in the gears of a surge of short-term speculative inflows under certain circumstances, especially if the infrastructure is already in place. In addition to the chal-lenge of effectiveness, there are reputational costs to be considered. Moreover, the effec-tiveness of controls can either be circum-vented from the start or diminish over time, as financial instruments will likely be found to circumvent them.Ultimately, however, it is the quality of its
domestic fi nancial market—in addition to strong macroeconomic performance—that will put an emerging market in a position to maximize to the fullest extent the benefi ts of capital infl ows and best deal with their potential volatility. Short-term measures intended for an immedi-ate relief of pressure from large capital infl ows may have uncertain effectiveness or unintended side effects, or be a distraction from the long-term goal of raising the quality of the domestic market—including depth and liquidity, market infrastructure, supervision, and institutions.
The increasing integration of fi nancial markets—across countries and sectors—witnessed in the past decade has both long-term and cyclical elements. However, even after the current cycle turns, the underlying fi nancial globalization trend is likely to point to con-tinued fi nancial integration, which will affect both advanced and newly arriving emerging markets. Countries, therefore, are best served if their primary response to large capital infl ows today is to pursue the longer-term goal of devel-oping their fi nancial markets and building up a resilience to capital volatility rather than making

93
short-term responses to infl ow surges. Countries will be better off if fl ows can both enter and exit freely without disrupting domestic fi nancial stability and the real economy.
Annex 3.1. Estimation Specifi cation and Results
A panel specifi cation is employed to estimate the factors that determine the level of capital infl ows for a sample of 56 countries, using an annual sample from 1975 to 2006.23 The depen-dent variables used in the estimations comprise total capital fl ows and four main components, namely portfolio equity, portfolio bonds, FDI, and an “other” category that consists primarily of bank lending and includes fi nancial deriva-tives for most of the countries that do not report these under a separate category, as well as money market instruments. The variables are normal-ized by nominal GDP. Total infl ows and each of its components are modeled as a function of a set of fi nancial development variables, as well as two macroeconomic measures aiming to control for the effect that these variables may have.
The panel regressions are run on a sample of the following 56 countries:• 15 developed economies: Australia, Belgium,
Canada, France, Germany, Greece, Italy, Japan, the Netherlands, New Zealand, Spain, Sweden, Switzerland, United Kingdom, and United States.
• 12 emerging market economies—Asia: China, Hong Kong SAR, India, Indonesia, Korea, Malaysia, Pakistan, the Philippines, Singapore, Sri Lanka, Thailand, and Vietnam.
• 20 emerging market economies—Europe, Middle East, and Africa: Algeria, Bulgaria, Côte d’Ivoire, Croatia, Czech Republic, Estonia, Hungary, Israel, Jordan, Latvia, Lithuania, Morocco, Nigeria, Poland, Romania, Russia, Saudi Arabia, Slovenia, South Africa, and Turkey.
23Due to the unbalanced structure of the panel data, some countries are dropped from the sample in the estimations.
• Nine emerging market economies—Latin America:Argentina, Brazil, Chile, Colombia, Ecuador, Mexico, Panama, Peru, and Venezuela.We consider two types of factors: macro-
economic factors and fi nancial development indicators.
Macroeconomic Factors
(1) Spread: real interest rate differential measured as the difference between the domes-tic one-year treasury bill rate and the world rate, calculated as the real GDP-weighted average of each country’s one-year rate;
(2) Growth: adaptive expectation for growth measured as real GDP growth rate in the previ-ous year; and
(3) Global liquidity: changes in the sum of money supply (M1) and offi cial reserves in the euro area, Japan, and the United States, a com-mon general proxy for global liquidity.
Financial Development Indicators
(1) Changes in equity market capitalization and equity market turnover, each normalized by nominal GDP;24
(2) Financial openness, as reported in Chinn and Ito (2006), which codifi es the tabulation of restrictions on cross-border fi nancial transac-tions reported by the IMF’s Annual Report on Exchange Arrangements and Exchange Restrictionsas an index to measure a country’s degree of capital account openness;
(3) Corporate governance quality: a de facto, as opposed to de jure, index comprising a simple average of three indicators constructed from accounting and market data for samples of nonfi nancial companies listed in stock markets (De Nicolò, Laeven, and Ueda, 2006); and
(4) Accounting standards: a measure of the amount of accounting information that fi rms disclose (De Nicolò, Laeven, and Ueda, 2006).
24The sources for these data are the World Federa-tion of Exchanges, Datastream, and Standard and Poor’s Emerging Markets Database.
ANNEX 3.1. ESTIMATION SPECIFICATION AND RESULTS

CHAPTER 3 THE QUALITY OF DOMESTIC FINANCIAL MARKETS AND CAPITAL INFLOWS
94
We also performed panel estimations that included in the specifi cation credit market depth (approximated by the change in private credit outstanding normalized by nominal GDP) as an explanatory variable for the level and volatility of capital infl ows. However, in most cases, this variable showed the opposite sign and was often not signifi cant. A possible explana-tion is that domestic bank credit to the private sector works as a substitute for capital infl ows, including external bank borrowing, since well-functioning domestic credit markets may raise domestic savings and reduce the need for fi nancing from international markets.
The same specifi cation employed to estimate the factors that determine the level of capital fl ows is also used for estimating the volatility of infl ows measured by their standard devia-tion computed using a fi ve-year rolling window, also divided by nominal GDP.25 The general-ized method of moments (GMM) estimation is employed with lagged values for independent variables as instruments.26 To avoid the use
25See Box 2.5 in the April 2007 GFSR for a similar approach (IMF, 2007a).
26Since the test results of our volatility measures for serial correlation are mixed, with weakly signifi cant results in some cases, we do not employ lagged values of
of nonstationary variables and to maintain a relatively large sample, the estimation is limited to the volatility of total capital infl ows, which follows a stationary process in the full country sample.
Unit root tests were performed for both panel and individual unit roots. Two tests—Levin, Lin, and Chu (2002), and Breitung (2000)—were conducted to test for the existence of a common unit root process. Three additional tests—Im, Pesaran, and Shin (2003), and Fisher-type tests using the Augmented Dickey-Fuller and the Phillips-Perron tests (Maddala and Wu, 1999; and Choi, 2001)—were conducted to test for unit roots in individual series. The tests indicate that most variables follow a stationary process. Exceptions are for the volatility of portfolio equity, portfolio bonds, and FDI. Similar results hold for the subperiod 1998–2006.
The tables that follow show the descriptive sta-tistics for the variables used in the panel regres-sions (Table 3.4), and the level estimation results for the 30-year period covering the full country sample and emerging markets (Tables 3.5 and 3.6), and, similarly, for the period 1998–2006 (Tables 3.7. and 3.8.).
dependent variables as instruments, since this would be an improper use of instruments in the GMM framework.
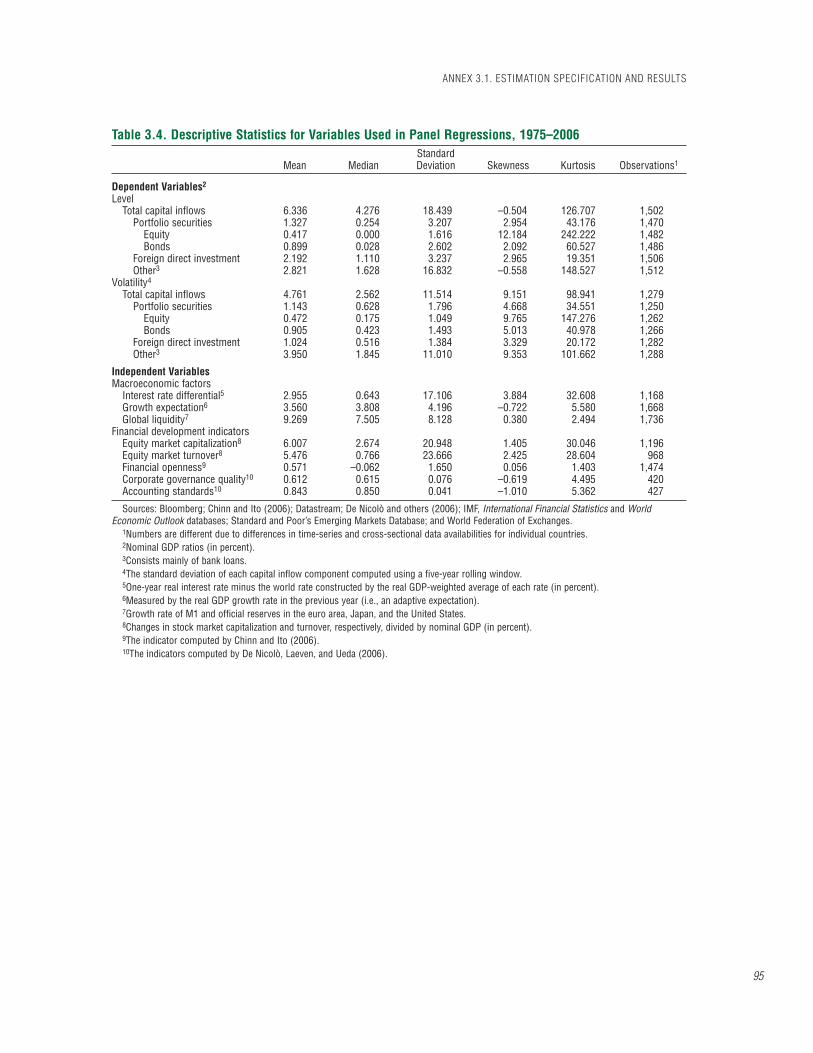
ANNEX 3.1. ESTIMATION SPECIFICATION AND RESULTS
95
Table 3.4. Descriptive Statistics for Variables Used in Panel Regressions, 1975–2006
Mean MedianStandardDeviation Skewness Kurtosis Observations1
Dependent Variables2
LevelTotal capital inflows 6.336 4.276 18.439 –0.504 126.707 1,502
Portfolio securities 1.327 0.254 3.207 2.954 43.176 1,470Equity 0.417 0.000 1.616 12.184 242.222 1,482Bonds 0.899 0.028 2.602 2.092 60.527 1,486
Foreign direct investment 2.192 1.110 3.237 2.965 19.351 1,506Other3 2.821 1.628 16.832 –0.558 148.527 1,512
Volatility4
Total capital inflows 4.761 2.562 11.514 9.151 98.941 1,279Portfolio securities 1.143 0.628 1.796 4.668 34.551 1,250
Equity 0.472 0.175 1.049 9.765 147.276 1,262Bonds 0.905 0.423 1.493 5.013 40.978 1,266
Foreign direct investment 1.024 0.516 1.384 3.329 20.172 1,282Other3 3.950 1.845 11.010 9.353 101.662 1,288
Independent VariablesMacroeconomic factors
Interest rate differential5 2.955 0.643 17.106 3.884 32.608 1,168Growth expectation6 3.560 3.808 4.196 –0.722 5.580 1,668Global liquidity7 9.269 7.505 8.128 0.380 2.494 1,736
Financial development indicatorsEquity market capitalization8 6.007 2.674 20.948 1.405 30.046 1,196Equity market turnover8 5.476 0.766 23.666 2.425 28.604 968Financial openness9 0.571 –0.062 1.650 0.056 1.403 1,474Corporate governance quality10 0.612 0.615 0.076 –0.619 4.495 420Accounting standards10 0.843 0.850 0.041 –1.010 5.362 427
Sources: Bloomberg; Chinn and Ito (2006); Datastream; De Nicolò and others (2006); IMF, International Financial Statistics and World Economic Outlook databases; Standard and Poor’s Emerging Markets Database; and World Federation of Exchanges.
1Numbers are different due to differences in time-series and cross-sectional data availabilities for individual countries.2Nominal GDP ratios (in percent).3Consists mainly of bank loans.4The standard deviation of each capital inflow component computed using a five-year rolling window.5One-year real interest rate minus the world rate constructed by the real GDP-weighted average of each rate (in percent).6Measured by the real GDP growth rate in the previous year (i.e., an adaptive expectation).7Growth rate of M1 and official reserves in the euro area, Japan, and the United States.8Changes in stock market capitalization and turnover, respectively, divided by nominal GDP (in percent).9The indicator computed by Chinn and Ito (2006).10The indicators computed by De Nicolò, Laeven, and Ueda (2006).

CHAPTER 3 THE QUALITY OF DOMESTIC FINANCIAL MARKETS AND CAPITAL INFLOWS
96
Table 3.5. Fixed-Effects Panel Least-Squares Estimation of the Determinants of Capital Infl ows (All Countries, Full Sample)
Capital Infl ows/GDP1
TotalTotal
portfolioPortfolio
equityPortfoliobonds
Foreigndirect
investment Other2
Macroeconomic FactorsInterest rate differential 0.043 –0.009 –0.003 –0.005 0.021 0.031
[0.030]** [0.448] [0.705] [0.441] [0.004]*** [0.106]Growth expectation 0.489 –0.027 –0.034 0.006 0.109 0.406
[0.000]*** [0.749] [0.471] [0.940] [0.000]*** [0.001]***Global liquidity –0.009 0.002 –0.004 0.006 –0.035 0.025
[0.849] [0.914] [0.596] [0.732] [0.010]** [0.452]Financial Development
IndicatorsEquity market capitalization 0.027 0.002 0.004 –0.002 0.019 0.007
[0.292] [0.764] [0.642] [0.703] [0.039]** [0.789]Equity market turnover 0.127 0.018 0.014 0.004 0.018 0.091
[0.002]*** [0.002]*** [0.013]** [0.369] [0.000]*** [0.013]**Financial openness 1.647 0.680 0.087 0.590 0.435 0.537
[0.000]*** [0.000]*** [0.075]* [0.000]*** [0.000]*** [0.037]**
Other FactorsConstant 2.294 0.979 0.528 0.454 1.470 –0.198
[0.010]*** [0.145] [0.126] [0.459] [0.000]*** [0.818]Dummy for 1998–2006 1.870 1.034 0.292 0.745 1.232 –0.297
[0.008]*** [0.006]*** [0.034]** [0.031]** [0.000]*** [0.577]Adjusted R2 0.552 0.306 0.239 0.317 0.662 0.418
Time-series sample (annual) 1977–2006 1977–2006 1977–2006 1977–2006 1977–2006 1977–2006
No. of cross-section countries 47 47 47 47 47 47
No. of observations3 672 665 672 665 672 672Sources: Bloomberg; Chinn and Ito (2006); Datastream; De Nicolò and others (2006); IMF, International Financial Statistics and World
Economic Outlook databases; Standard and Poor’s Emerging Markets Database; and World Federation of Exchanges.1In percent. Probability values are in square brackets (*** significant at 1 percent level; ** significant at 5 percent level; and * significant at
10 percent level). White-type cross-section standard errors and covariance with degree of freedom corrected for robust estimators.2Consists mainly of bank loans.3Total number of observations based on the unbalanced panel structure.
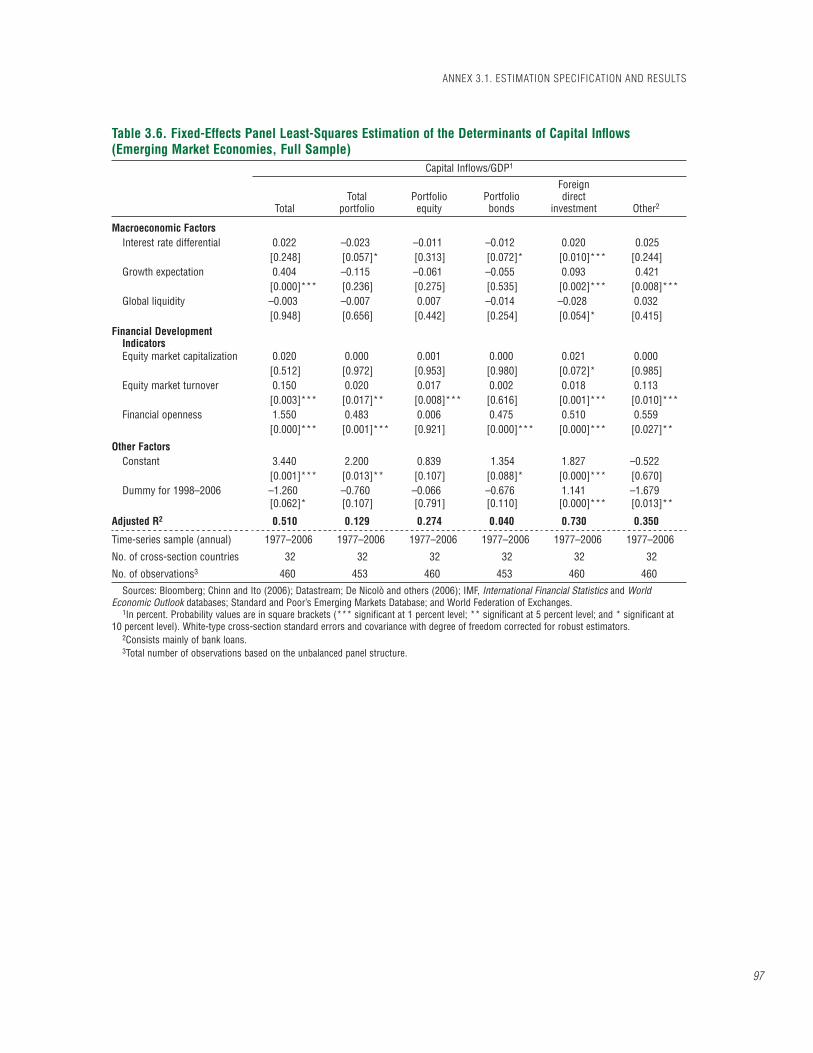
ANNEX 3.1. ESTIMATION SPECIFICATION AND RESULTS
97
Table 3.6. Fixed-Effects Panel Least-Squares Estimation of the Determinants of Capital Infl ows (Emerging Market Economies, Full Sample)
Capital Inflows/GDP1
TotalTotal
portfolioPortfolio
equityPortfoliobonds
Foreigndirect
investment Other2
Macroeconomic FactorsInterest rate differential 0.022 –0.023 –0.011 –0.012 0.020 0.025
[0.248] [0.057]* [0.313] [0.072]* [0.010]*** [0.244]Growth expectation 0.404 –0.115 –0.061 –0.055 0.093 0.421
[0.000]*** [0.236] [0.275] [0.535] [0.002]*** [0.008]***Global liquidity –0.003 –0.007 0.007 –0.014 –0.028 0.032
[0.948] [0.656] [0.442] [0.254] [0.054]* [0.415]Financial Development
IndicatorsEquity market capitalization 0.020 0.000 0.001 0.000 0.021 0.000
[0.512] [0.972] [0.953] [0.980] [0.072]* [0.985]Equity market turnover 0.150 0.020 0.017 0.002 0.018 0.113
[0.003]*** [0.017]** [0.008]*** [0.616] [0.001]*** [0.010]***Financial openness 1.550 0.483 0.006 0.475 0.510 0.559
[0.000]*** [0.001]*** [0.921] [0.000]*** [0.000]*** [0.027]**
Other FactorsConstant 3.440 2.200 0.839 1.354 1.827 –0.522
[0.001]*** [0.013]** [0.107] [0.088]* [0.000]*** [0.670]Dummy for 1998–2006 –1.260 –0.760 –0.066 –0.676 1.141 –1.679
[0.062]* [0.107] [0.791] [0.110] [0.000]*** [0.013]**
Adjusted R2 0.510 0.129 0.274 0.040 0.730 0.350
Time-series sample (annual) 1977–2006 1977–2006 1977–2006 1977–2006 1977–2006 1977–2006
No. of cross-section countries 32 32 32 32 32 32
No. of observations3 460 453 460 453 460 460
Sources: Bloomberg; Chinn and Ito (2006); Datastream; De Nicolò and others (2006); IMF, International Financial Statistics and World Economic Outlook databases; Standard and Poor’s Emerging Markets Database; and World Federation of Exchanges.
1In percent. Probability values are in square brackets (*** significant at 1 percent level; ** significant at 5 percent level; and * significant at 10 percent level). White-type cross-section standard errors and covariance with degree of freedom corrected for robust estimators.
2Consists mainly of bank loans.3Total number of observations based on the unbalanced panel structure.
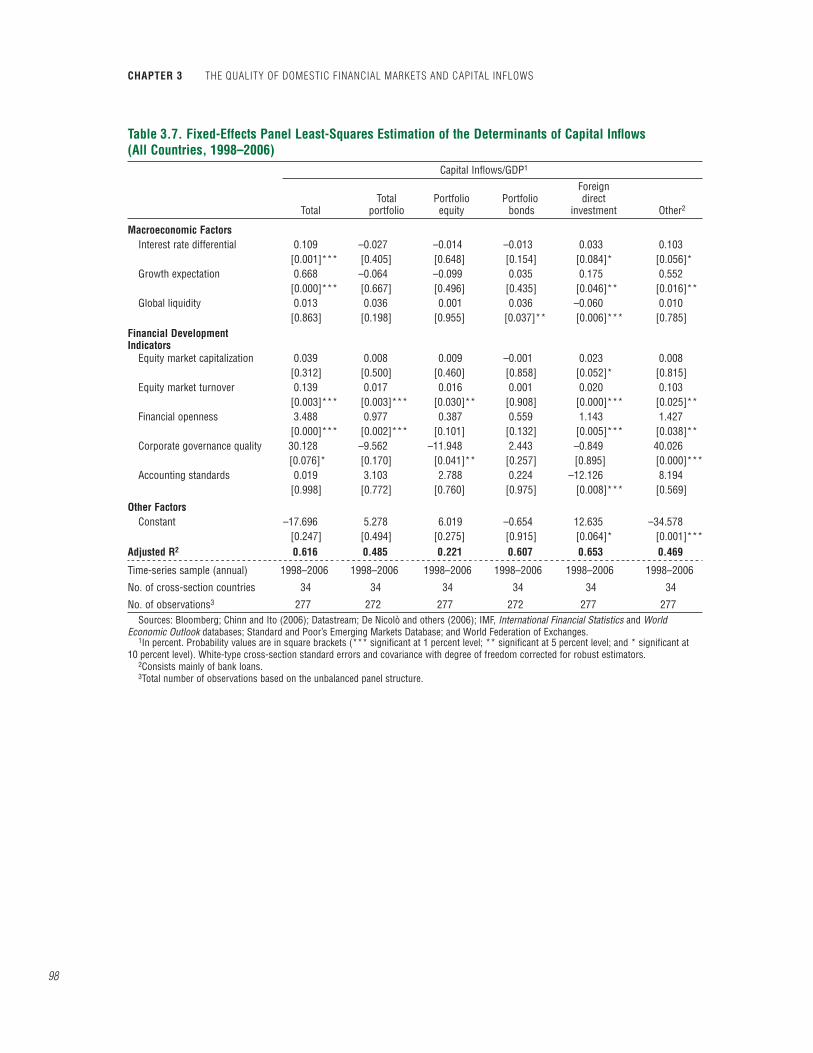
CHAPTER 3 THE QUALITY OF DOMESTIC FINANCIAL MARKETS AND CAPITAL INFLOWS
98
Table 3.7. Fixed-Effects Panel Least-Squares Estimation of the Determinants of Capital Infl ows (All Countries, 1998–2006)
Capital Infl ows/GDP1
TotalTotal
portfolioPortfolio
equityPortfolio bonds
Foreigndirect
investment Other2
Macroeconomic FactorsInterest rate differential 0.109 –0.027 –0.014 –0.013 0.033 0.103
[0.001]*** [0.405] [0.648] [0.154] [0.084]* [0.056]*Growth expectation 0.668 –0.064 –0.099 0.035 0.175 0.552
[0.000]*** [0.667] [0.496] [0.435] [0.046]** [0.016]**Global liquidity 0.013 0.036 0.001 0.036 –0.060 0.010
[0.863] [0.198] [0.955] [0.037]** [0.006]*** [0.785]Financial Development Indicators
Equity market capitalization 0.039 0.008 0.009 –0.001 0.023 0.008[0.312] [0.500] [0.460] [0.858] [0.052]* [0.815]
Equity market turnover 0.139 0.017 0.016 0.001 0.020 0.103[0.003]*** [0.003]*** [0.030]** [0.908] [0.000]*** [0.025]**
Financial openness 3.488 0.977 0.387 0.559 1.143 1.427[0.000]*** [0.002]*** [0.101] [0.132] [0.005]*** [0.038]**
Corporate governance quality 30.128 –9.562 –11.948 2.443 –0.849 40.026[0.076]* [0.170] [0.041]** [0.257] [0.895] [0.000]***
Accounting standards 0.019 3.103 2.788 0.224 –12.126 8.194[0.998] [0.772] [0.760] [0.975] [0.008]*** [0.569]
Other FactorsConstant –17.696 5.278 6.019 –0.654 12.635 –34.578
[0.247] [0.494] [0.275] [0.915] [0.064]* [0.001]***Adjusted R2 0.616 0.485 0.221 0.607 0.653 0.469
Time-series sample (annual) 1998–2006 1998–2006 1998–2006 1998–2006 1998–2006 1998–2006
No. of cross-section countries 34 34 34 34 34 34
No. of observations3 277 272 277 272 277 277Sources: Bloomberg; Chinn and Ito (2006); Datastream; De Nicolò and others (2006); IMF, International Financial Statistics and World
Economic Outlook databases; Standard and Poor’s Emerging Markets Database; and World Federation of Exchanges.1In percent. Probability values are in square brackets (*** significant at 1 percent level; ** significant at 5 percent level; and * significant at
10 percent level). White-type cross-section standard errors and covariance with degree of freedom corrected for robust estimators.2Consists mainly of bank loans.3Total number of observations based on the unbalanced panel structure.
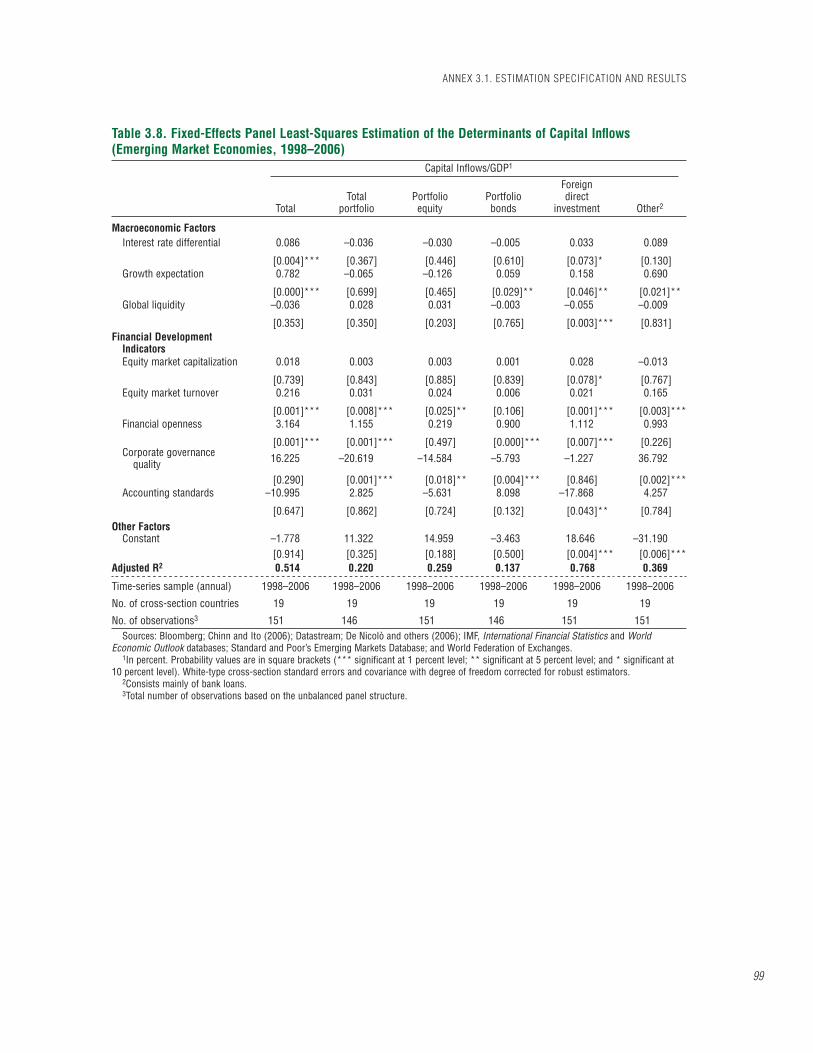
ANNEX 3.1. ESTIMATION SPECIFICATION AND RESULTS
99
Table 3.8. Fixed-Effects Panel Least-Squares Estimation of the Determinants of Capital Infl ows (Emerging Market Economies, 1998–2006)
Capital Inflows/GDP1
TotalTotal
portfolioPortfolio
equityPortfoliobonds
Foreigndirect
investment Other2
Macroeconomic FactorsInterest rate differential 0.086 –0.036 –0.030 –0.005 0.033 0.089
[0.004]*** [0.367] [0.446] [0.610] [0.073]* [0.130]Growth expectation 0.782 –0.065 –0.126 0.059 0.158 0.690
[0.000]*** [0.699] [0.465] [0.029]** [0.046]** [0.021]**Global liquidity –0.036 0.028 0.031 –0.003 –0.055 –0.009
[0.353] [0.350] [0.203] [0.765] [0.003]*** [0.831]Financial Development
IndicatorsEquity market capitalization 0.018 0.003 0.003 0.001 0.028 –0.013
[0.739] [0.843] [0.885] [0.839] [0.078]* [0.767]Equity market turnover 0.216 0.031 0.024 0.006 0.021 0.165
[0.001]*** [0.008]*** [0.025]** [0.106] [0.001]*** [0.003]***Financial openness 3.164 1.155 0.219 0.900 1.112 0.993
[0.001]*** [0.001]*** [0.497] [0.000]*** [0.007]*** [0.226]Corporate governance
quality 16.225 –20.619 –14.584 –5.793 –1.227 36.792
[0.290] [0.001]*** [0.018]** [0.004]*** [0.846] [0.002]***Accounting standards –10.995 2.825 –5.631 8.098 –17.868 4.257
[0.647] [0.862] [0.724] [0.132] [0.043]** [0.784]Other Factors
Constant –1.778 11.322 14.959 –3.463 18.646 –31.190[0.914] [0.325] [0.188] [0.500] [0.004]*** [0.006]***
Adjusted R2 0.514 0.220 0.259 0.137 0.768 0.369
Time-series sample (annual) 1998–2006 1998–2006 1998–2006 1998–2006 1998–2006 1998–2006
No. of cross-section countries 19 19 19 19 19 19
No. of observations3 151 146 151 146 151 151Sources: Bloomberg; Chinn and Ito (2006); Datastream; De Nicolò and others (2006); IMF, International Financial Statistics and World
Economic Outlook databases; Standard and Poor’s Emerging Markets Database; and World Federation of Exchanges.1In percent. Probability values are in square brackets (*** significant at 1 percent level; ** significant at 5 percent level; and * significant at
10 percent level). White-type cross-section standard errors and covariance with degree of freedom corrected for robust estimators.2Consists mainly of bank loans.3Total number of observations based on the unbalanced panel structure.

CHAPTER 3 THE QUALITY OF DOMESTIC FINANCIAL MARKETS AND CAPITAL INFLOWS
100
Anne
x 3.
2. E
xper
ienc
es w
ith R
ecen
t Cap
ital I
nfl o
ws:
Bra
zil,
Indi
a, R
oman
ia, S
outh
Afri
ca, a
nd V
ietn
am
Coun
try
Type
of R
ecen
t Infl
ow
s;
Polic
y Fr
amew
ork
and
Fina
ncia
l Sys
tem
Chal
leng
es A
ssoc
iate
d w
ith In
fl ow
s
Polic
ies
Adop
ted
by th
e Au
thor
ities
Mac
roec
onom
icFi
nanc
ial
Braz
ilCa
pita
l infl
ow
s ex
ceed
ed $
40 b
illio
n du
ring
the
four
qu
arte
rs th
roug
h M
arch
200
7, c
ompa
red
with
neg
ativ
e in
fl ow
s (i.
e., n
et re
paym
ents
of l
iabi
litie
s) a
nd o
utw
ard
inve
stm
ent b
y Br
azili
an fi
rms
durin
g pr
evio
us q
uarte
rs. I
n ad
ditio
n to
con
tinue
d st
rong
FDI
infl o
ws,
reco
rd le
vels
of
portf
olio
infl o
ws–
–in
both
equ
ity a
nd d
ebt–
–are
exp
ecte
d in
200
7. F
orei
gn in
vest
ors
purc
hase
d ab
out t
wo-
third
s of
Br
azili
an e
quity
initi
al p
ublic
offe
rings
in 2
006
and
this
tren
d is
exp
ecte
d to
con
tinue
. Sho
rt-te
rm in
fl ow
s ha
ve s
urge
d as
do
uble
-dig
it no
min
al in
tere
st ra
tes
and
stro
ng e
cono
mic
fu
ndam
enta
ls m
ake
Braz
il an
attr
activ
e ca
rry-
trade
des
tinat
ion.
Both
exc
hang
e ra
te a
nd c
apita
l acc
ount
regu
latio
ns h
ave
been
libe
raliz
ed g
radu
ally
sin
ce th
e ea
rly 1
990s
. How
ever
, th
is p
roce
ss h
as o
ften
not b
een
follo
wed
by
com
plem
enta
ry
chan
ges
in th
e ov
eral
l leg
isla
tion,
whi
ch re
mai
ns c
ompl
ex a
nd
ambi
guou
s. F
or in
stan
ce, t
he g
over
nmen
t stil
l can
rein
trodu
ce
cont
rols
on
fore
ign
exch
ange
out
fl ow
s—re
gist
ratio
n re
quire
men
ts a
nd ta
x le
gisl
atio
n al
low
for d
iscr
etio
nary
co
ntro
l ove
r cro
ss-b
orde
r fi n
anci
al fl
ows.
Com
pare
d w
ith o
ther
em
ergi
ng m
arke
ts, t
he fi
nanc
ial
syst
em is
div
ersi
fi ed
and
one
of th
e la
rges
t, w
ith a
so
phis
ticat
ed d
eriv
ativ
es m
arke
t. It
is w
ell r
egul
ated
and
su
perv
ised
, and
, ow
ing
to re
stru
ctur
ing,
has
bec
ome
mor
e st
ream
lined
and
effi
cien
t. In
stitu
tiona
lly, t
he fi
nanc
ial s
ecto
r, do
min
ated
by
bank
s, is
con
cent
rate
d: a
t end
-200
6, th
e 10
la
rges
t ban
ks a
ccou
nted
for 7
2 pe
rcen
t of t
he b
anki
ng s
ecto
r’s
asse
ts. T
he n
onba
nk fi
nanc
ial s
ecto
r has
gro
wn
rapi
dly,
from
a
rela
tivel
y lo
w b
ase.
Ass
ets
man
aged
by
inve
stm
ent f
unds
, in
parti
cula
r, ha
ve in
crea
sed
shar
ply,
from
22
perc
ent o
f GDP
in
2002
to 3
4 pe
rcen
t in
2006
. Act
ivity
on
the
stoc
k m
arke
t has
al
so in
crea
sed,
but
man
y la
rge
com
pani
es s
till p
refe
r to
list i
n Ne
w Y
ork.
The
real
app
reci
ated
by
5¼ p
erce
nt in
nom
inal
ef
fect
ive
term
s in
the
fi rst
four
m
onth
s of
200
7—m
ore
than
m
ost o
ther
em
ergi
ng m
arke
t cu
rren
cies
. In
real
effe
ctiv
e te
rms,
it h
as a
ppre
ciat
ed
by n
early
40
perc
ent s
ince
20
04. N
otw
ithst
andi
ng
the
appr
ecia
ting
curr
ency
, fo
llow
ing
lack
lust
er
perf
orm
ance
last
yea
r, ex
port
volu
me
grow
th h
as p
icke
d up
in re
cent
mon
ths,
but
co
mpe
titiv
enes
s co
uld
still
be
adve
rsel
y af
fect
ed.
Yiel
ds c
ontin
ue to
attr
act
fore
ign
inve
stor
s, fo
ster
ing
appr
ecia
tion
pres
sure
s on
th
e re
al.
Ster
ilizin
g w
ith th
e sa
le o
f re
al g
over
nmen
t sec
uriti
es
coul
d ra
ise
the
natio
nal d
ebt
thro
ugh
high
er in
tere
st c
osts
.
Ther
e ar
e ris
ks o
f a ra
pid
re-
vers
al o
f por
tfolio
infl o
ws
shou
ld
inte
rnat
iona
l ris
k ap
petit
e ch
ange
ab
rupt
ly.
The
exch
ange
rate
regi
me
is a
n in
depe
nden
t fl o
at, b
ut th
e au
thor
ities
ha
ve in
terv
ened
hea
vily
ove
r the
pas
t few
m
onth
s in
the
spot
and
forw
ard
mar
kets
.
Polic
y in
tere
st ra
tes
have
bee
n cu
t si
gnifi
cant
ly (b
y a
cum
ulat
ive
825
basi
s po
ints
sin
ce S
epte
mbe
r 200
5).
A si
gnifi
cant
num
ber o
f ref
orm
s,
unde
rtake
n es
peci
ally
sin
ce th
e cr
ises
of
the
1990
s, h
ave
stre
ngth
ened
th
e fi n
anci
al s
ecto
r’s p
rude
ntia
l and
re
gula
tory
fram
ewor
k. T
he a
utho
ritie
s un
derta
ke s
tress
test
s on
exc
hang
e,
cred
it, a
nd in
tere
st-r
ate
risk
on a
regu
lar
basi
s. Prud
entia
l req
uire
men
ts fo
r ban
k tra
nsac
tions
in fo
reig
n cu
rren
cy w
ere
tight
ened
in J
une
2007
.
Regu
lato
ry re
stric
tions
on
resi
dent
s’
capi
tal o
utfl o
ws
wer
e lo
osen
ed b
y al
low
ing
mut
ual f
unds
and
oth
er
inve
stm
ent f
unds
to in
vest
abr
oad
up to
20
and
10
perc
ent o
f ass
ets,
resp
ectiv
ely.
In e
arly
200
7, ta
riffs
wer
e ra
ised
on
sele
cted
impo
rts to
the
max
imum
allo
wed
un
der W
orld
Tra
de O
rgan
izatio
n ru
les.
Fu
rther
mor
e, s
ubsi
dize
d cr
edit
lines
an
d ta
x cr
edits
hav
e be
en e
xten
ded
to
expo
rters
in tr
aditi
onal
sec
tors
affe
cted
by
the
appr
ecia
tion
of th
e cu
rren
cy, a
lthou
gh
thes
e in
cent
ives
rem
ain
smal
l in
scal
e.

101
Indi
aCa
pita
l infl
ow
s ha
ve s
urge
d in
rece
nt y
ears
to a
lmos
t 5
perc
ent o
f GDP
. In
2006
–07
capi
tal i
nfl o
ws
incl
uded
loan
s,
portf
olio
bon
ds, a
nd F
DI, n
otw
ithst
andi
ng th
e co
ncom
itant
pi
ckup
in o
utw
ard
inve
stm
ent b
y In
dian
cor
pora
tes.
Infl o
ws
have
als
o re
fl ect
ed a
n in
crea
se in
cro
ss-b
orde
r hed
ging
tra
nsac
tions
. Por
tfolio
equ
ity in
fl ow
s ha
ve p
icke
d up
mor
e re
cent
ly, in
par
t refl
ect
ing
larg
e in
itial
pub
lic o
fferin
gs in
the
fi rst
qua
rter o
f 200
7.
Alth
ough
gro
ss F
DI in
fl ow
s ar
e po
ised
to e
xcee
d po
rtfol
io
infl o
ws
in 2
007
for t
he fi
rst t
ime,
they
rem
ain
low
rela
tive
to
man
y ot
her e
mer
ging
mar
ket e
cono
mie
s (P
oirs
on, 2
007)
. W
hile
the
equi
ty m
arke
t has
dee
pene
d, in
clud
ing
fore
ign
parti
cipa
tion
of m
ore
than
20
perc
ent o
f tot
al tr
adin
g, s
ome
segm
ents
of o
ther
mar
kets
, suc
h as
the
mon
ey a
nd c
orpo
rate
se
curit
ies
mar
kets
, are
illiq
uid.
Rec
ent p
rogr
ess
in p
ensi
on
refo
rm is
a s
tep
tow
ard
deep
enin
g ca
pita
l mar
kets
and
br
oade
ning
the
inst
itutio
nal i
nves
tor b
ase.
Liqu
idity
con
ditio
ns
rem
ain
loos
e, a
lthou
gh
som
e tig
hten
ing
is e
xpec
ted
follo
win
g th
e lif
ting
of th
e ce
iling
on
abso
rptio
n un
der
the
reve
rse
repo
win
dow
, ex
pect
ed to
kee
p th
e in
terb
ank
over
nigh
t rat
e hi
gher
than
its
rece
nt lo
ws.
The
rupe
e ha
s ap
prec
iate
d ra
pidl
y, a
lthou
gh c
ompe
titiv
e-ne
ss d
oes
not s
eem
to b
e a
prob
lem
to d
ate.
Sus
tain
ed
com
petit
iven
ess,
how
ever
, w
ill re
quire
enh
ance
d in
frast
ruct
ure,
low
er im
port
tarif
fs, a
nd a
n im
prov
ed
busi
ness
clim
ate
(Pur
fi eld
, 20
06).
Rapi
d cr
edit
grow
th p
oses
co
ncer
ns re
gard
ing
cred
it qu
ality
in
som
e ba
nks,
alth
ough
the
bank
ing
sect
or a
s a
who
le re
mai
ns
heal
thy.
Ther
e is
a p
oten
tial c
redi
t or
fore
ign
exch
ange
risk
ass
ocia
ted
with
rapi
dly
risin
g co
rpor
ate
cred
it fro
m a
broa
d an
d un
certa
intie
s ov
er th
e de
gree
of h
edgi
ng,
alth
ough
the
liqui
dity
/leve
rage
ra
tios
rem
ain
com
forta
ble.
Grad
ually
tigh
tene
d m
onet
ary
polic
y by
ra
isin
g th
e ke
y po
licy
rate
s se
vera
l tim
es
sinc
e Se
ptem
ber 2
004.
The
Rese
rve
Bank
of I
ndia
is re
porte
d to
hav
e in
terv
ened
in th
e fo
reig
n ex
chan
ge m
arke
t to
slow
the
pace
of
rupe
e ap
prec
iatio
n ev
ery
mon
th s
ince
No
vem
ber 2
006,
thus
par
tially
inte
rfer
ing
with
ste
riliza
tion.
Rece
ntly,
con
duct
ed a
ser
ies
of
incr
ease
s in
the
rese
rve
requ
irem
ent r
atio
by
a to
tal o
f 1 p
erce
nt in
four
con
secu
tive
mon
ths
aim
ed a
t abs
orbi
ng e
xces
s liq
uidi
ty in
the
syst
em.
Rais
ed th
e ce
iling
for i
ssua
nce
of
mar
ket s
teril
izatio
n bo
nds.
Rais
ed g
ener
al p
rovi
sion
ing
requ
irem
ents
and
boo
sted
risk
wei
ghts
on
high
-gro
wth
are
as, s
uch
as re
al e
stat
e, to
ab
ove
Base
l nor
ms
to c
onta
in ra
pid
cred
it gr
owth
.
Grad
ual l
iber
aliza
tion
of c
apita
l fl o
ws
cont
inue
s. A
lthou
gh th
ere
are
cont
rols
, in
clud
ing
proc
edur
al h
urdl
es a
nd a
ppro
val
requ
irem
ents
, rec
ent r
efor
ms
incl
ude
liber
aliza
tion
of o
vers
eas
inve
stm
ents
/FDI
in
som
e se
ctor
s an
d re
laxa
tion
of c
ontro
ls
on e
xter
nal c
omm
erci
al b
orro
win
g. A
ro
adm
ap to
cap
ital a
ccou
nt c
onve
rtibi
lity
(the
Tara
pore
repo
rt), p
rodu
ced
by a
co
mm
ittee
of e
xter
nal e
xper
ts e
stab
lishe
d by
the
Res
erve
Ban
k of
Indi
a, p
rese
nts
a hi
erar
chy
of p
refe
renc
es fo
r lib
eral
izing
ca
pita
l infl
ow
s; ru
pee-
deno
min
ated
de
bt in
pre
fere
nce
to fo
reig
n cu
rren
cy
debt
; med
ium
- and
long
-term
deb
t to
shor
t-ter
m d
ebt;
and
dire
ct in
vest
men
t to
portf
olio
fl ow
s.
The
Rese
rve
Bank
of I
ndia
has
initi
ated
ba
nkin
g re
form
s ai
med
at i
ncre
asin
g pu
blic
sec
tor b
anks
’ aut
onom
y an
d ex
pand
ing
fore
ign
bank
s’ p
rese
nce
by
allo
win
g fo
reig
n ba
nks
sinc
e 20
05 to
es
tabl
ish
subs
idia
ries
(they
cur
rent
ly
acco
unt f
or a
bout
7 p
erce
nt o
f tot
al
asse
ts o
f the
ban
king
sys
tem
).
ANNEX 3.2. EXPERIENCES WITH RECENT CAPITAL INFLOWS: BRAZIL, INDIA, ROMANIA, SOUTH AFRICA, AND VIETNAM

CHAPTER 3 THE QUALITY OF DOMESTIC FINANCIAL MARKETS AND CAPITAL INFLOWS
102
Anne
x 3.
2 (c
ontin
ued)
Coun
try
Type
of R
ecen
t Infl
ow
s;
Polic
y Fr
amew
ork
and
Fina
ncia
l Sys
tem
Chal
leng
es A
ssoc
iate
d w
ith In
fl ow
s
Polic
ies
Adop
ted
by th
e Au
thor
ities
Mac
roec
onom
icFi
nanc
ial
Rom
ania
Stro
ng c
apita
l infl
ow
s ha
ve fi
nanc
ed a
wid
enin
g cu
rren
t ac
coun
t defi
cit
and
have
led
to m
arke
d ap
prec
iatio
n of
the
leu,
ra
isin
g co
ncer
ns a
bout
the
pote
ntia
l los
s of
com
petit
iven
ess.
Ca
pita
l infl
ow
s ha
ve in
crea
sed
mar
kedl
y si
nce
2004
with
the
open
ing
of th
e ca
pita
l acc
ount
and
with
pro
spec
ts o
f Eur
opea
n Un
ion
mem
bers
hip.
Non
debt
-cre
atin
g in
fl ow
s ar
e es
timat
ed
to h
ave
cove
red
91 p
erce
nt o
f the
cur
rent
acc
ount
defi
cit
in
2006
, alth
ough
this
cov
erag
e is
exp
ecte
d to
be
low
er in
200
7 as
priv
atiza
tion
infl o
ws
are
expe
cted
to d
eclin
e.
In th
e ab
senc
e of
wel
l-dev
elop
ed c
apita
l mar
kets
, cap
ital
infl o
ws
have
bee
n ch
anne
led
pred
omin
antly
thro
ugh
the
bank
ing
syst
em. H
igh
spre
ads
betw
een
dom
estic
and
fo
reig
n in
tere
st ra
tes
elic
ited
rapi
d cr
edit
grow
th, i
ncre
asin
g vu
lner
abili
ties
in th
e ba
nkin
g se
ctor
thro
ugh
indi
rect
fore
ign
exch
ange
risk
and
a p
oten
tially
det
erio
ratin
g lo
an p
ortfo
lio.
Priv
ate
sect
or e
xter
nal b
orro
win
g in
crea
sed
by 2
8 pe
rcen
t fro
m 2
005
to 2
006,
reac
hing
11
perc
ent o
f GDP
.
Wid
enin
g cu
rren
t acc
ount
de
fi cit
driv
en b
y do
mes
tic
dem
and.
Gove
rnm
ent’s
bud
get
unde
r pre
ssur
e (p
ress
ing
expe
nditu
re n
eeds
, wag
e in
crea
ses
in th
e pu
blic
sec
tor,
low
reve
nue
ratio
, rec
ently
ap
prov
ed s
harp
pen
sion
in
crea
ses)
, whi
ch m
ay a
dd to
th
e ec
onom
y ov
erhe
atin
g.
Mon
etar
y po
licy
face
s a
dile
mm
a as
tigh
teni
ng w
ould
fo
ster
new
cap
ital i
nfl o
ws
and
exch
ange
rate
app
reci
atio
n,
thus
rais
ing
conc
erns
abo
ut
exte
rnal
com
petit
iven
ess.
Over
heat
ing
hous
ing
mar
ket;
asse
t pric
e in
crea
ses.
Fina
ncia
l sou
ndne
ss in
dica
tors
su
gges
t tha
t the
ban
king
sec
tor
enjo
ys a
dequ
ate
capi
tal a
nd
liqui
dity
buf
fers
.
Sign
ifi ca
nt b
ank
expo
sure
to
indi
rect
fore
ign
exch
ange
risk
(u
nhed
ged
cons
umer
lend
ing
is
repo
rted
to b
e on
e of
the
high
est
in th
e re
gion
).
Cred
it ris
k m
ay b
e a
conc
ern.
In
crea
sing
com
petit
ion
may
ha
ve le
d ba
nks
to ta
rget
less
cr
editw
orth
y cu
stom
ers.
De
spite
the
favo
rabl
e op
erat
ing
envi
ronm
ent,
the
nonp
erfo
rmin
g lo
an ra
tio h
as re
mai
ned
broa
dly
unch
ange
d (8
per
cent
on
a gr
oss
basi
s, in
clud
ing
loss
, do
ubtfu
l, an
d su
bsta
ndar
d;
mor
eove
r, cl
assi
fi cat
ion
crite
ria
and
prov
isio
ning
requ
irem
ents
ar
e co
nser
vativ
e). T
he lo
an-lo
ss
prov
isio
n co
vera
ge ra
tio is
low
du
e to
the
use
of c
olla
tera
l as
a m
itiga
ting
fact
or, b
ut c
olla
tera
l re
cove
ry m
ay p
rove
diffi
cul
t dur
ing
times
of s
tress
.
Vuln
erab
le to
wor
ld in
tere
st ra
te
mov
emen
ts a
nd s
hifts
in g
loba
l ris
k ap
petit
e.
Infl a
tion
targ
etin
g w
as in
trodu
ced
in
2005
afte
r abo
lishi
ng re
stric
tions
on
shor
t-ter
m c
apita
l infl
ow
s; th
e m
onet
ary
auth
ority
is s
till i
n th
e pr
oces
s of
es
tabl
ishi
ng it
s pr
iorit
izatio
n of
infl a
tion
targ
etin
g ov
er e
xcha
nge
rate
pol
icy,
in
the
eyes
of fi
nan
cial
mar
kets
.
Seve
ral c
hang
es to
the
leve
l and
bas
e of
ban
ks’ r
eser
ve re
quire
men
ts w
ere
impl
emen
ted
to e
ncou
rage
a s
witc
h aw
ay fr
om fo
reig
n cu
rren
cy le
ndin
g (c
urre
ntly,
rese
rve
requ
irem
ents
are
40
and
20 p
erce
nt o
n fo
reig
n cu
rren
cy a
nd
dom
estic
liab
ilitie
s, re
spec
tivel
y).
Lim
its to
hou
seho
ld le
ndin
g w
ere
tight
ened
, with
a d
ebt-s
ervi
ce c
eilin
g re
latin
g to
the
net m
onth
ly in
com
e of
the
borr
ower
(Aug
ust 2
005)
, but
elim
inat
ed
in M
arch
200
7. A
requ
irem
ent f
or a
25
perc
ent d
own
paym
ent f
or m
ortg
age
loan
s w
as a
lso
elim
inat
ed.
A lim
it w
as in
trodu
ced
to b
anks
’ un
hedg
ed fo
reig
n cu
rren
cy le
ndin
g to
thre
e tim
es th
eir o
wn
capi
tal.
This
lim
it, e
stab
lishe
d in
Sep
tem
ber 2
005,
w
as re
mov
ed a
t the
beg
inni
ng o
f 200
7 be
caus
e it
lost
effe
ctiv
enes
s. T
he li
mit
had
a sh
ort-t
erm
impa
ct o
f an
incr
ease
d de
man
d fo
r leu
loan
s.
In 2
005,
ban
ks w
ere
requ
ired
to
clas
sify
unh
edge
d fo
reig
n cu
rren
cy
lend
ing
as “
wat
ch”
rega
rdle
ss o
f the
lo
ans’
repa
ymen
t per
form
ance
.
Cros
s-co
untr
y co
oper
atio
n ha
s be
en
enha
nced
(mem
oran
da o
f und
erst
andi
ng
have
bee
n si
gned
with
fore
ign
regu
lato
ry
and
supe
rvis
ory
auth
oriti
es o
f cou
ntrie
s w
ith a
ban
k pr
esen
ce in
Rom
ania
).

103
Sout
hAf
rica
In re
cent
yea
rs, S
outh
Afri
ca re
ceiv
ed s
igni
fi can
t am
ount
s of
net
cap
ital i
nfl o
ws—
prim
arily
por
tfolio
—tu
rnin
g fro
m
nega
tive
leve
ls in
200
1 to
ove
r 8 p
erce
nt o
f GDP
in 2
006,
of
whi
ch p
ortfo
lio e
quity
inve
stm
ent a
ccou
nted
for a
lmos
t 5
perc
ent o
f GDP
.
Sinc
e 19
95, e
xcha
nge
cont
rols
on
nonr
esid
ents
hav
e be
en
elim
inat
ed a
nd c
apita
l tra
nsac
tions
by
resi
dent
s ha
ve b
een
rela
xed,
with
the
mai
n re
mai
ning
rest
rictio
ns o
n th
e la
tter
com
pris
ing
certa
in c
ontro
ls o
n FD
I, ce
iling
s on
por
tfolio
ou
tfl ow
s fo
r ins
titut
iona
l inv
esto
rs, a
pro
hibi
tion
of p
ortfo
lio
outfl
ows
by c
orpo
ratio
ns, a
nd c
eilin
gs o
n in
divi
dual
s’ o
ffsho
re
inve
stm
ents
. The
ban
king
sys
tem
is d
eep,
and
the
insu
ranc
e se
ctor
has
the
high
est p
enet
ratio
n (in
term
s of
pre
mia
to G
DP)
amon
g em
ergi
ng m
arke
ts, c
lose
to th
e UK
leve
l. Th
e ba
nkin
g se
ctor
is a
dequ
atel
y ca
pita
lized
and
pro
fi tab
le, w
ith h
igh
asse
t gro
wth
and
low
leve
ls o
f non
perf
orm
ing
asse
ts. L
ocal
ca
pita
l mar
kets
, inc
ludi
ng d
eriv
ativ
es, a
re w
ell d
evel
oped
, and
se
curit
izatio
n is
gro
win
g ra
pidl
y, a
lbei
t fro
m a
low
bas
e.
Desp
ite s
trong
fu
ndam
enta
ls, i
nclu
ding
low
ex
tern
al d
ebt a
nd a
sol
id
fi nan
cial
sys
tem
, the
ext
erna
l cu
rren
t acc
ount
defi
cit
has
been
wid
enin
g in
the
last
fe
w y
ears
, lar
gely
refl e
ctin
g st
rong
dom
estic
dem
and.
It
reac
hed
6.5
perc
ent o
f GDP
in
200
6 an
d is
pro
ject
ed to
re
mai
n at
that
leve
l in
2007
an
d to
dec
line
grad
ually
in
subs
eque
nt y
ears
.
Desp
ite s
trong
m
acro
econ
omic
per
form
ance
, vu
lner
abili
ties
exis
t, as
ev
iden
ced
by th
e Fe
brua
ry/
Mar
ch 2
007
and
May
/Jun
e 20
06 tu
rbul
ence
whe
n th
e ra
nd w
as o
ne o
f the
mos
t af
fect
ed e
mer
ging
mar
ket
curr
enci
es. I
nfl o
ws
of c
apita
l, ho
wev
er, d
id n
ot a
ppea
r to
be s
igni
fi can
tly a
ffect
ed. T
he
offi c
ial “
grow
th d
iagn
ostic
s”
exer
cise
car
ried
out b
y th
e go
vern
men
t lis
ts e
xcha
nge
rate
vol
atili
ty a
s a
cons
train
t on
eco
nom
ic g
row
th in
So
uth
Afric
a. H
owev
er, t
he
offi c
ial p
ositi
on o
n th
is m
atte
r is
to re
duce
vol
atili
ty b
y st
reng
then
ing
inte
rnat
iona
l re
serv
es a
nd c
ontin
uing
to
purs
ue s
ound
mac
roec
onom
ic
polic
ies.
Whi
le h
ouse
hold
sec
tor d
ebt
rose
mar
kedl
y, h
ouse
hold
deb
t se
rvic
e re
mai
ns m
oder
ate
at a
bout
9
perc
ent o
f dis
posa
ble
inco
me
as
of M
arch
200
7, a
lthou
gh p
oten
tial
pock
ets
of w
eakn
ess
mig
ht b
e hi
dden
in th
ese
aver
age
fi gur
es.
Nonp
erfo
rmin
g lo
an ra
tes
are
low
at
pre
sent
.
Vuln
erab
le to
wor
ld in
tere
st
rate
mov
emen
ts a
nd s
hifts
in
glob
al ri
sk a
ppet
ite. V
ulne
rabl
e to
co
mm
odity
pric
e de
clin
es.
The
fi sca
l pos
ition
is s
trong
, whi
ch
help
s to
stre
ngth
en th
e co
untr
y’s
resi
lienc
e to
sho
cks
and
sudd
en
stop
s, a
nd s
uppo
rts fi
nanc
ial m
arke
t co
nfi d
ence
.
Mon
etar
y po
licy
tight
ened
in la
te 2
006
an
d ag
ain
in m
id-2
007,
in re
spon
se to
a
dete
riora
tion
of th
e in
fl atio
n ou
tlook
.
Lim
its o
n ou
twar
d FD
I hav
e be
en
rela
xed
in re
cent
yea
rs. T
he a
utho
ritie
s’
stra
tegy
is to
mov
e aw
ay fr
om o
utw
ard
exch
ange
con
trols
tow
ard
a sy
stem
of
prud
entia
l reg
ulat
ions
for i
nstit
utio
nal
inve
stor
s.
ANNEX 3.2. EXPERIENCES WITH RECENT CAPITAL INFLOWS: BRAZIL, INDIA, ROMANIA, SOUTH AFRICA, AND VIETNAM
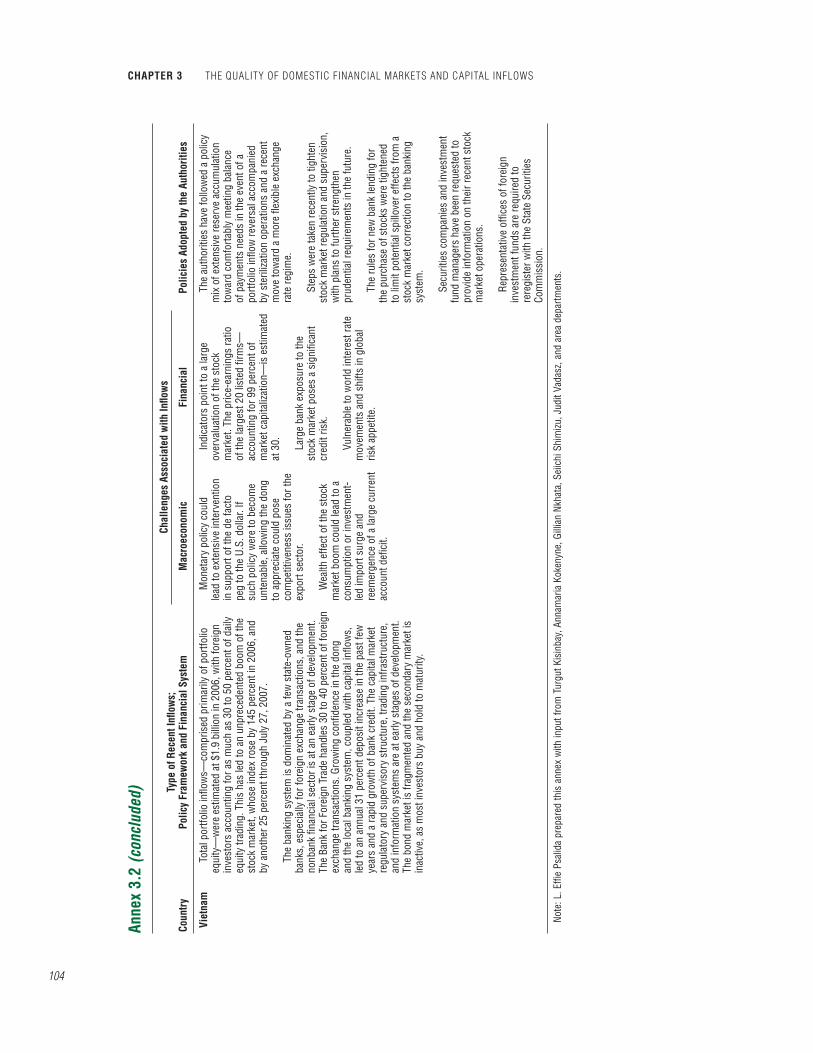
CHAPTER 3 THE QUALITY OF DOMESTIC FINANCIAL MARKETS AND CAPITAL INFLOWS
104
Anne
x 3.
2 (c
oncl
uded
)
Coun
try
Type
of R
ecen
t Infl
ow
s;
Polic
y Fr
amew
ork
and
Fina
ncia
l Sys
tem
Chal
leng
es A
ssoc
iate
d w
ith In
fl ow
s
Polic
ies
Adop
ted
by th
e Au
thor
ities
Mac
roec
onom
icFi
nanc
ial
Viet
nam
Tota
l por
tfolio
infl o
ws—
com
pris
ed p
rimar
ily o
f por
tfolio
eq
uity
—w
ere
estim
ated
at $
1.9
billi
on in
200
6, w
ith fo
reig
n in
vest
ors
acco
untin
g fo
r as
muc
h as
30
to 5
0 pe
rcen
t of d
aily
eq
uity
trad
ing.
Thi
s ha
s le
d to
an
unpr
eced
ente
d bo
om o
f the
st
ock
mar
ket,
who
se in
dex
rose
by
145
perc
ent i
n 20
06, a
nd
by a
noth
er 2
5 pe
rcen
t thr
ough
Jul
y 27
, 200
7.
The
bank
ing
syst
em is
dom
inat
ed b
y a
few
sta
te-o
wne
d ba
nks,
esp
ecia
lly fo
r for
eign
exc
hang
e tra
nsac
tions
, and
the
nonb
ank
fi nan
cial
sec
tor i
s at
an
early
sta
ge o
f dev
elop
men
t. Th
e Ba
nk fo
r For
eign
Tra
de h
andl
es 3
0 to
40
perc
ent o
f for
eign
ex
chan
ge tr
ansa
ctio
ns. G
row
ing
confi
den
ce in
the
dong
an
d th
e lo
cal b
anki
ng s
yste
m, c
oupl
ed w
ith c
apita
l infl
ow
s,
led
to a
n an
nual
31
perc
ent d
epos
it in
crea
se in
the
past
few
ye
ars
and
a ra
pid
grow
th o
f ban
k cr
edit.
The
cap
ital m
arke
t re
gula
tory
and
sup
ervi
sory
stru
ctur
e, tr
adin
g in
frast
ruct
ure,
an
d in
form
atio
n sy
stem
s ar
e at
ear
ly s
tage
s of
dev
elop
men
t. Th
e bo
nd m
arke
t is
fragm
ente
d an
d th
e se
cond
ary
mar
ket i
s in
activ
e, a
s m
ost i
nves
tors
buy
and
hol
d to
mat
urity
.
Mon
etar
y po
licy
coul
d le
ad to
ext
ensi
ve in
terv
entio
n in
sup
port
of th
e de
fact
o pe
g to
the
U.S.
dol
lar.
If su
ch p
olic
y w
ere
to b
ecom
e un
tena
ble,
allo
win
g th
e do
ng
to a
ppre
ciat
e co
uld
pose
co
mpe
titiv
enes
s is
sues
for t
he
expo
rt se
ctor
.
Wea
lth e
ffect
of t
he s
tock
m
arke
t boo
m c
ould
lead
to a
co
nsum
ptio
n or
inve
stm
ent-
led
impo
rt su
rge
and
reem
erge
nce
of a
larg
e cu
rren
t ac
coun
t defi
cit.
Indi
cato
rs p
oint
to a
larg
e ov
erva
luat
ion
of th
e st
ock
mar
ket.
The
pric
e-ea
rnin
gs ra
tio
of th
e la
rges
t 20
liste
d fi r
ms—
acco
untin
g fo
r 99
perc
ent o
f m
arke
t cap
italiz
atio
n—is
est
imat
ed
at 3
0. Larg
e ba
nk e
xpos
ure
to th
e st
ock
mar
ket p
oses
a s
igni
fi can
t cr
edit
risk.
Vuln
erab
le to
wor
ld in
tere
st ra
te
mov
emen
ts a
nd s
hifts
in g
loba
l ris
k ap
petit
e.
The
auth
oriti
es h
ave
follo
wed
a p
olic
y m
ix o
f ext
ensi
ve re
serv
e ac
cum
ulat
ion
tow
ard
com
forta
bly
mee
ting
bala
nce
of p
aym
ents
nee
ds in
the
even
t of a
po
rtfol
io in
fl ow
reve
rsal
acc
ompa
nied
by
ste
riliza
tion
oper
atio
ns a
nd a
rece
nt
mov
e to
war
d a
mor
e fl e
xibl
e ex
chan
ge
rate
regi
me.
Step
s w
ere
take
n re
cent
ly to
tigh
ten
stoc
k m
arke
t reg
ulat
ion
and
supe
rvis
ion,
w
ith p
lans
to fu
rther
stre
ngth
en
prud
entia
l req
uire
men
ts in
the
futu
re.
The
rule
s fo
r new
ban
k le
ndin
g fo
r th
e pu
rcha
se o
f sto
cks
wer
e tig
hten
ed
to li
mit
pote
ntia
l spi
llove
r effe
cts
from
a
stoc
k m
arke
t cor
rect
ion
to th
e ba
nkin
g sy
stem
.
Secu
ritie
s co
mpa
nies
and
inve
stm
ent
fund
man
ager
s ha
ve b
een
requ
este
d to
pr
ovid
e in
form
atio
n on
thei
r rec
ent s
tock
m
arke
t ope
ratio
ns.
Repr
esen
tativ
e of
fi ces
of f
orei
gn
inve
stm
ent f
unds
are
requ
ired
to
rere
gist
er w
ith th
e St
ate
Secu
ritie
s Co
mm
issi
on.
Note
: L. E
ffie
Psal
ida
prep
ared
this
ann
ex w
ith in
put f
rom
Tur
gut K
isin
bay,
Ann
amar
ia K
oken
yne,
Gill
ian
Nkha
ta, S
eiic
hi S
him
izu, J
udit
Vada
sz, a
nd a
rea
depa
rtmen
ts.
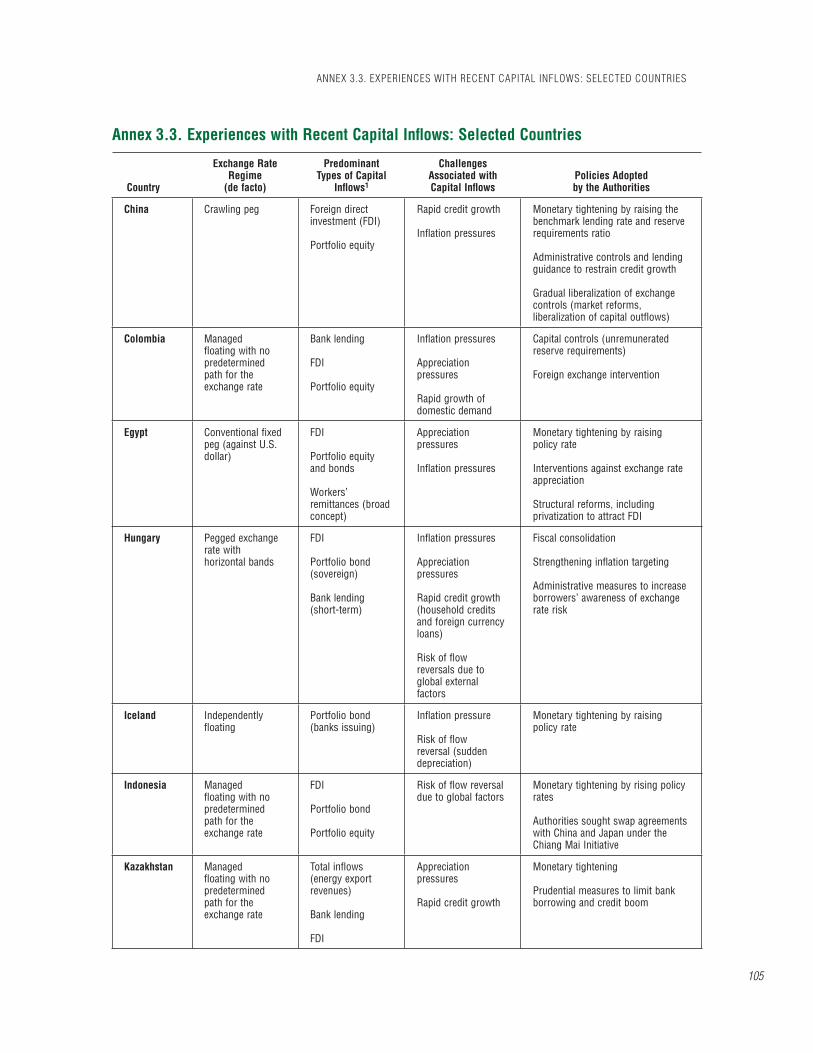
ANNEX 3.3. EXPERIENCES WITH RECENT CAPITAL INFLOWS: SELECTED COUNTRIES
105
Annex 3.3. Experiences with Recent Capital Infl ows: Selected Countries
Country
Exchange Rate Regime
(de facto)
PredominantTypes of Capital
Infl ows1
ChallengesAssociated with Capital Infl ows
Policies Adopted by the Authorities
China Crawling peg Foreign direct investment (FDI)
Portfolio equity
Rapid credit growth
Infl ation pressures
Monetary tightening by raising the benchmark lending rate and reserve requirements ratio
Administrative controls and lending guidance to restrain credit growth
Gradual liberalization of exchange controls (market reforms, liberalization of capital outfl ows)
Colombia Managedfl oating with no predeterminedpath for the exchange rate
Bank lending
FDI
Portfolio equity
Infl ation pressures
Appreciationpressures
Rapid growth of domestic demand
Capital controls (unremunerated reserve requirements)
Foreign exchange intervention
Egypt Conventional fi xed peg (against U.S. dollar)
FDI
Portfolio equity and bonds
Workers’ remittances (broad concept)
Appreciationpressures
Infl ation pressures
Monetary tightening by raising policy rate
Interventions against exchange rate appreciation
Structural reforms, including privatization to attract FDI
Hungary Pegged exchange rate with horizontal bands
FDI
Portfolio bond (sovereign)
Bank lending (short-term)
Infl ation pressures
Appreciationpressures
Rapid credit growth (household credits and foreign currency loans)
Risk of fl ow reversals due to global external factors
Fiscal consolidation
Strengthening infl ation targeting
Administrative measures to increase borrowers’ awareness of exchange rate risk
Iceland Independentlyfl oating
Portfolio bond (banks issuing)
Infl ation pressure
Risk of fl ow reversal (sudden depreciation)
Monetary tightening by raising policy rate
Indonesia Managedfl oating with no predeterminedpath for the exchange rate
FDI
Portfolio bond
Portfolio equity
Risk of fl ow reversal due to global factors
Monetary tightening by rising policy rates
Authorities sought swap agreements with China and Japan under the Chiang Mai Initiative
Kazakhstan Managedfl oating with no predeterminedpath for the exchange rate
Total infl ows (energy export revenues)
Bank lending
FDI
Appreciationpressures
Rapid credit growth
Monetary tightening
Prudential measures to limit bank borrowing and credit boom

CHAPTER 3 THE QUALITY OF DOMESTIC FINANCIAL MARKETS AND CAPITAL INFLOWS
106
Annex 3.3. (continued)
Country
Exchange Rate Regime
(de facto)
PredominantTypes of Capital
Infl ows1
ChallengesAssociated with Capital Infl ows
Policies Adopted by the Authorities
Korea Independentlyfl oating
FDI
Financialderivatives
Rapid credit growth to households andsmall and medium-sized enterprise (SME) sector (with decline in corporate profi tability, especially SMEs)
Macroeconomic/monetary policy measures
Liberalization of outfl ows
Move to risk-based supervision
New Zealand Independentlyfl oating
Portfolio bond (domestic banks and corporates)
Infl ation pressures (medium-term)
Risk of fl ow reversal (sudden depreciation)
Monetary tightening by raising policy rate
Foreign exchange interventions (June 2007, for the fi rst time since 1985)
Pakistan Conventionalfi xed peg (against U.S. dollar)
FDI
Portfolio bond (sovereign)
Infl ation pressures
Rapid credit growth
Risk of fl ow reversals due to global external factors
Reserve accumulation
Peru Managedfl oating with no predeterminedpath for the exchange rate
FDI
Portfolio equity
Appreciationpressures
Risk of fl ow reversals due to global external factors
Reserve accumulation
Fiscal consolidation
Strengthening prudential framework
Philippines Independentlyfl oating
Workers’ remittances (broad concept)
FDI
Appreciationpressures (loss of competitiveness)
Inadequatefi nancial sector risk management
Reserve accumulation
Shift toward domestic budget fi nancing
Liberalization of foreign exchange system
Poland Independentlyfl oating
FDI
Portfolio bond
Portfolio equity
Bank lending
Appreciationpressures
Infl ation pressures
Rapid credit growth in both domestic and foreign currency
Risk of fl ow reversals due to global external factors
Fiscal tightening (European Union convergence)
Free fl oat of currency
Liberalization of capital account
Strengthening regulatory and prudential framework in line with EU accession requirements
Tightening risk management and disclosure standards related to foreign-currency-denominatedlending

ANNEX 3.3. EXPERIENCES WITH RECENT CAPITAL INFLOWS: SELECTED COUNTRIES
107
Annex 3.3. (concluded)
Country
Exchange Rate Regime
(de facto)
PredominantTypes of Capital
Infl ows1
ChallengesAssociated with Capital Infl ows
Policies Adopted by the Authorities
Russia Managedfl oating with no predeterminedpath for the exchange rate
Total infl ows (energy export revenues)
Bank lending (corporates),including carry trade
FDI
Infl ation pressures
Appreciationpressures
Rapid credit growth
Asset price boom
Monetary tightening
Increased exchange rate fl exibility
Partial capital account liberalization, including elimination of special accounts and unremunerated reserve requirements to control capital fl ows
Strengthening prudential regulation and supervision
Thailand Managedfl oating with no predeterminedpath for the exchange rate
FDI
Portfolio
Bank-related fl ows
Appreciationpressures(concerns over competitiveness)and volatility
Interventions on the foreign exchange market and moral suasion
Introduction of capital controls in the form of unremunerated reserve requirements
Partial liberalization of outfl ows
Turkey Independentlyfl oating
Portfolio bond
Portfolio equity
Bank lending
FDI
Appreciationpressures
Rapid credit growth
Corporate exchange rate risk exposure
Allow currency to appreciate
Raise capital adequacy ratio
Increase provisioning requirements
Measures introduced to improve liquidity management
Uruguay Managedfl oating with no predeterminedpath for the exchange rate
Portfolio bond
Portfolio equity
Appreciationpressures
Interventions in the foreign exchange market to build up reserves and slow down appreciation
Note: Annamaria Kokenyne, Turgut Kisinbay, Gillian Nkhata, Seiichi Shimizu, and Judit Vadasz prepared this annex.1Capital inflows are noted according to the broad balance of payments classification.

CHAPTER 3 THE QUALITY OF DOMESTIC FINANCIAL MARKETS AND CAPITAL INFLOWS
108
ReferencesAlfaro, Laura, Sebnem Kalemli-Ozcan, and Vadym
Volosovych, 2005, “Capital Flows in a Globalized World: The Role of Policies and Institutions,” NBER Working Paper No. 11696 (Cambridge, Massachusetts: National Bureau of Economic Research).
Ariyoshi, Akira, Karl Habermeier, Bernard Laurens, Inci Ötker-Robe, Jorge Canales-Kriljenko, and Andrei Kirilenko, 2000, Capital Controls: Country Experiences with Their Use and Liberalization, IMF Occasional Paper No. 190 (Washington: Interna-tional Monetary Fund).
Breitung, Jörg, 2000, “The Local Power of Some Unit Root Tests for Panel Data,” in Nonstationary Panels, Panel Cointegration, and Dynamic Panels, Advances in Econometrics, Vol. 15, ed. by Badi H. Baltagi (New York: Elsevier Science), pp. 161–78.
Chinn, Menzie, and Hiro Ito, 2006, “What Matters for Financial Development? Capital Controls, Institu-tions, and Interactions,” Journal of Development Economics, Vol. 81 (October), pp. 163–92.
Choi, In, 2001, “Unit Root Tests for Panel Data,” Journal of International Money and Finance, Vol. 20 (April), pp. 249–72.
De Nicolò, Gianni, Luc Laeven, and Kenichi Ueda, 2006, “Corporate Governance Quality: Trends and Real Effects,” IMF Working Paper 06/293 (Washington: International Monetary Fund).
Edison, Hali J., Michael W. Klein, Luca Antonio Ricci, and Torsten Sløk, 2004, “Capital Account Liberalization and Economic Performance: Survey and Synthesis,” IMF Staff Papers, Vol. 51, No. 2, pp. 220–56.
Eichengreen, Barry J., 2001, “Capital Account Lib-eralization: What Do Cross-Country Studies Tell Us?” World Bank Economic Review, Vol. 15, No. 3, pp. 341–65.
Enoch, Charles, and Inci Ötker-Robe, eds., 2007, Rapid Credit Growth in Central and Eastern Europe: Endless Boom or Early Warning (New York: Palgrave Macmillan).
Henry, Peter Blair, 2006, “Capital Account Liberaliza-tion: Theory, Evidence, and Speculation,” NBER Working Paper No. 12698 (Cambridge, Massachu-setts: National Bureau of Economic Research).
Hilbers, Paul, Inci Ötker-Robe, Ceyla Pazarbasio-glu, and Gudrun Johnsen, 2005, “Assessing and Managing Rapid Credit Growth and the Role of
Supervisory and Prudential Policies,” IMF Working Paper 151/05 (Washington: International Monetary Fund).
Im, Kyung So, M. Hashem Pesaran, and Yongcheol Shin, 2003, “Testing for Unit Roots in Hetero-geneous Panels,” Journal of Econometrics, Vol. 115 (July), pp. 53–74.
International Monetary Fund (IMF), 2007a, GlobalFinancial Stability Report, World Economic and Financial Surveys (Washington, April). Available via the Internet: http://www.imf.org/External/Pubs/FT/GFSR/2007/01/index.htm.
–––––, 2007b, “Reaping the Benefi ts of Financial Glo-balization,” IMF Discussion Paper. Available via the Internet: http://www.imf.org/external/np/res/docs/2007/0607.htm.
–––––, 2007c, “Managing Large Capital Infl ows,” in World Economic Outlook, World Economic and Finan-cial Surveys (Washington, October).
Kaufmann, Daniel, Aart Kraay, and Massimo Mastru-zzi, 2007, “Governance Matters IV: Governance Indicators for 1996–2006,” Policy Research Working Paper No. 4280 (Washington: World Bank).
Levin, Andrew, Chien-Fu Lin, and James Chia-Shang Chu, 2002, “Unit Root Tests in Panel Data: Asymp-totic and Finite-Sample Properties,” Journal of Econometrics, Vol. 108 (May), pp. 1–24.
Maddala, G.S., and Shaowen Wu, 1999, “A Compara-tive Study of Unit Root Tests with Panel Data and A New Simple Test,” Oxford Bulletin of Economics and Statistics, Vol. 61 (November), pp. 631–52.
Montiel, Peter, and Carmen M. Reinhart, 1999, “Do Capital Controls and Macroeconomic Policies Infl u-ence the Volume and Composition of Capital Flows? Evidence from the 1990s,” Journal of International Money and Finance, Vol. 18 (August), pp. 619–35.
Poirson, Hélène, 2007, “Country Study: India,” IMFResearch Bulletin, Vol. 8 (June), pp. 6–8.
Prasad, Eswar, Kenneth Rogoff, Shang-Jin Wei, and Ayhan Kose, 2003, Effects of Financial Globalization on Developing Countries: Some Empirical Evidence, IMF Occasional Paper No. 220 (Washington: Interna-tional Monetary Fund).
Purfi eld, Catriona, 2006, “Maintaining Competitive-ness in the Global Economy” in India Goes Global: Its Expanding Role in the World Economy, ed. by C. Purfi eld and J. Schiff (Washington: International Monetary Fund).
Reinhart, Carmen M., and Vincent R. Reinhart, 1998, “Some Lessons for Policy Makers Who Deal with

REFERENCES
109
the Mixed Blessing of Capital Infl ows,” in CapitalFlows and Financial Crises, ed. by M. Kahler (Ithaca, New York: Cornell University Press).
Smith, Katherine A., and Diego Valderrama, 2007, “The Composition of Capital Infl ows When Emerg-ing Market Firms Face Financing Constraints,”
FRBSF Working Paper No. 2007-13, (San Francisco, California: Federal Reserve Bank of San Francisco).
World Bank, 2007, “Financial Flows to Developing Countries: Recent Trends and Prospects,” in GlobalDevelopment Finance 2007: The Globalization of Cor-porate Finance in Developing Countries (Washington: World Bank).

110110
ABX An index of credit default swaps referencing 20 bonds collateralized by subprime mortgages.
Asset-backed commercial paper (ABCP)
Commercial paper collateralized by loans, leases, receivables or asset-backed securities.
Asset-backed security (ABS) A security that is collateralized by the cash fl ows from a pool of under-lying loans, leases, receivables, installment contracts on personal prop-erty, or on real estate. Often, when the security is collateralized by real estate, it is called a mortgage-backed security (MBS), although in prin-ciple an MBS is a type of ABS.
Assets under management (AUM)
Assets managed by an investment company on behalf of investors.
Call (put) option A fi nancial contract that gives the buyer the right, but not the obliga-tion, to buy (sell) a fi nancial instrument at a set price on or before a given date.
Capital-to-risk-weighted assets ratio
A measure that represents an institution’s capacity to cope with credit risk. It is often calculated as a ratio of categories of capital to assets, which are weighted for riskiness.
Carry trade A leveraged transaction in which borrowed funds are used to take a position in which the expected return exceeds the cost of the bor-rowed funds. The “cost of carry” or “carry” is the difference between the yield on the investment and the fi nancing cost (e.g., in a “positive carry” the yield exceeds the fi nancing cost).
Cash securitization The creation of securities from a pool of preexisting assets and receiv-ables that are placed under the legal control of investors through a special intermediary created for this purpose. This compares with a “synthetic” securitization where the generic securities are created out of derivative instruments.
CAT (catastrophe) bonds A type of insurance-linked security whereby investors bear risk if a specifi ed catastrophic event occurs in return for an interest premium.
Collateralized debt obligation (CDO)
A structured credit security backed by a pool of securities, loans, or credit default swaps, and where securitized interests in the security are divided into tranches with differing repayment and interest earning streams.
GLOSSARY

GLOSSARY
111
Collateralized loan obligation (CLO)
A structured vehicle backed by whole commercial loans, revolving credit facilities, letters of credit, or other asset-backed securities.
Commercial paper A private unsecured promissory note with short maturity. It need not be registered with the Securities and Exchange Commission provided the maturity is within 270 days, and it is typically rolled over such that new issues fi nance maturing ones.
Corporate governance The governing relationships between all the stakeholders in a com-pany—including the shareholders, directors, and management—as defi ned by the corporate charter, bylaws, formal policy, and rule of law.
Credit default swap (CDS) A default-triggered credit derivative. Most CDS settlements are “physi-cal,” whereby the protection seller buys a defaulted reference asset from the protection buyer at its face value. “Cash” settlement involves a net payment to the protection buyer equal to the difference between the reference asset face value and the price of the defaulted asset.
Credit derivative A fi nancial contract under which an agent buys or sells risk protec-tion against the credit risk associated with a specifi c reference entity (or specifi c entities). For a periodic fee, the protection seller agrees to make a contingent payment to the buyer on the occurrence of a credit event (default in the case of a credit default swap).
Credit-linked note (CLN) A security that is bundled with an embedded credit default swap and is intended to transfer a specifi c credit risk to investors. CLNs are usu-ally backed by highly rated collateral.
Credit risk indicator An indicator that measures the probability of multiple defaults among the fi rms in selected portfolios.
Credit spread The spread between benchmark securities and other debt securities that are comparable in all respects except for credit quality (e.g., the difference between yields on U.S. treasuries and those on single A-rated corporate bonds of a certain term to maturity).
Derivatives Financial contracts whose value derives from underlying securities prices, interest rates, foreign exchange rates, commodity prices, and market or other indices.
EBITDA Earnings before interest, taxes, depreciation, and amortization.
Economic risk capital (ERC) An assessment of the amount of capital a fi nancial institution requires to absorb losses from extremely unlikely events over long time hori-zons with a given degree of certainty. ERC calculations make provision not just for market risk, but also for credit and operational risks, and may also take account of liquidity, legal, and reputational risks.
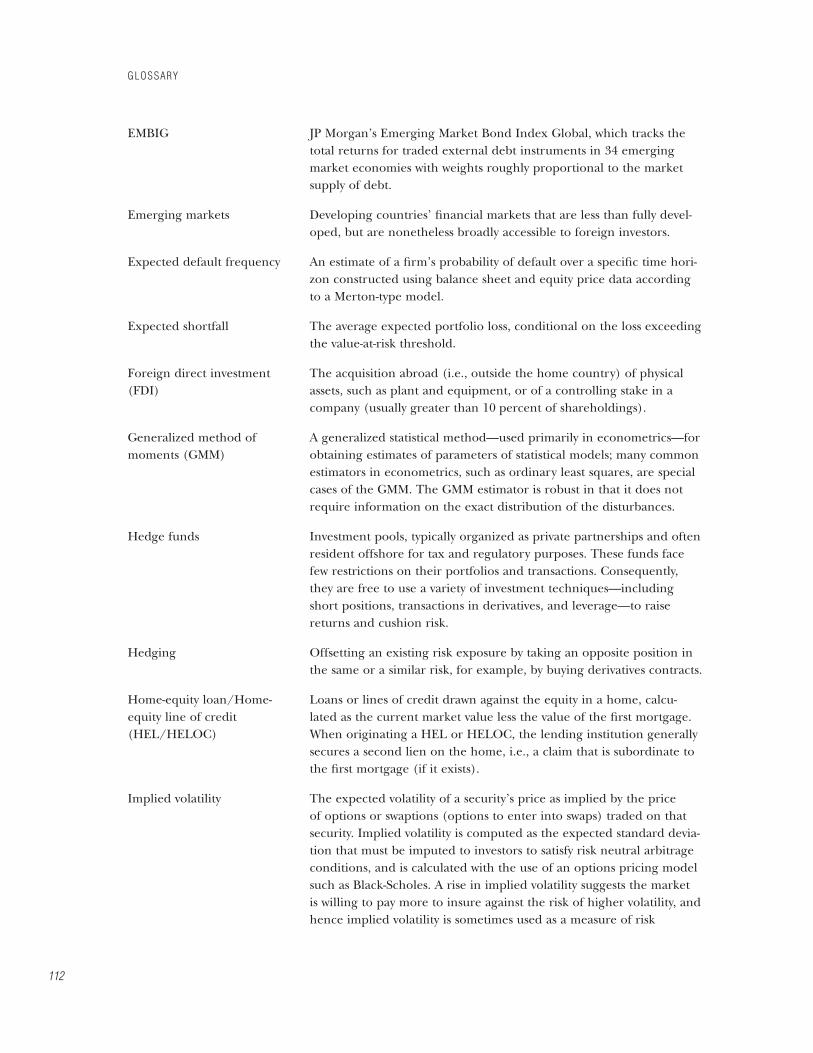
GLOSSARY
112
EMBIG JP Morgan’s Emerging Market Bond Index Global, which tracks the total returns for traded external debt instruments in 34 emerging market economies with weights roughly proportional to the market supply of debt.
Emerging markets Developing countries’ fi nancial markets that are less than fully devel-oped, but are nonetheless broadly accessible to foreign investors.
Expected default frequency An estimate of a fi rm’s probability of default over a specifi c time hori-zon constructed using balance sheet and equity price data according to a Merton-type model.
Expected shortfall The average expected portfolio loss, conditional on the loss exceeding the value-at-risk threshold.
Foreign direct investment (FDI)
The acquisition abroad (i.e., outside the home country) of physical assets, such as plant and equipment, or of a controlling stake in a company (usually greater than 10 percent of shareholdings).
Generalized method of moments (GMM)
A generalized statistical method—used primarily in econometrics—for obtaining estimates of parameters of statistical models; many common estimators in econometrics, such as ordinary least squares, are special cases of the GMM. The GMM estimator is robust in that it does not require information on the exact distribution of the disturbances.
Hedge funds Investment pools, typically organized as private partnerships and often resident offshore for tax and regulatory purposes. These funds face few restrictions on their portfolios and transactions. Consequently, they are free to use a variety of investment techniques—including short positions, transactions in derivatives, and leverage—to raise returns and cushion risk.
Hedging Offsetting an existing risk exposure by taking an opposite position in the same or a similar risk, for example, by buying derivatives contracts.
Home-equity loan/Home-equity line of credit (HEL/HELOC)
Loans or lines of credit drawn against the equity in a home, calcu-lated as the current market value less the value of the fi rst mortgage. When originating a HEL or HELOC, the lending institution generally secures a second lien on the home, i.e., a claim that is subordinate to the fi rst mortgage (if it exists).
Implied volatility The expected volatility of a security’s price as implied by the price of options or swaptions (options to enter into swaps) traded on that security. Implied volatility is computed as the expected standard devia-tion that must be imputed to investors to satisfy risk neutral arbitrage conditions, and is calculated with the use of an options pricing model such as Black-Scholes. A rise in implied volatility suggests the market is willing to pay more to insure against the risk of higher volatility, and hence implied volatility is sometimes used as a measure of risk

GLOSSARY
113
appetite (with higher risk appetite being associated with lower implied volatility). One of the most widely quoted measures of implied volatil-ity is the VIX, an index of implied volatility on the S&P 500 index of U.S. stocks.
Institutional investor A bank, insurance company, pension fund, mutual fund, hedge fund, brokerage, or other fi nancial group that takes large investments from clients or invests on its own behalf.
Interest rate swap An agreement between counterparties to exchange periodic interest payments on some predetermined dollar principal, which is called the notional principal amount. For example, one party will make fi xed-rate and receive variable-rate interest payments.
Intermediation The process of transferring funds from the ultimate source to the ulti-mate user. A fi nancial institution, such as a bank, intermediates credit when it obtains money from depositors or other lenders and on-lends it to borrowers.
Investment-grade obligation A bond or loan is considered investment grade if it is assigned a credit rating in the top four categories. S&P and Fitch classify investment-grade obligations as BBB- or higher, and Moody’s classifi es investment grade bonds as Baa3 or higher.
Large complex fi nancial institution (LCFI)
A major fi nancial institution frequently operating in multiple sectors and often with an international scope.
Leverage The proportion of debt to equity. Leverage can be built up by borrow-ing (on-balance-sheet leverage, commonly measured by debt-to-equity ratios) or by using off-balance-sheet transactions.
Leveraged buyout (LBO) Acquisition of a company using a signifi cant level of borrowing (through bonds or loans) to meet the cost of acquisition. Usually, the assets of the company being acquired are used as collateral for the loans.
Leveraged loans Bank loans that are rated below investment grade (BB+ and lower by S&P or Fitch, and Baa1 and lower by Moody’s) to fi rms with a siz-able debt-to-EBITDA ratio, or trade at wide spreads over LIBOR (e.g., more than 150 basis points).
LIBOR London Interbank Offered Rate.
Liquidity-adjusted value-at-risk (L-VaR)
A value-at-risk calculation that makes an adjustment for the trading liquidity of the assets that constitute the assessed portfolio. This can either be limits on trading positions in the portfolio linked to the assets’ underlying turnover or adjustments made to the VaR’s volatility and correlation structures to take account of illiquidity risk in extreme circumstances.
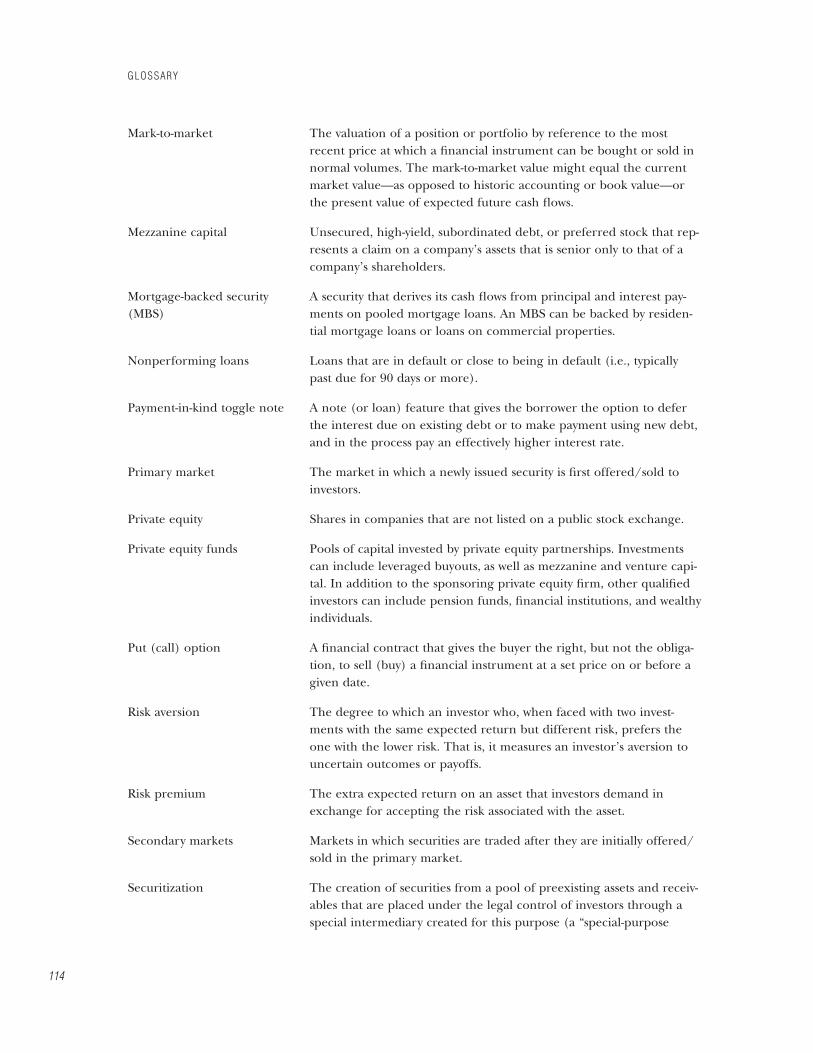
GLOSSARY
114
Mark-to-market The valuation of a position or portfolio by reference to the most recent price at which a fi nancial instrument can be bought or sold in normal volumes. The mark-to-market value might equal the current market value—as opposed to historic accounting or book value—or the present value of expected future cash fl ows.
Mezzanine capital Unsecured, high-yield, subordinated debt, or preferred stock that rep-resents a claim on a company’s assets that is senior only to that of a company’s shareholders.
Mortgage-backed security (MBS)
A security that derives its cash fl ows from principal and interest pay-ments on pooled mortgage loans. An MBS can be backed by residen-tial mortgage loans or loans on commercial properties.
Nonperforming loans Loans that are in default or close to being in default (i.e., typically past due for 90 days or more).
Payment-in-kind toggle note A note (or loan) feature that gives the borrower the option to defer the interest due on existing debt or to make payment using new debt, and in the process pay an effectively higher interest rate.
Primary market The market in which a newly issued security is fi rst offered/sold to investors.
Private equity Shares in companies that are not listed on a public stock exchange.
Private equity funds Pools of capital invested by private equity partnerships. Investments can include leveraged buyouts, as well as mezzanine and venture capi-tal. In addition to the sponsoring private equity fi rm, other qualifi ed investors can include pension funds, fi nancial institutions, and wealthy individuals.
Put (call) option A fi nancial contract that gives the buyer the right, but not the obliga-tion, to sell (buy) a fi nancial instrument at a set price on or before a given date.
Risk aversion The degree to which an investor who, when faced with two invest-ments with the same expected return but different risk, prefers the one with the lower risk. That is, it measures an investor’s aversion to uncertain outcomes or payoffs.
Risk premium The extra expected return on an asset that investors demand in exchange for accepting the risk associated with the asset.
Secondary markets Markets in which securities are traded after they are initially offered/sold in the primary market.
Securitization The creation of securities from a pool of preexisting assets and receiv-ables that are placed under the legal control of investors through a special intermediary created for this purpose (a “special-purpose

GLOSSARY
115
vehicle” [SPV] or “special-purpose entity” [SPE]). With a “synthetic” securitization the securities are created out of a portfolio of derivative instruments.
Security arbitrage conduit A conduit (a vehicle that issues ABCP only) that is formed specifi cally for the purpose of investing in assets using relatively cheap fi nancing. The mix of assets can change over time.
Sovereign wealth fund (SWF) A special investment fund created/owned by government to hold assets for long-term purposes; it is typically funded from reserves or other foreign currency sources and predominantly owns, or has sig-nifi cant ownership of, foreign currency claims on nonresidents.
Spread See “credit spread” (the word credit is sometimes omitted). Other defi nitions include (1) the gap between bid and ask prices of a fi nan-cial instrument; and (2) the difference between the price at which an underwriter buys an issue from the issuer and the price at which the underwriter sells it to the public.
Structured investment vehicle (SIV)
A legal entity, whose assets consist of asset-backed securities and vari-ous types of loans and receivables. An SIV’s liabilities are usually tranched and include debt that matures in less than one year and must be rolled over.
Sub-investment-gradeobligation
An obligation rated below investment-grade, sometimes referred to as “high-yield” or “junk.”
Subprime mortgages Mortgages to borrowers with impaired or limited credit histories, who typically have low credit scores.
Swaps An agreement between counterparties to exchange periodic interest payments based on different references on a predetermined notional amount. For example, in an interest rate swap, one party will make fi xed-rate and receive variable-rate interest payments.
Syndicated loans Large loans made jointly by a group of banks to one borrower. Usu-ally, one lead bank takes a small percentage of the loan and partitions (syndicates) the rest to other banks.
Value-at-risk (VaR) An estimate of the loss, over a given horizon, that is statistically unlikely to be exceeded at a given probability level.
Yield curve A chart that plots the yield to maturity at a specifi c point in time for debt securities having equal credit risk but different maturity dates.

SUMMING UP BY THE CHAIRMAN
Assessing Global Financial Stability Risks
Directors noted that global fi nancial stability has endured a diffi cult period since the publica-tion of the April 2007 Global Financial Stability Report (GFSR). Overall, fi nancial risks have risen and markets are continuing to experience bouts of turbulence. Directors agreed with staff that, while there has been some calming in certain respects, markets generally remain unsettled, and credit conditions may not normalize soon.
Against this background, Directors welcomed the GFSR as providing a clear, well-focused, and timely analysis of the recent market turbu-lence. They broadly concurred with the report’s insights regarding the causes and consequences of the recent episode of turmoil, and felt that the report presents a balanced assessment of the primary areas of concern and the potential policy responses. Directors continued to view the staff’s use of the global fi nancial stability map as useful, allowing them to track the deterioration in risks and conditions more concretely.
Directors noted that the threat to fi nancial stability has been most evident in the money markets that provide short-term fi nancing. At the heart of the diffi culties in these markets was a funding mismatch whereby medium-term, illiquid, hard-to-value assets, such as structured credit securities, had been fi nanced by short-term money market securities—often asset-backed commercial paper. When these asset values were threatened by a rise in delinquen-cies and ratings declined, short-term funding for those holding these assets became more diffi cult to obtain. For some entities, especially some conduits and special investment vehicles, inves-
tors became uncomfortable holding the com-mercial paper that was supporting these illiquid, hard-to-value assets. For others, such as hedge funds, this forced a deleveraging process, once their prime brokers balked at providing addi-tional funding and insisted that more collateral be posted at lower values.
Directors noted that, in the recent situation of market turbulence, various central banks had moved quickly to provide liquidity—both in the overnight market, but also at longer maturities. Despite signifi cant injections of liquidity, market participants remain uncertain about their coun-terparties’ condition, and are thus reluctant to onlend.
Directors agreed with staff that there are potentially a number of other reasons why fund-ing markets had not functioned normally—including the possibility that large banks have experienced an increase in their balance sheets in the form of structured credit securities or loans associated with leveraged buyouts. In such circumstances, it remains to be seen how effec-tive lower interest rates will be in stemming pres-sures in money markets, and how policymakers will balance medium-term infl ation objectives against nearer-term threats to fi nancial stabil-ity. Some Directors cautioned that care will be needed to avoid moral hazard, including by ensuring that central banks focus on addressing general disorderly markets, rather than taking on credit risk or favoring certain institutions.
Directors commended the staff for its analysis of the various issues raised by the turbulence, including the implications of the potential losses, their distribution, and their wider impact on the fi nancial system of developments in U.S.
The following remarks by the Acting Chair were made at the conclusion of the Executive Board’s discussion of the Global Financial Stability Report on September 14, 2007.
117
SUMMING UP BY THE ACTING CHAIRAN
NE
X

ANNEX SUMMING UP BY THE ACTING CHAIR
118
mortgage markets. Many Directors cautioned that the diffi cult conditions in the U.S. subprime mortgage market may continue, calling for con-tinued vigilance. Directors also noted that the continued work on leveraged buyout activity has aided understanding of why major banks may be unwilling to provide liquidity to others—includ-ing the likelihood that they may be holding the excess liquidity in anticipation of leveraged loans arriving on their balance sheets.
Directors noted that, so far, the fi nancial mar-ket turbulence has not had a large adverse effect on emerging market and low-income countries. As a whole, these countries’ very favorable growth performance over the last several years has encouraged both residents and nonresidents to invest in local markets and in private sector assets. Several Directors noted, however, that the risks for emerging markets may be fi nely bal-anced, and cautioned that the turmoil in mature markets may yet spill over to emerging market countries. The deterioration in fi nancial mar-ket confi dence seen in mature markets could be expected to begin to affect some emerging market countries going forward, particularly those that have been experiencing rapid credit growth. This concern is heightened in coun-tries where credit extension has been primarily supported by external funding, or where other vulnerabilities—such as large current account or fi scal defi cits—are present. Against this background, Directors underscored the need for strengthened vigilance and surveillance in emerging markets—in addition to mature markets—to ensure credit discipline and sound development of fi nancial markets.
On the use of synthetic rate and structured credit products by investors in emerging market countries, Directors noted that, as the growth of these instruments has been associated with a period of benign volatility, some investors are likely to see losses with the reversal of this environment. The reversal of carry-trade-style external borrowing by emerging market fi rms could also be detrimental to investors. Direc-tors advised that monitoring systems for these types of exposures of domestic corporations and
fi nancial institutions be strengthened so that risks can be better managed.
Directors considered that the current epi-sode of turbulence should not be viewed as having ended, and with this awareness, broadly endorsed the initial set of policy conclusions reached in the report. Directors recognized that the development of fi nancial markets in recent years has resulted in many benefi ts and useful innovations, and underscored the importance of not rushing to judgment about the causes of the current turmoil or the implications for fi nancial sector policies. At the same time, they noted that much remains to be done to improve transpar-ency and disclosure, starting with the complex structured products that have proliferated across large parts of the global fi nancial system. More information about how they are valued and the underlying assumptions—as well as how they are distributed across investors—would remove much of the uncertainty that underlies the cur-rent concerns of market participants. Directors also viewed better transparency and disclosure regarding fi nancial institutions, and their vari-ous conduits and special investment vehicles, as particularly important. Directors also gener-ally considered that the recent episode suggests that the “originate and distribute” business model used by many fi nancial institutions to securitize and redistribute risks may need to be reevaluated to ensure that the supply chain has adequate incentives to evaluate the credit quality of the loans being repackaged.
Many Directors noted concerns about the rat-ings agencies’ confl ict of interest, as they both rate and help design complex securities for issuers requesting the rating. Some Directors noted that this is a longstanding confl ict, and that ratings agencies still perform a useful and fundamental role in rating credit risks that will need to be retained. It was also suggested that ratings agencies should review the quality of their methodologies. At the same time, most Directors agreed that inves-tors, for their part, must also take responsibility for their own analysis of such products, particularly given that the risks are not confi ned to credit risk, but also entail market and liquidity risks.
SUMMING UP BY THE ACTING CHAIR
119
Many Directors viewed the recent episode as a reminder to regulators and supervisors that there remain gaps in their oversight of fi nancial institutions that would likely require further attention and examination. Directors noted that some fi nancial institutions’ risk management systems and their disclosures—even to supervi-sors—make it diffi cult to detect the off-balance sheet risks being undertaken, and that this would need to be rectifi ed going forward. At the same time, Directors acknowledged that the experience to date does not point to a need for a substantial overhaul of regulatory frameworks. Any revisions would have to be carefully consid-ered, and unintended consequences anticipated.
Do Market Risk Management Techniques Amplify Systemic Risks?
Directors welcomed the improvements in mar-ket risk management systems in recent years. At the same time, they welcomed the staff analysis of certain weaknesses in these systems as a timely and relevant reminder that no risk manage-ment system is perfect. In particular, Directors noted that risk management practices and mod-els—including the popular value-at-risk (VaR) measures—have the potential to exacerbate volatility and to lead to systemic risks if followed mechanistically.
Some Directors observed that it would be diffi cult to avoid the trend toward greater uni-formity in the approaches that fi rms use in risk management modeling, as the desire to attain “best practices” is encouraged by many aspects of risk management—including through super-visory guidance and capital requirements, peer pressure, and similarly-trained risk managers. Nonetheless, Directors generally acknowledged that fi nancial institutions should aim to analyze the risks specifi c to their organization, by devel-oping their own models and rigorously stress-testing their positions to assure the institutions’ viability during a time of stress.
Directors noted that recent events point to the potentially negative infl uence of some risk management practices—such as margin require-
ments—that have added to “fi re sales” of some assets used as collateral. However, if margin requirements are initially set more conserva-tively and are less risk sensitive, market dynam-ics would be more stable. Further, it was noted that a diversity of positions and types of trading strategies could help contain amplifying effects. Directors also believed that better disclosure of how risks are managed could allow institutions and supervisors to better anticipate the negative effects during stressful events.
The Quality of Domestic Financial Markets and Capital Infl ows
Given the rapid capital infl ows experienced by several emerging market countries, Direc-tors welcomed the renewed focus on the challenges—and related policy responses—associated with surges in capital infl ows. They observed that, while macroeconomic perfor-mance and growth prospects are the dominant infl uences on capital fl ows, equity market liquid-ity and fi nancial openness also help attract capi-tal infl ows. Most Directors concurred with the empirical analysis that more fi nancial openness is associated with lower capital infl ow volatil-ity. Also, improved institutional quality in the fi nancial sector is shown to lower the volatility of capital infl ows. While Directors agreed with the main results of the study, several Directors noted that its recommendation—to improve fi nancial market infrastructure and depth—represents a medium-term challenge.
Directors recognized that large capital infl ows in different country circumstances call for dif-ferent policy responses. Good regulation and supervision, as well as strong risk management practices, are important for mitigating the poten-tially destabilizing effects of a reversal of infl ows. In this context, many Directors questioned the usefulness and effectiveness of capital controls for managing capital infl ows—especially given the diffi culties in their sustained implementation and the associated reputational costs. Some Directors, however, recognized the usefulness of capital con-trols in the short term in stemming large, specu-

120
lative capital infl ows. It was noted that, if capital controls are used, they should preferably be mar-ket-based, have a fi xed horizon, and be consid-ered as part of a consistent set of macroeconomic and prudential measures. Several Directors also noted that concerns related to rapid and risky credit expansion are best dealt with through prudential measures, rather than by attempts to impede the infl ow of capital.
Directors welcomed the analysis of Sovereign Wealth Funds (SWFs) contained in the report. Some Directors observed that some SWFs have adopted best practices in fi nancial manage-ment. Moreover, SWFs can play a positive role in enhancing market liquidity and fi nancial resource allocation. Several Directors sug-gested that SWFs warrant further study, given their macroeconomic role, potential size, and implications for global capital fl ows and asset prices. They called on staff to engage in further research on the objectives and characteristics of SWFs, including their asset management strate-gies, institutional and governance arrangements, and disclosure practices.
Finally, Directors commented on the broader question of the IMF’s role as an international monetary institution in situations such as the
recent market turmoil. A key aspect of this role entails working closely—and exchanging views and information—with national regulators, cen-tral banks, and other international institutions, both bilaterally and through established fora such as the Financial Stability Forum. Several Directors underscored that the IMF should be able to act in a timely and proactive fashion in sharing its perspectives with, and providing its advice to, national authorities, drawing on its unique insights gained from fi nancial surveil-lance of its virtually universal membership. To this end, continued work to broaden and deepen the IMF’s fi nancial market expertise—including with respect to emerging markets with increasingly globalized fi nancial systems—will be important. Given the crucial need for timely and accurate information in assessing and responding to fi nancial market turbulence, sev-eral Directors also highlighted the important contribution that the IMF can make to fi lling information gaps by virtue of its access to fi nan-cial sector information in its surveillance activi-ties. Overall, Directors saw a role for the IMF in facilitating appropriate responses to the current situation, and more broadly in promoting global fi nancial stability.
ANNEX SUMMING UP BY THE ACTING CHAIR
121
This statistical appendix presents data on fi nancial developments in key fi nancial centers and emerging markets. It is
designed to complement the analysis in the text by providing additional data that describe key aspects of fi nancial market developments. These data are derived from a number of sources external to the IMF, including banks, commer-cial data providers, and offi cial sources, and are presented for information purposes only; the IMF does not, however, guarantee the accuracy of the data from external sources.
Presenting fi nancial market data in one loca-tion and in a fi xed set of tables and charts, in this and future issues of the GFSR, is intended to give the reader an overview of developments in global fi nancial markets. Unless otherwise noted, the statistical appendix refl ects informa-tion available up to July 27, 2007.
Mirroring the structure of the chapters of the report, the appendix presents data separately
for key fi nancial centers and emerging market countries. Specifi cally, it is organized into three sections:
• Figures 1–14 and Tables 1–9 contain informa-tion on market developments in key fi nancial centers. This includes data on global capital fl ows, and on markets for foreign exchange, bonds, equities, and derivatives as well as sec-toral balance sheet data for the United States, Japan, and Europe.
• Figures 15 and 16, and Tables 10–21 pres-ent information on fi nancial developments in emerging markets, including data on equity, foreign exchange, and bond markets, as well as data on emerging market fi nancing fl ows.
• Tables 22–27 report key fi nancial soundness indicators for selected countries, including bank profi tability, asset quality, and capital adequacy.
STATISTICAL APPENDIX
STATISTICAL APPENDIX
122
List of Tables and FiguresKey Financial Centers
Figures 1. Major Net Exporters and Importers of Capital in 2006 123 2. Exchange Rates: Selected Major Industrial Countries 124 3. United States: Yields on Corporate and Treasury Bonds 125 4. Selected Spreads 126 5. Nonfi nancial Corporate Credit Spreads 127 6. Equity Markets: Price Indices 128 7. Implied and Historical Volatility in Equity Markets 129 8. Historical Volatility of Government Bond Yields and Bond Returns for Selected Countries 130 9. Twelve-Month Forward Price/Earnings Ratios 13110. Flows into U.S.-Based Equity Funds 13111. United States: Corporate Bond Market 13212. Europe: Corporate Bond Market 13313. United States: Commercial Paper Market 13414. United States: Asset-Backed Securities 135
Tables 1. Global Capital Flows: Infl ows and Outfl ows 136 2. Global Capital Flows: Amounts Outstanding and Net Issues of International Debt Securities
by Currency of Issue and Announced International Syndicated Credit Facilities by Nationality of Borrower 138
3. Selected Indicators on the Size of the Capital Markets, 2006 139 4. Global Over-the-Counter Derivatives Markets: Notional Amounts and Gross Market Values
of Outstanding Contracts 140 5. Global Over-the-Counter Derivatives Markets: Notional Amounts and Gross Market Values of
Outstanding Contracts by Counterparty, Remaining Maturity, and Currency 141 6. Exchange-Traded Derivative Financial Instruments: Notional Principal Amounts
Outstanding and Annual Turnover 142 7. United States: Sectoral Balance Sheets 144 8. Japan: Sectoral Balance Sheets 145 9. Europe: Sectoral Balance Sheets 146
Emerging Markets
Figures15. Emerging Market Volatility Measures 14716. Emerging Market Debt Cross-Correlation Measures 148
Tables10. Equity Market Indices 14911. Foreign Exchange Rates 15212. Emerging Market Bond Index: EMBI Global Total Returns Index 15413. Emerging Market Bond Index: EMBI Global Yield Spreads 15614. Emerging Market External Financing: Total Bonds, Equities, and Loans 15815. Emerging Market External Financing: Bond Issuance 16016. Emerging Market External Financing: Equity Issuance 16117. Emerging Market External Financing: Loan Syndication 16218. Equity Valuation Measures: Dividend-Yield Ratios 16419. Equity Valuation Measures: Price-to-Book Ratios 16520. Equity Valuation Measures: Price/Earnings Ratios 16621. Emerging Markets: Mutual Fund Flows 167
Financial Soundness Indicators22. Bank Regulatory Capital to Risk-Weighted Assets 16823. Bank Capital to Assets 17024. Bank Nonperforming Loans to Total Loans 17225. Bank Provisions to Nonperforming Loans 17426. Bank Return on Assets 17627. Bank Return on Equity 178

123
Japan11.8%
Germany10.1%
Russia6.6%
Saudi Arabia6.6%
Norway 3.8%
Switzerland4.6%
Netherlands 4.0%
Kuwait 2.9%
Singapore 2.5%
Algeria 2.0%
Sweden 1.9%
United Arab Emirates 2.5%
China17.3%
Other countries2
23.4%
Countries That Export Capital1
Figure 1. Major Net Exporters and Importers of Capital in 2006
Countries That Import Capital3
Other countries4
15.2%
Turkey 2.3%
Italy 3.3%
Greece 2.2%
Australia 3.0%
Spain7.8%
United States59.6%
United Kingdom6.5%
Source: IMF, World Economic Outlook database, as of August 21, 2007.1As measured by countries’ current account surplus (assuming errors and omissions are part of the capital and
financial accounts).2Other countries include all countries with shares of total surplus less than 1.9 percent.3As measured by countries’ current account deficit (assuming errors and omissions are part of the capital and
financial accounts).4Other countries include all countries with shares of total deficit less than 2.2 percent.
KEY FINANCIAL CENTERS

STATISTICAL APPENDIX
124
85
90
95
100
105
110
75
80
85
90
95
100
105
70
80
90
100
110
120
130
140
90
95
100
105
110
95
100
105
110
115
120
90
100
110
120
130
140 0.8
0.9
1.0
1.1
1.2
1.3
1.4
1.3
1.4
1.5
1.6
1.7
1.8
1.9
2.0
2.1 1.0
1.2
1.4
1.6
1.8
2.0
United States
1999 2001 03 05 07
1999 2001 03 05 07 1999 2001 03 05 07
1999 2001 03 05 07 1999 2001 03 05 07
Figure 2. Exchange Rates: Selected Major Industrial Countries(Weekly data)
Bilateral exchange rate (left scale)1
Nominal effective exchange rate (right scale)2
Japan
United Kingdom
Euro Area
Switzerland
Sources: Bloomberg L.P.; and the IMF Global Data System.Note: In each panel, the effective and bilateral exchange rates are scaled so that an upward movement implies an appreciation of the respective local currency.1Local currency units per U.S. dollar except for the euro area and the United Kingdom, for which data are shown as U.S. dollars per local currency.22000 = 100; constructed using 1999–2001 trade weights.

125
0
2
4
6
8
10
12
14
16
18
20
–200
0
200
400
600
800
1000
1200
Merrill Lynch high-yield bond index
Merrill Lynch high-yield bond index
10-year treasury bond
Aaa
Aaa
Baa
Baa
Yields(In percent)
Figure 3. United States: Yields on Corporate and Treasury Bonds(Monthly data)
Yield Differentials with 10-Year U.S. Treasury Bond(In basis points)
1978 80 82 84 86 88 90 92 94 96 98 2000 02 04 06
1978 80 82 84 86 88 90 92 94 96 98 2000 02 04 06
Sources: Bloomberg L.P.; and Merrill Lynch.
KEY FINANCIAL CENTERS
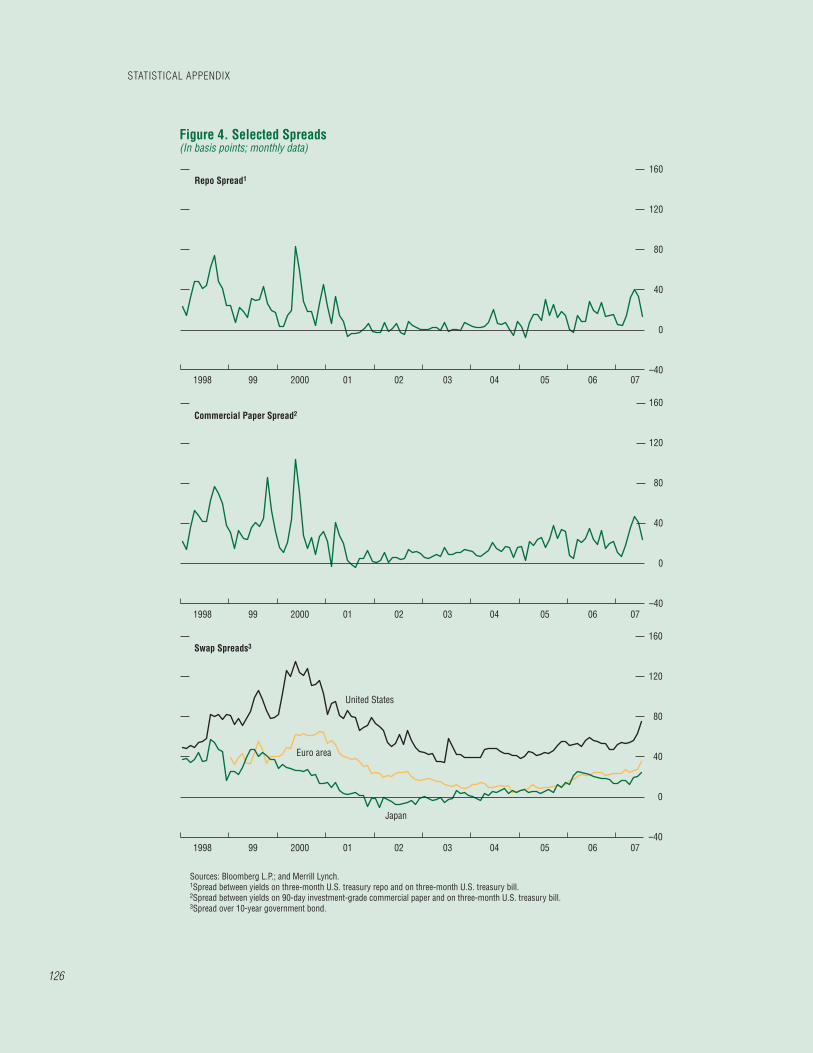
STATISTICAL APPENDIX
126
–40
0
40
80
120
160
–40
0
40
80
120
160
–40
0
40
80
120
160
1998 99 2000 01 02 03 04 05 06 07
1998 99 2000 01 02 03 04 05 06 07
1998 99 2000 01 02 03 04 05 06 07
Figure 4. Selected Spreads(In basis points; monthly data)
United States
Euro area
Japan
Repo Spread1
Commercial Paper Spread2
Swap Spreads3
Sources: Bloomberg L.P.; and Merrill Lynch.1Spread between yields on three-month U.S. treasury repo and on three-month U.S. treasury bill.2Spread between yields on 90-day investment-grade commercial paper and on three-month U.S. treasury bill.3Spread over 10-year government bond.

127
0
20
40
60
80
100
120
0
40
80
120
160
200
0
50
100
150
200
250
300
350
1998 99 2000 01 02 03 04 05 06 07
1998 99 2000 01 02 03 04 05 06 07
1998 99 2000 01 02 03 04 05 06 07
United States
United States
United States
Euro area
Euro area
Euro area
Japan
Japan
Japan
AA Rated
Figure 5. Nonfinancial Corporate Credit Spreads(In basis points; monthly data)
A Rated
BBB Rated
Source: Merrill Lynch.
KEY FINANCIAL CENTERS

STATISTICAL APPENDIX
128
0
200
400
600
800
1000
1200
0
100
200
300
400
500
0
20
40
60
80
100
120
1990 92 94 96 98 2000 02 04 06
1990 92 94 96 98 2000 02 04 06
1990 92 94 96 98 2000 02 04 06
Nasdaq
Wilshire 5000
S&P 500
United States
Europe
Japan
Figure 6. Equity Markets: Price Indices(January 1, 1990 = 100; weekly data)
Germany (DAX)
Europe(FTSE Eurotop 300)
United Kingdom(FTSE All-Share)
Source: Bloomberg L.P.
Topix
Nikkei 225

129
0
10
20
30
40
50
60
70
0
10
20
30
40
50
60
70
0
10
20
30
40
50
60
70
0
10
20
30
40
50
60
70
1998 2000 02 04 06 1998 2000 02 04 06
1998 2000 02 04 06 1998 2000 02 04 06
S&P 500 Nikkei 225
DAX
Figure 7. Implied and Historical Volatility in Equity Markets(Weekly data)
FTSE 100
VIX1
Implied volatility Historical volatility
Sources: Bloomberg L.P.; and IMF staff estimates.Note: Implied volatility is a measure of the equity price variability implied by the market prices of call options on equity futures. Historical volatility is calculated
as a rolling 100-day annualized standard deviation of equity price changes. Volatilities are expressed in percent rate of change.1VIX is the Chicago Board Options Exchange volatility index. This index is calculated by taking a weighted average of implied volatility for the eight S&P 500 calls
and puts.
KEY FINANCIAL CENTERS
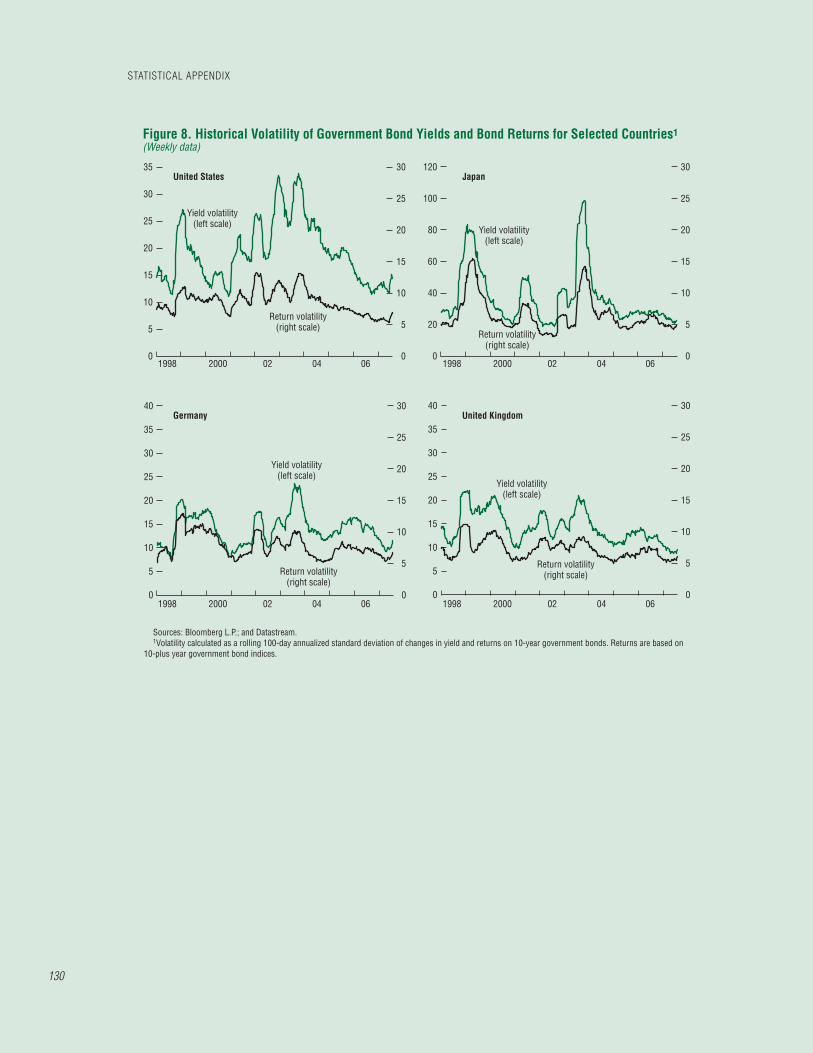
STATISTICAL APPENDIX
130
0
5
10
15
20
25
30
35
0
5
10
15
20
25
30
0
20
40
60
80
100
120
0
5
10
15
20
25
30
0
5
10
15
20
25
30
35
40
0
5
10
15
20
25
30
0
5
10
15
20
25
30
35
40
0
5
10
15
20
25
30
20001998
Yield volatility(left scale)
Yield volatility(left scale)
Yield volatility(left scale)
Yield volatility(left scale)
Return volatility(right scale)
Return volatility(right scale)
Return volatility(right scale)
Return volatility(right scale)
02 04 06 20001998 02 04 06
20001998 02 04 06 20001998 02 04 06
United States
Germany
Japan
United Kingdom
Figure 8. Historical Volatility of Government Bond Yields and Bond Returns for Selected Countries1
(Weekly data)
Sources: Bloomberg L.P.; and Datastream.1Volatility calculated as a rolling 100-day annualized standard deviation of changes in yield and returns on 10-year government bonds. Returns are based on
10-plus year government bond indices.
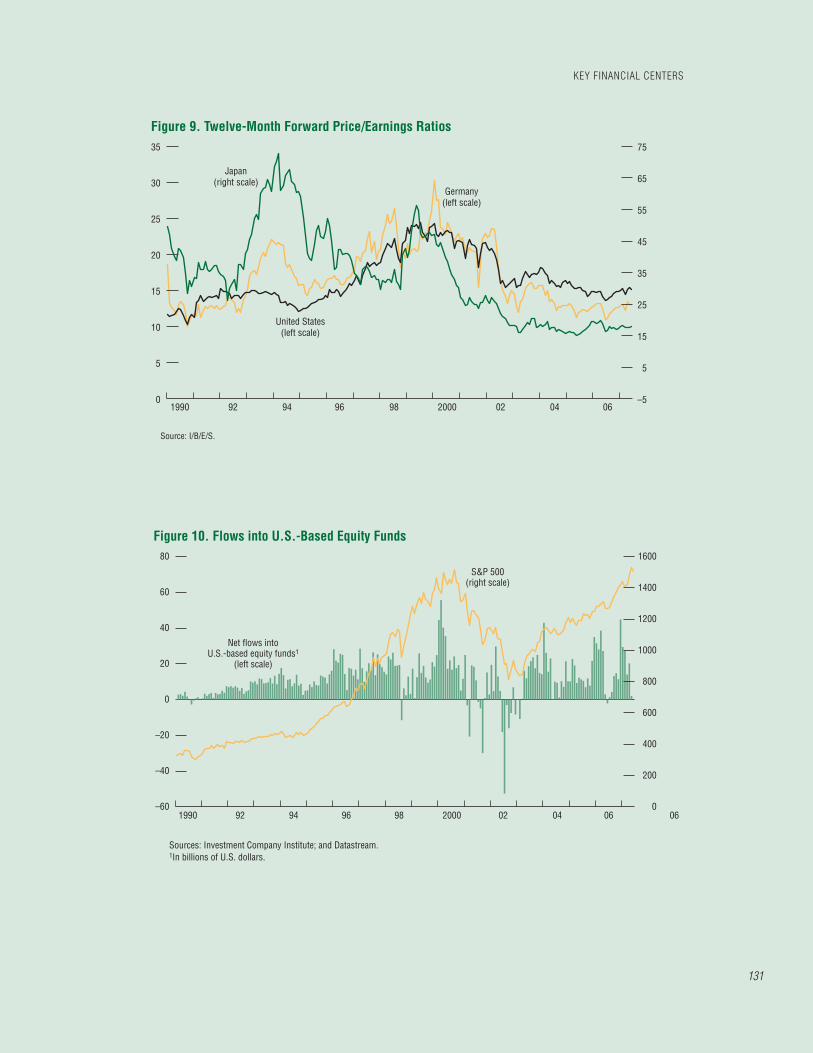
131
0
5
10
15
20
25
30
35
–5
5
15
25
35
45
55
65
75
1990 92 94 96 98 2000 02 04 06
Japan(right scale)
United States(left scale)
Germany(left scale)
Source: I/B/E/S.
Figure 9. Twelve-Month Forward Price/Earnings Ratios
–60
–40
–20
0
20
40
60
80
0
200
400
600
800
1000
1200
1400
1600
921990 94 96 98 2000 02 04 06 06
Net flows intoU.S.-based equity funds1
(left scale)
S&P 500(right scale)
Sources: Investment Company Institute; and Datastream.1In billions of U.S. dollars.
Figure 10. Flows into U.S.-Based Equity Funds
KEY FINANCIAL CENTERS

STATISTICAL APPENDIX
132
0
5
10
15
20
25
30
35
40
45
50
0
5
10
15
20
25
0
0.5
1.0
1.5
2.0
2.5
3.0
0
2
4
6
8
10
12
Investment Grade
High-Yield
Aaa Moody’s spread1
(in percent; right scale)
Merrill Lynch high-yield spread1
(in percent; right scale)
Issuance(in billions of U.S. dollars;
left scale)
Issuance(in billions of U.S. dollars;
left scale)
Figure 11. United States: Corporate Bond Market
1990 92 94 96 98 2000 0402 06
1990 92 94 96 98 2000 0402 06
Sources: Board of Governors of the Federal Reserve System; and Bloomberg L.P.1Spread against yield on 10-year U.S. government bonds.

133
0
200
400
600
800
1000
1200
1400
1600
1800
0
5
10
15
20
25
30
High-Yield Spread2
(In basis points)
European Corporate Bond Issuance(In billions of U.S. dollars)
Sources: Bondware; and Datastream.1Nonfinancial corporate bonds.2Spread between yields on a Merrill Lynch High-Yield European Issuers Index bond and a 10-year German government
benchmark bond.
Figure 12. Europe: Corporate Bond Market1
991998
1989 91 93 95 97 99 2001 03 05 07
2000 01 02 03 04 05 06 07
KEY FINANCIAL CENTERS

STATISTICAL APPENDIX
134
0
20
40
60
80
100
120
140
160
0
50
100
150
200
250
300
350
400
1997 98 99 2000 01 02 03 04 05 06 07
Discount Rate Spread2
(In basis points; weekly data)
Amount Outstanding(In billions of U.S. dollars; monthly data)
Source: Board of Governors of the Federal Reserve System.1Nonfinancial commercial paper.2Difference between 30-day A2/P2 and AA commercial paper.
Figure 13. United States: Commercial Paper Market1
1991 93 95 97 99 2001 03 05 07

135
0
20
40
60
80
100
120
140
160
180
0
500
1000
1500
2000
2500
Automobile
Credit card
Home equity
Student loan
CBO/CDO2
Other
Total Amount Outstanding(In billions of U.S. dollars)
9897961995 99 2000 01 02 03 04 05 06 07:Q1
ABS Spread1
(In basis points)
Figure 14. United States: Asset-Backed Securities
1998 99 2000 01 02 03 04 05 06 07
Sources: Merrill Lynch; Datastream; and the Bond Market Association.1Merrill Lynch AAA Asset-Backed Master Index (fixed rate) option-adjusted spread.2Collateralized bond/debt obligations; for 2007 Q1, CBO/CDO amount outstanding is included in Other.
KEY FINANCIAL CENTERS

STATISTICAL APPENDIX
136
Table 1. Global Capital Flows: Infl ows and Outfl ows1
(In billions of U.S. dollars)Inflows
1996 1997 1998 1999 2000 2001 2002 2003 2004 2005 2006
United States Direct investment 86.5 105.6 179.0 289.4 321.3 167.0 84.4 63.8 145.8 109.0 180.6Portfolio investment 332.8 333.1 187.6 285.6 436.6 428.3 427.6 550.2 867.3 832.0 1,017.4Other investment 131.8 268.1 57.0 165.2 289.0 187.5 285.8 250.4 448.6 263.2 661.6Reserve assets n.a. n.a. n.a. n.a. n.a. n.a. n.a. n.a. n.a. n.a. n.a.Total capital flows 551.1 706.8 423.6 740.2 1,046.9 782.9 797.8 864.4 1,461.8 1,204.2 1,859.6
Canada Direct investment 9.6 11.5 22.7 24.8 66.1 27.7 22.1 7.2 –0.7 29.1 69.1Portfolio investment 13.7 11.7 16.6 2.7 10.3 24.2 11.9 14.1 42.0 7.9 28.7Other investment 15.7 28.0 5.4 –10.8 0.8 7.8 5.1 12.3 –3.9 27.0 28.2Reserve assets n.a. n.a. n.a. n.a. n.a. n.a. n.a. n.a. n.a. n.a. n.a.Total capital flows 39.1 51.2 44.8 16.6 77.2 59.7 39.0 33.6 37.4 64.1 126.0
Japan Direct investment 0.2 3.2 3.3 12.3 8.2 6.2 9.1 6.2 7.8 3.2 –6.8Portfolio investment 66.8 79.2 56.1 126.9 47.4 60.5 –20.0 81.2 196.7 183.1 198.6Other investment 31.1 68.0 –93.3 –265.1 –10.2 –17.6 26.6 34.1 68.3 45.9 –89.1Reserve assets n.a. n.a. n.a. n.a. n.a. n.a. n.a. n.a. n.a. n.a. n.a.Total capital flows 98.1 150.4 –34.0 –125.9 45.4 49.1 15.7 121.5 272.8 232.3 102.6
United Kingdom Direct investment 27.4 37.5 74.7 89.3 122.2 53.8 25.5 27.6 77.9 195.6 139.7Portfolio investment 68.0 43.7 35.2 183.9 255.6 69.6 76.2 155.6 159.9 240.3 288.8Other investment 251.8 322.2 110.5 90.0 414.6 327.0 109.1 396.7 741.2 936.2 817.7Reserve assets n.a. n.a. n.a. n.a. n.a. n.a. n.a. n.a. n.a. n.a. n.a.Total capital flows 347.2 403.4 220.3 363.3 792.4 450.5 210.8 579.9 979.0 1,372.1 1,246.3
Euro Area Direct investment . . . . . . . . . 216.3 416.3 199.8 185.0 151.3 116.0 113.0 198.5Portfolio investment . . . . . . . . . 305.1 268.1 318.3 298.4 399.6 520.1 697.7 941.8Other investment . . . . . . . . . 198.4 340.3 238.1 59.9 198.0 354.6 816.2 963.8Reserve assets n.a. n.a. n.a. n.a. n.a. n.a. n.a. n.a. n.a. n.a. n.a.Total capital flows . . . . . . . . . 719.8 1,024.7 756.3 543.2 748.9 990.7 1,626.9 2,104.1
Emerging Markets and Developing Countries2
Direct investment 148.4 191.5 187.4 213.1 211.7 225.5 182.2 199.6 272.8 361.2 422.3Portfolio investment 174.7 147.0 32.2 102.8 93.3 11.7 –10.3 91.2 141.3 214.1 211.9Other investment 95.4 141.1 –119.6 –77.7 –8.8 –61.6 1.8 124.7 200.5 146.3 358.9Reserve assets n.a. n.a. n.a. n.a. n.a. n.a. n.a. n.a. n.a. n.a. n.a.Total capital flows 418.5 479.6 100.1 238.2 296.1 175.5 173.7 415.5 614.5 721.7 993.2
Sources: International Monetary Fund, International Financial Statistics and World Economic Outlook database as of August 21, 2007.1The total net capital flows are the sum of direct investment, portfolio investment, other investment flows, and reserve assets. “Other
investment” includes bank loans and deposits.2This aggregate comprises the group of Other Emerging Market and Developing Countries defined in the World Economic Outlook, together
with Hong Kong SAR, Israel, Korea, Singapore, and Taiwan Province of China.

KEY FINANCIAL CENTERS
137
Outflows 1996 1997 1998 1999 2000 2001 2002 2003 2004 2005 2006
–91.9 –104.8 –142.6 –224.9 –159.2 –142.4 –154.5 –149.6 –279.1 7.7 –235.4–149.3 –116.9 –130.2 –122.2 –127.9 –90.6 –48.6 –123.1 –153.4 –203.4 –426.1–178.9 –262.8 –74.2 –165.6 –273.1 –144.7 –87.9 –54.3 –475.4 –245.2 –396.1
6.7 –1.0 –6.7 8.7 –0.3 –4.9 –3.7 1.5 2.8 14.1 2.4–413.4 –485.5 –353.8 –504.1 –560.5 –382.6 –294.7 –325.4 –905.0 –426.9 –1,055.2
–13.1 –23.1 –34.1 –17.3 –44.5 –36.2 –26.8 –23.6 –43.0 –33.6 –45.4–14.2 –8.6 –15.1 –15.6 –43.0 –24.4 –18.6 –13.8 –18.9 –44.1 –69.4–21.1 –16.2 9.4 10.2 –4.2 –10.7 –7.9 –14.2 –7.0 –16.6 –30.4–5.5 2.4 –5.0 –5.9 –3.7 –2.2 0.2 3.3 2.8 –1.3 –0.8
–53.9 –45.4 –44.8 –28.5 –95.4 –73.4 –53.2 –48.4 –66.1 –95.6 –146.0
–23.4 –26.1 –24.6 –22.3 –31.5 –38.5 –32.0 –28.8 –31.0 –45.4 –50.2–100.6 –47.1 –95.2 –154.4 –83.4 –106.8 –85.9 –176.3 –173.8 –196.4 –71.0
5.2 –192.0 37.9 266.3 –4.1 46.6 36.4 149.9 –48.0 –106.6 –86.2–35.1 –6.6 6.2 –76.3 –49.0 –40.5 –46.1 –187.2 –160.9 –22.3 –32.0
–154.0 –271.6 –75.8 13.4 –168.0 –139.2 –127.7 –242.3 –413.6 –370.8 –239.4
–36.7 –60.9 –122.8 –202.5 –246.3 –61.8 –50.3 –65.6 –98.2 –91.7 –128.7–93.4 –85.0 –53.2 –34.3 –97.2 –124.7 1.2 –58.4 –259.2 –291.5 –368.1
–214.7 –277.8 –22.9 –97.1 –426.8 –255.5 –151.0 –415.6 –596.9 –931.6 –702.80.7 3.9 0.3 1.0 –5.3 4.5 0.6 2.6 –0.4 –1.7 1.3
–344.1 –419.8 –198.6 –332.9 –775.6 –437.6 –199.5 –537.1 –954.7 –1,316.5 –1,198.3
. . . . . . . . . –348.8 –413.7 –298.0 –163.8 –165.0 –202.4 –372.0 –396.1
. . . . . . . . . –341.7 –385.3 –255.0 –163.2 –316.2 –427.1 –512.0 –594.3
. . . . . . . . . –30.2 –165.8 –243.6 –220.7 –284.1 –392.5 –715.6 –945.9
. . . . . . . . . 11.6 16.2 16.4 –3.0 32.8 15.6 22.9 –5.2
. . . . . . . . . –709.2 –948.7 –780.1 –550.7 –732.5 –1,006.5 –1,576.7 –1,941.4
–31.6 –41.2 –26.6 –34.8 –43.0 –42.5 –33.4 –34.7 –82.4 –106.8 –194.0–85.9 –110.2 –8.7 –46.7 –105.8 –105.1 –91.0 –137.7 –157.5 –257.8 –414.5–93.0 –128.2 35.6 –65.0 –127.7 46.5 31.4 –120.2 –194.3 –241.2 –368.8
–103.5 –88.0 –29.0 –97.3 –132.0 –120.8 –199.5 –360.4 –508.5 –592.4 –746.6–313.9 –367.7 –28.7 –243.8 –408.5 –221.8 –292.5 –653.0 –942.6 –1,198.2 –1,723.8

STATISTICAL APPENDIX
138
Table 2. Global Capital Flows: Amounts Outstanding and Net Issues of International Debt Securities by Currency of Issue and Announced International Syndicated Credit Facilities by Nationality of Borrower(In billions of U.S. dollars)
20072001 2002 2003 2004 2005 2006 Q1
Amounts outstanding of international debt securities by currency of issue
U.S. dollar 3,700.4 4,123.9 4,537.8 4,906.7 5,382.1 6,400.9 6,712.7Japanese yen 411.4 433.2 488.0 530.5 472.1 487.4 497.2Pound sterling 505.6 618.2 776.3 981.0 1,062.6 1,450.5 1,521.9Canadian dollar 47.6 51.6 79.5 112.6 146.7 178.0 196.9Swedish krona 8.2 11.1 15.8 20.9 23.2 34.3 34.6Swiss franc 123.6 159.2 195.6 227.9 208.6 253.7 264.4Euro 2,289.8 3,283.2 4,826.6 6,211.8 6,309.5 8,313.2 8,814.5Other 110.4 152.0 216.7 285.4 355.2 455.8 506.1
Total 7,196.9 8,832.3 11,136.2 13,276.6 13,960.0 17,573.9 18,548.4
Net issues of international debt securities by currency of issue
U.S. dollar 668.8 423.5 413.9 368.9 475.4 1,018.9 311.7Japanese yen 18.5 –17.5 3.7 26.9 3.9 19.4 6.5Pound sterling 65.1 52.4 84.5 133.2 197.6 223.7 74.0Canadian dollar –1.1 3.6 15.6 25.5 29.4 32.1 16.9Swedish krona 1.4 1.1 2.0 3.4 6.2 7.0 1.1Swiss franc –5.2 8.0 15.8 12.7 13.1 28.1 10.5Euro 622.8 492.0 779.0 917.8 987.0 1,208.6 401.3Other 19.3 30.7 38.0 52.6 87.3 79.8 44.1
Total 1,389.6 993.8 1,352.3 1,540.9 1,800.0 2,617.7 866.0
Announced international syndicated credit facilities by nationality of borrower
All countries 1,381.4 1,296.9 1,241.4 1,806.7 2,232.3 2,121.2 451.6Industrial countries 1,270.3 1,199.9 1,131.0 1,636.7 1,990.9 1,822.3 358.2
Of which: United States 845.2 739.7 606.6 897.5 978.5 848.0 195.5Japan 23.8 19.5 18.2 27.5 19.3 42.9 20.0Germany 36.5 84.4 97.6 116.3 132.1 170.8 4.3France 50.3 64.1 65.9 150.9 171.8 119.3 33.1Italy 35.9 22.8 45.3 22.3 74.0 26.0 7.1United Kingdom 106.0 109.8 103.9 150.3 178.6 136.3 33.5Canada 39.2 34.9 30.4 38.7 71.2 73.9 8.3
Source: Bank for International Settlements.
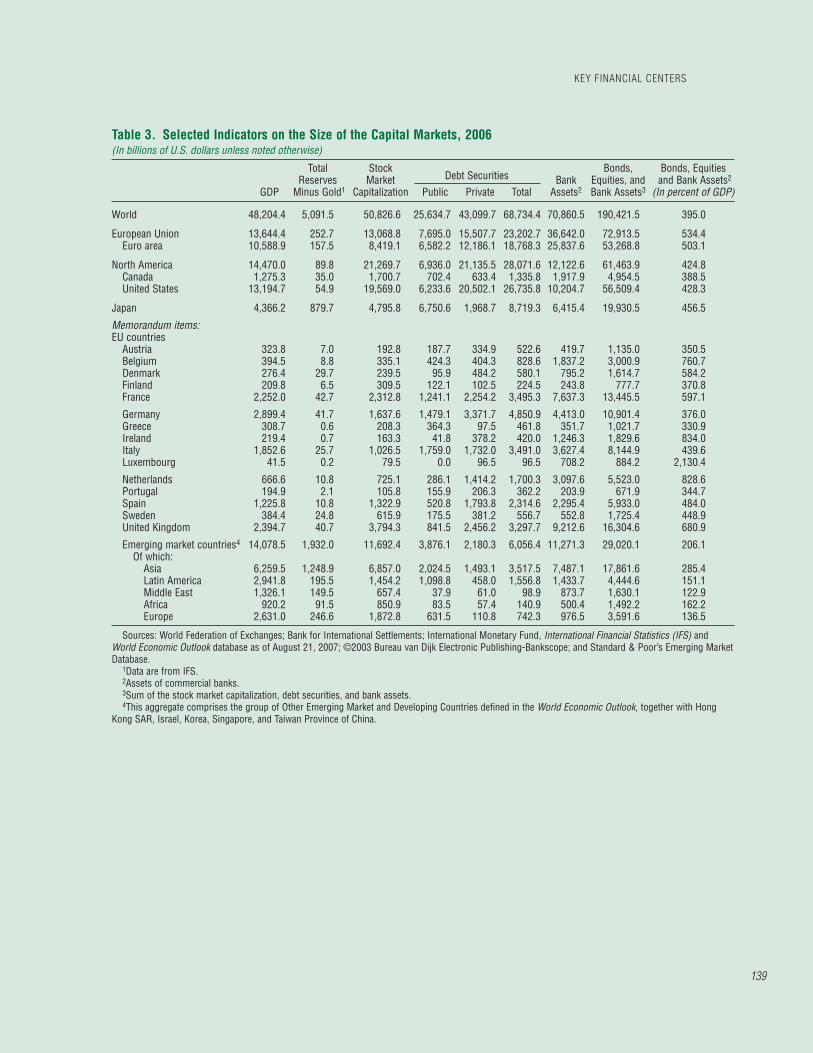
139
Table 3. Selected Indicators on the Size of the Capital Markets, 2006(In billions of U.S. dollars unless noted otherwise)
GDP
Total Reserves
Minus Gold1
StockMarket
CapitalizationBank
Assets2
Bonds,Equities, andBank Assets3
Bonds, Equities and Bank Assets2
(In percent of GDP)Debt Securities
Public Private Total
World 48,204.4 5,091.5 50,826.6 25,634.7 43,099.7 68,734.4 70,860.5 190,421.5 395.0
European Union 13,644.4 252.7 13,068.8 7,695.0 15,507.7 23,202.7 36,642.0 72,913.5 534.4Euro area 10,588.9 157.5 8,419.1 6,582.2 12,186.1 18,768.3 25,837.6 53,268.8 503.1
North America 14,470.0 89.8 21,269.7 6,936.0 21,135.5 28,071.6 12,122.6 61,463.9 424.8Canada 1,275.3 35.0 1,700.7 702.4 633.4 1,335.8 1,917.9 4,954.5 388.5United States 13,194.7 54.9 19,569.0 6,233.6 20,502.1 26,735.8 10,204.7 56,509.4 428.3
Japan 4,366.2 879.7 4,795.8 6,750.6 1,968.7 8,719.3 6,415.4 19,930.5 456.5
Memorandum items: EU countries
Austria 323.8 7.0 192.8 187.7 334.9 522.6 419.7 1,135.0 350.5Belgium 394.5 8.8 335.1 424.3 404.3 828.6 1,837.2 3,000.9 760.7Denmark 276.4 29.7 239.5 95.9 484.2 580.1 795.2 1,614.7 584.2Finland 209.8 6.5 309.5 122.1 102.5 224.5 243.8 777.7 370.8France 2,252.0 42.7 2,312.8 1,241.1 2,254.2 3,495.3 7,637.3 13,445.5 597.1
Germany 2,899.4 41.7 1,637.6 1,479.1 3,371.7 4,850.9 4,413.0 10,901.4 376.0Greece 308.7 0.6 208.3 364.3 97.5 461.8 351.7 1,021.7 330.9Ireland 219.4 0.7 163.3 41.8 378.2 420.0 1,246.3 1,829.6 834.0Italy 1,852.6 25.7 1,026.5 1,759.0 1,732.0 3,491.0 3,627.4 8,144.9 439.6Luxembourg 41.5 0.2 79.5 0.0 96.5 96.5 708.2 884.2 2,130.4
Netherlands 666.6 10.8 725.1 286.1 1,414.2 1,700.3 3,097.6 5,523.0 828.6Portugal 194.9 2.1 105.8 155.9 206.3 362.2 203.9 671.9 344.7Spain 1,225.8 10.8 1,322.9 520.8 1,793.8 2,314.6 2,295.4 5,933.0 484.0Sweden 384.4 24.8 615.9 175.5 381.2 556.7 552.8 1,725.4 448.9United Kingdom 2,394.7 40.7 3,794.3 841.5 2,456.2 3,297.7 9,212.6 16,304.6 680.9
Emerging market countries4 14,078.5 1,932.0 11,692.4 3,876.1 2,180.3 6,056.4 11,271.3 29,020.1 206.1Of which:
Asia 6,259.5 1,248.9 6,857.0 2,024.5 1,493.1 3,517.5 7,487.1 17,861.6 285.4Latin America 2,941.8 195.5 1,454.2 1,098.8 458.0 1,556.8 1,433.7 4,444.6 151.1Middle East 1,326.1 149.5 657.4 37.9 61.0 98.9 873.7 1,630.1 122.9Africa 920.2 91.5 850.9 83.5 57.4 140.9 500.4 1,492.2 162.2Europe 2,631.0 246.6 1,872.8 631.5 110.8 742.3 976.5 3,591.6 136.5
Sources: World Federation of Exchanges; Bank for International Settlements; International Monetary Fund, International Financial Statistics (IFS) and World Economic Outlook database as of August 21, 2007; ©2003 Bureau van Dijk Electronic Publishing-Bankscope; and Standard & Poor’s Emerging Market Database.
1Data are from IFS. 2Assets of commercial banks. 3Sum of the stock market capitalization, debt securities, and bank assets. 4This aggregate comprises the group of Other Emerging Market and Developing Countries defined in the World Economic Outlook, together with Hong
Kong SAR, Israel, Korea, Singapore, and Taiwan Province of China.
KEY FINANCIAL CENTERS

STATISTICAL APPENDIX
140
Table 4. Global Over-the-Counter Derivatives Markets: Notional Amounts and Gross Market Values of Outstanding Contracts1
(In billions of U.S. dollars)
Notional Amounts Gross Market ValuesEnd-Dec. End-June End-Dec. End-June End-Dec. End-Dec. End-June End-Dec. End-June End-Dec.
2004 2005 2005 2006 2006 2004 2005 2005 2006 2006
Total 257,894 281,493 297,670 369,507 415,183 9,377 10,605 9,749 9,936 9,695Foreign exchange 29,289 31,081 31,364 38,091 40,179 1,546 1,141 997 1,134 1,262Forwards and forex swaps 14,951 15,801 15,873 19,396 19,828 643 464 406 435 467Currency swaps 8,223 8,236 8,504 9,669 10,772 745 549 453 533 600Options 6,115 7,045 6,987 9,027 9,579 158 129 138 166 196Interest rate2 190,502 204,795 211,971 261,960 291,987 5,417 6,699 5,397 5,436 4,834Forward rate agreements 12,789 13,973 14,269 18,117 18,689 22 31 22 25 31Swaps 150,631 163,749 169,106 207,043 229,780 4,903 6,077 4,778 4,831 4,166Options 27,082 27,073 28,596 36,800 43,518 492 592 597 579 636Equity-linked 4,385 4,551 5,793 6,782 7,485 498 382 582 671 851Forwards and swaps 756 1,086 1,177 1,431 1,764 76 88 112 147 165Options 3,629 3,465 4,617 5,351 5,721 422 294 470 523 687Commodity3 1,443 2,940 5,435 6,394 6,938 169 376 871 718 668Gold 369 288 334 456 463 32 24 51 77 56Other 1,074 2,652 5,100 5,938 6,475 137 351 820 641 611
Forwards and swaps 559 1,748 1,909 2,188 2,813 . . . . . . . . . . . . . . .Options 516 904 3,191 3,750 3,663 . . . . . . . . . . . . . . .
Credit default swaps 6,396 10,211 13,908 20,352 28,838 134 188 243 294 470Single-name instruments 5,117 7,310 10,432 13,873 18,885 112 136 171 186 289Multi-name instruments 1,279 2,901 3,476 6,479 9,953 22 52 72 109 181Unallocated 25,879 27,915 29,199 35,928 39,755 1,613 1,818 1,659 1,683 1,610
Memorandum items:Gross credit exposure4 n.a. n.a. n.a. n.a. n.a. 2,075 1,897 1,900 2,029 2,045Exchange-traded derivatives 29,289 31,081 31,364 38,091 40,179 . . . . . . . . . . . . . . .
Source: Bank for International Settlements.1All figures are adjusted for double-counting. Notional amounts outstanding have been adjusted by halving positions vis-à-vis other reporting dealers. Gross market values
have been calculated as the sum of the total gross positive market value of contracts and the absolute value of the gross negative market value of contracts with non-reporting counterparties.
2Single-currency contracts only.3Adjustments for double-counting are estimated.4Gross market values after taking into account legally enforceable bilateral netting agreements.

KEY FINANCIAL CENTERS
141
Table 5. Global Over-the-Counter Derivatives Markets: Notional Amounts and Gross Market Values of Outstanding Contracts by Counterparty, Remaining Maturity, and Currency1
(In billions of U.S. dollars)
Notional Amounts Gross Market ValuesEnd-Dec. End-June End-Dec. End-June End-Dec. End-Dec. End-June End-Dec. End-June End-Dec.
2004 2005 2005 2006 2006 2004 2005 2005 2006 2006
Total 257,894 281,493 297,670 369,507 415,183 9,377 10,605 9,749 9,936 9,695
Foreign exchange 29,289 31,081 31,364 38,091 40,179 1,546 1,141 997 1,134 1,262By counterparty
With other reporting dealers 11,668 12,179 12,161 15,278 15,597 486 377 323 367 437With other financial institutions 11,417 12,334 12,721 15,118 15,878 648 471 412 471 520With nonfinancial customers 6,204 6,568 6,482 7,695 8,704 413 294 261 296 306
By remaining maturity2
Up to one year 22,834 24,256 23,910 29,563 30,228 . . . . . . . . . . . . . . .One to five years 4,386 4,729 5,165 5,837 6,658 . . . . . . . . . . . . . . .Over five years 2,069 2,097 2,289 2,691 3,293 . . . . . . . . . . . . . . .
By major currency3
U.S. dollar 25,726 27,585 26,297 31,756 33,775 1,408 1,024 867 967 1,066Euro 11,900 12,405 12,857 15,340 15,907 752 512 397 472 508Japanese yen 7,076 6,907 7,578 9,504 9,548 258 220 256 242 323Pound sterling 4,331 4,273 4,424 5,217 6,128 220 150 121 148 197Other 9,545 10,994 11,572 14,365 15,000 455 377 354 439 431
Interest rate4 190,502 204,795 211,971 261,960 291,987 5,417 6,699 5,397 5,436 4,834By counterparty
With other reporting dealers 82,258 87,049 91,541 114,465 126,445 2,155 2,598 2,096 2,215 1,954With other financial institutions 85,729 92,092 95,321 114,865 127,215 2,631 3,265 2,625 2,515 2,252With nonfinancial customers 22,516 25,655 25,109 32,630 38,327 631 837 676 706 628
By remaining maturity2
Up to one year 62,659 66,681 69,378 90,585 104,207 . . . . . . . . . . . . . . .One to five years 77,929 82,341 86,550 101,608 110,417 . . . . . . . . . . . . . . .Over five years 49,915 55,773 56,042 69,767 77,362 . . . . . . . . . . . . . . .
By major currency U.S. dollar 61,103 72,558 74,441 88,022 97,612 1,535 1,826 1,515 2,117 1,665Euro 76,162 76,426 81,442 103,429 112,116 2,986 3,692 2,965 2,298 2,306Japanese yen 24,209 25,224 25,605 32,146 37,954 352 454 295 457 295Pound sterling 15,289 16,621 15,060 19,066 22,274 240 372 344 291 311Other 13,740 13,966 15,422 19,296 22,031 305 356 279 273 257
Equity-linked 4,385 4,551 5,793 6,782 7,485 498 382 582 671 851
Commodity5 1,443 2,940 5,435 6,394 6,938 169 376 871 718 668
Credit default swaps 6,396 10,211 13,908 20,352 28,838 134 188 243 294 470
Unallocated 25,879 27,915 29,199 35,928 39,755 1,613 1,818 1,659 1,683 1,610
Source: Bank for International Settlements. 1All figures are adjusted for double-counting. Notional amounts outstanding have been adjusted by halving positions vis-à-vis other reporting dealers. Gross market values
have been calculated as the sum of the total gross positive market value of contracts and the absolute value of the gross negative market value of contracts with non-reporting counterparties.
2Residual maturity.3Counting both currency sides of each foreign exchange transaction means that the currency breakdown sums to twice the aggregate.4Single-currency contracts only.5Adjustments for double-counting are estimated.
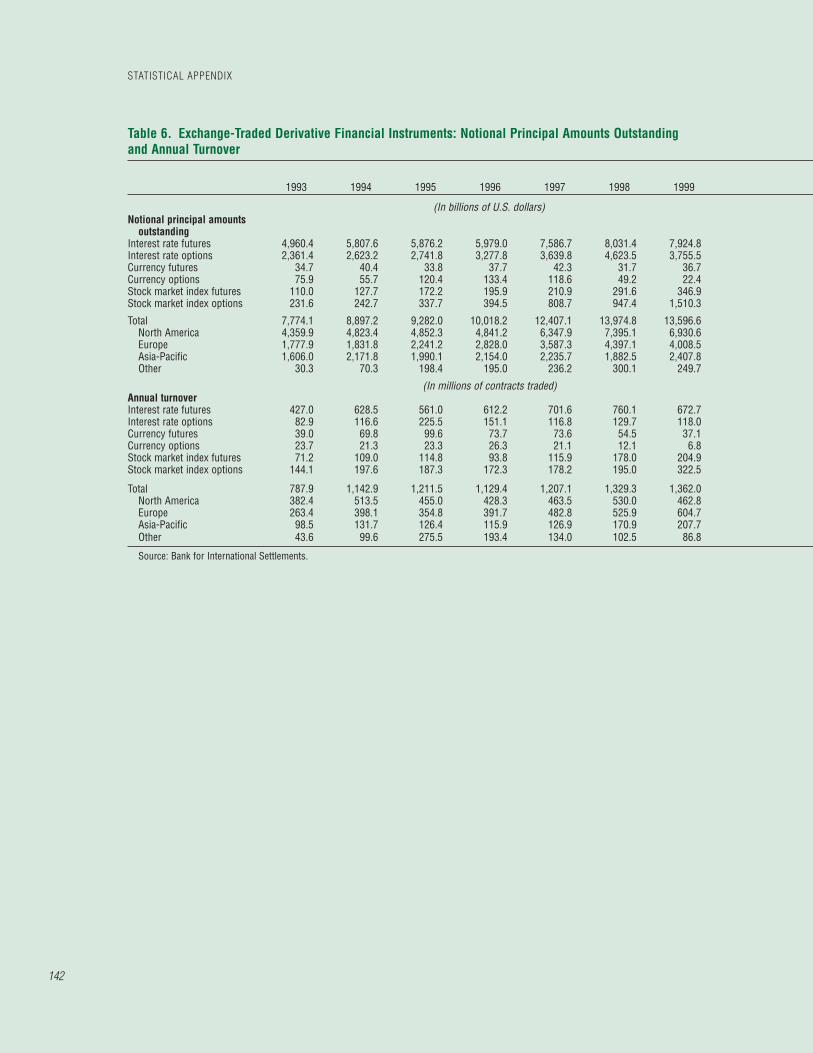
Table 6. Exchange-Traded Derivative Financial Instruments: Notional Principal Amounts Outstanding and Annual Turnover
1993 1994 1995 1996 1997 1998 1999
(In billions of U.S. dollars)Notional principal amounts
outstandingInterest rate futures 4,960.4 5,807.6 5,876.2 5,979.0 7,586.7 8,031.4 7,924.8Interest rate options 2,361.4 2,623.2 2,741.8 3,277.8 3,639.8 4,623.5 3,755.5Currency futures 34.7 40.4 33.8 37.7 42.3 31.7 36.7Currency options 75.9 55.7 120.4 133.4 118.6 49.2 22.4Stock market index futures 110.0 127.7 172.2 195.9 210.9 291.6 346.9Stock market index options 231.6 242.7 337.7 394.5 808.7 947.4 1,510.3
Total 7,774.1 8,897.2 9,282.0 10,018.2 12,407.1 13,974.8 13,596.6North America 4,359.9 4,823.4 4,852.3 4,841.2 6,347.9 7,395.1 6,930.6Europe 1,777.9 1,831.8 2,241.2 2,828.0 3,587.3 4,397.1 4,008.5Asia-Pacific 1,606.0 2,171.8 1,990.1 2,154.0 2,235.7 1,882.5 2,407.8Other 30.3 70.3 198.4 195.0 236.2 300.1 249.7
(In millions of contracts traded)Annual turnoverInterest rate futures 427.0 628.5 561.0 612.2 701.6 760.1 672.7Interest rate options 82.9 116.6 225.5 151.1 116.8 129.7 118.0Currency futures 39.0 69.8 99.6 73.7 73.6 54.5 37.1Currency options 23.7 21.3 23.3 26.3 21.1 12.1 6.8Stock market index futures 71.2 109.0 114.8 93.8 115.9 178.0 204.9Stock market index options 144.1 197.6 187.3 172.3 178.2 195.0 322.5
Total 787.9 1,142.9 1,211.5 1,129.4 1,207.1 1,329.3 1,362.0North America 382.4 513.5 455.0 428.3 463.5 530.0 462.8Europe 263.4 398.1 354.8 391.7 482.8 525.9 604.7Asia-Pacific 98.5 131.7 126.4 115.9 126.9 170.9 207.7Other 43.6 99.6 275.5 193.4 134.0 102.5 86.8
Source: Bank for International Settlements.
STATISTICAL APPENDIX
142
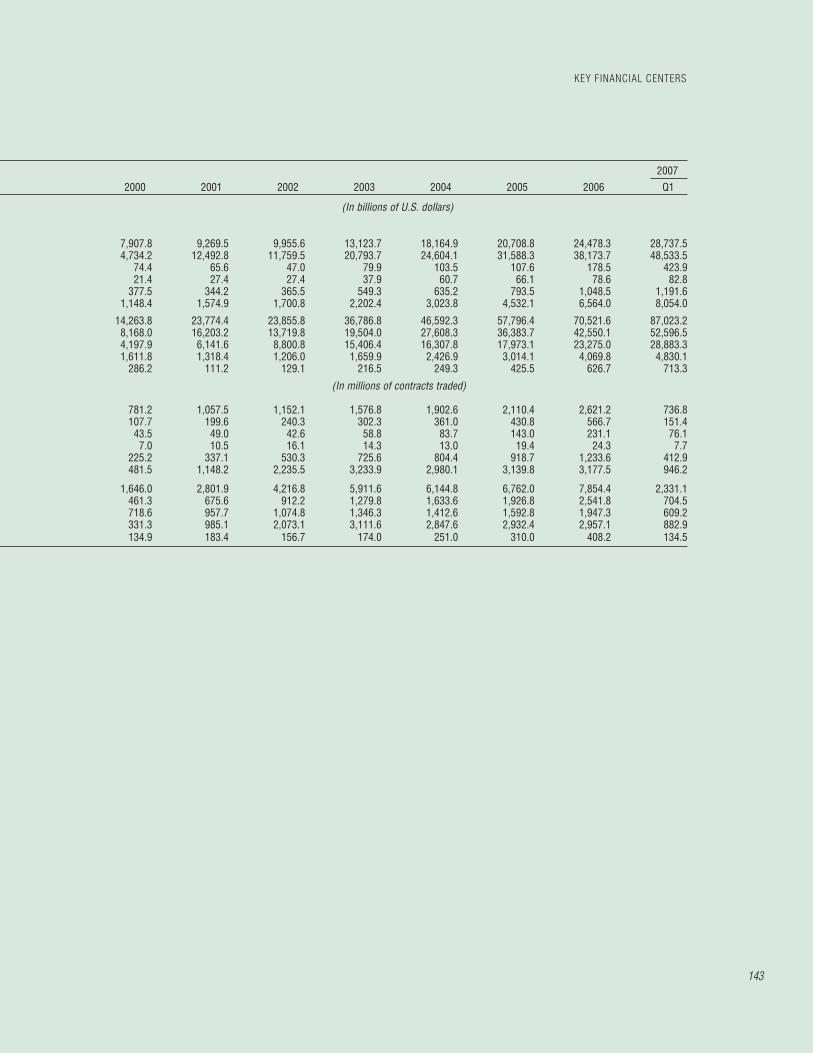
20072000 2001 2002 2003 2004 2005 2006 Q1
(In billions of U.S. dollars)
7,907.8 9,269.5 9,955.6 13,123.7 18,164.9 20,708.8 24,478.3 28,737.54,734.2 12,492.8 11,759.5 20,793.7 24,604.1 31,588.3 38,173.7 48,533.5
74.4 65.6 47.0 79.9 103.5 107.6 178.5 423.921.4 27.4 27.4 37.9 60.7 66.1 78.6 82.8
377.5 344.2 365.5 549.3 635.2 793.5 1,048.5 1,191.61,148.4 1,574.9 1,700.8 2,202.4 3,023.8 4,532.1 6,564.0 8,054.0
14,263.8 23,774.4 23,855.8 36,786.8 46,592.3 57,796.4 70,521.6 87,023.28,168.0 16,203.2 13,719.8 19,504.0 27,608.3 36,383.7 42,550.1 52,596.54,197.9 6,141.6 8,800.8 15,406.4 16,307.8 17,973.1 23,275.0 28,883.31,611.8 1,318.4 1,206.0 1,659.9 2,426.9 3,014.1 4,069.8 4,830.1
286.2 111.2 129.1 216.5 249.3 425.5 626.7 713.3
(In millions of contracts traded)
781.2 1,057.5 1,152.1 1,576.8 1,902.6 2,110.4 2,621.2 736.8107.7 199.6 240.3 302.3 361.0 430.8 566.7 151.443.5 49.0 42.6 58.8 83.7 143.0 231.1 76.17.0 10.5 16.1 14.3 13.0 19.4 24.3 7.7
225.2 337.1 530.3 725.6 804.4 918.7 1,233.6 412.9481.5 1,148.2 2,235.5 3,233.9 2,980.1 3,139.8 3,177.5 946.2
1,646.0 2,801.9 4,216.8 5,911.6 6,144.8 6,762.0 7,854.4 2,331.1461.3 675.6 912.2 1,279.8 1,633.6 1,926.8 2,541.8 704.5718.6 957.7 1,074.8 1,346.3 1,412.6 1,592.8 1,947.3 609.2331.3 985.1 2,073.1 3,111.6 2,847.6 2,932.4 2,957.1 882.9134.9 183.4 156.7 174.0 251.0 310.0 408.2 134.5
KEY FINANCIAL CENTERS
143

STATISTICAL APPENDIX
144
Table 7. United States: Sectoral Balance Sheets(In percent)
2001 2002 2003 2004 2005 2006Corporate sectorDebt/net worth 50.8 49.7 47.6 44.3 42.0 40.7Short-term debt/total debt 33.3 30.0 27.1 26.9 27.4 27.1Interest burden1 17.7 14.4 11.8 8.7 8.1 8.4
Household sectorNet worth/assets 82.8 80.2 92.4 89.2 80.9 80.7
Equity/total assets 26.8 20.6 27.3 26.5 23.3 23.8Equity/financial assets 41.7 34.3 38.7 39.1 38.4 39.0
Net worth/disposable personal income 539.4 495.7 538.7 552.5 560.4 583.4Home mortgage debt/total assets 10.9 12.3 14.4 14.5 13.9 14.1Consumer credit/total assets 3.9 4.2 4.4 4.1 3.6 3.5Total debt/financial assets 25.5 30.2 29.2 30.2 31.4 31.6Debt-service burden2 13.1 13.4 13.5 13.5 14.1 14.4
Banking sector3
Credit qualityNonperforming loans4/total loans 1.4 1.5 1.2 0.9 0.8 0.8Net loan losses/average total loans 1.0 1.1 0.9 0.7 0.6 0.4Loan-loss reserve/total loans 1.9 1.9 1.8 1.5 1.3 1.2Net charge-offs/total loans 1.0 1.1 0.9 0.6 0.6 0.4
Capital ratiosTotal risk-based capital 12.7 12.8 12.8 12.6 12.3 13.0Tier 1 risk-based capital 9.9 10.0 10.1 10.0 9.9 10.5Equity capital/total assets 9.0 9.2 9.2 10.1 10.3 10.5Core capital (leverage ratio) 7.8 7.8 7.9 7.8 7.9 7.9
Profitability measuresReturn on average assets (ROA) 1.2 1.3 1.4 1.3 1.3 1.4Return on average equity (ROE) 13.2 14.5 15.3 13.7 13.3 13.5Net interest margin 3.9 4.1 3.8 3.6 3.6 3.4Efficiency ratio5 57.7 55.8 56.5 58.0 57.2 57.1
Sources: Board of Governors of the Federal Reserve System, Flow of Funds; Department of Commerce, Bureau of Economic Analysis; Federal Deposit Insurance Corporation; and Federal Reserve Bank of St. Louis.
1Ratio of net interest payments to pre-tax income.2Ratio of debt payments to disposable personal income. 3FDIC-insured commercial banks.4Loans past due 90+ days and nonaccrual.5Noninterest expense less amortization of intangible assets as a percent of net interest income plus noninterest income.

KEY FINANCIAL CENTERS
145
Table 8. Japan: Sectoral Balance Sheets1
(In percent)
FY2000 FY2001 FY2002 FY2003 FY2004 FY2005 FY2006Corporate sectorDebt/shareholders’ equity (book value) 156.8 156.0 146.1 121.3 121.5 101.7 98.2Short-term debt/total debt 37.7 36.8 39.0 37.8 36.8 36.4 35.3Interest burden2 28.4 32.3 27.8 22.0 18.4 15.6 15.2Debt/operating profits 1,229.3 1,480.0 1,370.0 1,079.2 965.9 839.9 820.4
Memorandum item:Total debt/GDP3 103.9 102.0 100.9 90.9 96.5 85.7 89.9
Household sectorNet worth/assets 84.7 84.5 84.4 84.5 84.6 85.1 . . .
Equity 4.7 3.6 3.5 4.9 5.7 8.8 . . .Real estate 36.6 35.7 34.6 32.9 31.4 29.7 . . .
Net worth/net disposable income 752.2 744.9 725.2 728.5 723.0 746.0 . . .Interest burden4 5.4 5.2 5.1 4.9 4.8 4.7 . . .
Memorandum item: Debt/equity 324.5 427.2 448.2 317.6 268.4 169.4 . . .Debt/real estate 41.7 43.2 45.1 47.1 49.0 50.3 . . .Debt/net disposable income 135.4 136.1 134.2 133.2 131.5 131.1 . . .Debt/net worth 18.0 18.3 18.5 18.3 18.2 17.6 . . .Equity/net worth 5.5 4.3 4.1 5.8 6.8 10.4 . . .Real estate/net worth 43.2 42.3 41.0 38.9 37.1 35.0 . . .Total debt/GDP3 80.3 80.2 79.4 77.5 76.1 75.6 . . .
Banking sectorCredit quality
Nonperforming loans5/total loans 6.3 8.4 7.4 5.8 4.0 2.9 2.5Capital ratio
Stockholders’ equity/assets 4.6 3.9 3.3 3.9 4.2 4.9 5.3Profitability measures
Return on equity (ROE)6 –0.5 –14.3 –19.5 –2.7 4.1 11.3 8.5
Sources: Ministry of Finance, Financial Statements of Corporations by Industries; Cabinet Office, Economic and Social Research Institute, Annual Report on National Accounts; Japanese Bankers Association, Financial Statements of All Banks; and Financial Services Agency, TheStatus of Nonperforming Loans.
1Data are fiscal year beginning April 1. Stock data on households are only available through FY2005.2Interest payments as a percent of operating profits.3Revised due to the change in GDP figures.4Interest payments as a percent of disposable income.5Nonperforming loans are based on figures reported under the Financial Reconstruction Law. 6Net income as a percentage of stockholders’ equity (no adjustment for preferred stocks, etc.).

STATISTICAL APPENDIX
146
Table 9. Europe: Sectoral Balance Sheets1
(In percent)
2000 2001 2002 2003 2004 2005 2006Corporate sector Debt/equity2 68.0 72.5 75.9 73.1 71.7 73.8 77.3Short-term debt/total debt 37.4 36.8 35.2 35.1 35.0 37.1 39.0Interest burden3 18.3 19.4 18.4 17.1 17.4 18.1 19.8Debt/operating profits 315.7 321.6 338.7 327.9 326.2 348.3 381.2
Memorandum items: Financial assets/equity 1.5 1.5 1.4 1.4 1.4 1.5 1.5Liquid assets/short-term debt 73.6 76.6 77.0 83.3 91.0 95.6 93.7
Household sector Net worth/assets 84.5 83.9 83.9 84.0 84.1 84.6 84.9
Equity/net worth 15.5 13.5 10.8 11.4 11.4 12.0 11.9Equity/net financial assets 39.8 36.5 31.8 33.1 33.3 34.1 33.8
Interest burden4 6.5 6.2 6.1 6.0 5.7 5.7 5.8
Memorandum items: Nonfinancial assets/net worth 59.7 61.7 65.7 65.6 65.9 64.6 64.7Debt/net financial assets 46.1 48.4 53.3 51.6 51.6 47.6 47.0Debt/income 94.6 94.8 98.2 100.8 105.6 106.9 110.6
Banking sector5
Credit quality Nonperforming loans/total loans 3.0 2.9 2.5 2.3 2.4 2.2 2.2 Loan-loss reserve/nonperforming loans 82.1 80.8 81.5 73.0 67.8 74.6 67.8Loan-loss reserve/total loans 2.5 2.4 2.4 2.4 1.9 1.6 1.5
Capital ratios Equity capital/total assets 4.3 3.3 3.1 2.9 3.5 3.5 3.5Capital funds/liabilities 6.9 6.8 5.4 5.0 5.7 5.6 5.7
Profitability measures Return on assets (after tax) 0.8 0.5 0.4 0.5 0.5 0.5 0.6Return on equity (after tax) 18.3 11.2 9.0 11.3 13.7 15.0 16.7Net interest margin 1.5 1.4 1.6 1.5 1.1 1.0 0.9Efficiency ratio6 66.4 68.2 69.0 73.1 64.3 62.6 60.2
Sources: ©2003 Bureau van Dijk Electronic Publishing-Bankscope; European Central Bank, Monthly Bulletin; and IMF staff estimates.1GDP-weighted average for France, Germany, and the United Kingdom, unless otherwise noted.2Corporate equity adjusted for changes in asset valuation.3Interest payments as a percent of gross operating profits.4Interest payments as percent of disposable income.5Fifty largest European banks. Data availability may restrict coverage to less than 50 banks for specific indicators.6Cost-to-income ratio.
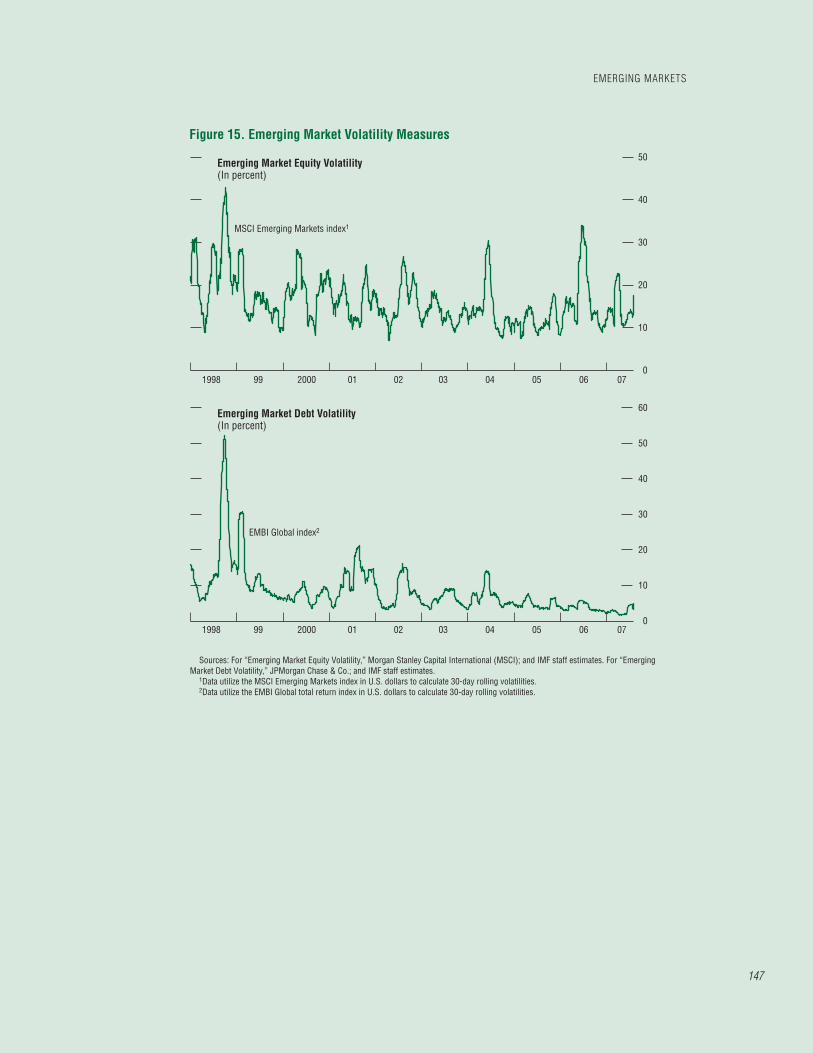
EMERGING MARKETS
147
0
10
20
30
40
50
60
0
10
20
30
40
50
Figure 15. Emerging Market Volatility Measures
MSCI Emerging Markets index1
EMBI Global index2
Emerging Market Equity Volatility(In percent)
Emerging Market Debt Volatility(In percent)
1998 99 2000 01 02 03 04 05 06 07
1998 99 2000 01 02 03 04 05 06 07
Sources: For “Emerging Market Equity Volatility,” Morgan Stanley Capital International (MSCI); and IMF staff estimates. For “EmergingMarket Debt Volatility,” JPMorgan Chase & Co.; and IMF staff estimates.
1Data utilize the MSCI Emerging Markets index in U.S. dollars to calculate 30-day rolling volatilities.2Data utilize the EMBI Global total return index in U.S. dollars to calculate 30-day rolling volatilities.

STATISTICAL APPENDIX
148
0
0.1
0.2
0.3
0.4
0.5
0.6
0.7
0
0.1
0.2
0.3
0.4
0.5
0.6
0.7
0
0.1
0.2
0.3
0.4
0.5
0.6
0.7
0
0.1
0.2
0.3
0.4
0.5
0.6
0.7
Figure 16. Emerging Market Debt Cross-Correlation Measures
2000 01 02 03 04 05 06 07
2000 01 02 03 04 05 06 07
Average Cross-Correlations, 2000–071
Average Regional Cross-Correlations, 2000–072
Overall
Overall
Latin America
Latin America
Asia
Asia
Emerging Europe,Middle East, and Africa
Emerging Europe,Middle East, and Africa
Average Cross-Correlations, 2005–071
Average Regional Cross-Correlations, 2005–072
Sources: JPMorgan Chase & Co.; and IMF staff estimates.1Thirty-day moving simple average across all pair-wise return correlations of 20 constituents included in the EMBI Global.2Simple average of all pair-wise correlations of all markets in a given region with all other bond markets, regardless of region.
2005 2006 2007
2005 2006 2007

149
Table 10. Equity Market Indices2007
End of Period 2006 End of Period End of Period 12-
MonthHigh
12-MonthLow
All-Time High1
All-Time Low1Q1 Q2 Q1 Q2 Q3 Q4 2002 2003 2004 2005 2006
World 1,514.2 1,602.4 1,335.1 1,319.9 1,373.4 1,483.6 792.2 1,036.3 1,169.3 1,257.8 1,483.6 1,630.1 1,261.0 1,630.1 423.1
Emerging Markets 929.0 1,059.7 787.8 747.5 778.2 912.7 292.1 442.8 542.2 706.5 912.7 1,067.0 710.3 1,067.0 175.3
Latin America 3,163.2 3,754.2 2,469.4 2,368.2 2,473.1 2,995.7 658.9 1,100.9 1,483.6 2,150.0 2,995.7 3,838.6 2,237.7 3,838.6 185.6Argentina 3,014.6 3,188.6 2,370.3 2,473.9 2,307.7 3,084.1 470.3 933.6 1,163.0 1,857.1 3,084.1 3,342.8 2,227.6 3,342.8 152.6Brazil 2,325.9 2,857.3 1,886.2 1,821.9 1,790.8 2,205.4 395.4 802.0 1,046.6 1,569.4 2,205.4 2,921.6 1,673.8 2,921.6 84.1Chile 1,592.6 1,891.2 1,263.7 1,169.3 1,262.8 1,492.4 445.5 800.6 997.3 1,180.7 1,492.4 1,891.2 1,111.7 1,891.2 183.0Colombia 516.9 604.2 580.4 395.3 470.7 549.8 68.3 108.6 245.0 495.7 549.8 627.4 385.9 627.4 41.2Mexico 5,802.9 6,497.0 4,216.0 4,016.0 4,645.1 5,483.3 1,442.8 1,873.1 2,715.6 3,943.6 5,483.3 6,764.2 3,877.5 6,764.2 308.9Peru 828.2 1,089.4 483.5 543.7 598.7 671.4 182.7 344.1 343.4 441.3 671.4 1,091.6 522.2 1,091.6 73.5Venezuela 154.3 178.6 161.1 151.4 156.2 174.1 77.7 103.8 151.0 107.4 174.1 202.5 103.9 278.4 56.1
Asia 370.1 435.6 311.9 303.7 322.9 371.5 140.4 206.4 231.6 286.2 371.5 440.6 286.6 440.6 104.1China 51.3 63.2 35.6 35.7 38.6 52.3 14.1 25.5 25.3 29.3 52.3 64.1 34.8 136.9 12.9India 530.6 598.6 459.2 427.5 501.4 560.8 148.8 246.2 273.1 382.9 560.8 598.6 402.8 598.6 77.7Indonesia 2,433.2 2,757.2 1,831.5 1,808.8 2,108.2 2,449.0 519.6 831.1 1,324.0 1,579.8 2,449.0 2,761.5 1,755.7 2,761.5 280.0Korea 404.8 469.6 386.0 365.3 384.0 395.2 184.7 246.0 256.4 386.3 395.2 489.4 346.3 489.4 59.5Malaysia 471.7 508.1 345.9 338.5 356.8 408.8 244.0 300.4 335.9 329.0 408.8 523.5 332.7 523.5 88.3Pakistan 381.2 462.6 407.3 335.8 355.4 333.7 146.0 188.2 211.7 333.3 333.7 462.6 322.0 462.6 54.4Philippines 660.3 762.0 460.4 445.6 531.1 620.2 210.1 303.7 381.1 431.9 620.2 780.7 444.7 917.3 132.6Taiwan Province of China 312.8 352.2 279.7 279.5 286.2 318.3 189.5 259.1 257.7 275.8 318.3 355.2 258.5 483.5 103.9Thailand 272.9 312.8 293.5 271.3 280.7 274.9 130.2 280.5 263.9 292.0 274.9 315.4 246.4 669.4 72.0
Europe, Middle East, & Africa 376.1 391.4 342.6 306.5 306.3 364.4 108.4 163.9 222.7 300.3 364.4 396.9 291.3 396.9 80.8
Czech Republic 436.6 490.2 394.5 357.7 369.8 408.3 116.2 152.9 234.8 371.5 408.3 490.2 337.7 490.2 62.8Egypt 1,431.5 1,553.6 1,320.0 960.0 1,266.1 1,389.3 97.4 234.6 505.3 1,215.7 1,389.3 1,588.2 967.9 1,588.2 89.9Hungary 1,594.7 1,965.5 1,586.2 1,450.7 1,446.0 1,690.0 535.5 646.9 1,057.0 1,447.0 1,690.0 2,008.1 1,396.0 2,008.1 77.1Israel 213.1 232.9 201.4 176.4 187.7 194.4 90.8 141.4 167.4 209.3 194.4 242.1 165.7 242.1 67.6Jordan 481.5 445.6 554.4 486.0 482.2 439.6 153.5 238.3 379.2 650.6 439.6 515.3 422.7 760.7 103.1Morocco 424.4 418.6 315.3 303.6 333.5 342.9 138.5 171.4 189.1 231.3 342.9 461.7 294.5 461.7 99.6Poland 2,451.5 2,594.7 1,980.2 1,953.5 1,979.1 2,253.2 861.0 1,118.3 1,419.3 1,867.4 2,253.2 2,627.4 1,933.3 2,627.4 99.6Russia 1,212.7 1,202.4 1,043.6 1,065.0 1,067.4 1,250.3 270.7 461.1 479.9 813.4 1,250.3 1,252.3 993.9 1,252.3 30.6South Africa 699.5 695.4 561.3 548.3 553.3 641.3 272.7 296.8 352.4 492.0 641.3 742.7 516.9 742.7 99.7Turkey 686,668 731,869 682,935 558,350 581,504 614,409 169,900 319,808 425,008 645,739 614,409 755,480 509,075 777,492 426
SectorsEnergy 723.4 807.1 680.6 680.6 654.5 760.0 163.1 287.4 349.0 548.6 760.0 807.1 619.3 807.1 81.7Materials 496.6 559.8 374.6 382.2 374.5 442.1 182.8 250.1 265.0 325.4 442.1 572.5 362.5 572.5 98.5Industrials 229.1 294.4 175.0 166.8 181.5 210.7 61.8 98.9 128.0 156.1 210.7 294.4 158.5 294.4 52.6Consumer discretionary 441.2 479.7 398.4 352.5 370.3 422.6 138.8 233.8 292.3 381.1 422.6 484.0 327.6 484.0 74.1Consumer staple 269.3 301.1 225.1 211.4 226.1 266.2 88.2 118.6 147.0 197.0 266.2 309.8 206.0 309.8 80.4Health care 382.2 420.8 405.5 328.0 350.5 356.3 169.8 272.5 290.8 393.3 356.3 420.8 308.8 433.8 83.3Financials 330.6 372.4 269.1 250.3 266.0 328.8 98.6 138.8 187.9 240.6 328.8 376.8 237.2 376.8 74.6Information technology 220.0 243.4 212.9 202.6 216.4 231.8 103.9 149.6 161.5 209.1 231.8 247.0 187.8 300.0 73.1Telecommunications 226.6 259.9 169.7 158.4 180.7 218.0 72.7 100.8 131.6 158.9 218.0 260.7 152.8 260.7 62.9Utilities 288.0 342.8 229.6 217.8 232.2 282.1 72.4 127.2 149.8 197.0 282.1 342.8 206.8 342.8 63.1
EMERGING MARKETS

STATISTICAL APPENDIX
150
Table 10 (continued)Period on Period Percent Change
2007End of period 2006 End of period End of period
Q1 Q2 Q1 Q2 Q3 Q4 2002 2003 2004 2005 2006World 24.0 5.8 6.1 –1.1 4.0 8.0 –21.1 30.8 12.8 7.6 18.0
Emerging Markets 1.8 14.1 11.5 –5.1 4.1 17.3 –8.0 51.6 22.4 30.3 29.2
Latin America 5.6 18.7 14.9 –4.1 4.4 21.1 –24.8 67.1 34.8 44.9 39.3Argentina –2.3 5.8 27.6 4.4 –6.7 33.6 –51.0 98.5 24.6 59.7 66.1Brazil 5.5 22.8 20.2 –3.4 –1.7 23.2 –33.8 102.9 30.5 50.0 40.5Chile 6.7 18.8 7.0 –7.5 8.0 18.2 –21.7 79.7 24.6 18.4 26.4Colombia –6.0 16.9 17.1 –31.9 19.1 16.8 18.3 59.0 125.7 102.3 10.9Mexico 5.8 12.0 6.9 –4.7 15.7 18.0 –15.0 29.8 45.0 45.2 39.0Peru 23.4 31.5 9.6 12.4 10.1 12.1 26.8 88.4 –0.2 28.5 52.1Venezuela –11.4 15.8 50.0 –6.0 3.1 11.5 –18.6 33.6 45.4 –28.9 62.2
Asia –0.4 17.7 9.0 –2.6 6.3 15.0 –6.2 47.1 12.2 23.5 29.8China –1.8 23.0 21.5 0.3 8.2 35.4 –16.0 80.3 –0.7 15.6 78.7India –5.4 12.8 19.9 –6.9 17.3 11.8 5.3 65.5 11.0 40.2 46.5Indonesia –0.6 13.3 15.9 –1.2 16.6 16.2 18.9 60.0 59.3 19.3 55.0Korea 2.4 16.0 –0.1 –5.4 5.1 2.9 –3.0 33.2 4.2 50.6 2.3Malaysia 15.4 7.7 5.1 –2.1 5.4 14.6 –2.7 23.1 11.8 –2.1 24.2Pakistan 14.2 21.3 22.2 –17.5 5.8 –6.1 116.7 28.9 12.5 57.5 0.1Philippines 6.5 15.4 6.6 –3.2 19.2 16.8 –28.1 44.5 25.5 13.3 43.6Taiwan Province of China –1.7 12.6 1.4 –0.1 2.4 11.2 –25.8 36.7 –0.6 7.0 15.4Thailand –0.7 14.6 0.5 –7.6 3.5 –2.1 21.1 115.4 –5.9 10.6 –5.9
Europe, Middle East, & Africa 3.2 4.1 14.1 –10.5 –0.1 19.0 4.7 51.2 35.8 34.9 21.3
Czech Republic 6.9 12.3 6.2 –9.3 3.4 10.4 19.2 31.6 53.6 58.2 9.9Egypt 3.0 8.5 8.6 –27.3 31.9 9.7 –4.4 140.8 115.4 140.6 14.3Hungary –5.6 23.3 9.6 –8.5 –0.3 16.9 5.4 20.8 63.4 36.9 16.8Israel 9.7 9.3 –3.8 –12.4 6.4 3.6 –31.6 55.7 18.4 25.0 –7.1Jordan 9.5 –7.4 –14.8 –12.3 –0.8 –8.8 2.6 55.3 59.1 71.6 –32.4Morocco 23.8 –1.4 36.3 –3.7 9.9 2.8 –23.1 23.8 10.4 22.3 48.3Poland 8.8 5.8 6.0 –1.4 1.3 13.9 –3.5 29.9 26.9 31.6 20.7Russia –3.0 –0.8 28.3 2.0 0.2 17.1 13.9 70.3 4.1 69.5 53.7South Africa 9.1 –0.6 14.1 –2.3 0.9 15.9 –11.8 8.8 18.7 39.6 30.3Turkey 11.8 6.6 5.8 –18.2 4.1 5.7 –27.5 88.2 32.9 51.9 –4.9
Sectors Energy –4.8 11.6 24.0 0.0 –3.8 16.1 0.6 76.2 21.4 57.2 38.5Materials 12.3 12.7 15.1 2.0 –2.0 18.1 5.2 36.8 6.0 22.8 35.9Industrials 8.7 28.5 12.1 –4.7 8.8 16.1 –3.2 60.1 29.5 22.0 35.0Consumer discretionary 4.4 8.7 4.5 –11.5 5.0 14.1 6.3 68.4 25.0 30.4 10.9Consumer staple 1.2 11.8 14.2 –6.1 6.9 17.8 –6.7 34.4 24.0 34.0 35.1Health care 7.3 10.1 3.1 –19.1 6.9 1.6 15.9 60.5 6.7 35.2 –9.4Financials 0.5 12.6 11.8 –7.0 6.2 23.6 –8.4 40.7 35.4 28.1 36.7Information technology –5.1 10.6 1.8 –4.8 6.8 7.1 –22.6 43.9 8.0 29.5 10.9Telecommunications 3.9 14.7 6.8 –6.6 14.0 20.7 –20.9 38.7 30.5 20.8 37.2Utilities 2.1 19.0 16.5 –5.1 6.6 21.5 –20.9 75.7 17.8 31.5 43.2

151
Table 10 (concluded)2007
End of Period 2006 End of Period End of Period12-
MonthHigh
12-MonthLow
All-TimeHigh1
All-TimeLow1Q1 Q2 Q1 Q2 Q3 Q4 2002 2003 2004 2005 2006
Developed Markets Australia 1,200.5 1,254.1 1,036.4 1,025.2 1,037.9 1,135.1 604.4 655.5 797.9 959.6 1,135.1 1,279.1 986.5 1,279.1 250.2Austria 331.6 339.7 290.3 266.1 277.3 316.6 91.8 118.0 185.3 262.7 316.6 348.9 256.1 348.9 79.7Belgium 116.3 117.4 102.0 95.5 106.8 113.0 55.3 60.1 77.9 94.8 113.0 121.0 92.9 121.0 35.4Canada 1,659.0 1,750.7 1,518.8 1,448.9 1,464.4 1,628.3 818.3 1,019.7 1,139.3 1,406.8 1,628.3 1,786.3 1,426.2 1,786.3 338.3Denmark 3,884.7 4,066.3 3,161.1 2,997.2 3,285.4 3,662.6 1,448.8 1,772.7 2,115.9 2,994.0 3,662.6 4,198.4 2,898.5 4,198.4 556.5Finland 151.6 170.6 141.2 129.6 132.4 140.3 100.3 97.4 93.9 123.4 140.3 176.3 121.6 383.1 22.9France 149.8 159.3 137.8 131.3 138.9 147.1 81.3 93.2 100.6 124.9 147.1 162.9 125.1 178.6 42.9Germany 123.5 138.8 108.8 100.6 106.4 116.9 56.0 74.6 79.2 98.2 116.9 140.3 95.3 163.6 41.4Greece 133.2 136.7 121.1 109.1 115.7 127.3 46.8 63.6 83.3 108.1 127.3 142.4 103.5 197.2 38.2Hong Kong SAR 10,223.1 10,681.2 8,556.6 8,438.1 8,940.4 10,152.8 4,808.4 6,341.3 7,668.5 8,016.2 10,152.8 . . . . . . . . . . . .Ireland 117.3 119.0 104.2 97.9 107.0 120.3 56.8 65.9 85.2 93.5 120.3 126.8 93.2 126.8 40.5Italy 121.3 121.4 112.3 107.7 113.5 121.4 69.6 78.1 93.2 106.0 121.4 128.7 104.2 132.1 39.5Japan 1,081.6 1,123.3 1,061.4 980.5 1,001.1 1,060.2 524.3 637.3 699.1 999.3 1,060.2 1,146.6 912.5 1,655.3 462.1Netherlands 107.7 113.5 95.9 88.9 98.6 101.3 66.0 68.4 69.3 88.3 101.3 115.0 85.5 134.9 38.5New Zealand 136.0 141.0 135.7 124.5 123.7 138.2 90.0 107.6 127.0 130.0 138.2 145.2 117.3 145.2 56.7Norway 3,094.2 3,368.7 2,710.5 2,499.8 2,454.9 2,951.8 898.3 1,240.9 1,690.3 2,267.7 2,951.8 3,368.7 2,330.6 3,368.7 455.9Portugal 109.2 123.9 97.1 90.1 97.5 105.5 57.0 66.1 74.7 82.2 105.5 124.4 88.8 128.0 35.2Singapore 1,850.2 2,033.2 1,398.8 1,352.4 1,431.3 1,696.1 764.9 1,005.1 1,148.1 1,295.4 1,696.1 2,089.9 1,282.4 2,089.9 508.2Spain 162.8 166.2 133.4 129.4 144.9 158.2 69.9 89.6 104.3 122.1 158.2 173.0 124.9 173.0 27.4Sweden 9,624.1 10,011.1 8,366.7 7,434.4 8,083.7 9,047.5 3,517.4 4,675.2 5,785.4 7,489.8 9,047.5 10,338.8 6,914.6 12,250.4 787.2Switzerland 1,183.9 1,215.0 1,052.8 1,005.2 1,104.4 1,159.5 603.2 714.3 747.1 994.6 1,159.5 1,256.8 978.4 1,256.8 158.1United Kingdom 1,897.2 1,978.1 1,785.9 1,742.6 1,782.6 1,865.6 1,179.2 1,348.7 1,453.0 1,685.3 1,865.6 2,016.6 1,692.4 2,016.6 585.4United States 1,344.0 1,420.3 1,224.1 1,199.3 1,257.9 1,336.3 824.6 1,045.4 1,137.4 1,180.6 1,336.3 1,454.5 1,162.9 1,493.0 273.7
Period on Period Percent ChangeDeveloped Markets Australia 5.8 4.5 8.0 –1.1 1.2 9.4 –12.5 8.5 21.7 20.3 18.3 . . . . . . . . . . . .Austria 4.7 2.5 10.5 –8.3 4.2 14.2 –3.0 28.5 57.0 41.7 20.5 . . . . . . . . . . . .Belgium 2.9 1.0 7.7 –6.4 11.9 5.7 –29.7 8.7 29.5 21.7 19.2 . . . . . . . . . . . .Canada 1.9 5.5 8.0 –4.6 1.1 11.2 –15.3 24.6 11.7 23.5 15.7 . . . . . . . . . . . .Denmark 6.1 4.7 5.6 –5.2 9.6 11.5 –29.7 22.4 19.4 41.5 22.3 . . . . . . . . . . . .Finland 8.0 12.6 14.4 –8.2 2.2 6.0 –41.6 –2.9 –3.6 31.4 13.7 . . . . . . . . . . . .France 1.8 6.4 10.4 –4.7 5.8 5.9 –34.0 14.6 7.9 24.2 17.8 . . . . . . . . . . . .Germany 5.6 12.5 10.7 –7.5 5.8 9.9 –44.0 33.2 6.1 24.1 19.0 . . . . . . . . . . . .Greece 4.6 2.7 12.0 –9.9 6.1 10.0 –39.1 35.8 31.1 29.8 17.7 . . . . . . . . . . . .Hong Kong SAR 0.7 4.5 6.7 –1.4 6.0 13.6 –20.6 31.9 20.9 4.5 26.7 . . . . . . . . . . . .Ireland –2.5 1.5 11.4 –6.0 9.3 12.4 –39.0 16.0 29.2 9.8 28.7 . . . . . . . . . . . .Italy –0.1 0.0 6.0 –4.1 5.4 6.9 –23.6 12.2 19.3 13.8 14.6 . . . . . . . . . . . .Japan 2.0 3.9 6.2 –7.6 2.1 5.9 –19.4 21.6 9.7 42.9 6.1 . . . . . . . . . . . .Netherlands 6.4 5.3 8.6 –7.3 10.9 2.7 –34.3 3.6 1.3 27.5 14.7 . . . . . . . . . . . .New Zealand –1.5 3.7 4.4 –8.3 –0.6 11.7 –4.4 19.6 18.0 2.4 6.3 . . . . . . . . . . . .Norway 4.8 8.9 19.5 –7.8 –1.8 20.2 –29.7 38.1 36.2 34.2 30.2 . . . . . . . . . . . .Portugal 3.6 13.4 18.2 –7.3 8.2 8.2 –28.3 15.9 13.1 10.0 28.3 . . . . . . . . . . . .Singapore 9.1 9.9 8.0 –3.3 5.8 18.5 –18.4 31.4 14.2 12.8 30.9 . . . . . . . . . . . .Spain 2.9 2.1 9.2 –3.0 12.0 9.1 –29.5 28.3 16.4 17.0 29.5 . . . . . . . . . . . .Sweden 6.4 4.0 11.7 –11.1 8.7 11.9 –43.1 32.9 23.7 29.5 20.8 . . . . . . . . . . . .Switzerland 2.1 2.6 5.8 –4.5 9.9 5.0 –25.8 18.4 4.6 33.1 16.6 . . . . . . . . . . . .United Kingdom 1.7 4.3 6.0 –2.4 2.3 4.7 –25.7 14.4 7.7 16.0 10.7 . . . . . . . . . . . .United States 0.6 5.7 3.7 –2.0 4.9 6.2 –24.0 26.8 8.8 3.8 13.2 . . . . . . . . . . . .
Source: Data are provided by Morgan Stanley Capital International. Regional and sectoral compositions conform to Morgan Stanley Capital International Definitions.1From 1990 or initiation of the index.
EMERGING MARKETS
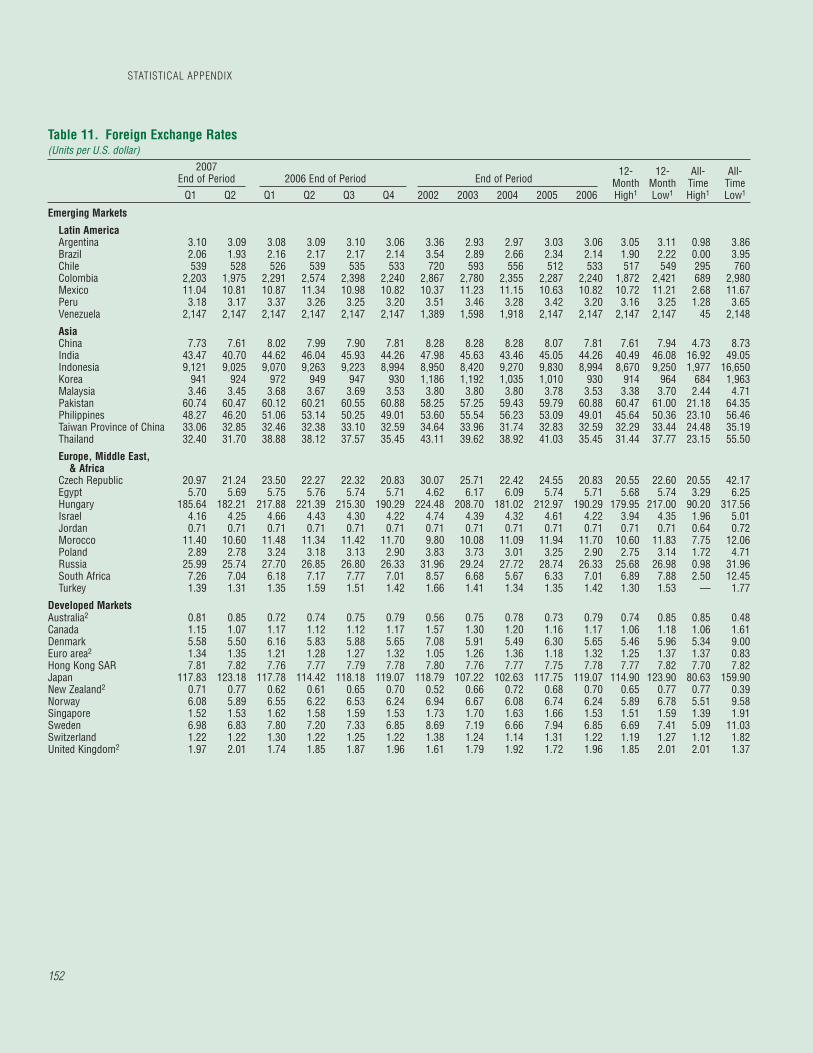
STATISTICAL APPENDIX
152
Table 11. Foreign Exchange Rates(Units per U.S. dollar)
2007End of Period 2006 End of Period End of Period
12-MonthHigh1
12-MonthLow1
All-Time High1
All-Time Low1Q1 Q2 Q1 Q2 Q3 Q4 2002 2003 2004 2005 2006
Emerging Markets
Latin America Argentina 3.10 3.09 3.08 3.09 3.10 3.06 3.36 2.93 2.97 3.03 3.06 3.05 3.11 0.98 3.86Brazil 2.06 1.93 2.16 2.17 2.17 2.14 3.54 2.89 2.66 2.34 2.14 1.90 2.22 0.00 3.95Chile 539 528 526 539 535 533 720 593 556 512 533 517 549 295 760 Colombia 2,203 1,975 2,291 2,574 2,398 2,240 2,867 2,780 2,355 2,287 2,240 1,872 2,421 689 2,980 Mexico 11.04 10.81 10.87 11.34 10.98 10.82 10.37 11.23 11.15 10.63 10.82 10.72 11.21 2.68 11.67Peru 3.18 3.17 3.37 3.26 3.25 3.20 3.51 3.46 3.28 3.42 3.20 3.16 3.25 1.28 3.65Venezuela 2,147 2,147 2,147 2,147 2,147 2,147 1,389 1,598 1,918 2,147 2,147 2,147 2,147 45 2,148
Asia China 7.73 7.61 8.02 7.99 7.90 7.81 8.28 8.28 8.28 8.07 7.81 7.61 7.94 4.73 8.73India 43.47 40.70 44.62 46.04 45.93 44.26 47.98 45.63 43.46 45.05 44.26 40.49 46.08 16.92 49.05Indonesia 9,121 9,025 9,070 9,263 9,223 8,994 8,950 8,420 9,270 9,830 8,994 8,670 9,250 1,977 16,650 Korea 941 924 972 949 947 930 1,186 1,192 1,035 1,010 930 914 964 684 1,963 Malaysia 3.46 3.45 3.68 3.67 3.69 3.53 3.80 3.80 3.80 3.78 3.53 3.38 3.70 2.44 4.71Pakistan 60.74 60.47 60.12 60.21 60.55 60.88 58.25 57.25 59.43 59.79 60.88 60.47 61.00 21.18 64.35Philippines 48.27 46.20 51.06 53.14 50.25 49.01 53.60 55.54 56.23 53.09 49.01 45.64 50.36 23.10 56.46Taiwan Province of China 33.06 32.85 32.46 32.38 33.10 32.59 34.64 33.96 31.74 32.83 32.59 32.29 33.44 24.48 35.19Thailand 32.40 31.70 38.88 38.12 37.57 35.45 43.11 39.62 38.92 41.03 35.45 31.44 37.77 23.15 55.50
Europe, Middle East, & Africa
Czech Republic 20.97 21.24 23.50 22.27 22.32 20.83 30.07 25.71 22.42 24.55 20.83 20.55 22.60 20.55 42.17Egypt 5.70 5.69 5.75 5.76 5.74 5.71 4.62 6.17 6.09 5.74 5.71 5.68 5.74 3.29 6.25Hungary 185.64 182.21 217.88 221.39 215.30 190.29 224.48 208.70 181.02 212.97 190.29 179.95 217.00 90.20 317.56Israel 4.16 4.25 4.66 4.43 4.30 4.22 4.74 4.39 4.32 4.61 4.22 3.94 4.35 1.96 5.01Jordan 0.71 0.71 0.71 0.71 0.71 0.71 0.71 0.71 0.71 0.71 0.71 0.71 0.71 0.64 0.72Morocco 11.40 10.60 11.48 11.34 11.42 11.70 9.80 10.08 11.09 11.94 11.70 10.60 11.83 7.75 12.06Poland 2.89 2.78 3.24 3.18 3.13 2.90 3.83 3.73 3.01 3.25 2.90 2.75 3.14 1.72 4.71Russia 25.99 25.74 27.70 26.85 26.80 26.33 31.96 29.24 27.72 28.74 26.33 25.68 26.98 0.98 31.96South Africa 7.26 7.04 6.18 7.17 7.77 7.01 8.57 6.68 5.67 6.33 7.01 6.89 7.88 2.50 12.45Turkey 1.39 1.31 1.35 1.59 1.51 1.42 1.66 1.41 1.34 1.35 1.42 1.30 1.53 — 1.77
Developed Markets Australia2 0.81 0.85 0.72 0.74 0.75 0.79 0.56 0.75 0.78 0.73 0.79 0.74 0.85 0.85 0.48Canada 1.15 1.07 1.17 1.12 1.12 1.17 1.57 1.30 1.20 1.16 1.17 1.06 1.18 1.06 1.61Denmark 5.58 5.50 6.16 5.83 5.88 5.65 7.08 5.91 5.49 6.30 5.65 5.46 5.96 5.34 9.00Euro area2 1.34 1.35 1.21 1.28 1.27 1.32 1.05 1.26 1.36 1.18 1.32 1.25 1.37 1.37 0.83Hong Kong SAR 7.81 7.82 7.76 7.77 7.79 7.78 7.80 7.76 7.77 7.75 7.78 7.77 7.82 7.70 7.82Japan 117.83 123.18 117.78 114.42 118.18 119.07 118.79 107.22 102.63 117.75 119.07 114.90 123.90 80.63 159.90New Zealand2 0.71 0.77 0.62 0.61 0.65 0.70 0.52 0.66 0.72 0.68 0.70 0.65 0.77 0.77 0.39Norway 6.08 5.89 6.55 6.22 6.53 6.24 6.94 6.67 6.08 6.74 6.24 5.89 6.78 5.51 9.58Singapore 1.52 1.53 1.62 1.58 1.59 1.53 1.73 1.70 1.63 1.66 1.53 1.51 1.59 1.39 1.91Sweden 6.98 6.83 7.80 7.20 7.33 6.85 8.69 7.19 6.66 7.94 6.85 6.69 7.41 5.09 11.03Switzerland 1.22 1.22 1.30 1.22 1.25 1.22 1.38 1.24 1.14 1.31 1.22 1.19 1.27 1.12 1.82United Kingdom2 1.97 2.01 1.74 1.85 1.87 1.96 1.61 1.79 1.92 1.72 1.96 1.85 2.01 2.01 1.37
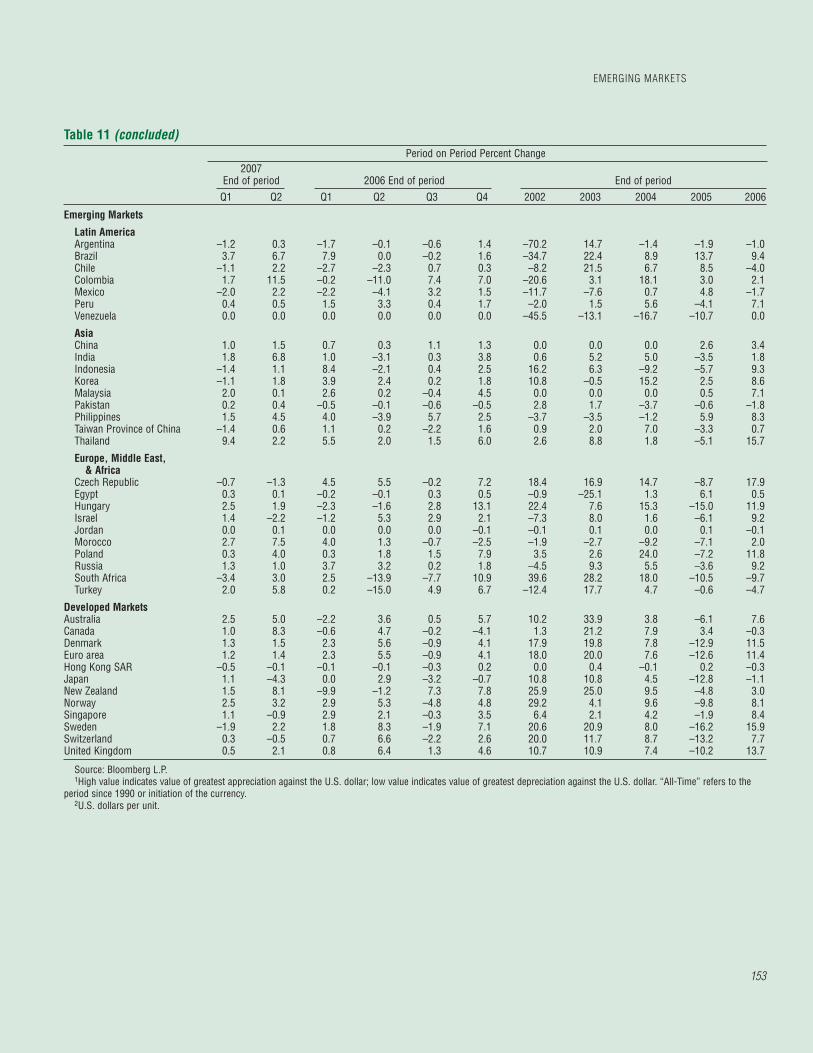
153
Table 11 (concluded)Period on Period Percent Change
2007End of period 2006 End of period End of period
Q1 Q2 Q1 Q2 Q3 Q4 2002 2003 2004 2005 2006
Emerging Markets
Latin America Argentina –1.2 0.3 –1.7 –0.1 –0.6 1.4 –70.2 14.7 –1.4 –1.9 –1.0Brazil 3.7 6.7 7.9 0.0 –0.2 1.6 –34.7 22.4 8.9 13.7 9.4Chile –1.1 2.2 –2.7 –2.3 0.7 0.3 –8.2 21.5 6.7 8.5 –4.0Colombia 1.7 11.5 –0.2 –11.0 7.4 7.0 –20.6 3.1 18.1 3.0 2.1Mexico –2.0 2.2 –2.2 –4.1 3.2 1.5 –11.7 –7.6 0.7 4.8 –1.7Peru 0.4 0.5 1.5 3.3 0.4 1.7 –2.0 1.5 5.6 –4.1 7.1Venezuela 0.0 0.0 0.0 0.0 0.0 0.0 –45.5 –13.1 –16.7 –10.7 0.0
Asia China 1.0 1.5 0.7 0.3 1.1 1.3 0.0 0.0 0.0 2.6 3.4India 1.8 6.8 1.0 –3.1 0.3 3.8 0.6 5.2 5.0 –3.5 1.8Indonesia –1.4 1.1 8.4 –2.1 0.4 2.5 16.2 6.3 –9.2 –5.7 9.3Korea –1.1 1.8 3.9 2.4 0.2 1.8 10.8 –0.5 15.2 2.5 8.6Malaysia 2.0 0.1 2.6 0.2 –0.4 4.5 0.0 0.0 0.0 0.5 7.1Pakistan 0.2 0.4 –0.5 –0.1 –0.6 –0.5 2.8 1.7 –3.7 –0.6 –1.8Philippines 1.5 4.5 4.0 –3.9 5.7 2.5 –3.7 –3.5 –1.2 5.9 8.3Taiwan Province of China –1.4 0.6 1.1 0.2 –2.2 1.6 0.9 2.0 7.0 –3.3 0.7Thailand 9.4 2.2 5.5 2.0 1.5 6.0 2.6 8.8 1.8 –5.1 15.7
Europe, Middle East, & Africa
Czech Republic –0.7 –1.3 4.5 5.5 –0.2 7.2 18.4 16.9 14.7 –8.7 17.9Egypt 0.3 0.1 –0.2 –0.1 0.3 0.5 –0.9 –25.1 1.3 6.1 0.5Hungary 2.5 1.9 –2.3 –1.6 2.8 13.1 22.4 7.6 15.3 –15.0 11.9Israel 1.4 –2.2 –1.2 5.3 2.9 2.1 –7.3 8.0 1.6 –6.1 9.2Jordan 0.0 0.1 0.0 0.0 0.0 –0.1 –0.1 0.1 0.0 0.1 –0.1Morocco 2.7 7.5 4.0 1.3 –0.7 –2.5 –1.9 –2.7 –9.2 –7.1 2.0Poland 0.3 4.0 0.3 1.8 1.5 7.9 3.5 2.6 24.0 –7.2 11.8Russia 1.3 1.0 3.7 3.2 0.2 1.8 –4.5 9.3 5.5 –3.6 9.2South Africa –3.4 3.0 2.5 –13.9 –7.7 10.9 39.6 28.2 18.0 –10.5 –9.7Turkey 2.0 5.8 0.2 –15.0 4.9 6.7 –12.4 17.7 4.7 –0.6 –4.7
Developed Markets Australia 2.5 5.0 –2.2 3.6 0.5 5.7 10.2 33.9 3.8 –6.1 7.6Canada 1.0 8.3 –0.6 4.7 –0.2 –4.1 1.3 21.2 7.9 3.4 –0.3Denmark 1.3 1.5 2.3 5.6 –0.9 4.1 17.9 19.8 7.8 –12.9 11.5Euro area 1.2 1.4 2.3 5.5 –0.9 4.1 18.0 20.0 7.6 –12.6 11.4Hong Kong SAR –0.5 –0.1 –0.1 –0.1 –0.3 0.2 0.0 0.4 –0.1 0.2 –0.3Japan 1.1 –4.3 0.0 2.9 –3.2 –0.7 10.8 10.8 4.5 –12.8 –1.1New Zealand 1.5 8.1 –9.9 –1.2 7.3 7.8 25.9 25.0 9.5 –4.8 3.0Norway 2.5 3.2 2.9 5.3 –4.8 4.8 29.2 4.1 9.6 –9.8 8.1Singapore 1.1 –0.9 2.9 2.1 –0.3 3.5 6.4 2.1 4.2 –1.9 8.4Sweden –1.9 2.2 1.8 8.3 –1.9 7.1 20.6 20.9 8.0 –16.2 15.9Switzerland 0.3 –0.5 0.7 6.6 –2.2 2.6 20.0 11.7 8.7 –13.2 7.7United Kingdom 0.5 2.1 0.8 6.4 1.3 4.6 10.7 10.9 7.4 –10.2 13.7
Source: Bloomberg L.P.1High value indicates value of greatest appreciation against the U.S. dollar; low value indicates value of greatest depreciation against the U.S. dollar. “All-Time” refers to the
period since 1990 or initiation of the currency.2U.S. dollars per unit.
EMERGING MARKETS
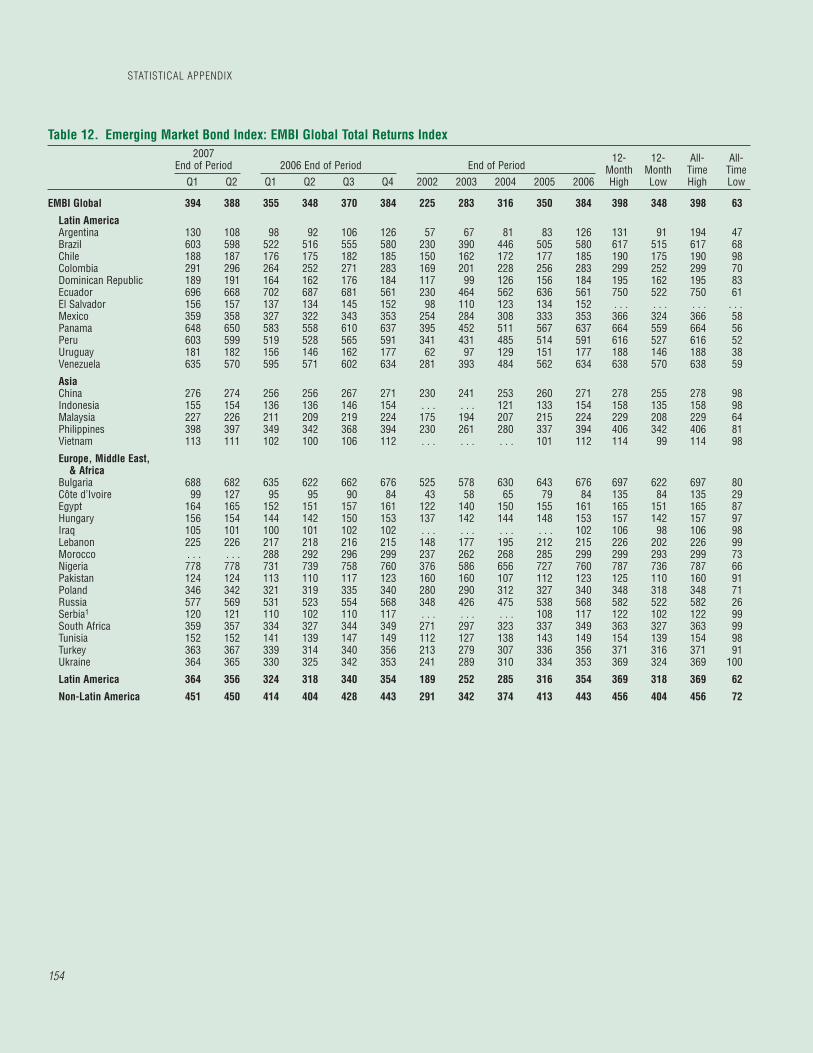
STATISTICAL APPENDIX
154
Table 12. Emerging Market Bond Index: EMBI Global Total Returns Index2007
End of Period 2006 End of Period End of Period12-
MonthHigh
12-MonthLow
All-Time High
All-Time LowQ1 Q2 Q1 Q2 Q3 Q4 2002 2003 2004 2005 2006
EMBI Global 394 388 355 348 370 384 225 283 316 350 384 398 348 398 63
Latin AmericaArgentina 130 108 98 92 106 126 57 67 81 83 126 131 91 194 47Brazil 603 598 522 516 555 580 230 390 446 505 580 617 515 617 68Chile 188 187 176 175 182 185 150 162 172 177 185 190 175 190 98Colombia 291 296 264 252 271 283 169 201 228 256 283 299 252 299 70Dominican Republic 189 191 164 162 176 184 117 99 126 156 184 195 162 195 83Ecuador 696 668 702 687 681 561 230 464 562 636 561 750 522 750 61El Salvador 156 157 137 134 145 152 98 110 123 134 152 . . . . . . . . . . . .Mexico 359 358 327 322 343 353 254 284 308 333 353 366 324 366 58Panama 648 650 583 558 610 637 395 452 511 567 637 664 559 664 56Peru 603 599 519 528 565 591 341 431 485 514 591 616 527 616 52Uruguay 181 182 156 146 162 177 62 97 129 151 177 188 146 188 38Venezuela 635 570 595 571 602 634 281 393 484 562 634 638 570 638 59
AsiaChina 276 274 256 256 267 271 230 241 253 260 271 278 255 278 98Indonesia 155 154 136 136 146 154 . . . . . . 121 133 154 158 135 158 98Malaysia 227 226 211 209 219 224 175 194 207 215 224 229 208 229 64Philippines 398 397 349 342 368 394 230 261 280 337 394 406 342 406 81Vietnam 113 111 102 100 106 112 . . . . . . . . . 101 112 114 99 114 98
Europe, Middle East, & Africa
Bulgaria 688 682 635 622 662 676 525 578 630 643 676 697 622 697 80Côte d’Ivoire 99 127 95 95 90 84 43 58 65 79 84 135 84 135 29Egypt 164 165 152 151 157 161 122 140 150 155 161 165 151 165 87Hungary 156 154 144 142 150 153 137 142 144 148 153 157 142 157 97Iraq 105 101 100 101 102 102 . . . . . . . . . . . . 102 106 98 106 98Lebanon 225 226 217 218 216 215 148 177 195 212 215 226 202 226 99Morocco . . . . . . 288 292 296 299 237 262 268 285 299 299 293 299 73Nigeria 778 778 731 739 758 760 376 586 656 727 760 787 736 787 66Pakistan 124 124 113 110 117 123 160 160 107 112 123 125 110 160 91Poland 346 342 321 319 335 340 280 290 312 327 340 348 318 348 71Russia 577 569 531 523 554 568 348 426 475 538 568 582 522 582 26Serbia1 120 121 110 102 110 117 . . . . . . . . . 108 117 122 102 122 99South Africa 359 357 334 327 344 349 271 297 323 337 349 363 327 363 99Tunisia 152 152 141 139 147 149 112 127 138 143 149 154 139 154 98Turkey 363 367 339 314 340 356 213 279 307 336 356 371 316 371 91Ukraine 364 365 330 325 342 353 241 289 310 334 353 369 324 369 100
Latin America 364 356 324 318 340 354 189 252 285 316 354 369 318 369 62
Non-Latin America 451 450 414 404 428 443 291 342 374 413 443 456 404 456 72

155
Table 12 (concluded) Period on Period Percent Change
2007 End of period 2006 End of period End of periodQ1 Q2 Q1 Q2 Q3 Q4 2002 2003 2004 2005 2006
EMBI Global 2.4 –1.4 1.5 –2.1 6.6 3.8 13.1 25.7 11.7 10.7 9.9
Latin AmericaArgentina 3.7 –17.0 17.9 –6.0 14.8 19.0 –6.4 19.1 19.8 2.7 51.3Brazil 4.0 –0.9 3.4 –1.2 7.6 4.4 –3.6 69.8 14.3 13.2 14.8Chile 1.8 –0.6 –0.9 –0.4 3.9 1.5 15.8 8.3 6.0 3.2 4.1Colombia 2.5 1.7 3.1 –4.3 7.2 4.7 13.3 19.4 13.2 12.4 10.7Dominican Republic 2.6 1.3 5.3 –1.3 8.6 4.6 13.9 –15.3 27.2 24.1 18.0Ecuador 24.1 –4.1 10.4 –2.2 –0.9 –17.6 –4.7 101.5 21.1 13.2 –11.8El Salvador 2.3 0.8 2.9 –2.8 8.7 5.0 . . . 11.9 11.5 8.8 14.1Mexico 1.9 –0.4 –1.7 –1.4 6.4 2.8 16.1 11.6 8.6 8.1 6.0Panama 1.7 0.4 2.8 –4.3 9.3 4.4 11.9 14.4 13.0 11.1 12.3Peru 2.0 –0.5 0.9 1.8 7.0 4.5 10.8 26.6 12.6 6.0 14.8Uruguay 2.3 0.9 3.8 –6.7 11.2 8.8 –40.6 55.6 34.0 16.3 17.3Venezuela 0.3 –10.4 5.9 –3.9 5.3 5.3 18.9 39.9 23.2 16.1 12.8
AsiaChina 1.8 –0.5 –1.5 –0.1 4.2 1.6 13.6 4.5 5.1 3.0 4.1Indonesia 0.8 –0.8 2.0 0.1 7.4 5.7 . . . . . . . . . 9.7 15.9Malaysia 1.5 –0.5 –1.8 –0.8 4.9 2.1 16.9 10.7 6.6 3.7 4.3Philippines 1.1 –0.2 3.4 –1.9 7.6 7.0 14.6 13.4 7.1 20.6 16.8Vietnam 0.7 –1.6 0.8 –2.2 6.7 5.0 . . . . . . . . . . . . 10.6
Europe, Middle East, & Africa
Bulgaria 1.8 –0.9 –1.3 –1.9 6.3 2.1 12.2 10.2 8.9 2.1 5.1Côte d’Ivoire 17.8 28.3 21.4 0.0 –5.9 –6.3 –20.7 34.8 12.9 20.0 7.1Egypt 1.9 0.5 –1.9 –0.7 3.8 2.7 18.5 14.4 6.8 3.8 3.8Hungary 1.7 –1.4 –2.7 –1.2 5.6 2.2 12.3 3.7 1.2 2.8 3.7Iraq 2.6 –3.8 . . . 1.0 0.6 0.7 . . . . . . . . . . . . . . .Lebanon 4.8 0.2 2.6 0.4 –0.9 –0.5 14.1 19.5 9.9 8.7 1.6Morocco . . . . . . 1.1 1.3 1.5 1.0 7.2 10.2 2.4 6.3 5.0Nigeria 2.4 0.0 0.5 1.2 2.5 0.3 3.3 55.8 11.9 10.7 4.6Pakistan 0.7 –0.1 1.7 –2.7 6.0 5.2 31.3 –0.2 –33.3 4.5 10.3Poland 1.8 –1.1 –1.9 –0.7 5.0 1.5 14.2 3.7 7.5 5.0 3.8Russia 1.6 –1.4 –1.3 –1.5 5.9 2.5 35.9 22.4 11.5 13.3 5.5Serbia1 2.6 1.2 2.2 –7.0 7.7 5.9 . . . . . . . . . . . . 8.3South Africa 2.6 –0.6 –1.0 –1.8 5.1 1.5 22.9 9.6 8.8 4.3 3.7Tunisia 2.5 –0.1 –1.7 –1.1 5.3 1.4 . . . 13.3 8.7 3.7 3.8Turkey 2.0 1.1 1.1 –7.4 8.2 4.7 21.1 30.8 10.0 9.5 6.1Ukraine 2.9 0.3 –0.9 –1.8 5.2 3.5 21.0 19.8 7.2 7.7 5.9
Latin America 2.9 –2.3 2.5 –2.0 7.0 4.2 6.8 33.0 13.4 10.9 11.9
Non-Latin America 1.8 –0.4 0.1 –2.3 5.9 3.4 21.0 17.7 9.2 10.6 7.2
Source: JPMorgan Chase & Co.1Data prior to 2006 refer to Serbia and Montenegro.
EMERGING MARKETS

STATISTICAL APPENDIX
156
Table 13. Emerging Market Bond Index: EMBI Global Yield Spreads(In basis points)
2007End of Period 2007 End of Period End of Period
12-MonthHigh
12-MonthLow
All-TimeHigh
All-TimeLowQ1 Q2 Q1 Q2 Q3 Q4 2002 2003 2004 2005 2006
EMBI Global 170 181 191 218 208 171 725 403 347 237 171 217 151 1,631 151
Latin AmericaArgentina 204 325 344 385 342 216 6,342 5,485 4,527 504 216 385 185 7,222 185Brazil 167 160 232 252 232 190 1,460 459 376 308 190 253 138 2,451 138Chile 85 83 73 83 85 84 176 90 64 80 84 90 77 260 52Colombia 157 119 174 239 202 161 633 427 332 244 161 251 95 1,076 95Dominican Republic 189 157 278 299 250 196 499 1,141 824 378 196 299 122 1,750 122Ecuador 650 711 503 506 608 920 1,801 799 690 661 920 1,048 458 4,764 436El Salvador 156 127 171 217 201 159 411 284 245 239 159 225 99 434 99Mexico 116 111 140 154 141 115 329 201 174 143 115 145 89 1,149 89Panama 152 130 176 212 187 146 446 324 274 239 146 211 114 769 114Peru 129 117 226 202 169 118 609 325 239 257 118 206 95 1,061 95Uruguay 184 157 223 307 254 185 1,228 636 388 298 185 306 133 1,982 133Venezuela 207 354 190 226 233 183 1,131 586 403 313 183 354 181 2,658 161
AsiaChina 53 54 68 65 67 51 84 58 57 68 51 67 48 364 39Indonesia 171 165 213 220 205 153 . . . . . . 244 269 153 232 136 433 136Malaysia 73 75 86 97 89 66 212 100 78 82 66 99 65 1,141 65Philippines 167 155 233 259 232 155 522 415 457 302 155 263 132 993 132Vietnam 108 122 149 175 155 95 . . . . . . . . . 190 95 182 89 197 89
Europe, Middle East, & Africa
Bulgaria 67 68 83 105 87 66 291 177 77 90 66 101 42 1,679 42Côte d’Ivoire 3,050 2,483 2,568 2,713 2,895 3,325 3,195 3,013 3,121 3,070 3,325 3,426 2,292 3,609 582Egypt 53 51 80 103 101 52 325 131 101 58 52 123 34 646 20Hungary 63 71 75 90 79 58 52 28 32 74 58 88 55 196 –29Iraq 537 570 465 444 514 526 . . . . . . . . . . . . 526 575 433 575 376Lebanon 364 371 172 189 366 395 776 421 334 246 395 419 182 1,082 111Morocco . . . . . . 87 54 90 72 390 160 170 75 72 92 48 1,606 48Nigeria 16 37 259 253 325 66 1,946 499 457 329 66 377 9 2,937 9Pakistan 181 214 144 251 240 154 271 0 233 198 154 265 133 2,225 0Poland 53 61 64 69 61 47 185 76 69 62 47 77 42 410 17Russia 102 106 105 123 115 99 478 257 213 118 99 125 87 7,063 87Serbia1 183 152 181 266 246 186 . . . . . . . . . 238 186 285 134 322 134South Africa 73 87 85 123 99 84 250 152 102 87 84 120 50 757 50Tunisia 79 73 92 121 90 83 273 146 91 81 83 122 55 394 48Turkey 216 189 182 294 256 207 696 309 264 223 207 292 175 1,196 168Ukraine 164 156 198 257 218 172 671 258 255 184 172 257 125 2,314 125
Latin America 173 196 208 231 218 180 981 518 415 272 180 232 157 1,532 157
Non-Latin America 166 160 164 198 193 159 444 248 239 179 159 202 142 1,812 142

157
Table 13 (concluded)Period on Period Spread Change
2007 End of period 2006 End of period End of periodQ1 Q2 Q1 Q2 Q3 Q4 2002 2003 2004 2005 2006
EMBI Global –1 11 –46 27 –10 –37 –3 –322 –56 –110 –66
Latin America Argentina –12 121 –160 41 –43 –126 979 –857 –958 –4,023 –288Brazil –23 –7 –76 20 –20 –42 596 –1,001 –83 –68 –118Chile 1 –2 –7 10 2 –1 1 –86 –26 16 4Colombia –4 –38 –70 65 –37 –41 125 –206 –95 –88 –83Dominican Republic –7 –32 –100 21 –49 –54 53 642 –317 –446 –182Ecuador –270 61 –158 3 102 312 568 –1,002 –109 –29 259El Salvador –3 –29 –68 46 –16 –42 . . . –127 –39 –6 –80Mexico 1 –5 –3 14 –13 –26 23 –128 –27 –31 –28Panama 6 –22 –63 36 –25 –41 42 –122 –50 –35 –93Peru 11 –12 –31 –24 –33 –51 88 –284 –86 18 –139Uruguay –1 –27 –75 84 –53 –69 944 –592 –248 –90 –113Venezuela 24 147 –123 36 7 –50 1 –545 –183 –90 –130
Asia China 2 1 0 –3 2 –16 –15 –26 –1 11 –17Indonesia 18 –6 –56 7 –15 –52 . . . . . . . . . 25 –116Malaysia 7 2 4 11 –8 –23 5 –112 –22 4 –16Philippines 12 –12 –69 26 –27 –77 56 –107 42 –155 –147Vietnam 13 14 –41 26 –20 –60 . . . . . . . . . . . . –95
Europe, Middle East,& Africa
Bulgaria 1 1 –7 22 –18 –21 –142 –114 –100 13 –24Côte d’Ivoire –275 –567 –502 145 182 430 777 –182 108 –51 255Egypt 1 –2 22 23 –2 –49 –35 –194 –30 –43 –6Hungary 5 8 1 15 –11 –21 –41 –24 4 42 –16Iraq 11 33 . . . –21 70 12 . . . . . . . . . . . . . . .Lebanon –31 7 –74 17 177 29 131 –355 –87 –88 149Morocco . . . . . . 12 –33 36 –18 –128 –230 10 –95 –3Nigeria –50 21 –70 –6 72 –259 843 –1,447 –42 –128 –263Pakistan 27 33 –54 107 –11 –86 –844 –271 233 –35 –44Poland 6 8 2 5 –8 –14 –10 –109 –7 –7 –15Russia 3 4 –13 18 –8 –16 –191 –221 –44 –95 –19Serbia1 –3 –31 –57 85 –20 –60 . . . . . . . . . . . . –52South Africa –11 14 –2 38 –24 –15 –69 –98 –50 –15 –3Tunisia –4 –6 11 29 –31 –7 . . . –127 –55 –10 2Turkey 9 –27 –41 112 –38 –49 –6 –387 –45 –41 –16Ukraine –8 –8 14 59 –39 –46 –269 –413 –3 –71 –12
Latin America –7 23 –64 23 –13 –38 93 –463 –103 –143 –92
Non-Latin America 7 –6 –15 34 –5 –34 –79 –196 –9 –60 –20
Source: JPMorgan Chase & Co.1Data prior to 2006 refer to Serbia and Montenegro.
EMERGING MARKETS

STATISTICAL APPENDIX
158
Table 14. Emerging Market External Financing: Total Bonds, Equities, and Loans(In millions of U.S. dollars)
2006 20072001 2002 2003 2004 2005 2006 Q3 Q4 Q1 Q2
Total 147,523.6 133,509.0 195,504.1 176,759.6 101,699.0 112,726.4 103,463.9 183,063.7 134,546.1 175,558.4
Africa 1,025.3 1,833.2 10,662.6 11,101.2 11,601.3 13,052.1 1,879.3 1,827.2 1,947.4 1,025.0 Algeria 10.0 150.0 10.0 171.7 112.7 1.0 1.0 — — — Angola 155.0 150.0 1,522.0 1,900.0 1,122.7 18.0 12.1 — 14.6 — Botswana 12.5 — — — — — — — — — Burkina Faso — — — — 11.0 — — — 14.5 — Cameroon 13.8 — 100.0 — — — — — — — Chad 100.0 — — — — — — — — — Côte d’Ivoire 15.0 — — 100.0 — — — — — — Djibouti — — — 10.0 — — — — — — Ethiopia — — — 10.0 — — — — — — Gabon — — — 12.0 — 14.3 — — — — Ghana 191.0 120.0 150.0 170.0 162.5 160.0 110.0 — — 150.0 Guinea — — — 10.0 — — — — — — Kenya 10.2 — 134.0 — 13.5 10.6 — 13.8 — — Malawi — — — 1.8 — — — — — — Mali — 150.4 187.6 188.9 — — — — 149.9 — Mauritius — — — — — 180.0 10.0 — — — Morocco 136.1 — 174.7 — — 147.6 136.0 — 16.1 170.7 Mozambique 160.0 — 15.5 — — — — — — — Namibia — — 15.0 — 10.0 100.0 10.0 10.0 — — Niger — — 17.0 — — — — — 125.0 100.0 Nigeria 15.0 160.0 188.0 125.0 118.8 180.0 100.0 180.0 150.0 127.3 Senegal — 10.0 — — — — — — — — Seychelles — 150.0 — 10.0 — — — — — — South Africa 1,833.7 1,872.3 1,353.6 1,233.5 1,118.0 1,953.3 1,689.1 155.8 1,717.2 1,626.9 Sudan — — — 11.0 — — — — — — Tunisia 133.0 140.5 185.2 124.4 182.1 173.5 — — — 150.0 Uganda — — — — — 12.6 — 12.6 — — Zambia — — 10.0 — — 105.0 — 105.0 — — Zimbabwe — — — — — 15.1 — — — —
Asia 54,185.0 52,082.5 85,898.3 116,344.9 146,864.7 195,709.4 14,610.2 17,714.3 10,827.0 13,227.0 Bangladesh — — — 176.8 — 12.6 — — — — Brunei Darussalam — 129.0 — — — — — — — — China 1,254.8 1,256.1 12,842.9 12,634.6 14,632.2 11,771.5 1,745.3 15,486.1 1,305.5 10,090.0 Hong Kong SAR 1,406.4 1,591.9 1,693.4 13,041.2 14,569.5 18,040.2 1,175.7 1,208.4 1,057.1 1,403.0 India 1,340.4 1,443.3 1,775.7 14,447.4 10,229.5 12,492.8 1,105.5 17,082.5 1,659.0 16,066.2 Indonesia 171.9 118.0 1,198.2 1,636.1 1,255.2 1,014.4 195.8 1,995.2 1,108.0 1,388.2 Korea 16,181.2 15,909.3 17,244.1 13,916.0 14,985.6 17,920.9 1,499.1 1,663.1 1,855.1 14,021.1 Lao P.D.R. — — — 110.0 100.0 — — — — — Macao SAR — — — 157.0 — 1,980.3 1,180.3 — 1,600.0 — Malaysia 1,628.3 1,142.1 1,550.1 1,300.9 1,547.9 1,964.5 1,825.5 1,182.7 1,559.2 1,965.0 Marshall Islands — 14.7 — — 14.0 170.0 — — 104.2 — Mongolia — — — — 10.0 1.0 1.0 — — — Pakistan 182.5 15.0 — 100.0 191.8 1,251.5 10.0 1,211.7 — 1,472.4 Papua New Guinea — — 153.7 — — — — — — — Philippines 1,263.8 1,384.9 1,727.3 1,897.3 1,681.6 1,185.2 1,698.4 1,960.2 1,039.1 141.8 Singapore 1,503.4 1,976.2 1,816.4 1,907.7 1,693.9 15,192.0 1,471.8 1,609.2 1,024.1 1,515.0 Sri Lanka 105.0 — 186.0 135.0 167.0 129.7 10.0 100.0 — 110.0 Taiwan Province of China 1,662.8 1,198.4 18,337.1 12,986.3 11,221.6 1,385.7 1,077.9 1,581.8 1,029.6 1,990.3 Thailand 184.4 130.1 1,322.4 1,784.6 1,520.8 1,397.3 115.5 1,299.2 — 141.2 Vietnam — 183.5 11.0 114.0 1,014.0 174.7 13.2 134.2 186.1 123.0
Europe 11,727.4 10,040.0 16,459.3 12,517.6 101,489.8 148,721.5 17,906.7 12,881.4 12,533.7 11,736.0 Armenia — — — — — — — — — 19.1 Azerbaijan 16.0 — — 1,005.0 183.7 1,917.0 1.0 1,130.0 — 164.0 Belarus — — 14.0 — 12.0 136.0 123.8 119.3 17.0 15.0 Bulgaria 130.4 1,260.8 122.5 118.1 173.7 1,587.5 188.8 148.2 19.2 135.3 Croatia 1,724.2 1,384.1 1,944.4 1,196.9 137.2 1,268.2 175.6 192.6 — 137.7 Cyprus 133.0 147.9 148.2 1,174.0 1,453.8 1,848.8 1,400.5 128.9 18.0 1,329.1 Czech Republic 185.1 153.4 1,518.8 1,904.1 1,169.5 1,448.4 198.6 1,044.8 119.7 198.0 Estonia 102.1 133.9 157.3 1,187.7 193.5 149.4 — — — 123.9

159
EMERGING MARKETS
Table 14 (concluded) 2006 2007
2001 2002 2003 2004 2005 2006 Q3 Q4 Q1 Q2Europe (continued)Faroe Islands — — — — 85.3 206.2 — 206.2 206.1 — Georgia — — 6.0 — — 7.0 7.0 — — — Gibraltar 1,319.6 — — — 2,168.9 2,371.7 — — 94.1 — Hungary 1,347.2 1,040.2 3,870.4 8,134.5 8,687.5 7,685.9 1,072.6 2,031.9 2,676.7 1,135.6 Kazakhstan 573.5 1,043.5 2,200.0 5,093.2 5,457.9 16,094.7 3,741.9 8,098.3 5,480.4 5,025.3 Kyrgyz Republic — 95.0 — — — — — — — — Latvia 212.1 74.6 70.7 889.3 391.3 1,449.3 656.5 246.8 111.7 897.0 Lithuania 247.3 374.3 431.7 888.2 1,222.0 1,292.1 — 806.6 — 277.2 Macedonia, FYR — — — 17.4 — — — — — — Malta 85.0 — 114.7 392.7 — 256.0 196.0 — — — Moldova — — — — 1.0 — — — — — Poland 3,135.1 5,941.2 8,550.3 4,909.3 14,949.6 7,321.0 327.6 2,903.8 2,847.8 2,259.7 Romania 1,347.2 1,442.2 1,738.8 659.0 2,229.8 665.3 153.0 305.4 193.3 146.2 Russia 2,831.2 8,534.5 12,238.8 22,532.1 37,062.1 63,387.3 21,306.4 20,097.0 21,023.8 25,915.9 Serbia1 — 19.4 — — — — — — — — Slovak Republic 219.9 143.1 940.6 1,315.7 579.3 1,217.1 — — — 1,352.5 Slovenia 827.2 309.3 394.8 1,430.8 1,881.5 1,828.5 — 488.1 2,604.3 431.4 Turkey 6,271.3 6,482.5 9,549.5 14,534.5 17,798.4 25,889.4 6,308.2 6,417.9 5,605.2 5,328.1 Ukraine 15.0 514.0 1,400.0 2,434.9 3,031.8 5,189.7 1,249.2 3,311.0 1,366.4 2,724.9 Uzbekistan 5.0 46.0 37.8 — — 4.9 — 4.9 — —
Middle East 11,247.3 10,943.0 8,954.3 23,253.4 56,601.2 86,172.8 12,350.7 29,207.5 12,313.2 22,010.1 Bahrain 202.0 922.6 2,326.6 1,767.0 3,070.9 4,487.1 670.0 1,703.0 — 5,106.8 Egypt 2,500.0 670.0 155.0 1,138.7 3,395.1 3,323.2 200.0 87.5 1,691.5 — Iran, I.R. of 887.0 2,666.4 700.0 1,942.7 1,928.8 134.8 17.7 — — — Iraq — — — — 107.8 2,877.0 — — — — Israel 1,897.6 344.4 766.6 3,514.0 3,986.4 4,331.6 339.1 2,134.8 2,073.0 369.3 Jordan — 80.9 — 199.4 — 60.0 — 60.0 — — Kuwait 770.0 750.0 365.0 1,282.5 4,783.0 4,761.3 468.5 200.0 75.0 1,890.5 Lebanon 3,300.0 990.0 160.0 5,083.0 1,780.0 5,818.1 656.6 50.0 1,120.0 400.0 Oman — 2,332.0 818.3 1,328.6 4,747.1 3,430.2 2,835.9 344.3 — 782.4 Qatar 895.0 1,536.7 880.8 2,042.7 10,418.5 11,426.4 2,242.5 4,135.4 — 650.0 Saudi Arabia 275.0 280.0 839.5 2,214.0 4,981.0 10,132.4 89.5 1,987.2 1,155.1 4,729.0 United Arab Emirates 520.7 370.0 1,942.6 2,741.0 17,402.6 35,390.7 4,830.9 18,505.3 6,198.6 8,082.1
Latin America 54,338.8 33,610.3 43,529.5 53,542.4 85,142.1 69,070.6 15,717.0 21,433.3 32,924.8 19,560.4 Argentina 5,017.9 824.2 130.0 1,882.4 22,180.6 2,814.9 325.5 970.0 458.1 3,227.8 Bolivia 10.0 90.0 — 116.0 123.0 — — — — — Brazil 19,265.6 11,119.4 12,908.6 15,834.0 24,962.2 28,465.6 7,346.5 6,598.0 14,020.0 11,087.6 Chile 4,335.3 2,959.6 4,631.0 6,439.9 5,956.0 5,968.1 1,152.1 2,007.1 490.0 541.8 Colombia 4,974.8 2,096.0 1,911.3 1,626.8 2,780.9 4,951.6 2,300.1 2,048.4 — 1,456.8 Costa Rica 365.0 250.0 490.0 310.0 117.2 1.7 1.7 — — — Cuba — — — 69.8 1.9 — — — — — Dominican Republic 531.1 258.0 650.4 140.5 244.4 762.7 112.0 305.8 458.3 175.0 Ecuador 910.0 10.0 — — 712.5 19.1 — 19.1 — — El Salvador 421.5 1,745.0 381.0 467.0 454.5 1,326.6 721.6 205.0 — — Grenada — 100.0 — — — — — — — — Guadeloupe — 17.4 — — — — — — — — Guatemala 325.0 44.0 300.0 439.3 365.0 — — — 15.0 — Haiti — — — — — 126.5 — 70.0 — — Honduras — — — 169.0 4.6 — — — — — Jamaica 946.5 345.0 49.6 903.2 1,466.6 1,268.4 150.0 200.0 1,000.0 125.0 Mexico 12,648.0 10,040.6 16,964.3 18,832.8 16,314.4 16,432.0 1,711.9 6,623.1 5,723.7 1,715.6 Nicaragua — — — 22.0 — — — — — — Paraguay 70.0 — — — — — — — — — Peru 237.5 1,993.0 1,375.0 1,475.7 2,184.2 1,253.8 150.0 696.9 2,120.0 188.5 St. Lucia — — 20.0 — — — — — — — Trinidad and Tobago 70.0 303.0 46.0 415.0 100.0 2,610.4 1,242.3 156.0 — 955.4 Uruguay 1,147.4 400.0 — — 1,061.3 2,700.0 500.0 1,200.0 1,049.7 87.0 Venezuela 3,063.4 1,015.0 3,672.5 4,399.1 6,112.6 369.3 3.2 334.0 7,590.0 —
Source: Data provided by the Bond, Equity and Loan database of the International Monetary Fund sourced from Dealogic.1Data prior to 2006 refer to Serbia and Montenegro.
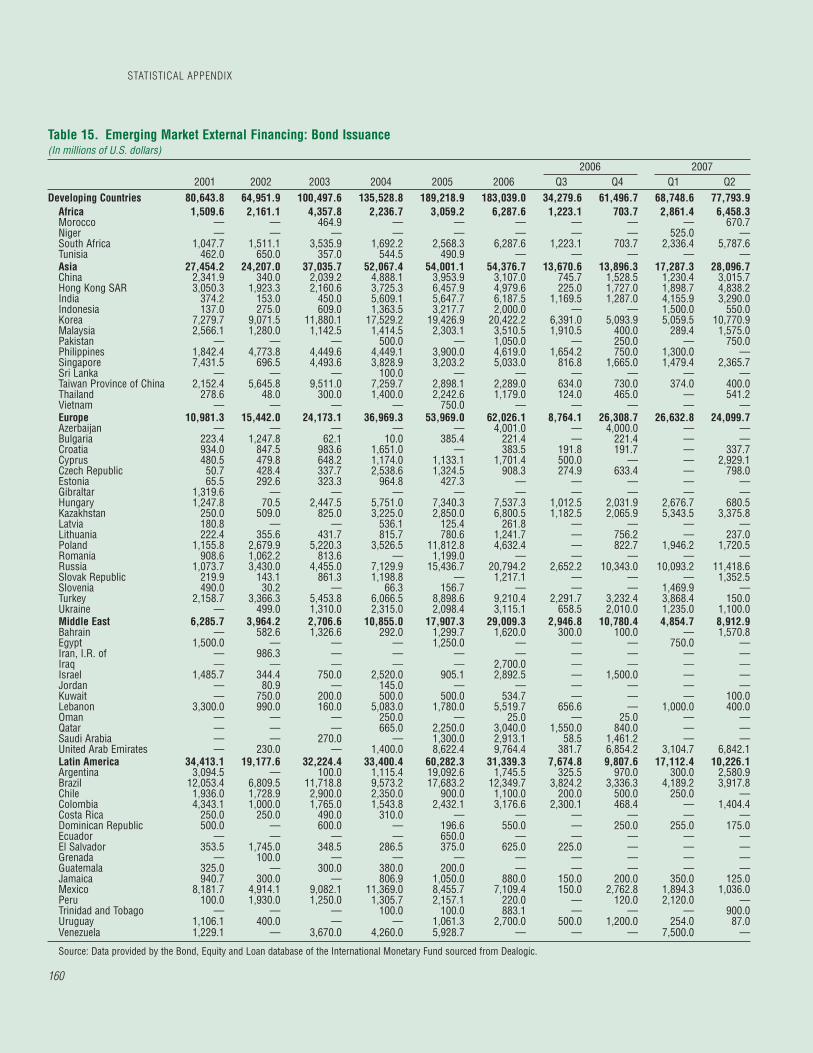
STATISTICAL APPENDIX
160
Table 15. Emerging Market External Financing: Bond Issuance(In millions of U.S. dollars)
2006 20072001 2002 2003 2004 2005 2006 Q3 Q4 Q1 Q2
Developing Countries 80,643.8 64,951.9 100,497.6 135,528.8 189,218.9 183,039.0 34,279.6 61,496.7 68,748.6 77,793.9Africa 1,509.6 2,161.1 4,357.8 2,236.7 3,059.2 6,287.6 1,223.1 703.7 2,861.4 6,458.3Morocco — — 464.9 — — — — — — 670.7Niger — — — — — — — — 525.0 —South Africa 1,047.7 1,511.1 3,535.9 1,692.2 2,568.3 6,287.6 1,223.1 703.7 2,336.4 5,787.6Tunisia 462.0 650.0 357.0 544.5 490.9 — — — — —Asia 27,454.2 24,207.0 37,035.7 52,067.4 54,001.1 54,376.7 13,670.6 13,896.3 17,287.3 28,096.7China 2,341.9 340.0 2,039.2 4,888.1 3,953.9 3,107.0 745.7 1,528.5 1,230.4 3,015.7Hong Kong SAR 3,050.3 1,923.3 2,160.6 3,725.3 6,457.9 4,979.6 225.0 1,727.0 1,898.7 4,838.2India 374.2 153.0 450.0 5,609.1 5,647.7 6,187.5 1,169.5 1,287.0 4,155.9 3,290.0Indonesia 137.0 275.0 609.0 1,363.5 3,217.7 2,000.0 — — 1,500.0 550.0Korea 7,279.7 9,071.5 11,880.1 17,529.2 19,426.9 20,422.2 6,391.0 5,093.9 5,059.5 10,770.9Malaysia 2,566.1 1,280.0 1,142.5 1,414.5 2,303.1 3,510.5 1,910.5 400.0 289.4 1,575.0Pakistan — — — 500.0 — 1,050.0 — 250.0 — 750.0Philippines 1,842.4 4,773.8 4,449.6 4,449.1 3,900.0 4,619.0 1,654.2 750.0 1,300.0 —Singapore 7,431.5 696.5 4,493.6 3,828.9 3,203.2 5,033.0 816.8 1,665.0 1,479.4 2,365.7Sri Lanka — — — 100.0 — — — — — —Taiwan Province of China 2,152.4 5,645.8 9,511.0 7,259.7 2,898.1 2,289.0 634.0 730.0 374.0 400.0Thailand 278.6 48.0 300.0 1,400.0 2,242.6 1,179.0 124.0 465.0 — 541.2Vietnam — — — — 750.0 — — — — —Europe 10,981.3 15,442.0 24,173.1 36,969.3 53,969.0 62,026.1 8,764.1 26,308.7 26,632.8 24,099.7Azerbaijan — — — — — 4,001.0 — 4,000.0 — —Bulgaria 223.4 1,247.8 62.1 10.0 385.4 221.4 — 221.4 — —Croatia 934.0 847.5 983.6 1,651.0 — 383.5 191.8 191.7 — 337.7Cyprus 480.5 479.8 648.2 1,174.0 1,133.1 1,701.4 500.0 — — 2,929.1Czech Republic 50.7 428.4 337.7 2,538.6 1,324.5 908.3 274.9 633.4 — 798.0Estonia 65.5 292.6 323.3 964.8 427.3 — — — — —Gibraltar 1,319.6 — — — — — — — — —Hungary 1,247.8 70.5 2,447.5 5,751.0 7,340.3 7,537.3 1,012.5 2,031.9 2,676.7 680.5Kazakhstan 250.0 509.0 825.0 3,225.0 2,850.0 6,800.5 1,182.5 2,065.9 5,343.5 3,375.8Latvia 180.8 — — 536.1 125.4 261.8 — — — —Lithuania 222.4 355.6 431.7 815.7 780.6 1,241.7 — 756.2 — 237.0Poland 1,155.8 2,679.9 5,220.3 3,526.5 11,812.8 4,632.4 — 822.7 1,946.2 1,720.5Romania 908.6 1,062.2 813.6 — 1,199.0 — — — — —Russia 1,073.7 3,430.0 4,455.0 7,129.9 15,436.7 20,794.2 2,652.2 10,343.0 10,093.2 11,418.6Slovak Republic 219.9 143.1 861.3 1,198.8 — 1,217.1 — — — 1,352.5Slovenia 490.0 30.2 — 66.3 156.7 — — — 1,469.9 —Turkey 2,158.7 3,366.3 5,453.8 6,066.5 8,898.6 9,210.4 2,291.7 3,232.4 3,868.4 150.0Ukraine — 499.0 1,310.0 2,315.0 2,098.4 3,115.1 658.5 2,010.0 1,235.0 1,100.0Middle East 6,285.7 3,964.2 2,706.6 10,855.0 17,907.3 29,009.3 2,946.8 10,780.4 4,854.7 8,912.9Bahrain — 582.6 1,326.6 292.0 1,299.7 1,620.0 300.0 100.0 — 1,570.8Egypt 1,500.0 — — — 1,250.0 — — — 750.0 —Iran, I.R. of — 986.3 — — — — — — — —Iraq — — — — — 2,700.0 — — — —Israel 1,485.7 344.4 750.0 2,520.0 905.1 2,892.5 — 1,500.0 — —Jordan — 80.9 — 145.0 — — — — — —Kuwait — 750.0 200.0 500.0 500.0 534.7 — — — 100.0Lebanon 3,300.0 990.0 160.0 5,083.0 1,780.0 5,519.7 656.6 — 1,000.0 400.0Oman — — — 250.0 — 25.0 — 25.0 — —Qatar — — — 665.0 2,250.0 3,040.0 1,550.0 840.0 — —Saudi Arabia — — 270.0 — 1,300.0 2,913.1 58.5 1,461.2 — —United Arab Emirates — 230.0 — 1,400.0 8,622.4 9,764.4 381.7 6,854.2 3,104.7 6,842.1Latin America 34,413.1 19,177.6 32,224.4 33,400.4 60,282.3 31,339.3 7,674.8 9,807.6 17,112.4 10,226.1Argentina 3,094.5 — 100.0 1,115.4 19,092.6 1,745.5 325.5 970.0 300.0 2,580.9Brazil 12,053.4 6,809.5 11,718.8 9,573.2 17,683.2 12,349.7 3,824.2 3,336.3 4,189.2 3,917.8Chile 1,936.0 1,728.9 2,900.0 2,350.0 900.0 1,100.0 200.0 500.0 250.0 —Colombia 4,343.1 1,000.0 1,765.0 1,543.8 2,432.1 3,176.6 2,300.1 468.4 — 1,404.4Costa Rica 250.0 250.0 490.0 310.0 — — — — — —Dominican Republic 500.0 — 600.0 — 196.6 550.0 — 250.0 255.0 175.0Ecuador — — — — 650.0 — — — — —El Salvador 353.5 1,745.0 348.5 286.5 375.0 625.0 225.0 — — —Grenada — 100.0 — — — — — — — —Guatemala 325.0 — 300.0 380.0 200.0 — — — — —Jamaica 940.7 300.0 — 806.9 1,050.0 880.0 150.0 200.0 350.0 125.0Mexico 8,181.7 4,914.1 9,082.1 11,369.0 8,455.7 7,109.4 150.0 2,762.8 1,894.3 1,036.0Peru 100.0 1,930.0 1,250.0 1,305.7 2,157.1 220.0 — 120.0 2,120.0 —Trinidad and Tobago — — — 100.0 100.0 883.1 — — — 900.0Uruguay 1,106.1 400.0 — — 1,061.3 2,700.0 500.0 1,200.0 254.0 87.0Venezuela 1,229.1 — 3,670.0 4,260.0 5,928.7 — — — 7,500.0 —
Source: Data provided by the Bond, Equity and Loan database of the International Monetary Fund sourced from Dealogic.

161
Table 16. Emerging Market External Finance: Equity Issuance(In millions of U.S. dollars)
2006 20072001 2002 2003 2004 2005 2006 Q3 Q4 Q1 Q2
Developing Countries 10,743.1 16,474.3 27,625.7 45,528.2 78,223.7 120,731.6 20,684.1 47,493.5 26,100.9 53,516.8
Africa 6.8 159.7 720.2 1,855.7 924.7 2,369.7 135.4 52.1 1,507.0 550.3Algeria — — — — — 2.0 2.0 — — —Côte d’Ivoire — — — 100.0 — — — — — —Morocco 6.8 — — — — 133.3 133.3 — 16.1 —Niger — — — — — — — — — 100.0South Africa — 159.7 720.2 1,724.7 924.7 2,159.2 — 52.1 1,490.8 450.3Sudan — — — 31.0 — — — — — —Zimbabwe — — — — — 75.1 — — — —
Asia 9,127.5 12,637.9 24,252.5 35,458.6 58,264.5 78,012.8 6,537.3 34,381.9 10,838.9 29,177.8China 1,570.0 2,475.0 6,415.7 14,191.1 25,721.9 41,809.1 2,282.9 23,419.2 3,798.9 13,842.3Hong Kong SAR 1,638.0 2,880.6 2,962.2 5,238.8 4,675.3 8,643.4 1,367.3 3,462.0 1,681.4 1,409.3India 467.2 348.1 1,299.7 4,347.1 6,708.4 8,287.9 286.9 4,081.9 1,863.1 6,677.1Indonesia 347.2 281.0 1,096.7 535.2 1,283.5 665.9 204.3 409.7 — 380.8Korea 3,676.4 1,553.7 1,222.6 3,223.3 7,814.9 7,329.8 97.6 69.0 1,246.0 1,471.8Macao SAR — — — — — 0.3 0.3 — — —Malaysia 15.4 888.4 618.2 887.2 735.2 217.3 197.5 19.7 489.2 —Pakistan — — — — — 922.2 — 922.2 — 565.4Papua New Guinea — — 153.7 — — — — — — —Philippines — — — 114.9 535.8 756.0 — 444.2 248.7 191.8Singapore 61.4 940.9 1,168.7 2,472.7 2,651.5 3,646.6 637.6 538.9 822.4 1,264.1Sri Lanka — — — — 55.5 — — — — —Taiwan Province of China 1,126.6 3,213.9 8,276.3 3,350.0 7,602.6 3,644.5 1,374.4 791.8 218.6 3,375.3Thailand 225.3 56.3 1,038.7 1,098.4 479.7 1,772.4 88.5 223.3 — —Vietnam — — — — — 317.3 — — 470.7 —
Europe 259.4 1,681.7 1,809.0 5,287.3 10,276.1 24,595.1 12,455.9 8,166.8 6,494.0 15,096.9Croatia 22.3 — — — — 220.0 — 220.0 — —Cyprus — — — — 320.7 1,181.7 107.7 840.9 — 1,400.0Czech Republic — — 824.6 174.4 295.1 287.3 — 287.3 — —Estonia — 41.3 — — 266.2 — — — — 123.9Gibraltar — — — — 2,168.9 437.5 — — 94.1 —Hungary — — 13.2 884.7 — — — — — —Kazakhstan — — — — — 3,953.8 2,255.4 1,698.4 120.0 50.0Latvia — 22.7 — — — — — — — —Lithuania — — — — 51.2 — — — — —Poland — 245.4 602.6 841.4 944.0 712.6 108.0 532.7 240.0 —Romania — — — — — 172.5 — 172.5 — —Russia 237.1 1,301.0 368.7 2,480.1 6,210.0 17,598.5 9,959.5 4,409.1 5,821.1 11,735.8Turkey — 71.4 — 906.5 — 6.0 — 6.0 218.8 1,682.3Ukraine — — — — 19.9 25.3 25.3 — — 104.9
Middle East 86.8 — 16.6 868.5 2,963.3 3,365.6 31.5 399.5 2,147.1 451.3Bahrain — — — — 81.2 581.8 — — — —Egypt — — — 141.0 678.2 257.8 — — — —Israel 86.8 — 16.6 624.0 1,157.5 342.3 — 159.8 2,073.0 201.3Jordan — — — — — — — — — —Lebanon — — — — — 248.4 — — — —Oman — — — 23.6 148.4 — — — — —Qatar — — — — — 1,133.2 — — — —Saudi Arabia — — — 80.0 — 457.7 — — 74.1 250.0United Arab Emirates — — — — 898.0 344.3 31.5 239.6 — —
Latin America 1,262.5 1,995.0 827.4 2,058.2 5,795.2 12,388.3 1,524.0 4,493.3 5,113.9 8,240.5Argentina 34.4 — — — — 769.4 — — 158.1 306.9Brazil 1,228.1 1,148.5 287.4 1,651.0 3,433.1 9,142.7 1,524.0 3,023.3 4,830.8 6,916.4Chile — — — 266.4 522.7 677.1 — 677.1 — 126.8Colombia — — — — — — — — — 52.4Dominican Republic — — — — — — — — — —Mexico — 846.6 540.0 140.8 1,839.3 1,222.3 — 216.1 125.0 649.6Peru — — — — — 576.9 — 576.9 — 188.5
Source: Data provided by the Bond, Equity and Loan database of the International Monetary Fund sourced from Dealogic.
EMERGING MARKETS
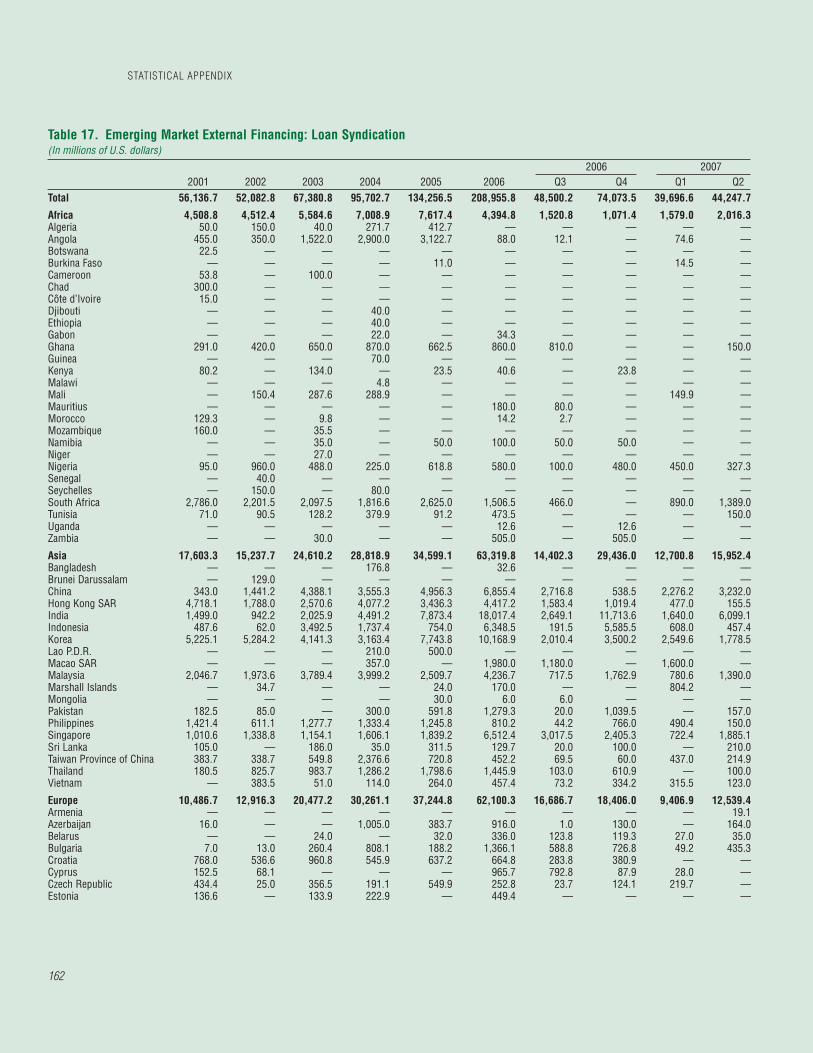
STATISTICAL APPENDIX
162
Table 17. Emerging Market External Financing: Loan Syndication(In millions of U.S. dollars)
2006 20072001 2002 2003 2004 2005 2006 Q3 Q4 Q1 Q2
Total 56,136.7 52,082.8 67,380.8 95,702.7 134,256.5 208,955.8 48,500.2 74,073.5 39,696.6 44,247.7
Africa 4,508.8 4,512.4 5,584.6 7,008.9 7,617.4 4,394.8 1,520.8 1,071.4 1,579.0 2,016.3Algeria 50.0 150.0 40.0 271.7 412.7 — — — — — Angola 455.0 350.0 1,522.0 2,900.0 3,122.7 88.0 12.1 — 74.6 — Botswana 22.5 — — — — — — — — — Burkina Faso — — — — 11.0 — — — 14.5 — Cameroon 53.8 — 100.0 — — — — — — — Chad 300.0 — — — — — — — — — Côte d’Ivoire 15.0 — — — — — — — — — Djibouti — — — 40.0 — — — — — — Ethiopia — — — 40.0 — — — — — — Gabon — — — 22.0 — 34.3 — — — — Ghana 291.0 420.0 650.0 870.0 662.5 860.0 810.0 — — 150.0 Guinea — — — 70.0 — — — — — — Kenya 80.2 — 134.0 — 23.5 40.6 — 23.8 — — Malawi — — — 4.8 — — — — — — Mali — 150.4 287.6 288.9 — — — — 149.9 — Mauritius — — — — — 180.0 80.0 — — — Morocco 129.3 — 9.8 — — 14.2 2.7 — — — Mozambique 160.0 — 35.5 — — — — — — — Namibia — — 35.0 — 50.0 100.0 50.0 50.0 — — Niger — — 27.0 — — — — — — — Nigeria 95.0 960.0 488.0 225.0 618.8 580.0 100.0 480.0 450.0 327.3 Senegal — 40.0 — — — — — — — — Seychelles — 150.0 — 80.0 — — — — — — South Africa 2,786.0 2,201.5 2,097.5 1,816.6 2,625.0 1,506.5 466.0 — 890.0 1,389.0 Tunisia 71.0 90.5 128.2 379.9 91.2 473.5 — — — 150.0 Uganda — — — — — 12.6 — 12.6 — — Zambia — — 30.0 — — 505.0 — 505.0 — —
Asia 17,603.3 15,237.7 24,610.2 28,818.9 34,599.1 63,319.8 14,402.3 29,436.0 12,700.8 15,952.4Bangladesh — — — 176.8 — 32.6 — — — — Brunei Darussalam — 129.0 — — — — — — — — China 343.0 1,441.2 4,388.1 3,555.3 4,956.3 6,855.4 2,716.8 538.5 2,276.2 3,232.0 Hong Kong SAR 4,718.1 1,788.0 2,570.6 4,077.2 3,436.3 4,417.2 1,583.4 1,019.4 477.0 155.5 India 1,499.0 942.2 2,025.9 4,491.2 7,873.4 18,017.4 2,649.1 11,713.6 1,640.0 6,099.1 Indonesia 487.6 62.0 3,492.5 1,737.4 754.0 6,348.5 191.5 5,585.5 608.0 457.4 Korea 5,225.1 5,284.2 4,141.3 3,163.4 7,743.8 10,168.9 2,010.4 3,500.2 2,549.6 1,778.5 Lao P.D.R. — — — 210.0 500.0 — — — — — Macao SAR — — — 357.0 — 1,980.0 1,180.0 — 1,600.0 — Malaysia 2,046.7 1,973.6 3,789.4 3,999.2 2,509.7 4,236.7 717.5 1,762.9 780.6 1,390.0 Marshall Islands — 34.7 — — 24.0 170.0 — — 804.2 — Mongolia — — — — 30.0 6.0 6.0 — — — Pakistan 182.5 85.0 — 300.0 591.8 1,279.3 20.0 1,039.5 — 157.0 Philippines 1,421.4 611.1 1,277.7 1,333.4 1,245.8 810.2 44.2 766.0 490.4 150.0 Singapore 1,010.6 1,338.8 1,154.1 1,606.1 1,839.2 6,512.4 3,017.5 2,405.3 722.4 1,885.1 Sri Lanka 105.0 — 186.0 35.0 311.5 129.7 20.0 100.0 — 210.0 Taiwan Province of China 383.7 338.7 549.8 2,376.6 720.8 452.2 69.5 60.0 437.0 214.9 Thailand 180.5 825.7 983.7 1,286.2 1,798.6 1,445.9 103.0 610.9 — 100.0 Vietnam — 383.5 51.0 114.0 264.0 457.4 73.2 334.2 315.5 123.0
Europe 10,486.7 12,916.3 20,477.2 30,261.1 37,244.8 62,100.3 16,686.7 18,406.0 9,406.9 12,539.4Armenia — — — — — — — — — 19.1 Azerbaijan 16.0 — — 1,005.0 383.7 916.0 1.0 130.0 — 164.0 Belarus — — 24.0 — 32.0 336.0 123.8 119.3 27.0 35.0 Bulgaria 7.0 13.0 260.4 808.1 188.2 1,366.1 588.8 726.8 49.2 435.3 Croatia 768.0 536.6 960.8 545.9 637.2 664.8 283.8 380.9 — — Cyprus 152.5 68.1 — — — 965.7 792.8 87.9 28.0 — Czech Republic 434.4 25.0 356.5 191.1 549.9 252.8 23.7 124.1 219.7 — Estonia 136.6 — 133.9 222.9 — 449.4 — — — —

163
EMERGING MARKETS
Table 17 (concluded)2006 2007
2001 2002 2003 2004 2005 2006 Q3 Q4 Q1 Q2Faroe Islands — — — — 85.3 206.2 — 206.2 206.1 — Georgia — — 6.0 — — 7.0 7.0 — — — Gibraltar — — — — — 1,934.2 — — — — Hungary 99.4 969.7 1,409.7 1,498.8 1,347.3 148.6 60.1 — — 455.1 Kazakhstan 323.5 534.5 1,375.0 1,868.2 2,607.9 5,340.4 304.0 4,334.0 16.9 1,599.5 Kyrgyz Republic — 95.0 — — — — — — — — Latvia 31.3 51.9 70.7 353.2 265.8 1,187.5 656.5 246.8 111.7 897.0 Lithuania 24.9 18.8 — 72.5 390.2 50.4 — 50.4 — 40.2 Macedonia, FYR — — — 17.4 — — — — — — Malta 85.0 — 114.7 392.7 — 256.0 196.0 — — — Moldova — — — — 1.0 — — — — — Poland 1,979.3 3,016.0 2,727.4 541.4 2,192.8 1,975.9 219.6 1,548.4 661.7 539.2 Romania 438.6 380.0 925.2 659.0 1,030.8 492.8 153.0 132.9 193.3 146.2 Russia 1,520.4 3,803.5 7,415.1 12,922.0 15,415.3 24,994.6 8,694.6 5,344.9 5,109.5 2,761.5 Serbia1 — 19.4 — — — — — — — — Slovak Republic — — 79.3 117.0 579.3 — — — — — Slovenia 337.2 279.0 394.8 1,364.5 1,724.8 1,828.5 — 488.1 1,134.4 431.4 Turkey 4,112.6 3,044.8 4,095.7 7,561.5 8,899.7 16,673.1 4,016.5 3,179.4 1,517.9 3,495.8 Ukraine 15.0 15.0 90.0 119.9 913.6 2,049.3 565.5 1,301.0 131.4 1,520.0 Uzbekistan 5.0 46.0 37.8 — — 4.9 — 4.9 — —
Middle East 4,874.7 6,978.8 6,231.2 11,530.0 35,730.6 53,797.9 9,372.3 18,027.7 5,311.4 12,645.9Bahrain 202.0 340.0 1,000.0 1,475.0 1,690.0 2,285.2 370.0 1,603.0 — 3,536.0 Egypt 1,000.0 670.0 155.0 997.7 1,466.8 3,065.4 200.0 87.5 941.5 — Iran, I.R. of 887.0 1,680.1 700.0 1,942.7 1,928.8 134.8 17.7 — — — Iraq — — — — 107.8 177.0 — — — — Israel 325.0 — — 370.0 1,923.8 1,096.8 339.1 475.0 — 168.0 Jordan — — — 54.4 — 60.0 — 60.0 — — Kuwait 770.0 — 165.0 782.5 4,283.0 4,226.7 468.5 200.0 75.0 1,790.5 Lebanon — — — — — 50.0 — 50.0 120.0 — Oman — 2,332.0 818.3 1,055.0 4,598.7 3,405.2 2,835.9 319.3 — 782.4 Qatar 895.0 1,536.7 880.8 1,377.7 8,168.5 7,253.1 692.5 3,295.4 — 650.0 Saudi Arabia 275.0 280.0 569.5 2,134.0 3,681.0 6,761.7 31.0 526.0 1,081.0 4,479.0 United Arab Emirates 520.7 140.0 1,942.6 1,341.0 7,882.3 25,282.0 4,417.6 11,411.5 3,093.9 1,240.0
Latin America 18,663.2 12,437.6 10,477.7 18,083.9 19,064.6 25,343.0 6,518.2 7,132.5 10,698.4 1,093.7Argentina 1,889.0 824.2 30.0 767.0 3,088.0 300.0 — — — 340.0 Bolivia 10.0 90.0 — 116.0 123.0 — — — — — Brazil 5,984.0 3,161.4 902.4 4,609.8 3,845.9 6,973.2 1,998.3 238.5 5,000.0 253.4 Chile 2,399.3 1,230.7 1,731.0 3,823.5 4,533.3 4,191.0 952.1 830.0 240.0 415.0 Colombia 631.7 1,096.0 146.3 83.0 348.8 1,775.0 — 1,580.0 — — Costa Rica 115.0 — — — 117.2 1.7 1.7 — — — Cuba — — — 69.8 1.9 — — — — — Dominican Republic 31.1 258.0 50.4 140.5 47.8 212.7 112.0 55.8 203.3 — Ecuador 910.0 10.0 — — 62.5 19.1 — 19.1 — — El Salvador 68.0 — 32.5 180.5 79.5 701.6 496.6 205.0 — — Guadeloupe — 17.4 — — — — — — — — Guatemala — 44.0 — 59.3 165.0 — — — 15.0 — Haiti — — — — — 126.5 — 70.0 — — Honduras — — — 169.0 4.6 — — — — — Jamaica 5.8 45.0 49.6 96.3 416.6 388.4 — — 650.0 — Mexico 4,466.3 4,280.0 7,342.2 7,323.0 6,019.3 8,100.3 1,561.9 3,644.2 3,704.4 30.0 Nicaragua — — — 22.0 — — — — — — Paraguay 70.0 — — — — — — — — — Peru 137.5 63.0 125.0 170.0 27.1 456.9 150.0 — — — St. Lucia — — 20.0 — — — — — — — Trinidad and Tobago 70.0 303.0 46.0 315.0 — 1,727.3 1,242.3 156.0 — 55.4 Uruguay 41.3 — — — — — — — 795.7 — Venezuela 1,834.3 1,015.0 2.5 139.1 184.0 369.3 3.2 334.0 90.0 —
Source: Data provided by the Bond, Equity and Loan database of the International Monetary Fund sourced from Dealogic.1 Data prior to 2006 refer to Serbia and Montenegro.

STATISTICAL APPENDIX
164
Table 18. Equity Valuation Measures: Dividend-Yield Ratios2006 2007
2001 2002 2003 2004 2005 2006 Q3 Q4 Q1 Q2Composite 2.81 2.27 2.28 2.29 2.28 2.14 2.53 2.14 2.14 1.93Asia 1.68 1.76 1.97 2.20 2.42 1.88 2.34 1.88 1.91 1.70Europe/Middle East/Africa 3.61 2.69 2.41 2.00 1.76 2.36 2.61 2.36 2.42 2.27Latin America 5.57 3.63 3.26 3.24 3.07 2.56 2.99 2.56 2.30 2.09Argentina 7.83 0.51 1.37 0.98 1.20 1.21 1.37 1.21 1.12 1.39Bahrain 7.19 5.24 2.27 1.19 1.77 4.16 4.01 4.16 2.82 2.41Brazil 6.61 4.36 4.23 4.24 3.98 3.38 3.86 3.38 3.13 2.75Chile 8.23 2.97 2.95 4.62 2.99 2.07 2.51 2.07 1.80 2.15China 1.35 1.43 2.31 1.82 2.56 1.29 2.07 1.29 1.16 1.07Colombia 5.22 4.70 5.89 5.44 1.38 1.96 2.00 1.96 2.03 2.04Czech Republic 10.48 1.82 5.04 4.19 1.42 3.71 4.03 3.71 3.55 2.78Egypt 7.72 10.30 4.94 1.45 1.54 2.29 2.20 2.29 2.16 2.38Hungary 1.63 1.65 0.91 1.73 2.05 1.83 2.00 1.83 2.54 2.41India 2.39 2.96 1.74 1.70 1.25 1.07 1.21 1.07 1.29 1.05Indonesia 2.68 3.14 3.42 3.35 2.74 2.18 2.26 2.18 2.21 2.30Israel 1.32 0.72 1.20 1.83 1.58 2.55 2.40 2.55 2.00 1.65Jordan 2.75 2.79 2.40 1.49 2.19 1.06 0.91 1.06 1.02 1.91Korea 1.77 1.61 2.08 2.25 1.70 1.49 1.57 1.49 1.81 1.53Kuwait — — — — — 2.97 3.48 2.97 2.94 2.46Malaysia 3.27 3.15 3.02 3.50 4.33 3.72 4.21 3.72 3.18 3.56Mexico 3.04 1.76 2.12 1.85 2.18 1.24 1.67 1.24 1.08 1.15Morocco 4.54 5.27 4.65 2.71 3.61 2.22 2.90 2.22 1.79 1.84Nigeria 5.27 5.41 4.11 3.70 3.14 2.29 2.67 2.29 1.73 1.68Oman 9.21 3.04 5.38 3.32 2.15 4.64 5.33 4.64 5.76 4.22Pakistan 12.50 9.20 7.47 6.98 2.50 3.96 3.76 3.96 3.39 2.64Peru 4.25 2.37 2.83 3.10 3.45 3.83 4.56 3.83 2.84 2.56Philippines 1.37 2.34 2.12 1.79 2.63 2.00 2.42 2.00 2.15 2.03Poland 2.56 1.42 1.43 1.20 2.48 3.36 4.33 3.36 2.99 3.99Qatar — — — — — 1.69 2.40 1.69 3.22 2.86Russia 1.04 2.43 1.78 1.21 1.07 1.83 2.16 1.83 1.90 1.50Saudi Arabia 3.94 3.94 2.58 2.05 1.25 2.65 1.86 2.65 2.88 2.98South Africa 5.08 3.61 3.96 3.09 3.09 2.77 3.37 2.77 2.80 2.75Sri Lanka 6.22 3.09 3.64 4.67 2.47 1.77 2.36 1.77 1.78 1.90Taiwan Province of China 1.14 1.21 1.47 2.67 3.39 3.06 3.72 3.06 3.11 2.85Thailand 2.56 2.21 1.64 2.24 3.05 4.51 4.63 4.51 3.51 3.55Turkey 1.06 0.73 1.15 2.97 1.81 2.19 2.47 2.19 2.10 2.43United Arab Emirates — — — — — 2.12 1.99 2.12 2.39 2.05Venezuela 10.75 8.39 9.86 12.28 6.27 5.71 7.31 5.71 0.00 0.00
Source: Standard & Poor’s Emerging Market Database.
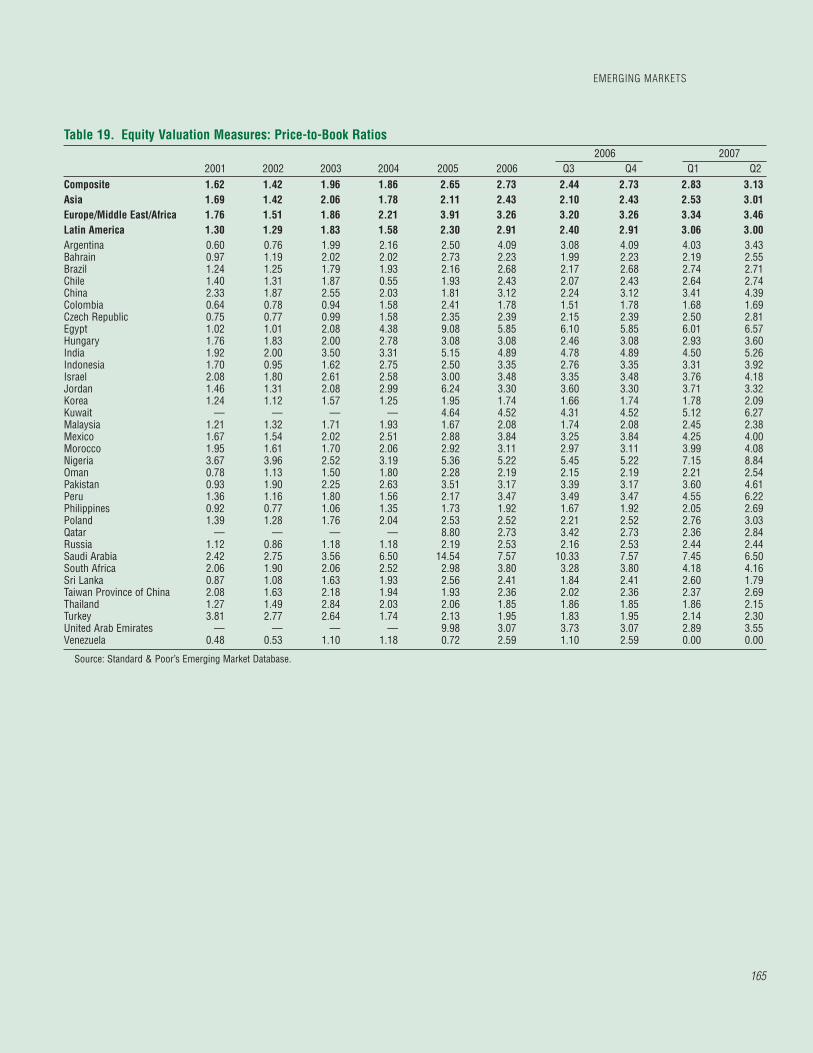
165
Table 19. Equity Valuation Measures: Price-to-Book Ratios2006 2007
2001 2002 2003 2004 2005 2006 Q3 Q4 Q1 Q2Composite 1.62 1.42 1.96 1.86 2.65 2.73 2.44 2.73 2.83 3.13Asia 1.69 1.42 2.06 1.78 2.11 2.43 2.10 2.43 2.53 3.01Europe/Middle East/Africa 1.76 1.51 1.86 2.21 3.91 3.26 3.20 3.26 3.34 3.46Latin America 1.30 1.29 1.83 1.58 2.30 2.91 2.40 2.91 3.06 3.00Argentina 0.60 0.76 1.99 2.16 2.50 4.09 3.08 4.09 4.03 3.43Bahrain 0.97 1.19 2.02 2.02 2.73 2.23 1.99 2.23 2.19 2.55Brazil 1.24 1.25 1.79 1.93 2.16 2.68 2.17 2.68 2.74 2.71Chile 1.40 1.31 1.87 0.55 1.93 2.43 2.07 2.43 2.64 2.74China 2.33 1.87 2.55 2.03 1.81 3.12 2.24 3.12 3.41 4.39Colombia 0.64 0.78 0.94 1.58 2.41 1.78 1.51 1.78 1.68 1.69Czech Republic 0.75 0.77 0.99 1.58 2.35 2.39 2.15 2.39 2.50 2.81Egypt 1.02 1.01 2.08 4.38 9.08 5.85 6.10 5.85 6.01 6.57Hungary 1.76 1.83 2.00 2.78 3.08 3.08 2.46 3.08 2.93 3.60India 1.92 2.00 3.50 3.31 5.15 4.89 4.78 4.89 4.50 5.26Indonesia 1.70 0.95 1.62 2.75 2.50 3.35 2.76 3.35 3.31 3.92Israel 2.08 1.80 2.61 2.58 3.00 3.48 3.35 3.48 3.76 4.18Jordan 1.46 1.31 2.08 2.99 6.24 3.30 3.60 3.30 3.71 3.32Korea 1.24 1.12 1.57 1.25 1.95 1.74 1.66 1.74 1.78 2.09Kuwait — — — — 4.64 4.52 4.31 4.52 5.12 6.27Malaysia 1.21 1.32 1.71 1.93 1.67 2.08 1.74 2.08 2.45 2.38Mexico 1.67 1.54 2.02 2.51 2.88 3.84 3.25 3.84 4.25 4.00Morocco 1.95 1.61 1.70 2.06 2.92 3.11 2.97 3.11 3.99 4.08Nigeria 3.67 3.96 2.52 3.19 5.36 5.22 5.45 5.22 7.15 8.84Oman 0.78 1.13 1.50 1.80 2.28 2.19 2.15 2.19 2.21 2.54Pakistan 0.93 1.90 2.25 2.63 3.51 3.17 3.39 3.17 3.60 4.61Peru 1.36 1.16 1.80 1.56 2.17 3.47 3.49 3.47 4.55 6.22Philippines 0.92 0.77 1.06 1.35 1.73 1.92 1.67 1.92 2.05 2.69Poland 1.39 1.28 1.76 2.04 2.53 2.52 2.21 2.52 2.76 3.03Qatar — — — — 8.80 2.73 3.42 2.73 2.36 2.84Russia 1.12 0.86 1.18 1.18 2.19 2.53 2.16 2.53 2.44 2.44Saudi Arabia 2.42 2.75 3.56 6.50 14.54 7.57 10.33 7.57 7.45 6.50South Africa 2.06 1.90 2.06 2.52 2.98 3.80 3.28 3.80 4.18 4.16Sri Lanka 0.87 1.08 1.63 1.93 2.56 2.41 1.84 2.41 2.60 1.79Taiwan Province of China 2.08 1.63 2.18 1.94 1.93 2.36 2.02 2.36 2.37 2.69Thailand 1.27 1.49 2.84 2.03 2.06 1.85 1.86 1.85 1.86 2.15Turkey 3.81 2.77 2.64 1.74 2.13 1.95 1.83 1.95 2.14 2.30United Arab Emirates — — — — 9.98 3.07 3.73 3.07 2.89 3.55Venezuela 0.48 0.53 1.10 1.18 0.72 2.59 1.10 2.59 0.00 0.00
Source: Standard & Poor’s Emerging Market Database.
EMERGING MARKETS
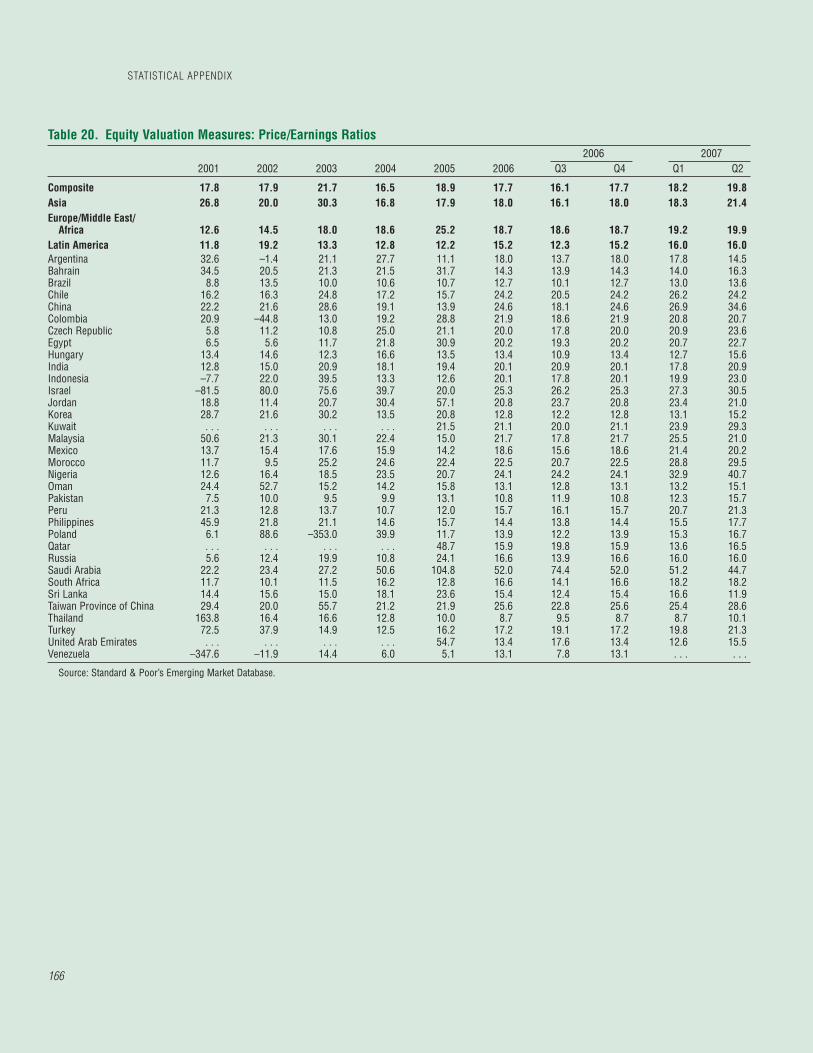
STATISTICAL APPENDIX
166
Table 20. Equity Valuation Measures: Price/Earnings Ratios2006 2007
2001 2002 2003 2004 2005 2006 Q3 Q4 Q1 Q2
Composite 17.8 17.9 21.7 16.5 18.9 17.7 16.1 17.7 18.2 19.8Asia 26.8 20.0 30.3 16.8 17.9 18.0 16.1 18.0 18.3 21.4Europe/Middle East/
Africa 12.6 14.5 18.0 18.6 25.2 18.7 18.6 18.7 19.2 19.9Latin America 11.8 19.2 13.3 12.8 12.2 15.2 12.3 15.2 16.0 16.0Argentina 32.6 –1.4 21.1 27.7 11.1 18.0 13.7 18.0 17.8 14.5Bahrain 34.5 20.5 21.3 21.5 31.7 14.3 13.9 14.3 14.0 16.3Brazil 8.8 13.5 10.0 10.6 10.7 12.7 10.1 12.7 13.0 13.6Chile 16.2 16.3 24.8 17.2 15.7 24.2 20.5 24.2 26.2 24.2China 22.2 21.6 28.6 19.1 13.9 24.6 18.1 24.6 26.9 34.6Colombia 20.9 –44.8 13.0 19.2 28.8 21.9 18.6 21.9 20.8 20.7Czech Republic 5.8 11.2 10.8 25.0 21.1 20.0 17.8 20.0 20.9 23.6Egypt 6.5 5.6 11.7 21.8 30.9 20.2 19.3 20.2 20.7 22.7Hungary 13.4 14.6 12.3 16.6 13.5 13.4 10.9 13.4 12.7 15.6India 12.8 15.0 20.9 18.1 19.4 20.1 20.9 20.1 17.8 20.9Indonesia –7.7 22.0 39.5 13.3 12.6 20.1 17.8 20.1 19.9 23.0Israel –81.5 80.0 75.6 39.7 20.0 25.3 26.2 25.3 27.3 30.5Jordan 18.8 11.4 20.7 30.4 57.1 20.8 23.7 20.8 23.4 21.0Korea 28.7 21.6 30.2 13.5 20.8 12.8 12.2 12.8 13.1 15.2Kuwait . . . . . . . . . . . . 21.5 21.1 20.0 21.1 23.9 29.3Malaysia 50.6 21.3 30.1 22.4 15.0 21.7 17.8 21.7 25.5 21.0Mexico 13.7 15.4 17.6 15.9 14.2 18.6 15.6 18.6 21.4 20.2Morocco 11.7 9.5 25.2 24.6 22.4 22.5 20.7 22.5 28.8 29.5Nigeria 12.6 16.4 18.5 23.5 20.7 24.1 24.2 24.1 32.9 40.7Oman 24.4 52.7 15.2 14.2 15.8 13.1 12.8 13.1 13.2 15.1Pakistan 7.5 10.0 9.5 9.9 13.1 10.8 11.9 10.8 12.3 15.7Peru 21.3 12.8 13.7 10.7 12.0 15.7 16.1 15.7 20.7 21.3Philippines 45.9 21.8 21.1 14.6 15.7 14.4 13.8 14.4 15.5 17.7Poland 6.1 88.6 –353.0 39.9 11.7 13.9 12.2 13.9 15.3 16.7Qatar . . . . . . . . . . . . 48.7 15.9 19.8 15.9 13.6 16.5Russia 5.6 12.4 19.9 10.8 24.1 16.6 13.9 16.6 16.0 16.0Saudi Arabia 22.2 23.4 27.2 50.6 104.8 52.0 74.4 52.0 51.2 44.7South Africa 11.7 10.1 11.5 16.2 12.8 16.6 14.1 16.6 18.2 18.2Sri Lanka 14.4 15.6 15.0 18.1 23.6 15.4 12.4 15.4 16.6 11.9Taiwan Province of China 29.4 20.0 55.7 21.2 21.9 25.6 22.8 25.6 25.4 28.6Thailand 163.8 16.4 16.6 12.8 10.0 8.7 9.5 8.7 8.7 10.1Turkey 72.5 37.9 14.9 12.5 16.2 17.2 19.1 17.2 19.8 21.3United Arab Emirates . . . . . . . . . . . . 54.7 13.4 17.6 13.4 12.6 15.5Venezuela –347.6 –11.9 14.4 6.0 5.1 13.1 7.8 13.1 . . . . . .
Source: Standard & Poor’s Emerging Market Database.

167
Table 21. Emerging Markets: Mutual Fund Flows(In millions of U.S. dollars)
2006 20072001 2002 2003 2004 2005 2006 Q1 Q2 Q3 Q4 Q1 Q2
Bonds –444 606 3,153 1,947 5,729 6,233 4,209 –1,240 32 3,232 2,534 2,003Equities –1,781 –1,512 8,500 2,784 21,706 22,441 23,257 –6,279 –1,813 7,276 –1,674 3,815
Global –67 –2,082 2,119 –5,348 3,148 4,209 8,056 –1,523 –2,702 377 –758 1,454Asia –768 817 5,148 5,609 6,952 16,790 9,193 980 252 6,366 1,159 –2,487Latin America –619 –312 376 338 4,020 3,319 3,004 –1,465 651 1,130 –239 5,174Europe/Middle East/Africa –327 65 857 2,185 7,587 –1,877 3,004 –4,272 –14 –596 –1,836 –326
Source: Emerging Portfolio Fund Research, Inc.
EMERGING MARKETS

STATISTICAL APPENDIX
168
Table 22. Bank Regulatory Capital to Risk-Weighted Assets(In percent)
2002 2003 2004 2005 2006 2007 LatestLatin AmericaArgentina . . . . . . . . . . . . . . . . . . . . .Bolivia 16.1 15.3 14.9 14.7 13.3 13.5 MarchBrazil 16.6 18.8 18.6 17.9 18.9 18.5 MarchChile 14.0 14.1 13.6 13.0 12.5 12.8 AprilColombia 12.6 13.1 13.8 13.2 12.2 12.9 MayCosta Rica1 15.8 16.5 18.1 15.9 15.3 15.3 MayDominican Republic 12.0 8.8 14.0 12.5 12.4 13.1 MarchEcuador 14.4 14.9 14.5 14.4 14.8 15.6 MayEl Salvador 12.2 12.8 13.4 13.5 13.6 . . . DecemberGuatemala 14.9 15.6 14.5 13.7 13.6 13.8 MarchMexico 15.7 14.4 14.1 14.5 16.3 16.1 MarchPanama 18.5 18.1 17.6 16.8 17.2 . . . DecemberParaguay 17.9 20.9 20.5 20.4 20.1 19.9 JanuaryPeru 12.5 13.3 14.0 12.0 12.5 12.5 MarchUruguay1,2 –20.1 18.1 21.7 22.7 16.9 19.1 MayVenezuela 20.5 25.1 19.2 15.5 14.3 13.7 April
Emerging EuropeAlbania . . . 28.5 21.6 18.6 18.1 . . . DecemberBelarus 24.2 26.0 25.2 26.7 24.4 . . . DecemberBosnia and Herzegovina 20.5 20.3 18.7 17.8 17.7 . . . DecemberBulgaria 25.2 22.0 16.1 15.2 14.5 . . . DecemberCroatia 17.4 16.5 16.0 15.2 13.6 15.9 MarchCzech Republic 14.3 14.5 12.6 11.9 11.4 11.8 MarchEstonia 15.3 14.5 13.4 11.7 13.2 13.7 MarchHungary 13.0 11.8 12.4 11.6 11.3 . . . DecemberIsrael 9.9 10.3 10.8 10.7 10.8 11.0 MarchLatvia 13.1 11.7 11.7 10.1 10.2 10.4 MarchLithuania3 14.8 13.3 12.4 10.3 10.8 . . . DecemberMacedonia, FYR 28.1 25.8 23.0 21.3 18.3 17.9 MarchMontenegro . . . . . . 31.3 27.8 21.3 18.5 MarchPoland 13.8 13.7 15.5 14.5 14.0 . . . JuneRomania4 25.0 20.0 18.8 20.2 17.8 . . . SeptemberRussia 19.1 19.1 17.0 16.0 14.9 16.2 AprilSerbia5 25.6 31.1 27.9 26.0 24.7 25.9 JuneSlovak Republic 21.3 22.4 18.7 14.8 13.0 . . . DecemberTurkey6 24.4 29.5 27.4 22.8 21.1 . . . DecemberUkraine 18.0 15.2 16.8 15.0 14.2 14.0 March
Western EuropeAustria7 13.3 14.5 12.4 11.8 12.8 . . . SeptemberBelgium 13.2 12.9 12.9 11.5 12.0 . . . JuneDenmark 13.5 13.9 13.4 13.2 13.8 . . . DecemberFinland8 11.7 18.7 19.1 17.2 15.0 . . . JuneFrance 11.5 11.9 11.5 11.4 . . . . . . DecemberGermany 12.7 13.4 13.2 12.2 . . . . . . DecemberGreece 10.5 12.0 12.8 13.2 12.3 . . . JuneIceland 12.2 12.3 12.8 12.8 15.1 . . . DecemberIreland9 14.4 15.0 14.6 13.6 . . . . . . DecemberItaly10 11.2 11.4 11.6 10.6 10.7 . . . DecemberLuxembourg 15.0 17.1 17.5 16.3 14.8 . . . DecemberMalta . . . . . . 21.4 20.4 22.0 . . . DecemberNetherlands 12.0 12.3 12.3 12.6 11.7 . . . SeptemberNorway 12.2 12.4 12.2 11.9 11.2 . . . DecemberPortugal11 9.8 10.0 10.4 11.3 10.9 . . . DecemberSpain 12.5 12.6 12.3 12.2 11.9 . . . DecemberSweden12 7.1 7.3 7.6 7.0 7.1 7.6 JulySwitzerland 12.6 12.4 12.6 12.4 13.4 . . . DecemberUnited Kingdom 13.1 13.0 12.7 12.8 12.9 . . . December

169
Table 22 (concluded)2002 2003 2004 2005 2006 2007 Latest
AsiaBangladesh 7.5 8.4 8.8 7.3 8.3 . . . DecemberChina . . . . . . . . . . . . . . . . . . . . .Hong Kong SAR 15.8 15.3 15.4 15.3 15.0 . . . DecemberIndia 12.0 12.7 12.9 12.8 12.4 . . . JuneIndonesia 20.1 22.3 19.4 19.3 21.3 22.1 MarchKorea 11.2 11.1 12.1 13.0 12.8 13.0 MarchMalaysia 13.2 13.8 14.3 13.7 13.5 13.1 JunePhilippines13 16.9 17.4 18.4 17.6 . . . . . . DecemberSingapore 16.9 17.9 16.2 15.8 15.4 14.9 MarchThailand 13.0 13.4 12.4 13.2 13.8 14.1 March
Middle East and Central AsiaArmenia 30.5 33.8 32.3 33.7 34.9 32.7 JuneEgypt 11.0 11.1 13.8 14.5 16.3 . . . DecemberGeorgia 21.9 20.3 18.8 17.5 20.6 18.5 MayJordan 16.6 15.9 17.8 17.6 21.4 . . . DecemberKazakhstan 17.2 16.9 15.9 15.1 14.9 14.8 FebruaryKuwait 19.7 18.4 17.3 21.3 22.0 . . . SeptemberLebanon 19.4 22.3 22.2 22.9 24.7 . . . DecemberMorocco 12.2 9.3 10.2 11.5 12.3 . . . DecemberOman 17.1 17.6 17.6 18.1 17.2 . . . JunePakistan 8.8 8.5 10.5 11.3 12.7 . . . SeptemberSaudi Arabia 21.3 19.4 17.8 17.8 21.9 21.8 MarchTunisia 9.8 9.3 11.6 12.4 11.8 . . . DecemberUnited Arab Emirates 19.0 18.6 16.9 17.4 16.6 . . . December
Sub-Saharan AfricaGabon 17.6 19.9 17.8 24.0 32.0 . . . DecemberGhana 13.4 9.3 13.7 16.2 15.8 . . . DecemberKenya 13.9 11.7 11.8 13.4 . . . . . . DecemberLesotho . . . . . . 22.0 22.0 25.0 . . . MarchMozambique 14.0 17.0 18.7 16.0 13.1 . . . JuneNamibia 14.1 14.8 15.4 14.6 14.8 . . . JuneNigeria 18.1 17.8 14.6 14.3 25.8 . . . DecemberRwanda 12.5 14.6 18.3 14.7 . . . . . . DecemberSenegal 15.5 11.7 11.5 10.8 14.1 . . . AugustSierra Leone 32.5 27.3 25.1 26.4 . . . . . . DecemberSouth Africa 12.6 12.4 14.0 12.7 12.3 12.7 MarchSwaziland . . . 14.0 14.0 15.0 19.0 . . . SeptemberUganda 20.7 16.9 20.5 18.3 18.3 . . . June
OtherAustralia 9.6 10.0 10.4 10.4 10.4 10.4 MarchCanada 12.4 13.4 13.3 12.9 12.5 12.4 MarchJapan14 9.4 11.1 11.6 12.2 13.1 . . . MarchUnited States 13.0 13.0 13.2 12.9 13.0 13.0 March
Sources: National authorities; and IMF staff estimates.Note: Due to differences in national accounting, taxation, and supervisory regimes, FSI data are not strictly comparable across countries.1Banking sector excludes offshore banks in Costa Rica, and the state mortgage bank in Uruguay.2In 2006, the Uruguay Central Bank changed the methodology for calculating the regulatory capital ratio, changing the weights and adding a
factor to the denominator to account for market risk. Regulatory capital ratios are smaller in 2006 and 2007, compared to previous years, due to this calculation.
3Without foreign bank branches.4Statistical break starting in 2003.5Data prior to 2006 refer to Serbia and Montenegro.6Statistical break starting in 2002.7Starting in 2004 data reported on a consolidated basis. 8Statistical break starting in 2003.9All banks.10Consolidated reports for banking groups and individual reports for banks not belonging to groups.11For 2005 and 2006, the figures are for the sample of institutions that are already complying with IAS, accounting as of December 2004 for
about 87 percent of the usual aggregate considered. 12Tier 1 ratio; not comparable with the other indicators in the table. Data for the four large banking groups.13On a consolidated basis.14For the end of the fiscal year, i.e., March of the following calendar year; for major banks.
FINANCIAL SOUNDNESS INDICATORS
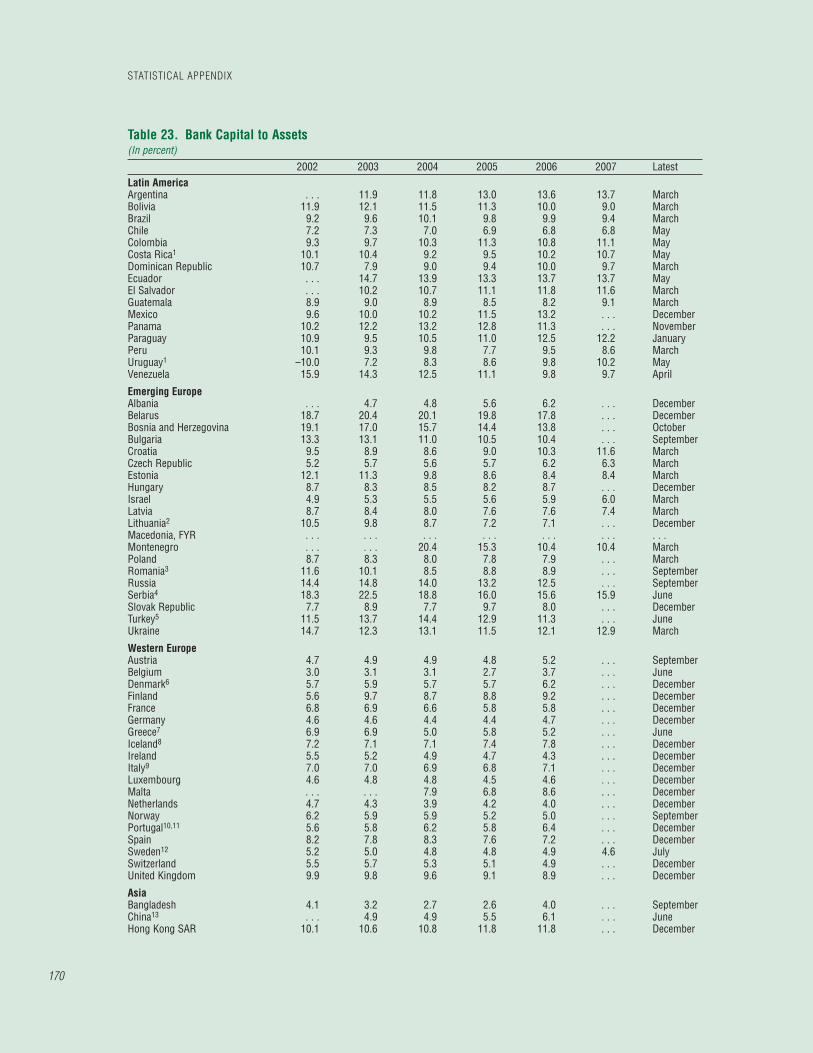
STATISTICAL APPENDIX
170
Table 23. Bank Capital to Assets(In percent)
2002 2003 2004 2005 2006 2007 LatestLatin America Argentina . . . 11.9 11.8 13.0 13.6 13.7 MarchBolivia 11.9 12.1 11.5 11.3 10.0 9.0 MarchBrazil 9.2 9.6 10.1 9.8 9.9 9.4 MarchChile 7.2 7.3 7.0 6.9 6.8 6.8 MayColombia 9.3 9.7 10.3 11.3 10.8 11.1 MayCosta Rica1 10.1 10.4 9.2 9.5 10.2 10.7 MayDominican Republic 10.7 7.9 9.0 9.4 10.0 9.7 MarchEcuador . . . 14.7 13.9 13.3 13.7 13.7 MayEl Salvador . . . 10.2 10.7 11.1 11.8 11.6 MarchGuatemala 8.9 9.0 8.9 8.5 8.2 9.1 MarchMexico 9.6 10.0 10.2 11.5 13.2 . . . DecemberPanama 10.2 12.2 13.2 12.8 11.3 . . . NovemberParaguay 10.9 9.5 10.5 11.0 12.5 12.2 JanuaryPeru 10.1 9.3 9.8 7.7 9.5 8.6 MarchUruguay1 –10.0 7.2 8.3 8.6 9.8 10.2 MayVenezuela 15.9 14.3 12.5 11.1 9.8 9.7 April
Emerging Europe Albania . . . 4.7 4.8 5.6 6.2 . . . DecemberBelarus 18.7 20.4 20.1 19.8 17.8 . . . DecemberBosnia and Herzegovina 19.1 17.0 15.7 14.4 13.8 . . . OctoberBulgaria 13.3 13.1 11.0 10.5 10.4 . . . SeptemberCroatia 9.5 8.9 8.6 9.0 10.3 11.6 MarchCzech Republic 5.2 5.7 5.6 5.7 6.2 6.3 MarchEstonia 12.1 11.3 9.8 8.6 8.4 8.4 MarchHungary 8.7 8.3 8.5 8.2 8.7 . . . DecemberIsrael 4.9 5.3 5.5 5.6 5.9 6.0 MarchLatvia 8.7 8.4 8.0 7.6 7.6 7.4 MarchLithuania2 10.5 9.8 8.7 7.2 7.1 . . . DecemberMacedonia, FYR . . . . . . . . . . . . . . . . . . . . .Montenegro . . . . . . 20.4 15.3 10.4 10.4 MarchPoland 8.7 8.3 8.0 7.8 7.9 . . . MarchRomania3 11.6 10.1 8.5 8.8 8.9 . . . SeptemberRussia 14.4 14.8 14.0 13.2 12.5 . . . SeptemberSerbia4 18.3 22.5 18.8 16.0 15.6 15.9 JuneSlovak Republic 7.7 8.9 7.7 9.7 8.0 . . . DecemberTurkey5 11.5 13.7 14.4 12.9 11.3 . . . JuneUkraine 14.7 12.3 13.1 11.5 12.1 12.9 March
Western Europe Austria 4.7 4.9 4.9 4.8 5.2 . . . SeptemberBelgium 3.0 3.1 3.1 2.7 3.7 . . . JuneDenmark6 5.7 5.9 5.7 5.7 6.2 . . . DecemberFinland 5.6 9.7 8.7 8.8 9.2 . . . DecemberFrance 6.8 6.9 6.6 5.8 5.8 . . . DecemberGermany 4.6 4.6 4.4 4.4 4.7 . . . DecemberGreece7 6.9 6.9 5.0 5.8 5.2 . . . JuneIceland8 7.2 7.1 7.1 7.4 7.8 . . . DecemberIreland 5.5 5.2 4.9 4.7 4.3 . . . DecemberItaly9 7.0 7.0 6.9 6.8 7.1 . . . DecemberLuxembourg 4.6 4.8 4.8 4.5 4.6 . . . DecemberMalta . . . . . . 7.9 6.8 8.6 . . . DecemberNetherlands 4.7 4.3 3.9 4.2 4.0 . . . DecemberNorway 6.2 5.9 5.9 5.2 5.0 . . . SeptemberPortugal10,11 5.6 5.8 6.2 5.8 6.4 . . . DecemberSpain 8.2 7.8 8.3 7.6 7.2 . . . DecemberSweden12 5.2 5.0 4.8 4.8 4.9 4.6 JulySwitzerland 5.5 5.7 5.3 5.1 4.9 . . . DecemberUnited Kingdom 9.9 9.8 9.6 9.1 8.9 . . . December
Asia Bangladesh 4.1 3.2 2.7 2.6 4.0 . . . SeptemberChina13 . . . 4.9 4.9 5.5 6.1 . . . JuneHong Kong SAR 10.1 10.6 10.8 11.8 11.8 . . . December
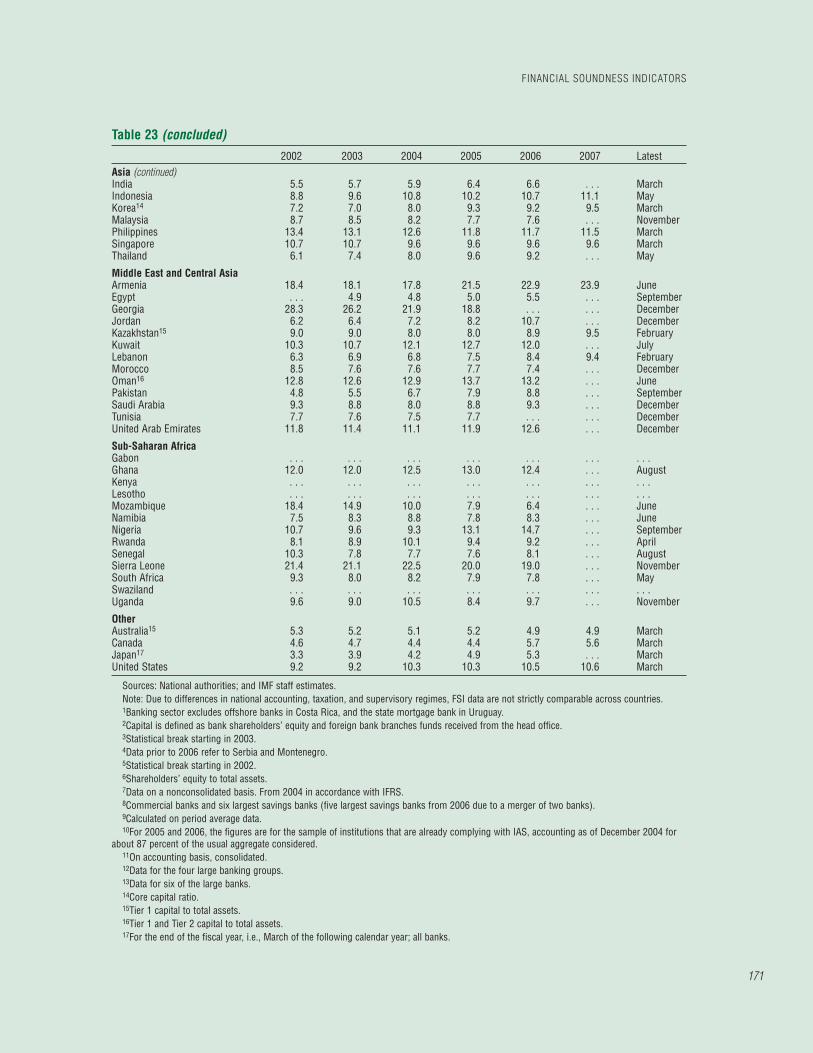
171
Table 23 (concluded)2002 2003 2004 2005 2006 2007 Latest
Asia (continued)India 5.5 5.7 5.9 6.4 6.6 . . . MarchIndonesia 8.8 9.6 10.8 10.2 10.7 11.1 MayKorea14 7.2 7.0 8.0 9.3 9.2 9.5 MarchMalaysia 8.7 8.5 8.2 7.7 7.6 . . . NovemberPhilippines 13.4 13.1 12.6 11.8 11.7 11.5 MarchSingapore 10.7 10.7 9.6 9.6 9.6 9.6 MarchThailand 6.1 7.4 8.0 9.6 9.2 . . . May
Middle East and Central Asia Armenia 18.4 18.1 17.8 21.5 22.9 23.9 JuneEgypt . . . 4.9 4.8 5.0 5.5 . . . SeptemberGeorgia 28.3 26.2 21.9 18.8 . . . . . . DecemberJordan 6.2 6.4 7.2 8.2 10.7 . . . DecemberKazakhstan15 9.0 9.0 8.0 8.0 8.9 9.5 FebruaryKuwait 10.3 10.7 12.1 12.7 12.0 . . . JulyLebanon 6.3 6.9 6.8 7.5 8.4 9.4 FebruaryMorocco 8.5 7.6 7.6 7.7 7.4 . . . DecemberOman16 12.8 12.6 12.9 13.7 13.2 . . . JunePakistan 4.8 5.5 6.7 7.9 8.8 . . . SeptemberSaudi Arabia 9.3 8.8 8.0 8.8 9.3 . . . DecemberTunisia 7.7 7.6 7.5 7.7 . . . . . . DecemberUnited Arab Emirates 11.8 11.4 11.1 11.9 12.6 . . . December
Sub-Saharan Africa Gabon . . . . . . . . . . . . . . . . . . . . .Ghana 12.0 12.0 12.5 13.0 12.4 . . . AugustKenya . . . . . . . . . . . . . . . . . . . . .Lesotho . . . . . . . . . . . . . . . . . . . . .Mozambique 18.4 14.9 10.0 7.9 6.4 . . . JuneNamibia 7.5 8.3 8.8 7.8 8.3 . . . JuneNigeria 10.7 9.6 9.3 13.1 14.7 . . . SeptemberRwanda 8.1 8.9 10.1 9.4 9.2 . . . AprilSenegal 10.3 7.8 7.7 7.6 8.1 . . . AugustSierra Leone 21.4 21.1 22.5 20.0 19.0 . . . NovemberSouth Africa 9.3 8.0 8.2 7.9 7.8 . . . MaySwaziland . . . . . . . . . . . . . . . . . . . . .Uganda 9.6 9.0 10.5 8.4 9.7 . . . November
OtherAustralia15 5.3 5.2 5.1 5.2 4.9 4.9 MarchCanada 4.6 4.7 4.4 4.4 5.7 5.6 MarchJapan17 3.3 3.9 4.2 4.9 5.3 . . . MarchUnited States 9.2 9.2 10.3 10.3 10.5 10.6 March
Sources: National authorities; and IMF staff estimates.Note: Due to differences in national accounting, taxation, and supervisory regimes, FSI data are not strictly comparable across countries.1Banking sector excludes offshore banks in Costa Rica, and the state mortgage bank in Uruguay.2Capital is defined as bank shareholders’ equity and foreign bank branches funds received from the head office.3Statistical break starting in 2003.4Data prior to 2006 refer to Serbia and Montenegro.5Statistical break starting in 2002.6Shareholders’ equity to total assets. 7Data on a nonconsolidated basis. From 2004 in accordance with IFRS.8Commercial banks and six largest savings banks (five largest savings banks from 2006 due to a merger of two banks). 9Calculated on period average data.10For 2005 and 2006, the figures are for the sample of institutions that are already complying with IAS, accounting as of December 2004 for
about 87 percent of the usual aggregate considered. 11On accounting basis, consolidated.12Data for the four large banking groups.13Data for six of the large banks.14Core capital ratio.15Tier 1 capital to total assets.16Tier 1 and Tier 2 capital to total assets.17For the end of the fiscal year, i.e., March of the following calendar year; all banks.
FINANCIAL SOUNDNESS INDICATORS

STATISTICAL APPENDIX
172
Table 24. Bank Nonperforming Loans to Total Loans(In percent)
2002 2003 2004 2005 2006 2007 LatestLatin America Argentina 18.1 17.7 10.7 5.2 3.4 3.2 MayBolivia 17.7 16.7 14.0 11.3 8.7 8.8 MarchBrazil 4.5 4.9 3.5 4.2 4.1 4.0 MarchChile 1.8 1.6 1.2 0.9 0.8 0.8 MayColombia 8.7 6.8 3.3 3.2 2.6 2.9 MayCosta Rica1 3.2 1.7 2.0 1.5 1.5 1.6 MayDominican Republic 4.9 9.0 7.4 5.9 4.5 5.0 MarchEcuador 8.4 7.9 6.4 4.9 3.3 3.6 MayEl Salvador 15.8 12.3 2.3 1.9 1.9 2.1 MarchGuatemala 7.9 6.5 7.1 4.2 4.6 5.6 MarchMexico 3.7 2.8 2.2 1.8 2.1 2.2 MarchPanama 3.5 2.5 1.8 1.8 1.5 1.4 MarchParaguay 19.7 20.6 10.8 6.6 3.3 3.4 JanuaryPeru 7.6 5.8 3.7 2.1 1.6 1.6 MarchUruguay1 33.9 14.3 4.7 3.6 1.9 2.1 MayVenezuela 9.2 7.7 2.8 1.2 1.1 1.1 AprilEmerging Europe Albania . . . 4.6 4.2 2.3 3.1 . . . DecemberBelarus 9.0 3.7 2.8 1.9 1.2 . . . DecemberBosnia and Herzegovina 11.0 8.4 6.1 5.3 4.0 . . . DecemberBulgaria 2.6 3.2 2.0 2.2 2.2 . . . DecemberCroatia 10.2 8.9 7.5 6.2 5.2 4.9 MarchCzech Republic 8.1 4.9 4.1 4.3 4.1 . . . SeptemberEstonia 0.8 0.4 0.3 0.2 0.2 0.2 MarchHungary 2.9 2.6 2.7 2.5 2.5 . . . DecemberIsrael 2.4 2.6 2.5 2.3 1.9 1.9 MarchLatvia 2.0 1.4 1.1 0.7 0.4 0.4 MarchLithuania2 5.3 2.4 2.2 0.6 1.0 . . . DecemberMacedonia, FYR3 23.1 22.1 17.0 15.0 11.2 10.3 MarchMontenegro . . . . . . 5.2 5.3 2.9 2.0 MarchPoland 21.1 21.2 14.9 11.0 9.4 . . . JuneRomania . . . 8.3 8.1 8.3 8.4 . . . SeptemberRussia 5.6 5.0 3.8 3.2 2.6 2.4 AprilSerbia4 21.6 24.1 22.8 23.2 21.4 . . . SeptemberSlovak Republic 7.9 3.7 2.6 5.0 3.7 3.2 DecemberTurkey5 12.7 8.9 5.0 3.9 3.2 . . . DecemberUkraine6 21.9 28.3 30.0 19.6 17.8 17.6 MarchWestern Europe Austria 3.0 3.0 2.7 2.6 . . . . . . DecemberBelgium 3.0 2.6 2.3 2.0 1.8 . . . JuneDenmark 0.9 0.8 0.7 0.4 . . . . . . DecemberFinland7 0.5 0.5 0.4 0.3 0.3 . . . JuneFrance8 4.2 4.0 3.7 3.3 3.2 . . . JuneGermany9 5.0 5.3 5.1 4.1 4.0 . . . JuneGreece 5.5 5.1 5.4 5.5 5.5 . . . JuneIceland10 2.6 2.1 0.9 . . . . . . . . . DecemberIreland 1.0 0.9 0.8 0.7 0.7 . . . DecemberItaly11,12 6.5 6.7 6.6 6.2 5.3 . . . DecemberLuxembourg 0.4 0.3 0.3 0.2 0.2 . . . JuneMalta . . . . . . 6.5 3.9 2.8 . . . DecemberNetherlands13 2.4 2.0 1.5 1.2 1.0 . . . JuneNorway 1.8 1.6 1.0 0.7 0.6 . . . SeptemberPortugal14,15 2.3 2.4 2.0 1.5 1.3 . . . DecemberSpain 1.1 1.0 0.8 0.8 0.6 . . . DecemberSweden16 1.2 1.0 0.8 0.6 0.5 0.4 JulySwitzerland 1.8 1.3 0.9 0.5 0.3 . . . DecemberUnited Kingdom 2.6 2.5 1.9 1.0 0.9 . . . DecemberAsia Bangladesh 28.1 22.1 17.6 13.6 13.2 . . . DecemberChina 26.0 20.4 12.8 9.8 7.5 7.0 MarchHong Kong SAR 5.0 3.9 2.3 1.4 1.1 1.0 MarchIndia 10.4 8.8 7.2 5.2 3.5 . . . JuneIndonesia17 24.0 19.4 14.2 14.8 13.1 13.5 MarchKorea18 2.4 2.6 1.9 1.2 0.8 0.8 MarchMalaysia 15.9 13.9 11.7 9.5 8.5 8.2 MarchPhilippines19 26.5 26.1 24.7 19.7 18.6 . . . June

173
Table 24 (concluded)2002 2003 2004 2005 2006 2007 Latest
Asia (continued)Singapore20 7.7 6.7 5.0 3.8 2.8 2.5 MarchThailand21 15.7 12.9 10.9 8.3 7.5 . . . December
Middle East and Central Asia Armenia 9.9 5.4 2.1 1.9 2.5 2.8 JuneEgypt 20.2 24.2 26.4 24.8 24.7 . . . DecemberGeorgia 7.9 7.5 6.2 3.8 2.5 2.3 MayJordan22 17.1 15.5 10.3 6.6 4.3 . . . DecemberKazakhstan . . . 8.4 5.7 5.3 4.8 6.3 FebruaryKuwait 7.8 6.1 5.3 5.0 3.9 . . . SeptemberLebanon 12.4 12.8 17.7 16.1 13.5 13.3 FebruaryMorocco 17.2 18.1 19.4 15.7 10.9 . . . DecemberOman 11.3 15.5 13.5 9.1 7.8 . . . JunePakistan 21.8 17.0 11.6 8.3 7.7 . . . SeptemberSaudi Arabia 8.8 5.4 2.8 1.9 2.0 . . . DecemberTunisia 21.4 24.2 23.6 20.9 19.2 . . . DecemberUnited Arab Emirates 15.3 14.3 12.5 8.3 6.3 . . . December
Sub-Saharan Africa Gabon 11.4 13.8 15.8 14.3 11.1 . . . DecemberGhana 22.7 18.3 16.1 13.0 7.9 . . . DecemberKenya 18.1 17.7 10.7 5.2 . . . . . . DecemberLesotho . . . . . . 1.0 2.0 1.0 . . . MarchMozambique 20.8 26.8 6.4 3.8 3.7 . . . JuneNamibia 3.5 3.9 2.4 2.3 2.9 . . . JuneNigeria 21.4 19.8 21.6 21.9 . . . . . . JuneRwanda 57.0 52.0 27.0 27.2 . . . . . . DecemberSenegal 18.5 13.3 12.6 11.9 16.0 . . . AugustSierra Leone 11.0 7.4 12.1 20.9 . . . . . . DecemberSouth Africa 2.8 2.4 1.8 1.5 1.2 1.1 MarchSwaziland . . . 2.0 3.0 2.0 2.0 . . . SeptemberUganda 3.0 7.2 2.2 2.3 2.8 . . . JuneOtherAustralia23 0.4 0.3 0.2 0.2 0.2 0.2 MarchCanada 1.6 1.2 0.7 0.5 0.4 . . . SeptemberJapan24 7.4 5.8 4.0 2.9 2.5 . . . MarchUnited States 1.4 1.1 0.8 0.7 0.8 0.8 March
Sources: National authorities; and IMF staff estimates.Note: Due to differences in national accounting, taxation, and supervisory regimes, FSI data are not strictly comparable across countries.1Banking sector excludes offshore banks in Costa Rica, and the state mortgage bank in Uruguay.2From end-2005 nonperforming loans are loans with payments overdue more than 60 days. Until 2004 they are defined as loans in
“substandard,” “doubtful,” and “loss” loan categories. 3Includes only loans to nonfinancial sector.4Data prior to 2006 refer to Serbia and Montenegro. The numbers represent share of assets in the three lowest risk categories (C,D,E).5Statistical break starting in 2002.6The increase in nonperforming loans in 2003 reflects a revision in the official definition.7Net of provisions. Loans are defined as the sum of claims on credit institutions, the public, and public sector entities. 8Gross doubtful debts.92006 figure is preliminary; for large banks and not strictly comparable with previous years.10Commercial banks and six largest savings banks (five largest savings banks from 2006 due to a merger of two banks). 11Banking groups. 12For the 2001–04 period, nonperforming loans include only substandard loans and bad debts. For the 2005–06 period, the aggregate
includes also loans overdue for more than 180 days.132006 data cover two of the large banks only; not strictly comparable with previous years.14For 2005 and 2006, the figures are for the sample of institutions that are already complying with IAS, accounting as of December 2004 for
about 87 percent of the usual aggregate considered. 15On a consolidated basis. Nonperforming loans are defined as credit to customers overdue. 16Data for the four large banking groups.17Compromised assets ratio; includes reported nonperforming loans, restructured loans and foreclosed assets for the 16 largest banks. Not
directly comparable to the other indicators in the table. Starting from 2005 the ratio is based on financial information for the 15 largest banks as of December 2005.
18Refers to loans classified “substandard” and below.19Nonperforming assets ratio; includes nonperforming loans plus real and other properties owned or acquired. Not directly comparable to the
other indicators in the table.20Nonperforming loans to nonbank loans.21All commercial banks (includes foreign branches).22Classified loans excluding interest in suspense.23Figures exclude loans in arrears that are covered by collateral.24For the end of the fiscal year, i.e., March of the following calendar year; for all banks.
FINANCIAL SOUNDNESS INDICATORS
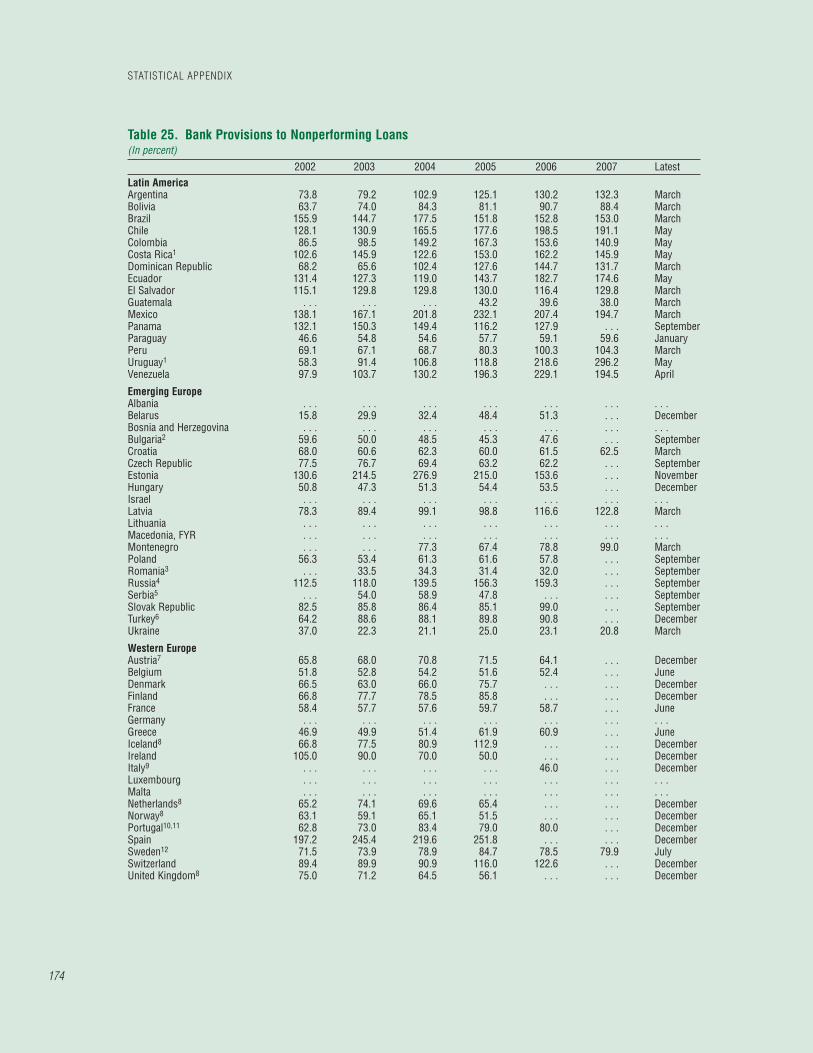
Table 25. Bank Provisions to Nonperforming Loans(In percent)
2002 2003 2004 2005 2006 2007 LatestLatin America Argentina 73.8 79.2 102.9 125.1 130.2 132.3 MarchBolivia 63.7 74.0 84.3 81.1 90.7 88.4 MarchBrazil 155.9 144.7 177.5 151.8 152.8 153.0 MarchChile 128.1 130.9 165.5 177.6 198.5 191.1 MayColombia 86.5 98.5 149.2 167.3 153.6 140.9 MayCosta Rica1 102.6 145.9 122.6 153.0 162.2 145.9 MayDominican Republic 68.2 65.6 102.4 127.6 144.7 131.7 MarchEcuador 131.4 127.3 119.0 143.7 182.7 174.6 MayEl Salvador 115.1 129.8 129.8 130.0 116.4 129.8 MarchGuatemala . . . . . . . . . 43.2 39.6 38.0 MarchMexico 138.1 167.1 201.8 232.1 207.4 194.7 MarchPanama 132.1 150.3 149.4 116.2 127.9 . . . SeptemberParaguay 46.6 54.8 54.6 57.7 59.1 59.6 JanuaryPeru 69.1 67.1 68.7 80.3 100.3 104.3 MarchUruguay1 58.3 91.4 106.8 118.8 218.6 296.2 MayVenezuela 97.9 103.7 130.2 196.3 229.1 194.5 April
Emerging Europe Albania . . . . . . . . . . . . . . . . . . . . .Belarus 15.8 29.9 32.4 48.4 51.3 . . . DecemberBosnia and Herzegovina . . . . . . . . . . . . . . . . . . . . .Bulgaria2 59.6 50.0 48.5 45.3 47.6 . . . SeptemberCroatia 68.0 60.6 62.3 60.0 61.5 62.5 MarchCzech Republic 77.5 76.7 69.4 63.2 62.2 . . . SeptemberEstonia 130.6 214.5 276.9 215.0 153.6 . . . NovemberHungary 50.8 47.3 51.3 54.4 53.5 . . . DecemberIsrael . . . . . . . . . . . . . . . . . . . . .Latvia 78.3 89.4 99.1 98.8 116.6 122.8 MarchLithuania . . . . . . . . . . . . . . . . . . . . .Macedonia, FYR . . . . . . . . . . . . . . . . . . . . .Montenegro . . . . . . 77.3 67.4 78.8 99.0 MarchPoland 56.3 53.4 61.3 61.6 57.8 . . . SeptemberRomania3 . . . 33.5 34.3 31.4 32.0 . . . SeptemberRussia4 112.5 118.0 139.5 156.3 159.3 . . . SeptemberSerbia5 . . . 54.0 58.9 47.8 . . . . . . SeptemberSlovak Republic 82.5 85.8 86.4 85.1 99.0 . . . SeptemberTurkey6 64.2 88.6 88.1 89.8 90.8 . . . DecemberUkraine 37.0 22.3 21.1 25.0 23.1 20.8 March
Western Europe Austria7 65.8 68.0 70.8 71.5 64.1 . . . DecemberBelgium 51.8 52.8 54.2 51.6 52.4 . . . JuneDenmark 66.5 63.0 66.0 75.7 . . . . . . DecemberFinland 66.8 77.7 78.5 85.8 . . . . . . DecemberFrance 58.4 57.7 57.6 59.7 58.7 . . . JuneGermany . . . . . . . . . . . . . . . . . . . . .Greece 46.9 49.9 51.4 61.9 60.9 . . . JuneIceland8 66.8 77.5 80.9 112.9 . . . . . . DecemberIreland 105.0 90.0 70.0 50.0 . . . . . . DecemberItaly9 . . . . . . . . . . . . 46.0 . . . DecemberLuxembourg . . . . . . . . . . . . . . . . . . . . .Malta . . . . . . . . . . . . . . . . . . . . .Netherlands8 65.2 74.1 69.6 65.4 . . . . . . DecemberNorway8 63.1 59.1 65.1 51.5 . . . . . . DecemberPortugal10,11 62.8 73.0 83.4 79.0 80.0 . . . DecemberSpain 197.2 245.4 219.6 251.8 . . . . . . DecemberSweden12 71.5 73.9 78.9 84.7 78.5 79.9 JulySwitzerland 89.4 89.9 90.9 116.0 122.6 . . . DecemberUnited Kingdom8 75.0 71.2 64.5 56.1 . . . . . . December
STATISTICAL APPENDIX
174
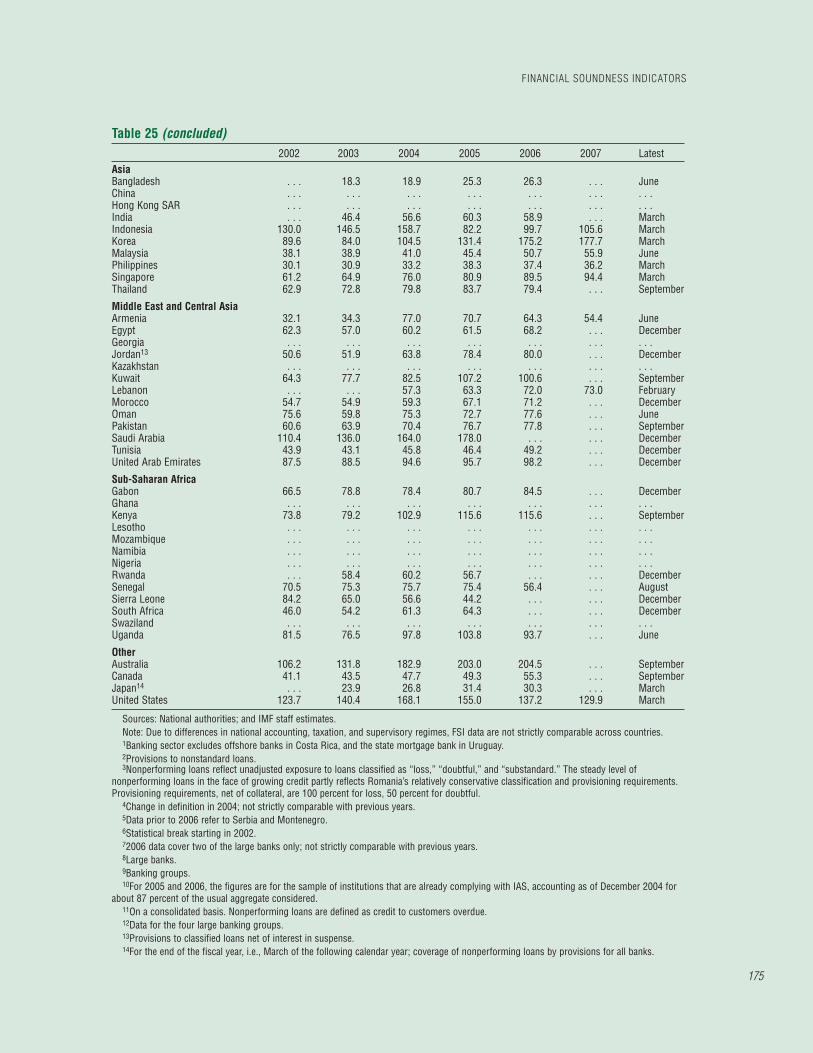
175
Table 25 (concluded)2002 2003 2004 2005 2006 2007 Latest
Asia Bangladesh . . . 18.3 18.9 25.3 26.3 . . . JuneChina . . . . . . . . . . . . . . . . . . . . .Hong Kong SAR . . . . . . . . . . . . . . . . . . . . .India . . . 46.4 56.6 60.3 58.9 . . . MarchIndonesia 130.0 146.5 158.7 82.2 99.7 105.6 MarchKorea 89.6 84.0 104.5 131.4 175.2 177.7 MarchMalaysia 38.1 38.9 41.0 45.4 50.7 55.9 JunePhilippines 30.1 30.9 33.2 38.3 37.4 36.2 MarchSingapore 61.2 64.9 76.0 80.9 89.5 94.4 MarchThailand 62.9 72.8 79.8 83.7 79.4 . . . September
Middle East and Central Asia Armenia 32.1 34.3 77.0 70.7 64.3 54.4 JuneEgypt 62.3 57.0 60.2 61.5 68.2 . . . DecemberGeorgia . . . . . . . . . . . . . . . . . . . . .Jordan13 50.6 51.9 63.8 78.4 80.0 . . . DecemberKazakhstan . . . . . . . . . . . . . . . . . . . . .Kuwait 64.3 77.7 82.5 107.2 100.6 . . . SeptemberLebanon . . . . . . 57.3 63.3 72.0 73.0 FebruaryMorocco 54.7 54.9 59.3 67.1 71.2 . . . DecemberOman 75.6 59.8 75.3 72.7 77.6 . . . JunePakistan 60.6 63.9 70.4 76.7 77.8 . . . SeptemberSaudi Arabia 110.4 136.0 164.0 178.0 . . . . . . DecemberTunisia 43.9 43.1 45.8 46.4 49.2 . . . DecemberUnited Arab Emirates 87.5 88.5 94.6 95.7 98.2 . . . December
Sub-Saharan Africa Gabon 66.5 78.8 78.4 80.7 84.5 . . . DecemberGhana . . . . . . . . . . . . . . . . . . . . .Kenya 73.8 79.2 102.9 115.6 115.6 . . . SeptemberLesotho . . . . . . . . . . . . . . . . . . . . .Mozambique . . . . . . . . . . . . . . . . . . . . .Namibia . . . . . . . . . . . . . . . . . . . . .Nigeria . . . . . . . . . . . . . . . . . . . . .Rwanda . . . 58.4 60.2 56.7 . . . . . . DecemberSenegal 70.5 75.3 75.7 75.4 56.4 . . . AugustSierra Leone 84.2 65.0 56.6 44.2 . . . . . . DecemberSouth Africa 46.0 54.2 61.3 64.3 . . . . . . DecemberSwaziland . . . . . . . . . . . . . . . . . . . . .Uganda 81.5 76.5 97.8 103.8 93.7 . . . June
OtherAustralia 106.2 131.8 182.9 203.0 204.5 . . . SeptemberCanada 41.1 43.5 47.7 49.3 55.3 . . . SeptemberJapan14 . . . 23.9 26.8 31.4 30.3 . . . MarchUnited States 123.7 140.4 168.1 155.0 137.2 129.9 March
Sources: National authorities; and IMF staff estimates.Note: Due to differences in national accounting, taxation, and supervisory regimes, FSI data are not strictly comparable across countries.1Banking sector excludes offshore banks in Costa Rica, and the state mortgage bank in Uruguay.2Provisions to nonstandard loans.3Nonperforming loans reflect unadjusted exposure to loans classified as “loss,” “doubtful,” and “substandard.” The steady level of
nonperforming loans in the face of growing credit partly reflects Romania’s relatively conservative classification and provisioning requirements. Provisioning requirements, net of collateral, are 100 percent for loss, 50 percent for doubtful.
4Change in definition in 2004; not strictly comparable with previous years.5Data prior to 2006 refer to Serbia and Montenegro.6Statistical break starting in 2002.72006 data cover two of the large banks only; not strictly comparable with previous years.8Large banks.9Banking groups. 10For 2005 and 2006, the figures are for the sample of institutions that are already complying with IAS, accounting as of December 2004 for
about 87 percent of the usual aggregate considered. 11On a consolidated basis. Nonperforming loans are defined as credit to customers overdue. 12Data for the four large banking groups.13Provisions to classified loans net of interest in suspense.14For the end of the fiscal year, i.e., March of the following calendar year; coverage of nonperforming loans by provisions for all banks.
FINANCIAL SOUNDNESS INDICATORS

STATISTICAL APPENDIX
176
Table 26. Bank Return on Assets(In percent)
2002 2003 2004 2005 2006 2007 LatestLatin America Argentina –8.9 –3.0 –0.5 0.9 2.0 2.1 MarchBolivia 0.1 0.3 –0.1 0.7 1.3 1.1 MarchBrazil1 2.1 1.5 1.9 2.5 2.5 2.1 MarchChile 1.1 1.3 1.2 1.3 1.3 1.2 MayColombia 1.1 1.9 2.8 2.8 3.0 2.2 MayCosta Rica1,2 1.8 2.1 2.0 2.5 2.5 2.6 MayDominican Republic 2.5 –0.1 1.9 1.8 1.9 2.5 MarchEcuador 1.5 1.4 1.5 1.6 2.0 2.6 MayEl Salvador 1.1 1.1 1.0 1.2 1.5 1.5 MarchGuatemala 0.8 1.1 1.3 1.6 1.2 1.5 MarchMexico1 0.7 1.6 1.8 2.7 3.1 3.2 MarchPanama1 0.5 2.1 2.3 2.1 1.7 1.8 MarchParaguay1 1.0 0.4 1.7 2.1 3.0 4.0 JanuaryPeru 0.8 1.1 1.2 2.2 2.2 2.4 MarchUruguay2 –25.3 –1.1 –0.1 0.7 1.2 1.7 MayVenezuela 5.3 6.2 5.9 3.7 3.0 2.4 April
Emerging Europe Albania . . . 1.2 1.3 1.4 1.4 . . . DecemberBelarus 1.0 1.5 1.5 1.3 1.7 . . . DecemberBosnia and Herzegovina –0.3 0.4 0.7 0.7 0.9 . . . DecemberBulgaria 2.1 2.4 2.1 2.1 2.2 . . . DecemberCroatia 1.6 1.6 1.7 1.6 1.5 1.6 MarchCzech Republic 1.2 1.2 1.3 1.4 1.2 1.3 MarchEstonia1 1.6 1.7 2.1 2.0 1.7 1.3 MarchHungary 1.4 1.5 2.0 2.0 1.9 . . . DecemberIsrael 0.3 0.7 1.0 1.1 1.0 1.2 MarchLatvia 1.5 1.4 1.7 2.1 2.1 2.1 MarchLithuania3 0.9 1.2 1.3 1.1 1.5 . . . DecemberMacedonia, FYR4 0.4 0.5 0.6 1.2 1.8 1.7 MarchMontenegro . . . . . . –0.3 0.8 1.1 1.5 MarchPoland 0.5 0.5 1.4 1.7 2.1 . . . JuneRomania5 2.7 2.7 2.5 1.9 1.7 . . . SeptemberRussia 2.6 2.6 2.9 3.2 3.2 0.8 AprilSerbia6 –8.4 –0.3 –1.2 1.1 1.7 2.1 JuneSlovak Republic 1.2 1.2 1.2 1.2 1.3 . . . DecemberTurkey7 1.2 2.4 2.3 1.6 2.4 . . . DecemberUkraine 1.2 1.0 1.1 1.3 1.6 1.6 March
Western Europe Austria8 0.2 0.3 0.6 0.6 0.7 . . . SeptemberBelgium9 0.5 0.5 0.6 0.7 1.1 . . . JuneDenmark 0.7 0.9 0.9 1.0 1.0 . . . DecemberFinland10 0.6 0.7 0.8 0.9 1.0 . . . DecemberFrance 0.5 0.4 0.5 0.6 . . . . . . DecemberGermany11 0.1 –0.1 0.1 0.3 0.5 . . . JuneGreece 0.5 0.6 0.3 0.9 1.2 . . . JuneIceland 1.1 1.3 1.8 2.3 2.6 . . . DecemberIreland 1.0 0.9 1.0 1.4 . . . . . . DecemberItaly 0.5 0.5 0.6 0.7 0.8 . . . DecemberLuxembourg 0.7 0.6 0.7 0.7 0.9 . . . DecemberMalta . . . . . . 1.3 1.4 1.1 . . . DecemberNetherlands 0.5 0.5 0.4 0.4 0.4 . . . SeptemberNorway 0.4 0.6 0.9 0.9 0.8 . . . DecemberPortugal12 0.7 0.8 0.8 0.8 1.0 . . . DecemberSpain 0.9 0.9 0.9 0.9 1.0 . . . DecemberSweden13 0.7 0.7 0.9 1.0 1.0 1.0 JulySwitzerland9 0.5 0.7 0.8 0.9 0.9 . . . DecemberUnited Kingdom1 0.4 0.6 0.7 0.8 0.5 . . . December

177
Table 26 (concluded)2002 2003 2004 2005 2006 2007 Latest
Asia Bangladesh 0.5 0.5 0.7 0.6 0.8 . . . DecemberChina14 . . . . . . 0.8 0.8 0.9 . . . DecemberHong Kong SAR15 2.1 1.9 1.7 1.7 1.8 1.8 MarchIndia 0.8 1.0 1.1 0.9 0.9 . . . JuneIndonesia1 1.4 2.6 3.5 2.6 2.6 2.7 MarchKorea 0.6 0.2 0.9 1.3 1.1 1.1 MarchMalaysia1 1.3 1.3 1.4 1.4 1.3 . . . SeptemberPhilippines 0.8 1.1 0.9 1.1 1.3 1.0 MarchSingapore 0.8 1.0 1.2 1.2 1.4 1.4 MarchThailand1 . . . . . . 1.7 1.9 2.3 . . . September
Middle East and Central Asia Armenia –6.4 2.7 3.2 3.1 3.6 3.6 JuneEgypt 0.5 0.5 0.6 0.5 0.9 . . . SeptemberGeorgia 4.3 3.9 1.9 3.0 2.5 . . . JuneJordan 0.6 0.7 1.1 2.0 1.7 . . . DecemberKazakhstan1 2.0 2.0 1.4 1.8 1.4 . . . DecemberKuwait 1.8 2.0 2.5 3.0 2.6 . . . SeptemberLebanon 0.6 0.7 0.7 0.7 0.9 0.9 FebruaryMorocco 0.3 –0.2 0.8 0.5 1.3 . . . DecemberOman 1.5 0.3 1.9 2.7 1.5 . . . JunePakistan1 0.9 1.8 1.9 2.8 3.1 . . . SeptemberSaudi Arabia 2.3 2.3 2.5 3.7 4.3 . . . DecemberTunisia 0.7 0.6 0.4 0.6 0.2 . . . JuneUnited Arab Emirates 2.2 2.3 2.1 2.7 2.3 . . . December
Sub-Saharan Africa Gabon 1.8 0.7 2.7 . . . . . . . . . DecemberGhana 6.8 6.2 5.8 4.6 4.3 . . . DecemberKenya1 –8.9 –2.9 –0.5 1.0 . . . . . . DecemberLesotho . . . . . . 3.0 2.0 1.0 . . . MarchMozambique 1.6 1.2 1.4 1.8 2.3 . . . JuneNamibia 4.5 3.6 2.1 3.5 2.9 . . . JuneNigeria 2.4 1.7 3.1 0.5 0.3 . . . DecemberRwanda –5.0 1.4 2.2 1.5 . . . . . . DecemberSenegal 1.8 1.8 1.8 . . . . . . . . . DecemberSierra Leone 10.0 10.5 9.7 7.9 . . . . . . DecemberSouth Africa 0.4 0.8 1.3 1.2 1.4 1.4 MarchSwaziland . . . 4.0 3.0 3.0 4.0 . . . SeptemberUganda 2.7 4.5 4.3 3.6 3.5 . . . June
Other Australia9 1.4 1.6 1.5 1.8 . . . . . . DecemberCanada 0.4 0.7 0.8 0.7 1.0 . . . OctoberJapan16 –0.7 –0.1 0.2 0.5 0.4 . . . MarchUnited States 1.3 1.4 1.3 1.3 1.3 1.2 March
Sources: National authorities; and IMF staff estimates.Note: Due to differences in national accounting, taxation, and supervisory regimes, FSI data are not strictly comparable across countries.1 Before tax.2 Banking sector excludes offshore banks in Costa Rica, and the state mortgage bank in Uruguay.3 Net income before extraordinary items and taxes to average total assets.4 Adjusted for unallocated provisions for potential loan losses.5 Statistical break starting in 2003.6 Data prior to 2006 refer to Serbia and Montenegro.7 Statistical break starting in 2002.8 Starting in 2004 data reported on a consolidated basis. 9 Gross profits.10 2001 adjusted for large intra-financial conglomerate transactions. 11 Simple average for large banks in 2006; not strictly comparable with previous years.12 For 2005 and 2006 the figures are for the sample of institutions that are already complying with IAS, accounting as of December 2004 for
about 87 percent of the usual aggregate considered. 13Data for the four large banking groups.14Simple average for the reformed state-owned commercial banks (two banks in 2004, three banks in 2005 and 2006). Aggregate data not
available.15Net interest margin, not comparable with the other indicators in the table.16For the end of the fiscal year, i.e., March of the following calendar year; all banks.
FINANCIAL SOUNDNESS INDICATORS

STATISTICAL APPENDIX
178
Table 27. Bank Return on Equity(In percent)
2002 2003 2004 2005 2006 2007 LatestLatin AmericaArgentina –59.2 –22.7 –3.8 7.2 15.0 15.7 MarchBolivia 0.7 2.8 –1.2 6.4 13.3 12.7 MarchBrazil1 22.1 16.3 19.3 25.2 25.2 21.6 MarchChile 14.4 16.7 16.7 17.9 18.6 17.4 MayColombia 9.6 16.9 23.2 22.5 25.9 19.4 MayCosta Rica1,2 17.1 19.5 20.7 25.0 24.4 24.3 MayDominican Republic 23.7 –1.2 22.1 19.3 19.7 26.2 MarchEcuador 15.4 14.7 16.5 18.5 23.1 24.7 MayEl Salvador 12.2 11.5 10.9 11.8 14.6 14.6 MarchGuatemala 8.5 12.2 14.0 19.1 15.1 17.1 MarchMexico1 7.9 16.1 17.2 24.4 26.2 23.5 MarchPanama . . . 16.9 16.7 15.7 18.5 . . . MarchParaguay1 9.0 4.5 18.3 22.6 31.7 33.7 JanuaryPeru 8.3 10.7 11.6 22.2 23.9 25.8 MarchUruguay2 –70.0 –15.3 –0.9 7.6 12.7 18.6 MayVenezuela 35.6 44.0 45.2 32.2 31.6 29.9 April
Emerging EuropeAlbania . . . 19.5 21.1 22.2 20.2 . . . DecemberBelarus 6.5 8.4 7.8 6.8 9.6 . . . DecemberBosnia and Herzegovina 2.5 3.4 5.8 6.2 8.5 . . . DecemberBulgaria 14.9 22.7 20.6 22.1 24.4 . . . DecemberCroatia 13.7 14.1 16.1 15.1 13.0 12.3 MarchCzech Republic 27.4 21.2 22.5 23.4 19.4 19.5 SeptemberEstonia 14.7 14.1 20.0 21.0 19.8 21.2 MarchHungary 16.2 19.3 25.3 24.7 24.3 . . . DecemberIsrael 6.1 14.1 17.9 19.4 17.6 19.7 MarchLatvia 16.4 16.7 21.4 27.1 26.3 28.5 MarchLithuania3 9.1 11.8 13.5 13.8 21.3 . . . DecemberMacedonia, FYR4 2.0 2.3 3.1 7.5 12.3 12.7 MarchMontenegro . . . . . . –1.4 5.3 6.8 12.5 MarchPoland 5.2 5.4 17.1 21.9 21.0 25.6 JuneRomania . . . 20.0 19.3 15.4 13.9 . . . SeptemberRussia 18.0 17.8 20.3 24.2 26.3 6.6 AprilSerbia5 –60.6 –1.2 –5.3 6.7 10.0 12.8 JuneSlovak Republic 11.5 10.8 11.9 16.9 16.6 . . . DecemberTurkey6 10.6 18.8 16.7 11.9 21.5 . . . DecemberUkraine 8.0 7.6 8.4 10.4 13.5 12.7 March
Western EuropeAustria7 5.2 7.0 14.8 14.8 13.6 . . . SeptemberBelgium8 17.1 17.1 21.1 23.8 17.7 . . . JuneDenmark 12.1 15.4 13.7 16.3 17.1 . . . DecemberFinland9 10.7 11.3 12.4 10.5 10.6 . . . JuneFrance 9.1 8.5 10.6 11.9 . . . . . . DecemberGermany 2.9 –1.5 1.9 9.0 . . . . . . DecemberGreece 6.8 8.9 5.6 16.2 21.7 . . . JuneIceland10 18.1 22.1 30.9 41.7 39.1 . . . DecemberIreland 18.0 17.8 20.7 21.8 . . . . . . DecemberItaly 7.1 7.4 9.3 9.7 11.5 . . . DecemberLuxembourg 36.4 34.9 39.8 37.8 55.6 . . . DecemberMalta . . . . . . 16.6 20.8 12.6 . . . DecemberNetherlands 10.9 14.0 16.0 16.0 15.9 . . . SeptemberNorway 6.2 9.6 14.6 18.0 15.7 . . . DecemberPortugal11 11.7 13.9 12.8 14.5 15.6 . . . DecemberSpain 12.1 13.2 14.1 16.9 19.9 . . . DecemberSweden12 10.0 12.3 14.6 17.4 18.6 18.2 JulySwitzerland8 8.9 11.7 14.3 18.0 17.7 . . . DecemberUnited Kingdom1 6.1 8.6 10.9 11.8 8.9 . . . December

179
Table 27 (concluded)2002 2003 2004 2005 2006 2007 Latest
AsiaBangladesh 11.6 9.8 13.0 12.4 14.1 . . . DecemberChina13 . . . . . . 13.7 15.1 14.8 . . . DecemberHong Kong SAR14 17.2 17.8 20.3 19.1 . . . . . . DecemberIndia 15.3 18.8 20.8 13.3 12.7 . . . MarchIndonesia15 . . . 25.3 37.1 32.3 33.2 35.5 MarchKorea 10.9 3.4 15.2 18.4 14.6 . . . DecemberMalaysia14 16.7 17.1 16.6 14.1 . . . . . . DecemberPhilippines 5.8 8.5 7.1 8.8 10.6 8.3 MarchSingapore 7.6 8.7 11.6 11.2 13.7 13.8 MarchThailand 4.2 10.5 16.8 14.2 15.1 . . . September
Middle East and Central AsiaArmenia –113.4 14.4 18.4 15.5 15.9 15.6 JuneEgypt 8.9 9.8 10.6 9.6 17.4 . . . SeptemberGeorgia 15.3 15.0 7.9 15.0 15.2 . . . JuneJordan 9.7 10.9 15.2 24.3 15.9 . . . DecemberKazakhstan1 13.8 14.2 11.2 14.1 10.9 . . . DecemberKuwait 17.4 18.6 20.9 22.9 21.6 . . . SeptemberLebanon 9.4 10.9 9.3 11.0 10.6 9.8 FebruaryMorocco 1.9 –2.1 10.9 6.3 17.4 . . . DecemberOman 11.0 1.7 12.9 16.6 . . . . . . JunePakistan1 21.1 35.4 30.5 38.2 38.2 . . . SeptemberSaudi Arabia 21.0 22.7 24.3 28.5 30.5 . . . DecemberTunisia 7.6 7.3 5.1 6.9 9.1 . . . JuneUnited Arab Emirates 15.6 16.4 18.6 22.5 18.0 . . . December
Sub-Saharan AfricaGabon 11.8 14.4 17.1 . . . . . . . . . DecemberGhana 36.9 32.7 33.7 23.6 24.2 . . . DecemberKenya –59.2 –22.7 –4.2 3.1 . . . . . . SeptemberLesotho . . . . . . 27.0 15.0 7.0 . . . MarchMozambique 22.1 16.3 18.7 27.4 32.8 . . . JuneNamibia 59.8 43.2 24.2 45.6 34.9 . . . JuneNigeria 28.1 19.8 27.4 7.2 1.9 . . . DecemberRwanda –125.3 31.1 21.6 16.5 . . . . . . DecemberSenegal 21.1 22.1 17.6 . . . . . . . . . DecemberSierra Leone . . . 67.1 73.2 52.5 . . . . . . DecemberSouth Africa 5.2 11.6 16.2 15.2 18.3 18.6 MarchSwaziland . . . 29.0 20.0 20.0 20.0 . . . SeptemberUganda 24.6 33.1 32.9 . . . . . . . . . December
OtherAustralia8 20.2 24.2 22.8 25.3 . . . . . . DecemberCanada 9.3 14.7 16.7 14.9 20.9 . . . OctoberJapan16 –19.5 –2.7 4.1 11.3 18.5 . . . MarchUnited States 14.1 15.0 13.2 12.7 12.3 11.4 March
Sources: National authorities; and IMF staff estimates.Note: Due to differences in national accounting, taxation, and supervisory regimes, FSI data are not strictly comparable across countries.1Before tax.2Banking sector excludes offshore banks in Costa Rica, and the state mortgage bank in Uruguay.3Capital is defined as bank shareholders’ equity and foreign bank branches funds received from the head office. Net income before
extraordinary items and taxes.4Adjusted for unallocated provisions for potential loan losses.5Data prior to 2006 refer to Serbia and Montenegro.6Statistical break starting in 2002.7Starting in 2004 data reported on a consolidated basis. 8Gross profits.92001 adjusted for large intra-financial conglomerate transactions. 10Commercial banks and six largest savings banks (five largest savings banks from 2006 due to a merger of two banks). 11For 2005 and 2006, the figures are for the sample of institutions that are already complying with IAS, accounting as of December 2004 for
about 87 percent of the usual aggregate considered. 12Data for the four large banking groups.13Simple average for the reformed state-owned commercial banks (two banks in 2004, three banks in 2005 and 2006). Aggregate data are not
available.142005 figure on a domestic consolidation basis; not strictly comparable with previous years.15Financial sector.16For the end of the fiscal year, i.e., March of the following calendar year; all banks.
FINANCIAL SOUNDNESS INDICATORS
Available by series subscription or single title (including back issues); academic rate available only to full-time university faculty and students. For earlier editions please inquire about prices.
The IMF Catalog of Publications is available on-line at the Internet address listed below.
Please send orders and inquiries to:International Monetary Fund, Publication Services, 700 19th Street, N.W.
Washington, D.C. 20431, U.S.A.Tel.: (202) 623-7430 Telefax: (202) 623-7201
E-mail: [email protected]: http://www.imf.org/external/pubind.htm
World Economic Outlook: A Survey by the Staff of the International Monetary FundThe World Economic Outlook, published twice a year in English, French, Spanish, and Arabic, presents IMF staff economists’ analyses of global economic developments during the near and medium term. Chapters give an overview of the world economy; consider issues affecting industrial countries, devel-oping countries, and economies in transition to the market; and address topics of pressing current interest.Annual subscription: $94.00Published twice yearly. Paperback.ISSN: 0256-6877. Stock# WEOSEAAvailable in English, French, Spanish, and Arabic.
Global Financial Stability Report: Market Developments and IssuesThe Global Financial Stability Report, published twice a year, examines trends and issues that infl uence world fi nancial markets. It focuses on current market conditions, highlight-ing issues of fi nancial imbalances, and of a structural nature, that could pose risks to fi nancial market stability and sus-tained market access by emerging market borrowers. The report is designed to deepen understanding of international capital fl ows, which play a critical role as an engine of world economic growth.Annual subscription: $94.00Published twice yearly. Paperback. Stock# GFSREA
Regional Economic OutlooksThese in-depth studies of the Asia and Pacifi c, Europe, Middle East and Central Asia, sub-Saharan Africa, and Western Hemi-sphere regions drill down to specifi c regional economic and fi nancial developments and trends—bringing the unique resources, experience, and perspective of the IMF to bear. While near-term responses to exogenous shocks, policies for growth, and the effectiveness of fi nancial policies get center-stage examination, the reports also consider vulnerabilities and opportunities developing in the wings.Individual copies of the Regional Economic Outlooks are available at $31.00 (academic rate: $26.00). Please visit www.imfbookstore.org/REOs or contact [email protected] for further information on all REO subscription packages.
Emerging Local Securities and Derivatives Marketsby Donald Mathieson, Jorge E. Roldos, Ramana Ramaswamy, and Anna Ilyina
The volatility of capital fl ows since the mid-1990s has sparked an interest in the development of local securities and deriva-tives markets. This report examines the growth of these mar-kets in emerging market countries and the key policy issues that have arisen as a result.$42.00 (academic rate: $35.00); paper.
2004. ISBN 1-58906-291-4. Stock# WEOEA0202004.
Offi cial Financing: Recent Developments andSelected Issuesby a staff team in the Policy Development and Review Department led by Martin G. Gilman and Jian-Ye WangThis study provides information on offi cial fi nancing for developing countries, with the focus on low-income coun-tries. It updates the 2001 edition and reviews developments in direct fi nancing by offi cial and multilateral sources.$42.00 (academic rate: $35.00); paper.2003. ISBN 1-58906-228-0. Stock# WEOEA0132003.2001. ISBN 1-58906-038-5. Stock# WEOEA0132001.
Exchange Arrangements and Foreign Exchange Markets: Developments and Issuesby a staff team led by Shogo IshiiThis study updates developments in exchange arrangements during 1998–2001. It also discusses the evolution of exchange rate regimes based on de facto policies since 1990, reviews for-eign exchange market organization and regulations in a num-ber of countries, and examines factors affecting exchange rate volatility.ISSN 0258-7440$42.00 (academic rate: $35.00)March 2003. ISBN 1-58906-177-2. Stock# WEOEA0192003.
World Economic and Financial SurveysThis series (ISSN 0258-7440) contains biannual, annual, and periodic studies covering monetary and fi nancial issues of importance to the global economy. The core elements of the series are the World Economic Outlook report, usually published in April and September, the semiannual Global Financial Stability Report, and the semiannual Regional Economic Outlooks published by the IMF’s area departments. Occasionally, studies assess international trade policy, private market and offi cial fi nancing for developing countries, exchange and payments systems, export credit policies, and issues discussed in the World Economic Outlook. Please consult the IMF Publications Catalog for a complete listing of currently available World Economic and Financial Surveys.

Global Financial Stability Report, October 2007
Global Financial Stability Report Global Financial Stability Report
Financial Market TurbulenceCauses, Consequences, and Policies
World Economic and Financia l Surveys
I N T E R N A T I O N A L M O N E T A R Y F U N D
07OC
T
IMF
OCT
07